Article

Forecasting and Providing Warnings of Flash Floods for Ungauged Mountainous Areas Based on a Distributed Hydrological Model

1
China Institute of Water Resources and Hydropower Research, Beijing 10038, China
2
College of Hydrology and Water Resources, Hohai University, Nanjing 210098, China
3
Research Center on Flood & Drought Disaster Reduction of the Ministry of Water Resources, Beijing 100038, China
4
State Key Laboratory of Simulation and Regulation of Water Cycle in River Basin, Beijing 100038, China
*
Author to whom correspondence should be addressed.
Water 2017, 9(10), 776; https://doi.org/10.3390/w9100776
Submission received: 18 August 2017 / Revised: 28 September 2017 / Accepted: 28 September 2017 / Published: 11 October 2017

Abstract

:
Flash floods occur in mountainous catchments with short response times, which are among the most devastating natural hazards in China. This paper intends to forecast and provide warnings of flash floods timely and precisely using the flash flood warning system, which is established by a new distributed hydrological model (the China flash flood hydrological model, CNFF-HM). Two ungauged mountainous regions, Shunchang and Zherong, are chosen as the study areas. The CNFF-HM is calibrated in five well-monitored catchments. The parameters for the ungauged regions are estimated by regionalization. River water stage data and reservoir water stage data from Shunchang, and reservoir water stage data from Zherong are used to validate the model. The model performs well and the average Nash–Sutcliffe efficiency (NSE) is above 0.8 for the five catchments. The validation shows the difference in the timing of flood peaks using the two types of water stage data is less than 1 h. The rising and declining trends of the floods correspond to the observed trends over the entire validation process. Furthermore, the flash flood warning system was effectively applied in flash flood event on 28 September 2016 in Zherong. Thus, the CNFF-HM with regionalization is effective in forecasting flash floods for ungauged mountainous regions.

1. Introduction

Forecasts and warnings of flash floods have attracted increasing interest from the scientific community, given that flash floods are more destructive and have different hydrological characteristics than floods that occur in large basins. Floods have resulted in 19,468 casualties in China since 2000, and 73%, or 14,268, of those casualties were caused by flash floods [1]. To date, most of those flash floods have occurred in ungauged mountainous areas. The lack of hydrological data results in great difficulties in forecasting and warnings of flash floods.
With the development of computer technology, many countries have established systems that employ hydrological models to provide forecasts and warnings of flash floods. The Flash Flood Guidance System (FFGS) has been employed in the US to provide alert messages using lumped or distributed hydrological models. FFGS can produce warnings without conducting the entire hydrometeorological forecasting process [2,3,4]. Because of the availability of global meteorological information and widespread digital land surface data, the Global Flash Flood Guidance System (GFFS) was implemented in Central America Flash Flood Guidance System (CAFFG), Southern Africa Flash Flood Guidance System (SAFFG), Mexico Flash Flood Guidance System (MMFFG), etc. The foundational approach in those systems is the concept of flash flood guidance (FFG) [5], the input of those systems is satellite precipitation, which may cause uncertainty in flash flood forecasting and warning. Alfieri et al. proposed a flash flood warning system, the European Flood Alert System for Flash Floods (EFAS-FF), using the LISFLOOD model and this system has been applied in southern Switzerland [6]. However, LISFLOOD was developed to forecast floods in large basins [7]. The use of this model to simulate flash floods, which usually occur in small catchments, could result in large uncertainties. A flash flood warning system called AIGA (Adaptation d’Information Géographique pour l’Alerte en Crue) is used in France [8,9]. In this system, flash floods are forecast using the GR5J (mode’ le du Ge’ nie Rural a’ 5 parame’ tres Journalier) model and the European Runoff Index based on simulated Climatology (ERIC) threshold. Recently, high-resolution precipitation forecast data were ingested in the AIGA, the lead time was significantly improved [10]. The Flooded Locations and Simulated Hydrographs (FLASH) Project, launched in 2012, provided a new tool for flash flood warning across the United States. The system was based on a distributed hydrological modeling system called Ensemble Framework for Flash Flood Forecasting (EF5) and implemented using Multi-Radar Multi-Sensor (MRMS) rainfall data. The model system includes the Sacramento Soil Moisture Accounting (SAC-SMA) model, the Coupled Routing and Excess Storage (CREST) model, and a “hydrophobic” model [11]. A flood modeling and forecasting system was built covering the continental U.S., which was near real-time, high spatial resolution flood data, and could forecast discharge of 2.7 million stream reaches simultaneously in only 10 min [12]. In China, a flash flood warning system based on a rainfall threshold has been applied. This threshold was estimated from digital spatial data and stream surveys using a hydrological model with prescribed initial soil moisture values.
Many studies have shown that distributed hydrological models have advantages over lumped models. Michaud et al. indicated that distributed hydrological models displayed better accuracy than spatially lumped models in simulating flash floods [13]. The work of Delrieu et al. showed the applicability of distributed models to the simulation of flash floods and achieved accurate simulations of runoff using two different distributed models in 18 small catchments [14]. Reed et al. showed that distributed hydrological models were more consistent with the processes involved in flash floods than lumped models [15]. Distributed hydrological models consider the heterogeneity of the underlying topography and the spatial distribution of rain when simulating rainfall and runoff. This feature has led to the increased application of distributed models in the simulation and forecasting of flash floods. A distributed hydrological model was proposed by Blöschl et al. for forecasting flash floods in the Kamp catchment in northern Austria, and it has been in operational use since 2006 [16]. Miao et al. applied a distributed geomorphology-based hydrological model (GBHM) to different climatic regions within China and produced accurate simulations of flash floods [17]. Nguyen et al. developed a high resolution coupled hydrologic-hydraulic model (HiResFlood-UCI, which was used to predict localized flood depths and velocities and applied in a watershed of Oklahoma, US) for flash flood modeling, which combined the HL-Hydrology Laboratory Research Distributed Hydrological Model (RDHM) with BreZo (Sanders and Begnudelli) in river scale. The model produces a reasonable result with a flood error of 0.82 mm or less [18]. In addition, the distributed GR5J model is employed in AIGA, which is widely utilized in France [10].
Most flash floods in China occur in ungauged mountainous regions. How to effectively employ distributed hydrological models in such regions remains an open question. Parameter estimation is the main barrier to forecasting flash floods using distributed hydrological models [19]. Regionalization has been used to solve this problem since 2001 [20,21]. Three regionalization approaches, namely physical similarity, spatial proximity, and regression, are typically used to choose gauged (donor) catchment. The calibrated parameters of the donor catchments are then transferred to the ungauged (receiver) catchments. The application of these methods in UK, Australia, and Indian, as well as other countries, has demonstrated that the former two approaches yield better results than the latter [22,23,24,25,26]. A combination of spatial proximity (distance) and physical similarity indices could therefore improve the accuracy of simulations [25]. For the stream flow prediction of ungauged catchments, the presence of well-gauged catchments in proximity is more beneficial than having physically similar catchments [24]. Norbiato et al. found that the model parameters, which transferred directly from gauged to ungauged catchments of the same river system had limitations when computed via FFG [27]. Thus, a more reliable regionalization method was needed. Razavi and Coulibaly demonstrated the benefits of catchment classification before regionalization in ungauged catchments for daily flow simulation based on two conceptual hydrological models [28]. A principal component analysis (PCA) was used for catchment classification before regionalization in 15 catchments of China, however, only 54% success rate yielded in the study of Ragettli et al. [29]. The use of traditional classification methods, such as classification according to the physical attributes, is a little more advantageous than using mathematical classification methods. All of the above-mentioned studies on regionalization were based on distinct hydrological models, and no universal regionalization methods for different model parameters in different regions were proposed. Furthermore, all existing studies that employ regionalization have applied cross validation to assess its effectiveness. However, the regionalization approach cannot be cross validated in the ungauged regions of China, due to the lack of discharge data.
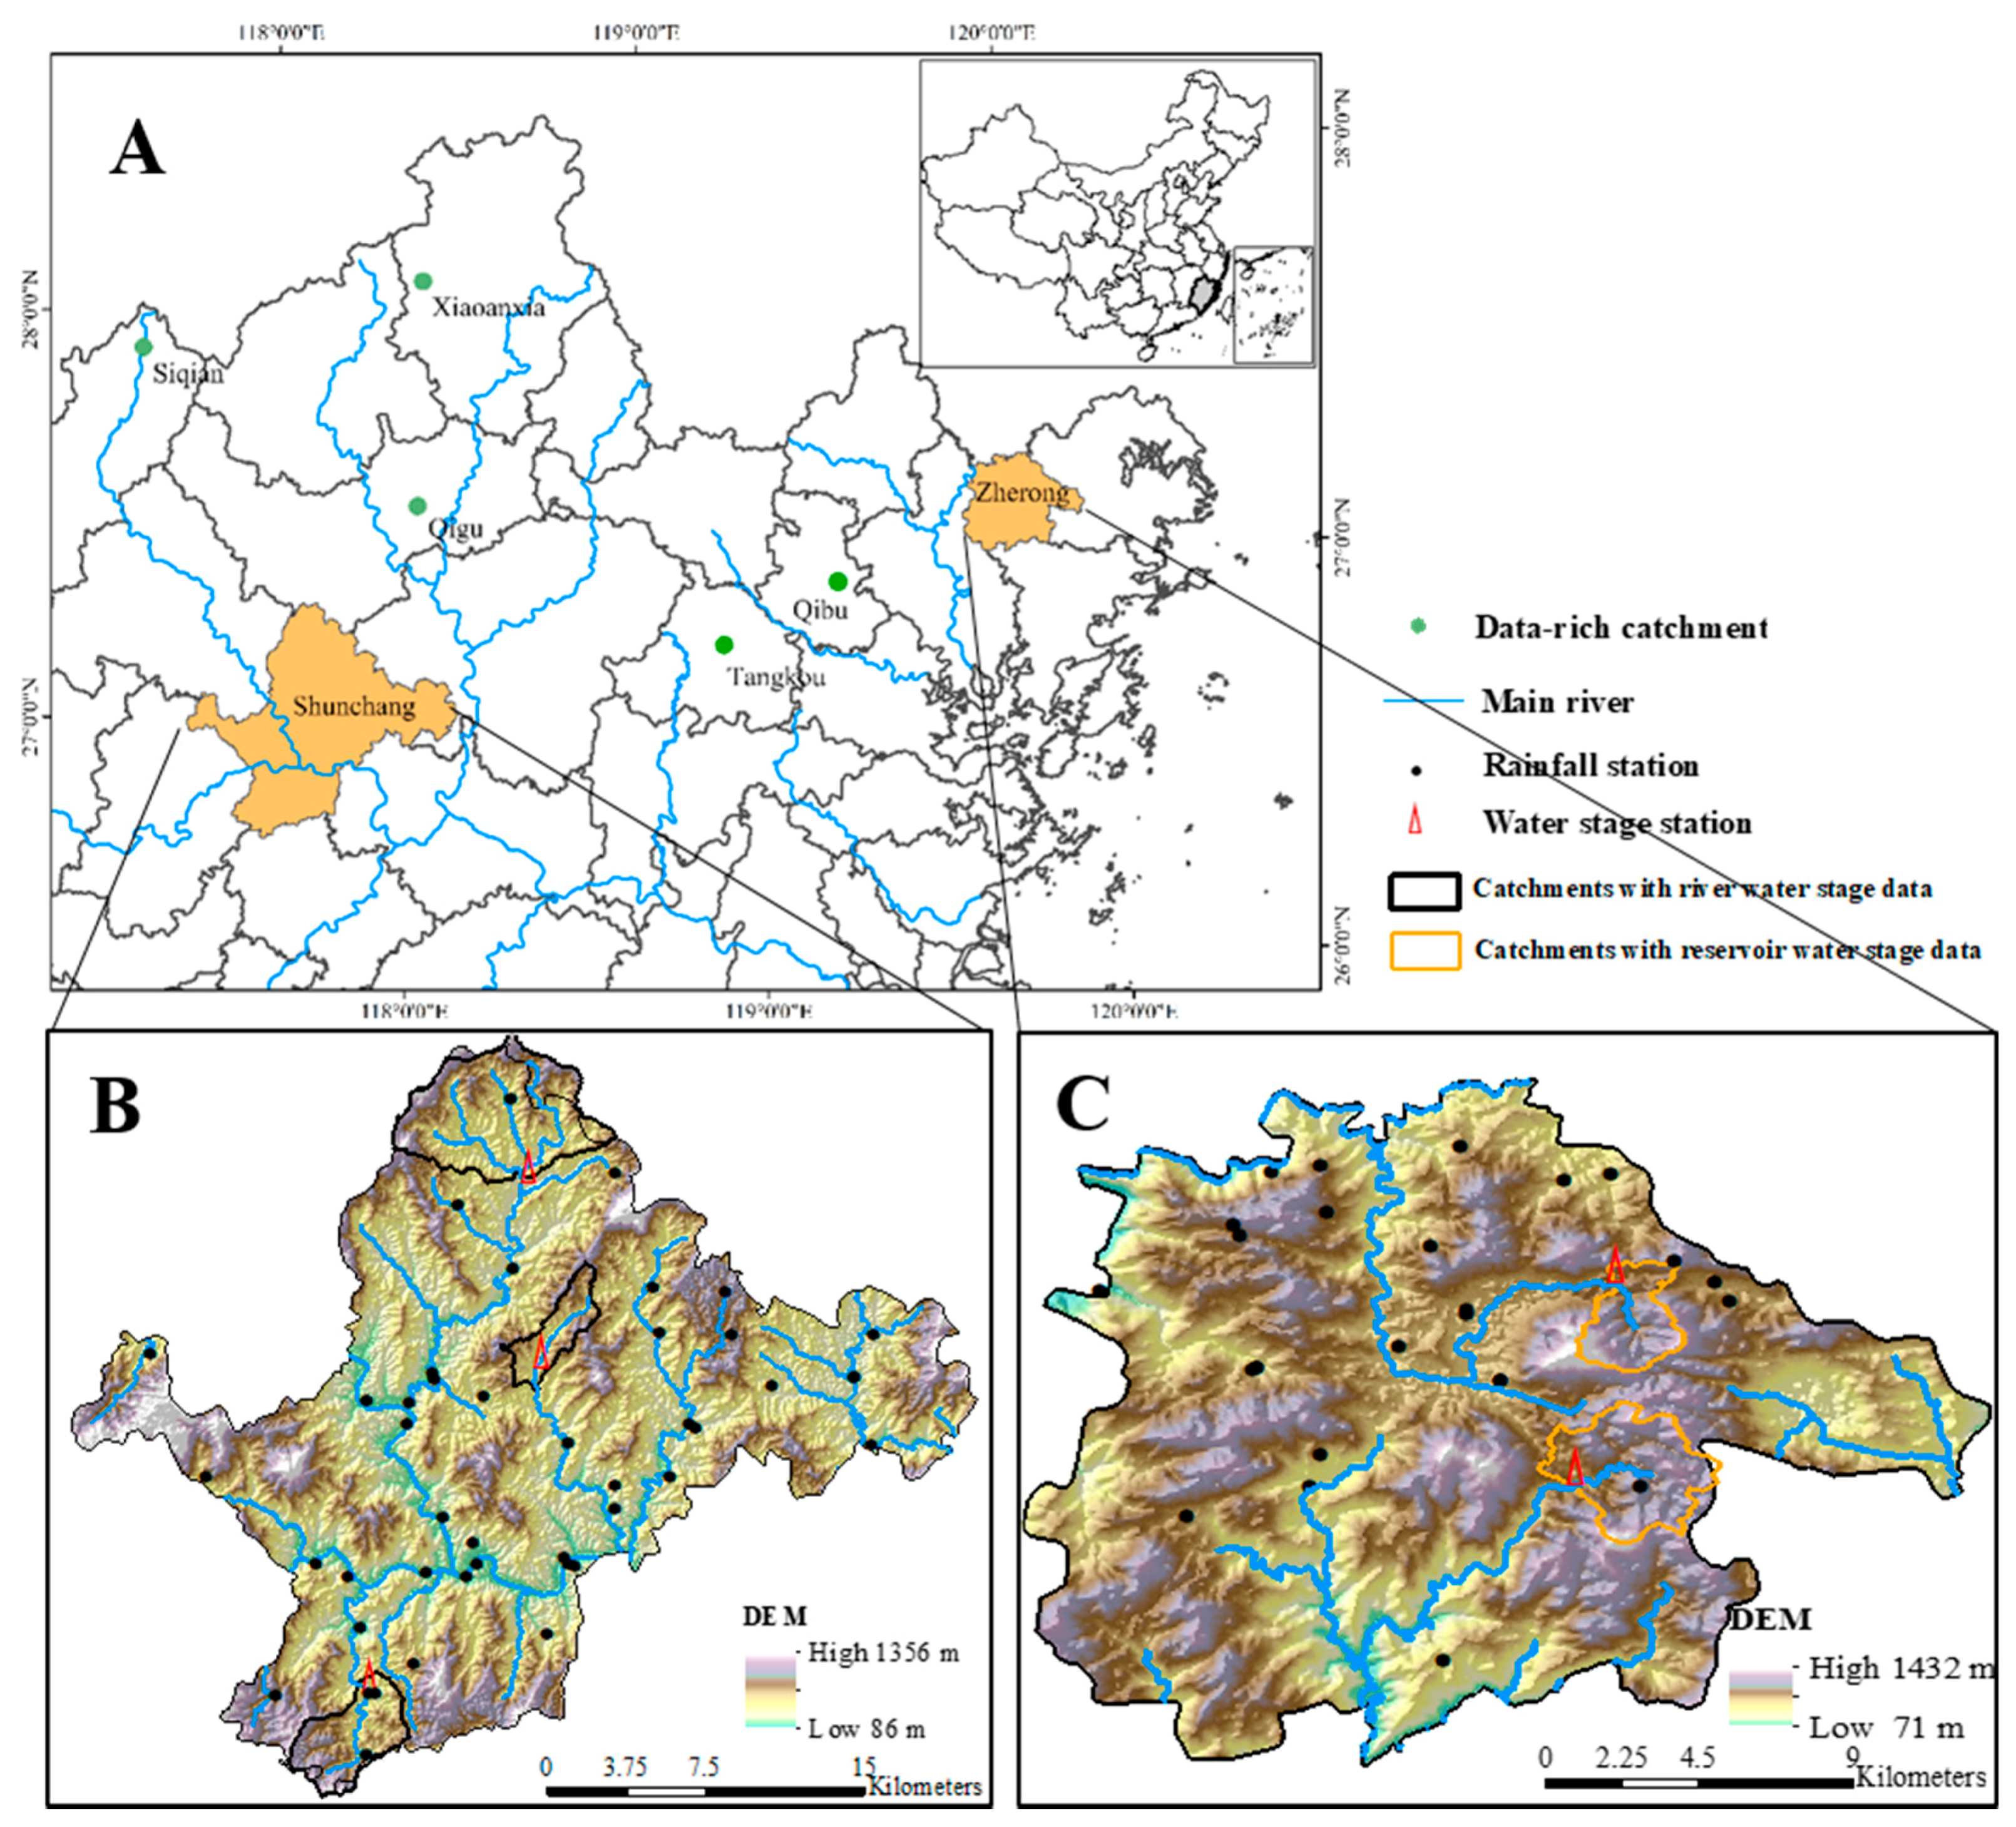
This study aims to develop an effective flash flood warning system using a distributed hydrological model to forecast and provide warnings of flash floods in ungauged mountainous regions. Three contents were explored in depth: (1) improving the accuracy of flash flood forecasts by the China flash flood hydrological model (CNFF-HM); (2) a regionalization approach for the flash flood forecasts in ungauged mountainous regions; and (3) hydrological model validation with water stage data for areas with limited data. Shunchang and Zherong in Fujian Province, China, were chosen as study areas. A distributed hydrological model, CNFF-HM, is applied. Regionalization is performed based on spatial proximity and physical similarity; water stage from ungauged regions are used to verify the model; and a case study involving a forecast and warning of a flash flood that occurred in Zherong is shown.
This paper is organized as follows. Section 2 presents the data and methodology, including the study area and the data used in this study, the methodology, and the flash flood warning system. In the Methodology Section, the distributed hydrological model, the regionalization procedure, an evaluation of the performance of the model, and the discharge threshold are explored. Section 3 presents the results of the calibration and validation of the model, as well as a discussion and a case study involving a flash flood warning in Zherong. Finally, Section 4 provides the major conclusions of this study.

2. Data and Methodology

2.1. Study Area and Data

Fujian Province, which lies along the southeastern coast of China, faces Taiwan across the Taiwan Strait, and is one of the mainland provinces that lie close to Southeast Asia and Oceania. This province belongs to the subtropical monsoon climate region, and receives abundant rainfall. The hydrological regime of Fujian typically displays low water levels during the dry season, which extends from November to March, and heavy precipitation that leads to flash floods occurs during the flood season, which extends from April to October. Flash floods caused by typhoons occur frequently in summer.
Shunchang and Zherong are located in the northern part of Fujian Province. The area of Shunchang is 1985 km2, which includes 1618 km2 of mountainous areas. Its elevations range from 86 to 1356 m a.s.l (Figure 1). As Table 1 shows, the mean annual precipitation in Shunchang is 1688 mm. The forests and cultivated land cover 76% and 15% of the region respectively. The rest of the region is covered by building land, grassland, and water and water conservancy facilities land. In addition, clay loam is the main soil type, and the corresponding percentage is 64.7%, sandy clay loam takes the second place with the percentage of 16.2%, and other soil types (loam and sandy clay) take the remaining 18.8%. The mean slope of the sub-basins in this region is 0.41.
Zherong lies near the East China Sea. Typhoons and storms occur regularly in this region. Longxi, Jiaoxi, and Qianyangxi are the main rivers. The region occupies 538 km2, and over 93% of this area is mountainous. Its elevations range from 71 to 1432 m a.s.l. (Figure 1). In addition, the mean annual precipitation is more than 2000 mm. Sixty-eight percent of this area is covered by forests and 17% is the cultivated land. The rest of the area is covered by building land, grassland, and water and water conservancy facilities land. In total, 87.3% of the soil is covered by clay loam, 10.2% by sandy clay loam, and the rest is sandy clay. In addition, the average slope of the sub-basins in Zherong is 0.43.
Several small catchments around Shunchang and Zherong, namely Siqian, Xiaoanxia, Qigu, Tangkou, and Qibu, have extensive hydrological data (Figure 1). These catchments range in size from 14 to 240 km2. In addition, these catchments have a close affinity to Zherong and Shunchang in terms of their climatic and hydrological features. The features of these catchments are also listed in Table 1. The average annual rainfall is approximately 1800 mm. These catchments are only weakly urbanized, and the forest covers over 72% of the areas. Grassland ranks second with over 10% and cultivated lands takes the third place. Those catchments contain few water and water conservancy facilities lands. Clay loam is the main soil type and over 70% of the five catchments are covered by this soil type. Sandy clay loam takes the second place, and few sandy loam and sandy clay areas can be found in those catchments.
Both topographic data and hydrometeorological data are used to forecast and provide warnings of flash floods. The rivers, catchments and sub-basins were derived from digital elevation models (DEMs) with a spatial resolution of 25 m. The physical characteristics of the rivers, including their slopes, lengths, widths, and the shapes of their cross sections, were obtained from DEMs or stream surveys. Land use/cover data were extracted using satellite imagery from the China–Brazil Earth Resources Satellite 2 (CBERS-2) satellite. A soil type map was obtained from the Second Soil Census of China (SSCC) [30].
The hydrometeorological data are used to calibrate and verify the hydrological models. The gauged rainfall, water stage, and discharge data were obtained from the Flood Control, Drought Relief and Disaster Mitigation in Fujian, China. Water stage data from 9 flash flood events and discharge data from 131 flash flood events were gathered and summarized. The locations of the water stage stations and the rainfall stations in Shunchang and Zherong are shown in Figure 1. The water stage data include information on river water stages and reservoir water stages. The available river water stage data were collected for 5 flash flood events that occurred in three catchments (Zhengfang, Renshou, and Zhongyutian) in Shunchang. The reservoir water stage data for 4 flash flood events that occurred in Longxi and Qinglan catchments in Zherong were obtained. All of these water stage data were measured during the flood season of 2016. Furthermore, the reservoir water stage data of 2 flash floods were collected during the Typhoon Megi, occurring on 28 September 2016. Discharge data from 131 flash flood events that occurred in Siqian, Qigu, Xiaoanxia, Tangkou, and Qibu catchments during flood seasons before 2016 were gathered. Table 2 provides detailed information on the available hydrometeorological data.

2.2. Methodology

2.2.1. Distributed Hydrological Model

The distributed hydrological model (CNFF-HM) was developed to simulate the processes of rainfall and runoff in small mountainous catchments by the China Institute of Water Resources and Hydropower Research (IWHR) in 2014, with the aim of providing effective flood forecasts for flash flood warnings. This model can perform continuous simulations and can forecast flash floods with time step of 1 day, 1 h, or 30 min. Based on hydrological processes and geomorphological properties of the study region, the distributed model generalizes a catchment into many model elements, including sub-basins, reaches, nodes, reservoirs, etc. The topological relationship of those elements is shown in Figure 2. Sub-basins, divided based on DEM, were used as the basic calculation units, and the average area of these sub-basins is 16 km2.
For the simulation of flash floods, 6 calculation modules that correspond to the key hydrological processes of rainfall, evapotranspiration, runoff production, runoff concentration, flow routing, and reservoir regulation (if a reservoir exists) were developed. Other modules representing processes such as snowmelt can be easily added if needed. The Thiessen model is utilized to perform areal calculations of rainfall in the rainfall module. In addition, the evapotranspiration is calculated using the three-layer soil moisture model [31].
The saturation excess runoff production method provides good simulations of runoff production in humid and sub-humid regions in China [31,32,33,34]. Surface flow, interflow, and underground flow volume are calculated (Figure 3) by the runoff production module via the saturation excess runoff production method. For the runoff concentration of sub-basins, the surface flow is calculated using a distributed unit hydrograph (DUH). The DUH was proposed in which the catchment was decomposed into individual sub-basins or cells by Maidment in 1993 [35,36]. The concentration velocity of every cell is derived according to the DEM and land use/cover. Rainfall intensity, which is the main factor that influences velocity, is considered in the method as:
v = k s 0.5 i n
Here, k is a coefficient that is determined by land use/cover. s is the slope of a sub-basin or cell, and i is the rainfall intensity, n is a constant, which value the influence of rainfall intensity to the velocity, according experience, n = 0.4.
The surface runoff concentration time ∆τ is calculated using the cell size, flow direction and velocity. Assuming there are two flow directions in a cell, ∆τ = L/v when the flow direction parallels the side of the cell, and ∆ τ= 2 L/v when the flow direction follows the diagonal of the cell. The total concentration time of every cell along a flow path represents the time required for rainfall to reach the outlet. The probability distribution was established based on the DEM cell area. After the duration and unit converted, the DUH of sub-basin was calculated. The DUH is closely related to the DEM, land use/cover, and rainfall intensity. Thus, the DUH can be derived for ungauged basins without observations of runoff.
The Muskingum flood routing method is one of the most popular routing procedures. It involves two parameters, the storage coefficient k and the weighting factor x [37]. Song et al. described a method to utilize the Muskingum model with variable parameters in ungauged catchments. The parameters are calculated using physical characteristics of the channel and floods [38]:
k = 0.69 n 0.6 P 0.4 Δ L 3600 Q 0 0.2 i 0.3 , x = 0.5 0.35 Q 0 0.3 n 0.6 i 1.3 P 0.8 Δ L , for   parabolic   channel   cross   sections k = 0.75 n 0.6 P 0.4 Δ L 3600 Q 0 0.2 i 0.3 , x = 0.5 0.375 Q 0 0.3 n 0.6 i 1.3 P 0.8 Δ L , for   triangular   channel   cross   sections k = 0.6 n 0.6 P 0.4 Δ L 3600 Q 0 0.2 i 0.3 , x = 0.5 0.3 Q 0 0.3 n 0.6 i 1.3 P 0.8 Δ L , for   rectangular   channel   cross   sections
where ΔL is the channel length, n is the roughness, P is the wetted perimeter, and i is the slope. Q0 is the reference flow, which is a function of the lowest flow in the channel and the flood peak flow during one simulated flood event [39]. The Muskingum parameters vary for different river segments and different flood events when the river routing process is simulated by the CNFF-HM. The physical characteristics of the river segments are obtained from DEMs or surveys.
The parameters of the DUH and dynamic Muskingum model are defined according to their physical meaning based on either the DEM or regional/global databases (land use/land cover). The runoff production parameters, such as the storage of surface free water in the catchment, should be calibrated using hydrological data. Those parameters can be categorized according to the modules, and they would be discussed in this study.

2.2.2. Regionalization of Model Parameters

The regionalization approach can be explained using Equation (3):
θ R = F R ( θ D ) + γ
where θR is the set of model parameter values used in ungauged (receiver) catchments, θD is the set of parameter values obtained from gauged (donor) catchments, and γ is an error term. F R ( ) is the functional relation for θR. When only one donor catchment is used, θD is transferred to the receiver catchment after considering the error term, namely, F R = 1 . However, in some cases, more than one donor catchment is used, and the average value of θD is transferred to the receiver catchment. That is, F R ( ) is the average function. The catchments in this approach are required to use the same model; that is, the model structure, algorithm, and parameters are identical. Moreover, this approach assumes the parameters are mutually independent in the model.
When selecting a donor catchment for use with an ungauged catchment, the formula used to assess physical similarity is:
φ = i = 1 k | X i G X i u | Δ X i
where X i G and X i u are the values of the ith parameter, which present the physiographic and climate features of a catchment or regions, e.g., annual rainfall, slope, forecast coverage, etc. in gauged and ungauged catchments, respectively; Δ X i is the difference between the maximum and minimum values of the ith parameter; and φ denotes the similarity of the two catchments. Large values of φ imply small degrees of similarity and vice versa. The value of φ is also related to the number of catchments and parameters. Particularly, when two catchments with n parameters have φ = 0 , they are completely similar; on the other hand, two catchments with n maximum parameter values and n minimum parameter values that yield φ = n are not similar at all.

2.2.3. Evaluation of Model Performance

The Nash and Sutcliffe efficient (NSE) [40] and the relative error are adopted to evaluate the performance of the model. The NSE is defined as:
N S E = 1 t = 1 n ( Q s t Q m t ) 2 t = 1 n ( Q m t Q m ¯ ) 2
where Q s t and Q m t are the simulated and observed runoff values at time t, respectively; Q m ¯ is the arithmetic mean of the observed runoff; t is the tth time period of the flood; and n is the total time period. The NSE is an index that is used to determine the degree of correlation between the simulated and observed flood processes. The average NSE is calculated to reflect the performance of the model.
The relative error (RE) and the average relative error (ARE) are also used to evaluate the performance of the model in simulating runoff and the peak flood discharge. The RE and ARE of runoff are defined as:
E R = R s R m R m
E R ¯ = k = 1 n | E R k |
where Rs and Rm denote the simulated and observed values, respectively. In addition, ER, which is usually expressed as a percentage, represents the RE of runoff. ERk represents the RE of runoff of the kth simulation, and E R ¯ represents the ARE of runoff of the simulations.
Equations (8) and (9) define the RE and the ARE for peak flood discharge:
E Q = Q s Q m Q m
E Q ¯ = k = 1 n | E Q k |
where Qs and Qm are the simulated and observed values, respectively; EQ is the RE of peak flood discharge, expressed as a percentage; EQk is the peak flood discharge RE of the kth simulation; and E Q ¯ is the ARE of the peak flood discharge.
The difference in the timing between the simulated and observed flood peaks is also used to evaluate the performance of the model. The difference in the timing and its average are defined as:
D T = T s T m
D T ¯ = k = 1 n | D T k |
where Ts is the simulated flood peak time, Tm is the observed flood peak time, DT is the difference between these times, and D T ¯ is the average value of the n differences between the timings in one catchment.
For the simulation of water stages, the water stage error is used to express the model performance. The water stage error is defined as:
D w = W s W m
where Ws is the simulated water stage; Wm is the observed water stage; and DW is the water stage error.
In the simulation of large basin floods, ER, EQ and DT are required to be not more than 20%, 20%, and 3 h, respectively. No specific criteria exist for these evaluation indexes when they are applied to flash floods, and flash flood simulations usually reference large basin floods. When the model is validated using water stage data, flood trends are also considered to evaluate the performance of the model.

2.2.4. Flash Flood Discharge Threshold

The aim of the flash flood forecasting and warning system is to provide information on the dangers posed by ongoing flash floods. The potential severity level is obtained through comparing the simulated peak flood discharge with the flood discharge threshold. This threshold is derived using the rational formula method [41] for estimating design storms (Equation (13)).
Q = C u C i A
where Cu is the unit conversion coefficient, C is the dimensionless runoff coefficient, i is the design rainfall intensity, A is the area of the catchment, and Q is the design discharge. Design storms with different frequencies are used to calculate the peak discharges of floods with different frequencies.
To describe the potential severity of flash floods in real time, the estimated peak discharges are represented with a color code using two flood frequency categories. Yellow is used to represent peak discharges ranging from the 5-year to the 20-year floods, and red is used to represent peak discharges exceeding the 20-year flood. These discharge thresholds were obtained from the Chinese Flash Flood Survey and Evaluation Project, which includes a flash flood survey of 2058 counties [42,43]. Flash floods in 485 villages were investigated in Zherong. These real-time warning products are sent to operational flash flood forecasting services to enable forecasters to visualize and analyze various model outputs when deciding whether flash flood warnings should be issued.

2.3. Flash Flood Warning System

The flash flood warning system is established using the CNFF-HM based on the discharge threshold in ungauged Shunchang and Zherong. The system consists of three sub-systems, i.e., real-time hydrometeorological data processing system, flash flood forecasting system, and flash flood warning release system (Figure 4). The real-time rainfall, water stage, and discharge data from hydrometeorological monitoring stations, weather radar data, and weather forecast data are analyzed and screened by the data processing system. The flash flood forecasting system is the core part of the flash flood warning system, which continuously analyzes flash flood risk, judges and refreshes warning regions and warning levels. The distributed hydrological model (the CNFF-HM) is the main component of this system, which runs at different time steps according to the rainfall data. The CNFF-HM is operated at daily time step to calculate soil moisture and base flow if no rainfall event is detecting or forecasting. When the rainfall (monitoring or forecasting data) exceeds critical value (for Zherong, this value is 8 mm in two consecutive hours according to rainfall events analysis), the CNFF-HM runs at 30-min time step to forecast discharge of every river cross section on the basis of the daily calculating soil moisture and base flow. Then, the flash flood regions and levels are analyzed by comparing forecast discharge with the discharge threshold. Finally, the flash flood warnings are issued by the flash flood warning releasing to users through broadcasting equipment, portal site, mobile application, fax, etc.

3. Results and Discussion

3.1. Model Calibration

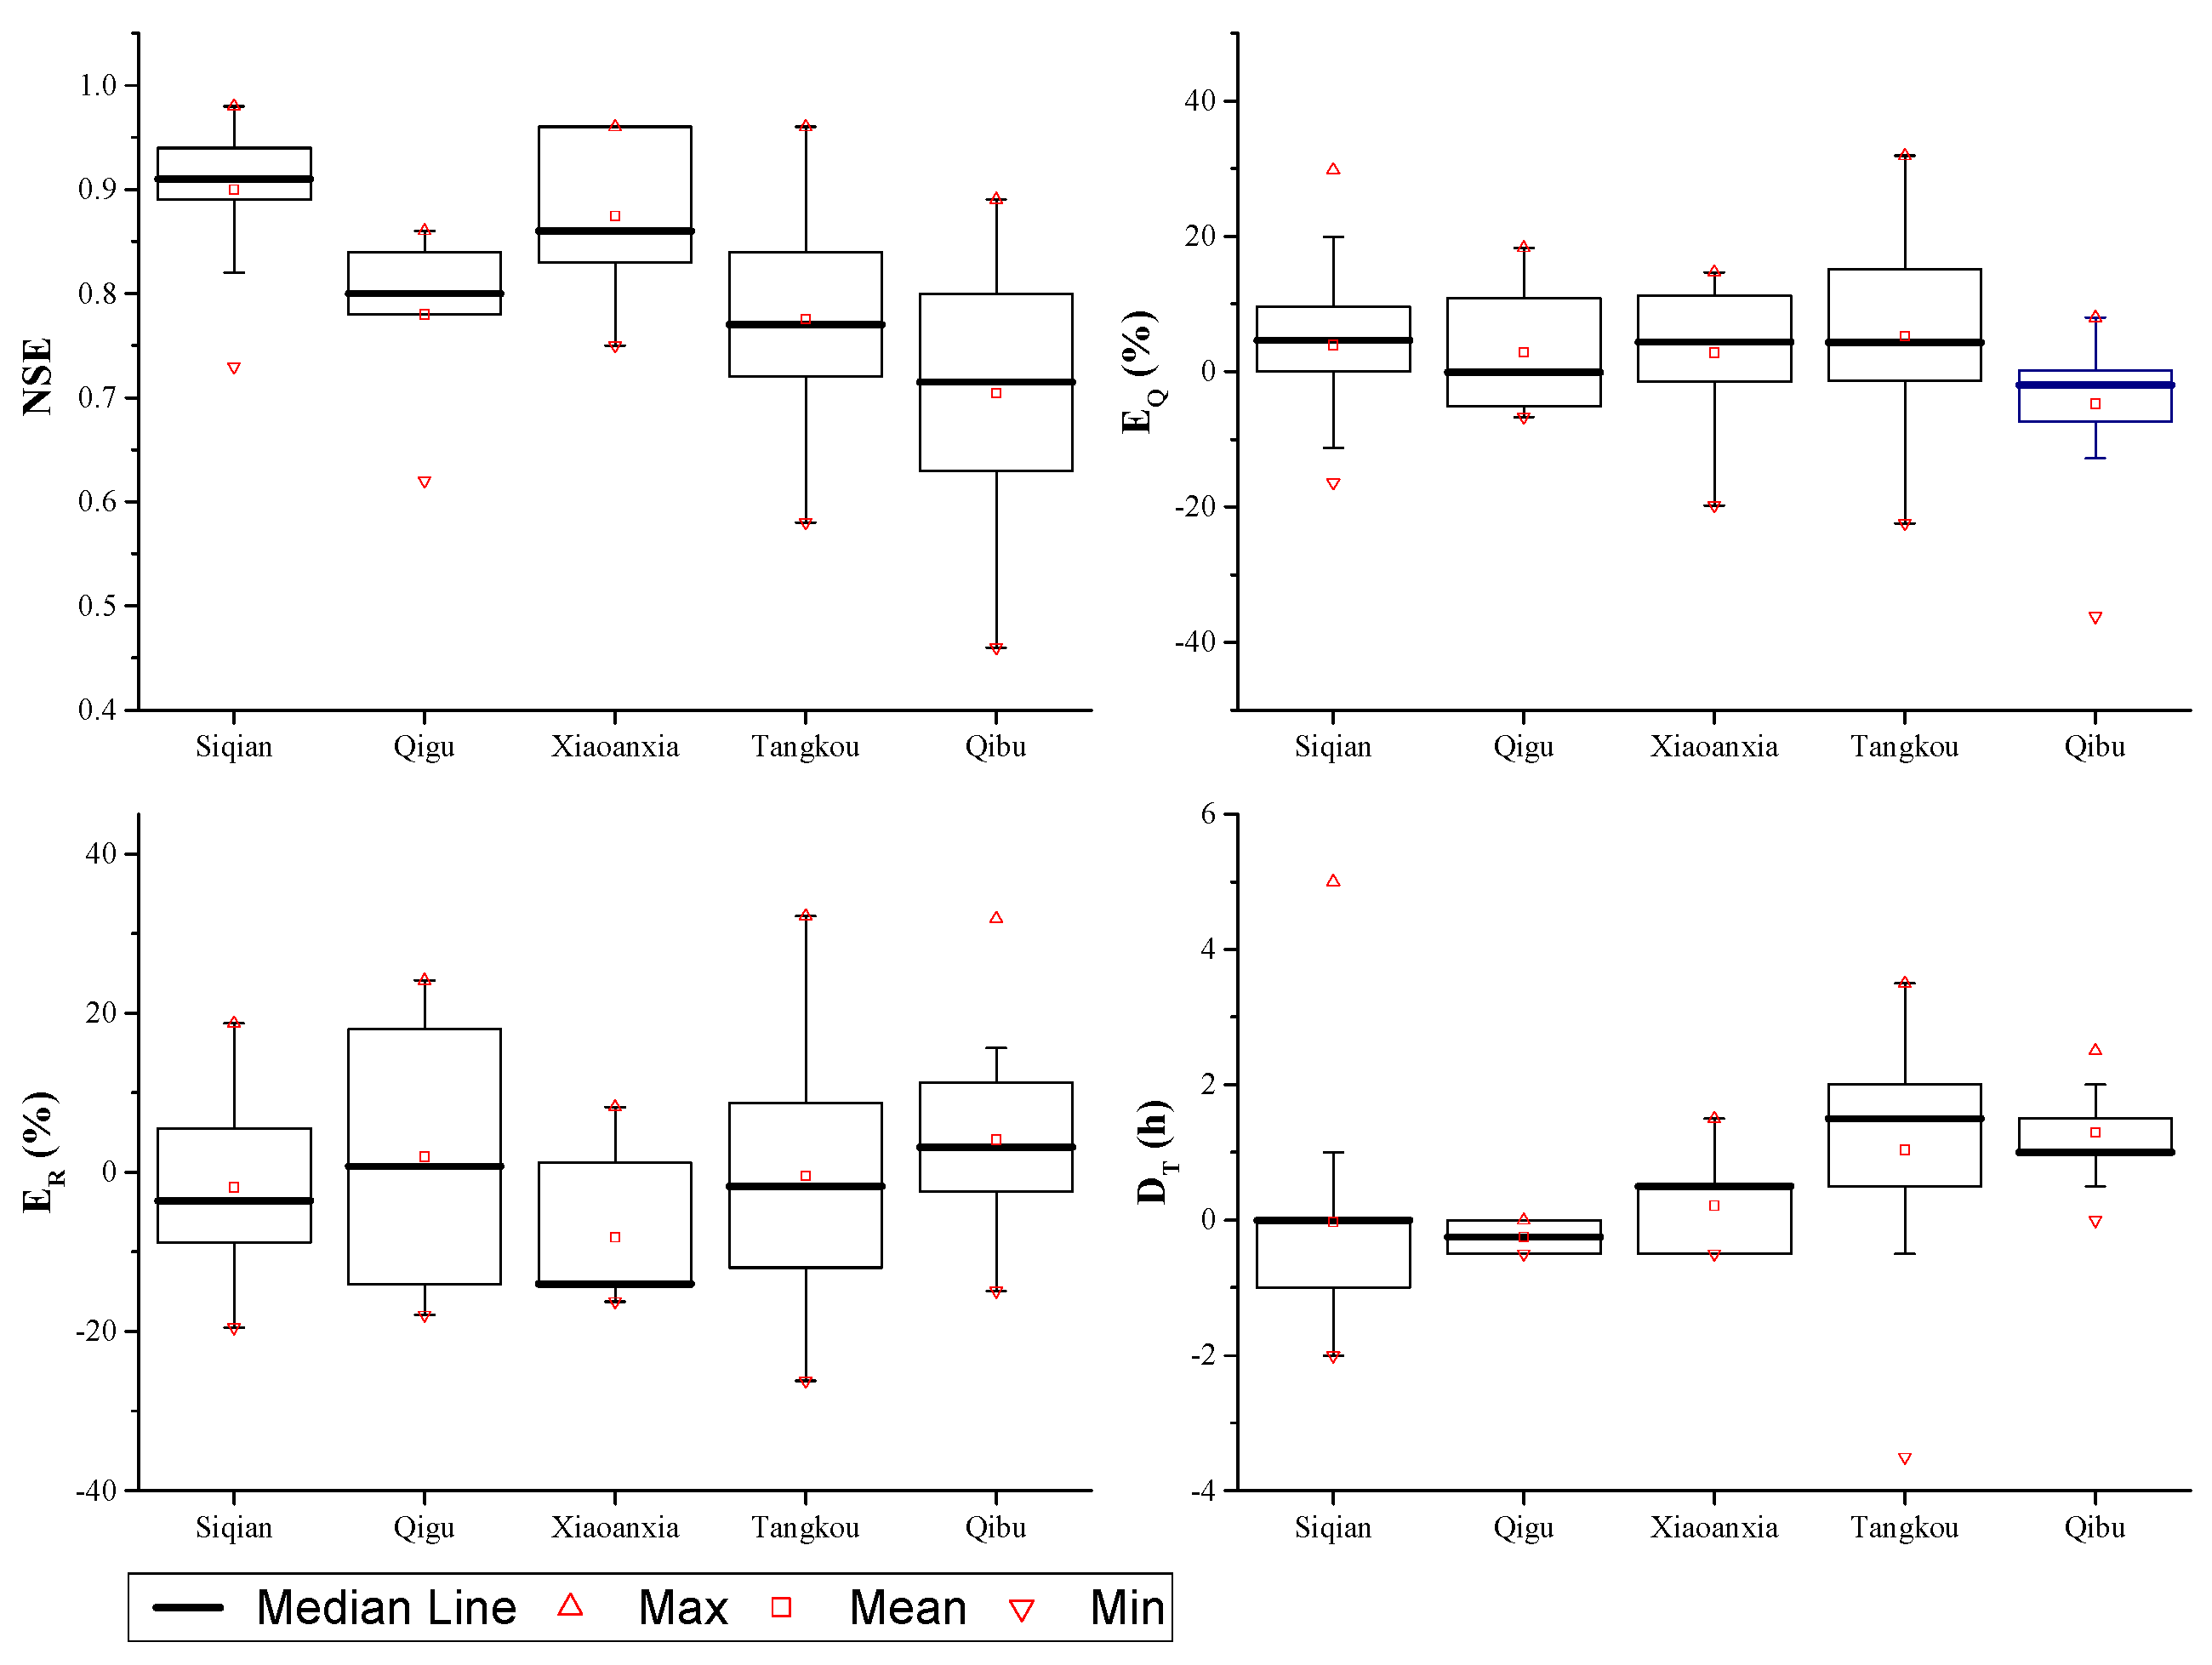
The CNFF-HM is calibrated in the gauged catchments of Siqian, Qigu, Xiaoanxia, Tangkou, and Qibu. Discharge data from 131 historical flash floods are used to calibrate the model for the five catchments. Table 3 and Figure 5 show that the CNFF-HM displays good performance in simulating flash floods. The average NSEs are all above 0.7 for the five catchments, and the highest value, which corresponds to Siqian, is 0.9. The ARE of the peak flood discharge ( E Q ¯ ) and the ARE of the runoff ( E R ¯ ) are lower than 20%, and the average difference in the timing of flood peaks ( D T ¯ ) is within 2 h. In the flash flood forecast, the NSE, ER, and EQ refer to the large basin flood standard. For DT, there is little difference. The flash flood response time is closely related to the catchment size. For a catchment of approximately 200 km2, the response time for which is 6 h, the DT is required to be less than 2 h. If the rainfall stations are distributed evenly in the catchment, a DT of one hour is better. For a smaller catchment, the response time for which is within 3 h, the DT was required to be less than 1 h. Most of the NSE, ER, EQ and DT values are within the allowed ranges (Figure 5). These results satisfy the requirements of flash flood modeling.
The model displays diminished performance for the Tangkou and Qibu catchments, which display lower NSE and higher D T ¯ values that are not as good as those obtained for the other three catchments. The main reason is the lack of rainfall gauges. Qibu had only one rainfall station before 2000, which located in the right tributary. The location of this rainfall station might have the total rainfall volume of the catchment and the highest rainfall intensity be properly presented, thus yielding smaller E Q ¯ and E R ¯ . However, the rainfall process of the whole catchments could not be revealed using only one rainfall station data, thus, the simulated flood was not in agreement with the observed process, resulting in the higher DT and smaller NSE. Though another rainfall gauge was set near Qibu catchment after 2000, the problem was still not solved. Tangkou had only one rainfall station until now, where the lack of data on the upstream reservoir made the calibration more difficult. On the other hand, the performances of the model for the Qibu and Tangkou catchments are permissible when using point rainfall replacing areal. In small mountainous catchments, the flood concentration time is short and the impact of storm centers on flood peaks and peak times is slight. Thus, the replacement surface rainfall with point rainfall in the simulation of flash floods in poorly gauged catchments is reasonable.

3.2. Regionalization

Regionalization based on spatial proximity and physical similarity is used to determine the values of the model parameters in the ungauged regions of Shunchang and Zherong. Siqian, Qigu, Xiaoanxia, Tangkou, and Qibu are data-rich catchments around Shunchang and Zherong. Comparing with other combinations of meteorological and physical features in catchment similarity judgment, the combination of slope, forecast coverage, and drought index was the best [44]. In this study, the meteorological index (the average annual rainfall) was chosen for similarity judgment. The catchment attributes, land use/cover (i.e., the proportion of forest coverage), the soil type (i.e., the proportion of clay loam coverage), and slope are also considered as the primary factors that are used to judge the physical similarity between the ungauged catchments and the data-rich catchments. These index values are listed in Table 1.
To obtain catchments similar to Shunchang and Zherong, the value to estimate similarity was calculated according to Equation (4), and the results are shown in Table 4. φ ranges from 0.77 to 2.66. The two ungauged regions, Shunchang and Zherong, display the largest φ value, and those two regions are the most dissimilar regions among those catchments/regions, which means that different sets of parameter values should be adopted from the different donor catchments.
To select similar catchments from Siqian, Qigu, Xiaoanxia, Tangkou, and Qibu for those two ungauged region and remove the most dissimilar catchments, this study adopts 2.0 as the critical value. Thus Tangkou differs from Zherong (φ = 2.23), given the large difference in annual rainfall. In addition, Qibu is similar to Tangkou and Zherong and differs from Siqian, Qigu, Xiaoanxia, and Shunchang because of its bigger annual rainfall and smaller slope. The donor catchments for the ungauged regions are listed in Table 5. The donor catchments for Shunchang are Siqian, Qigu, Xiaoanxia, and Tangkou; the values of φ for these catchments are all smaller than 2.0. Siqian, Qigu, Xiaoanxia, and Qibu are similar to Zherong, and the corresponding values of φ are 1.58 to 1.97. Thus, these four catchments are chosen as donor catchments for Zherong. Although Zherong and Tangkou are closer to one another than Siqian, Qigu, and Xiaoanxia (Figure 1), the large differences in forest coverage and slope cause Zherong and Tangkou to be less similar than those other catchments.
When using the CNFF-HM to model flash floods in these two ungauged regions, the average value of each parameter is calculated in their donor catchments. The values of the CNFF-HM in Shunchang are the average values for Siqian, Qigu, Xiaoanxia, and Tangkou. On the other hand, for Zherong, these values are the average values for Siqian, Qigu, Xiaoanxia, and Qibu. The values of model parameters for Shunchang and Zherong were shown in Table 6. The parameters in evapotranspiration module of the two regions were the same because of the same meteorological characteristic. In the runoff production module, the surface runoff was sensitive to the SM, which represented the maximum possible deficit of free water storage. The values of SMs for Shunchang and Zherong were different due to the different soil composition and forest coverage. Regarding KKS and KKG, the values corresponding to Shunchang was smaller than those corresponding to Zherong, which indicated the interflow and groundwater in Zherong were richer than in Shunchang.

3.3. Model Verification

The values of the CNFF-HM parameters for Shunchang and Zherong have been estimated. To address the lack of discharge data, water level gauges were set in some catchments in 2016; the water stage data collected from those gauges are used here. Five flash flood events (river water stage data) that occurred in Zhengfang catchment, Renshou catchment, and Zhongyutian catchment are employed, as well as four flash flood events (reservoir water stage data) that occurred in Longxi and Qinglan catchments (Table 2). Zhengfang, Renshou, and Zhongyutian are located in ungauged Shunchang, while Longxi and Qinglan are located in ungauged Zherong. All those water stage data were measured in 2016 using new gauges.
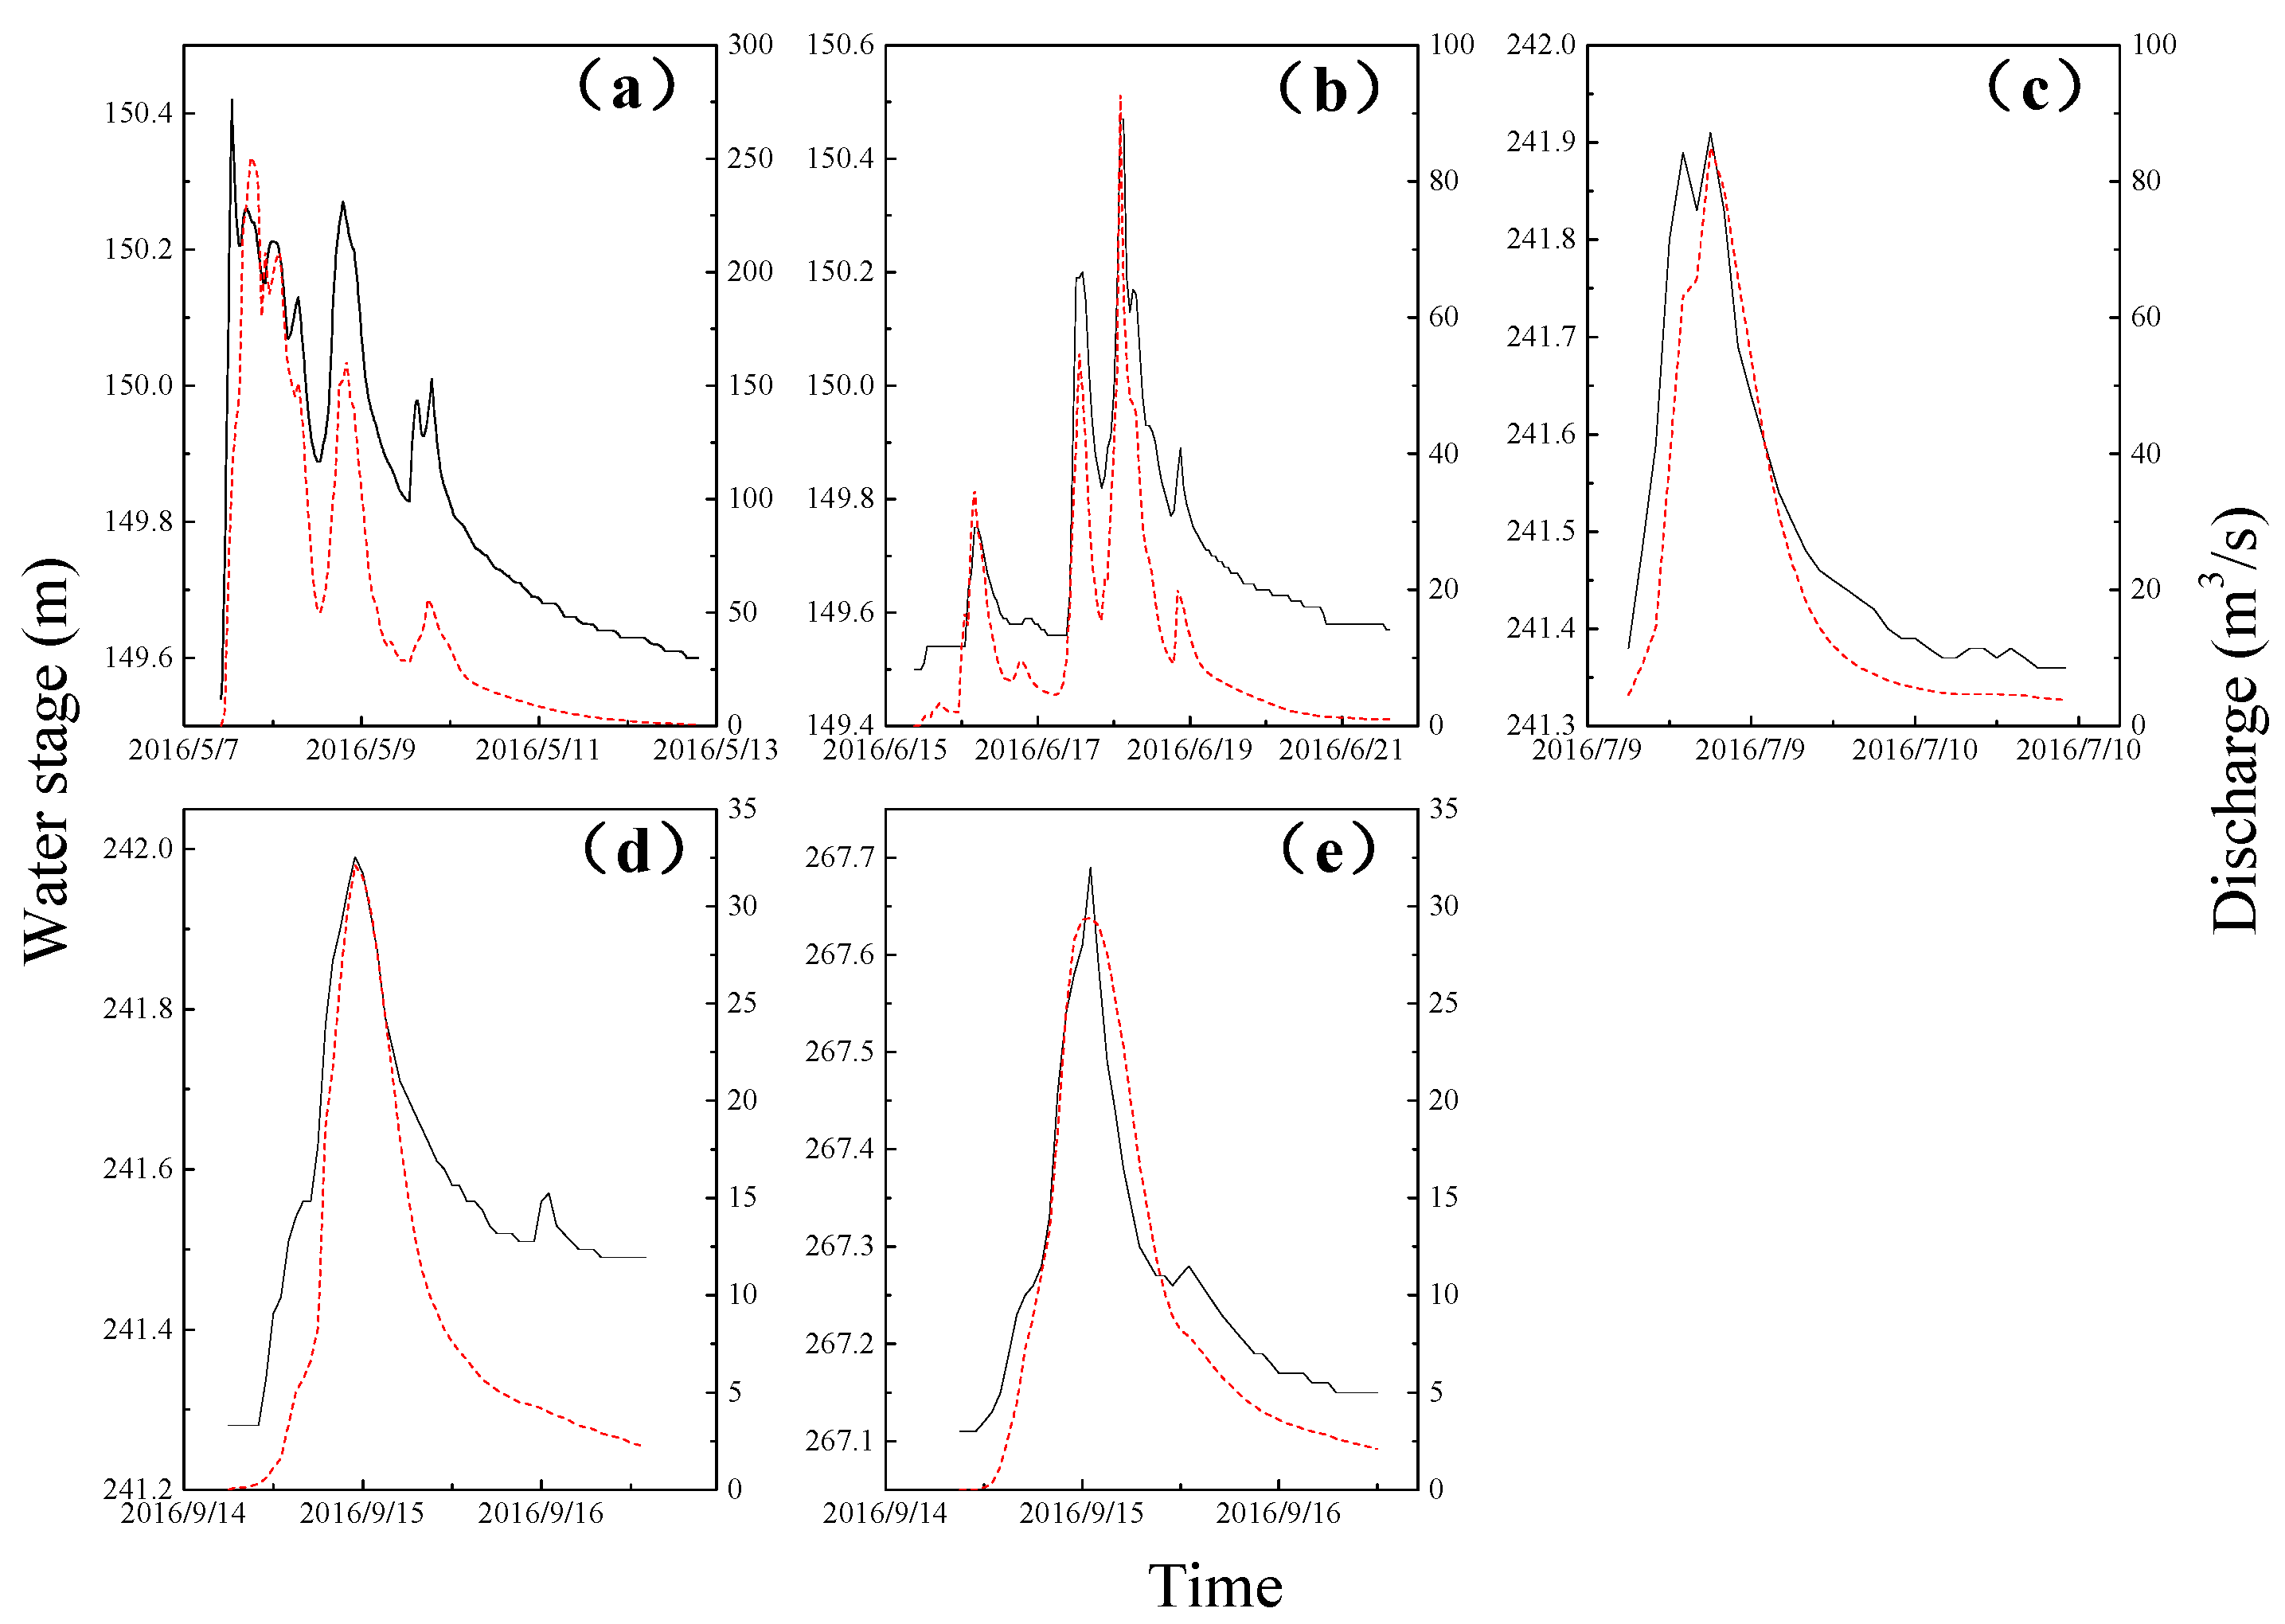
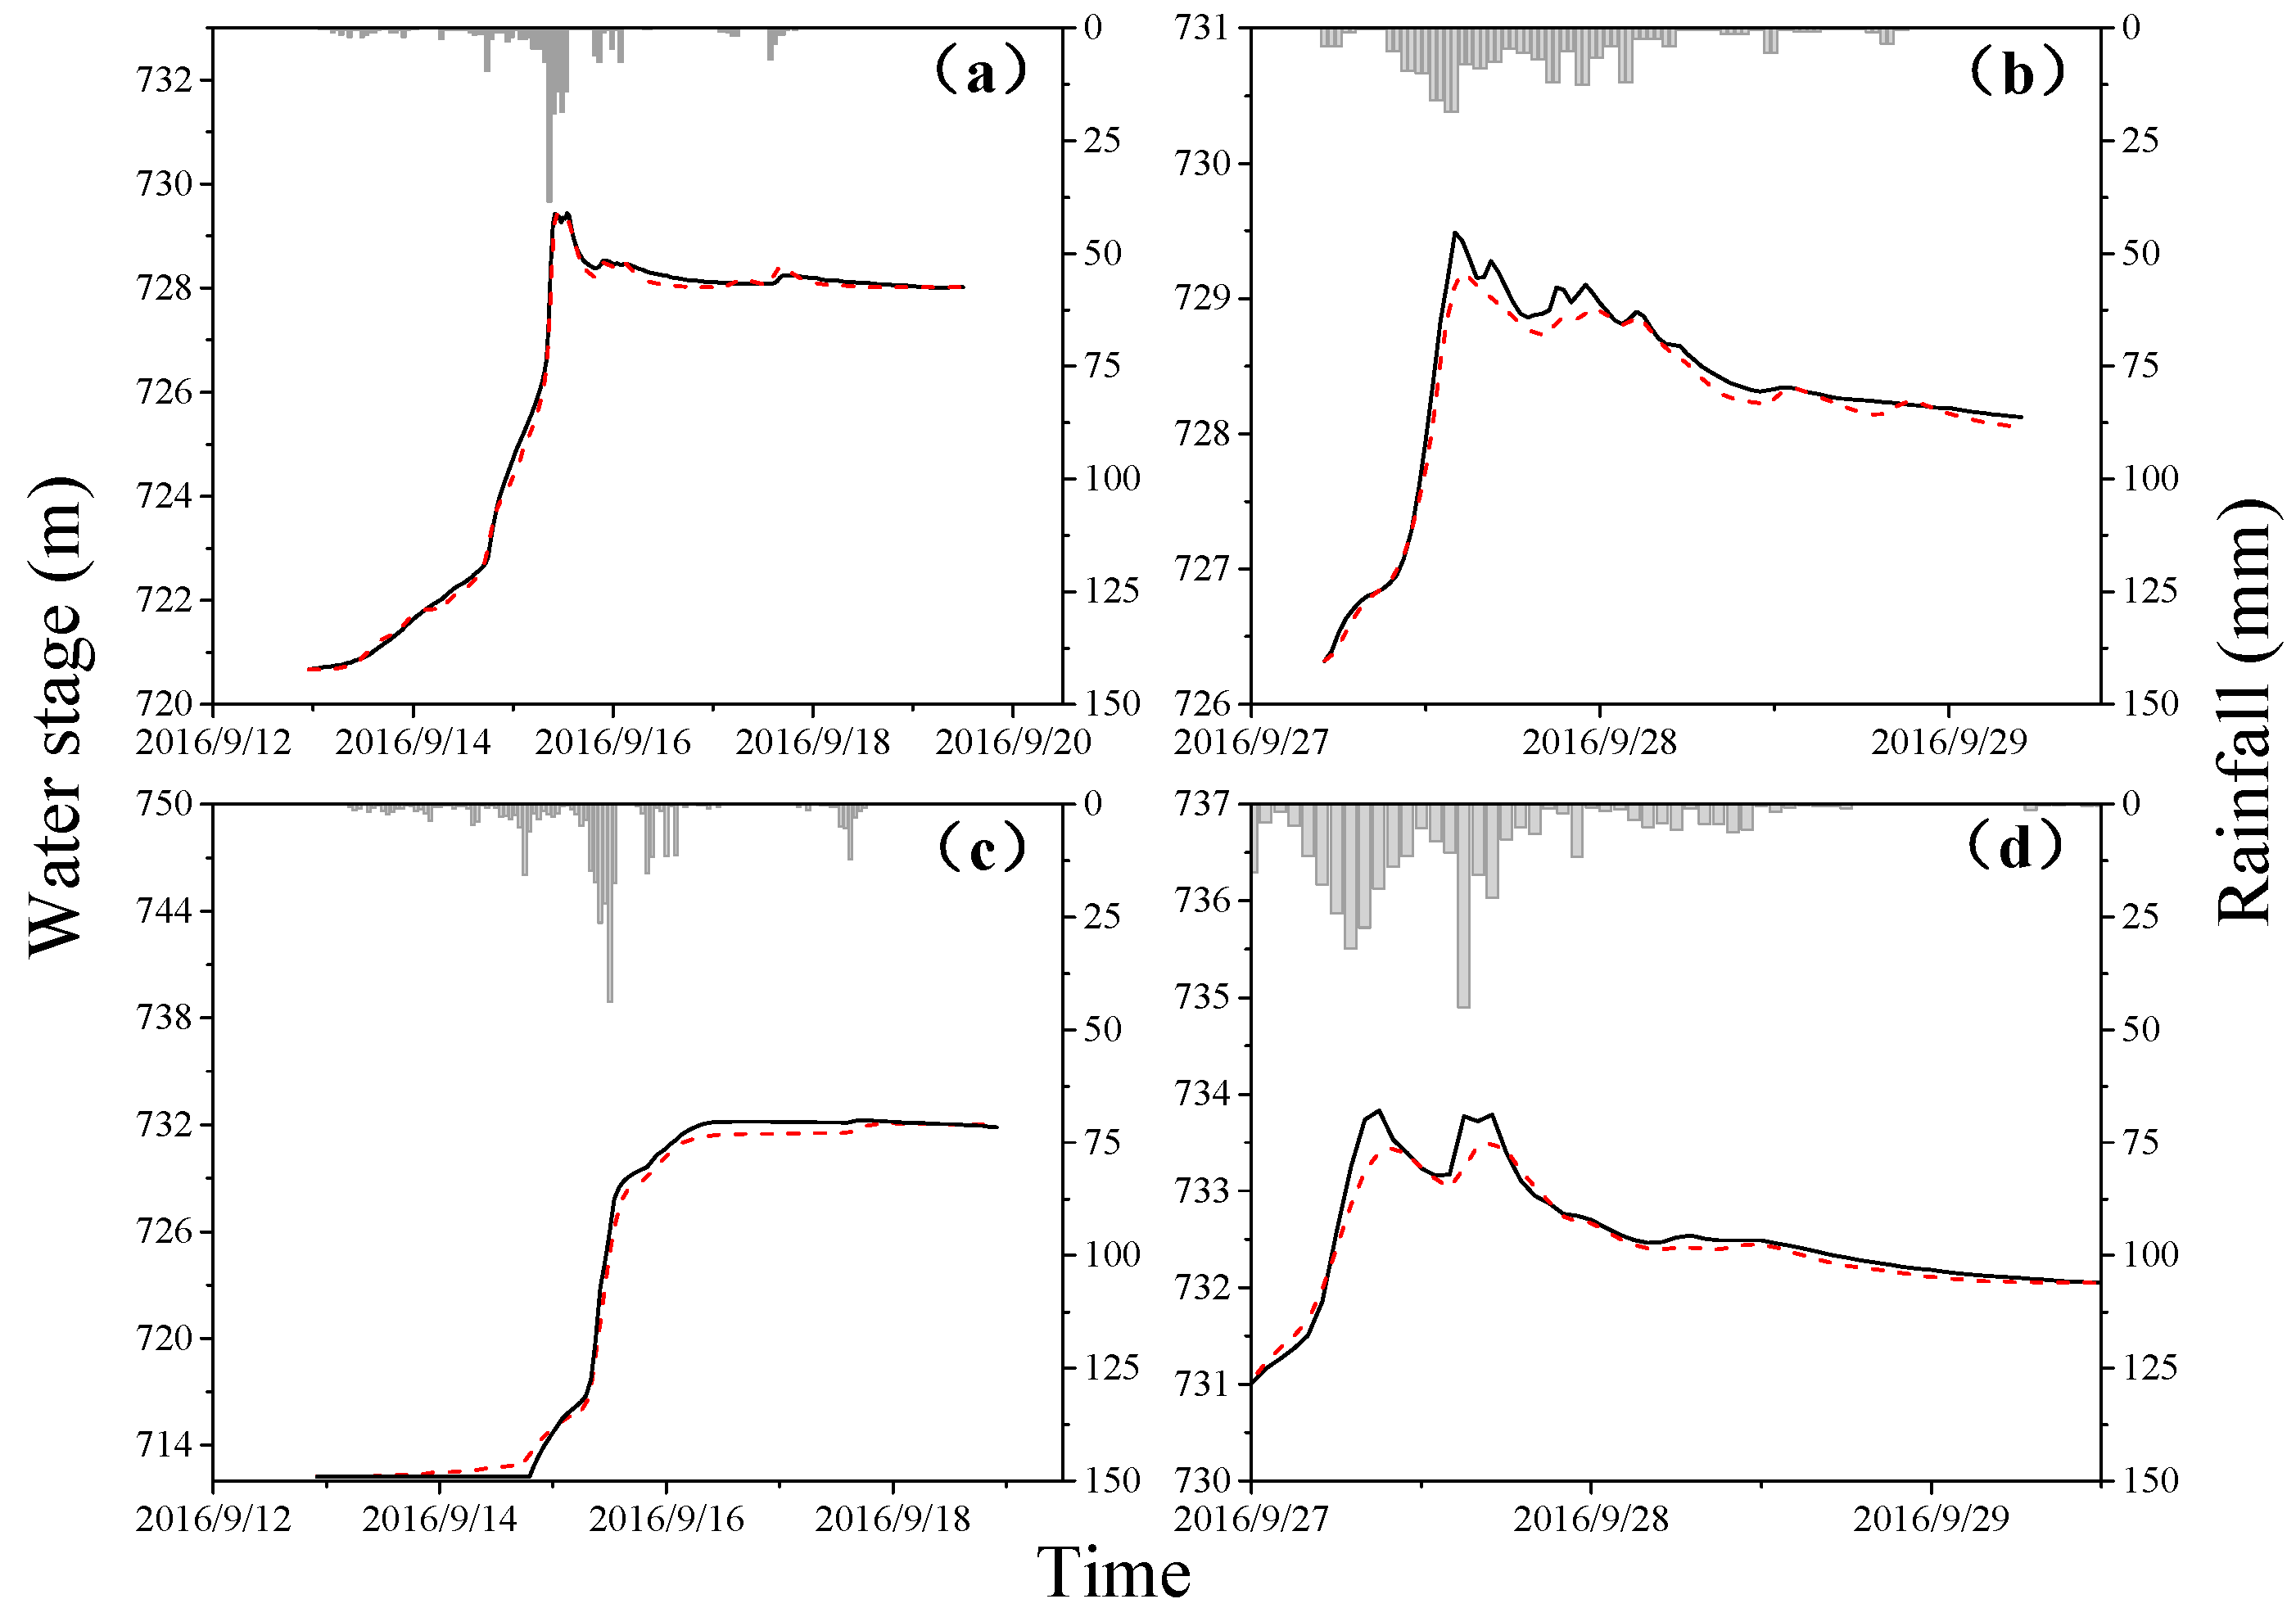
The verification results obtained using the water stage data and reservoir water stage data are shown in Figure 6 and Figure 7, respectively. In Figure 6 and Figure 7, the solid black line represents the observed water stage data. The dashed red line in Figure 6 and Figure 7 represents the simulated discharge and the simulated water stage, respectively. The evaluation values of the river water stage and reservoir water stage validation are listed in Table 7 and Table 8, respectively. Table 7 shows the difference in the timing of flood peaks between the observed water stage and the simulated discharge, and only one of the five simulated flood peak times did not match the observations. As shown in Figure 6, the trends of all of the simulated flood events are strongly consistent with the measured water stage. The validation results using reservoir water stage are shown in Table 8. All of the flood peak differences (DT) are smaller than 1 h, and the water stage difference (DW) ranges from 0.013 to 0.4 m. Figure 7 shows that the trends in the water stage seen in the simulations are in accordance with the observations.
Comparison of the validation results for the river and reservoir water stage shows that the river water stage validation displays better performance in terms of the difference in the timing of the flood peak. The flood peak time of two of the four reservoir water stage events used for validation did not match the observations, whereas only 1 of the river water stage events used for validation did not match. However, the validation performed using the river water stage data produced the largest difference (1 h) in the timing of a flood peak noted in this study. The flood peak in question was associated with the simulation of the flash flood event that occurred in Renshou catchment on 8 May 2016. The 8 May 2016 flash flood in Renshou catchment displays multiple peaks (as shown in Figure 6), causing substantial uncertainties in the flood simulations. On the other hand, Renshou catchment has an area of 138 km2, and the concentration time estimated using the rational formula method is more than 3 h. Thus, the 1-h flood peak time error is within the allowed range. Two flash flood simulations in Longxi both yield differences in the timing of the peak of 0.5 h. This difference might be caused by inaccurate water stages and storage relationships.
Regarding water stage differences, the model performed better in Longxi catchment than Qinglan catchment. Even though the rising trend in water stages matched in Qinglan (Figure 7), the differences in the observed and simulated water stage for the peak water stage are 0.2 m and 0.4 m. When the water stage in a reservoir is high, a small difference in the water stage could cause a large error in the estimated storage capacity for the reservoir. Therefore, a 0.4-m difference in water stage is too large to ignore in the simulation of reservoir water stage. Further analysis shows that the difference in water stage is caused by inaccurate water stage data and capacity relationships of the reservoir and water stage station, which is located in a backwater position. In addition, the stage water peak time simulations in Qinglan are more accurate than those of Longxi (Table 8).
The runoff process, which is key in simulating flash floods, has a significant effect on the accuracy of simulations of flash floods. Reservoir water stage values are more closely related to the runoff yield than confluence and river flood routing. The good validation results obtained for the CNFF-HM using reservoir water stage data indicate that the saturation excess runoff production method and the parameter values used in the CNFF-HM are effective for the simulation of flash floods. The river water stage validation compares the flood trends and the flood peak times derived from the observed water stage data and the simulated discharges where the river discharge data are lacking. Therefore, the results do not confirm the simulated runoff volumes; instead, they only provide an estimate of the accuracy of the simulated runoff concentrations and the flow routing methods and parameters. Furthermore, both river water stage data and reservoir water stage data are useful for model validation, and the simultaneous use of these two kinds of data make the validation more exact and reasonable. This model validation method can be applied in most poorly monitored mountainous catchments in China, especially in the areas with only water stage data.
In terms of the transferred parameters, the reasonable verification results obtained using river water stage data and reservoir water stage data indicate that the parameters are suitable for simulating flash floods in Shunchang and Zherong using the CNFF-HM, and the regionalization is effective for the parameters recognized.

3.4. Flash Flood Forecasting and Warning in Zherong

Typhoon Megi, whose center winds had a Beaufort scale value of 12, arrived in Fujian at 4:40 on 28 September 2016, which led to extraordinarily heavy rainstorms. Fifteen gauging stations exceeded the alerting water stage, and heavy floods occurred in most rivers in Fujian Province, which caused huge economic losses and large numbers of casualties.
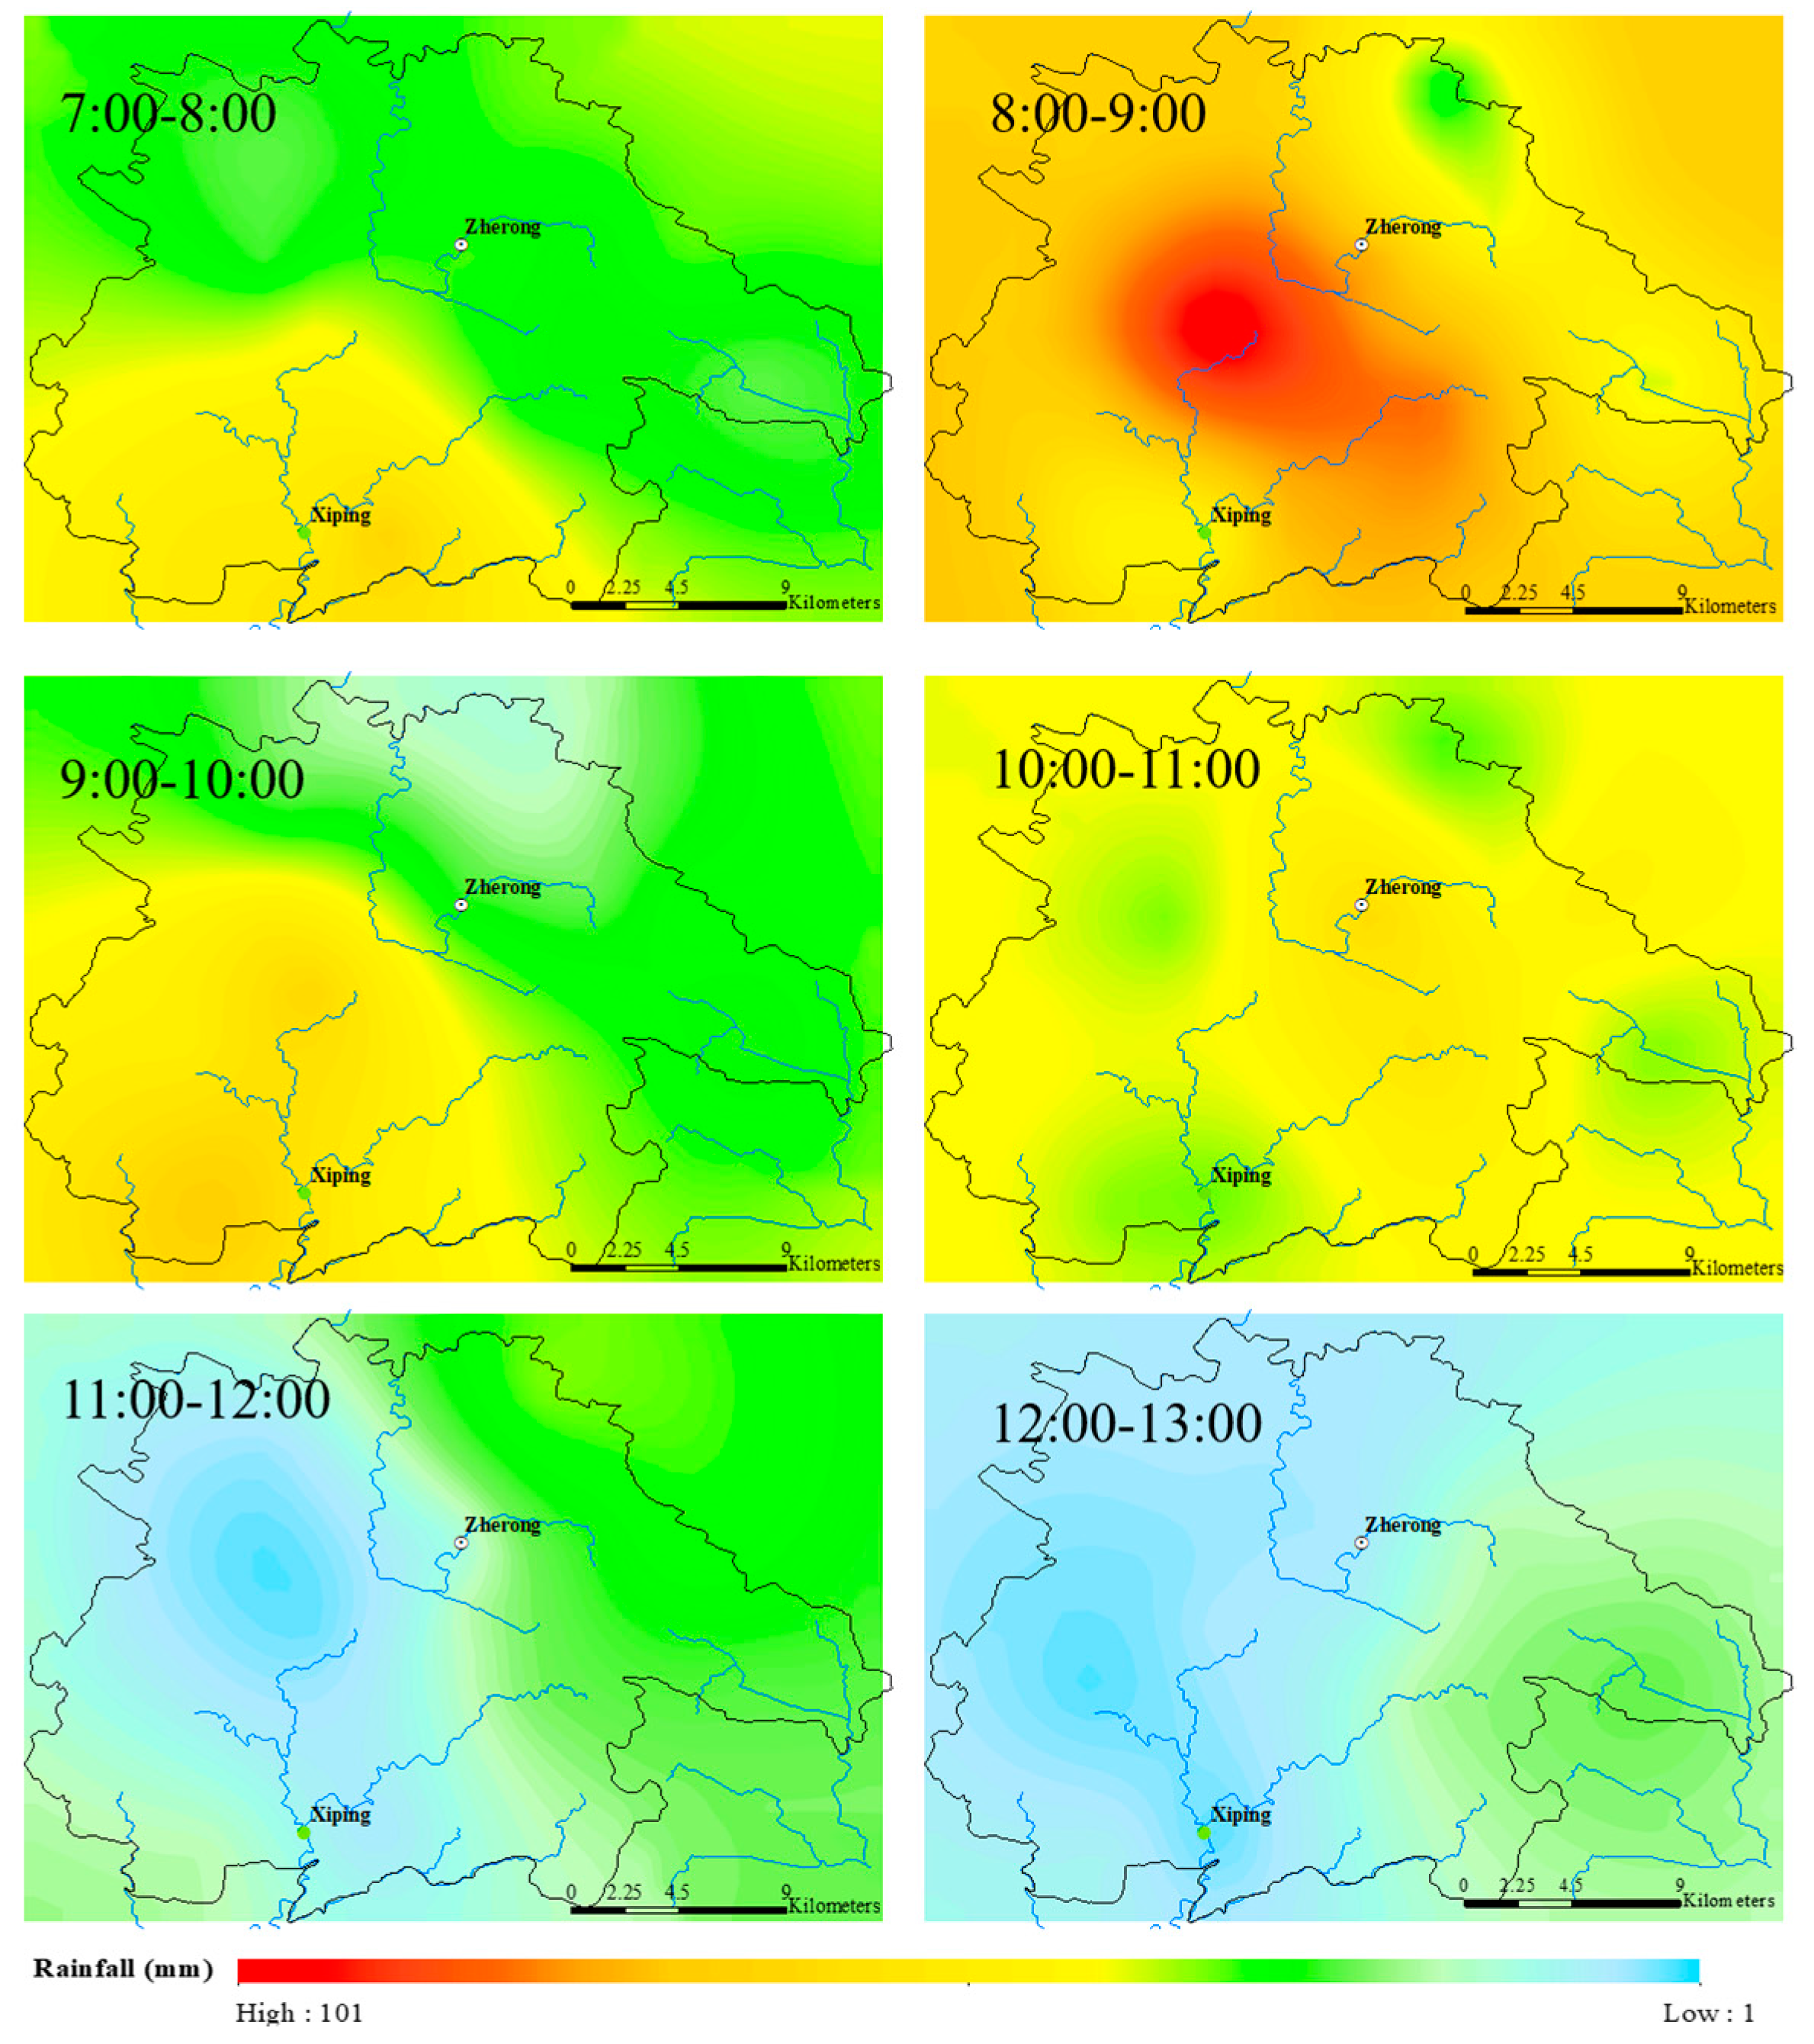
In Zherong, the rainfall caused by Typhoon Megi lasted more than 14 h on 28 September 2016. The maximum rainfall of 101 mm occurred from 8:00 to 9:00 (Figure 8). After that time, the rainfall gradually decreased and ended at 13:00. The maximum daily rainfall reached 442.7 mm, the second highest value recorded since 1961 in Fujian. This rainfall occurred from 00:00 on 28 September to 00:00 on 29 September was recorded at Dazhangping rainfall station. The values recorded at most rainfall stations in Zherong substantially exceeded the highest historical values. The return period for such an event is estimated to be more than 100 years. Industry and agriculture suffered serious losses. Water conservancy facilities and roads were seriously damaged. The six maps in 
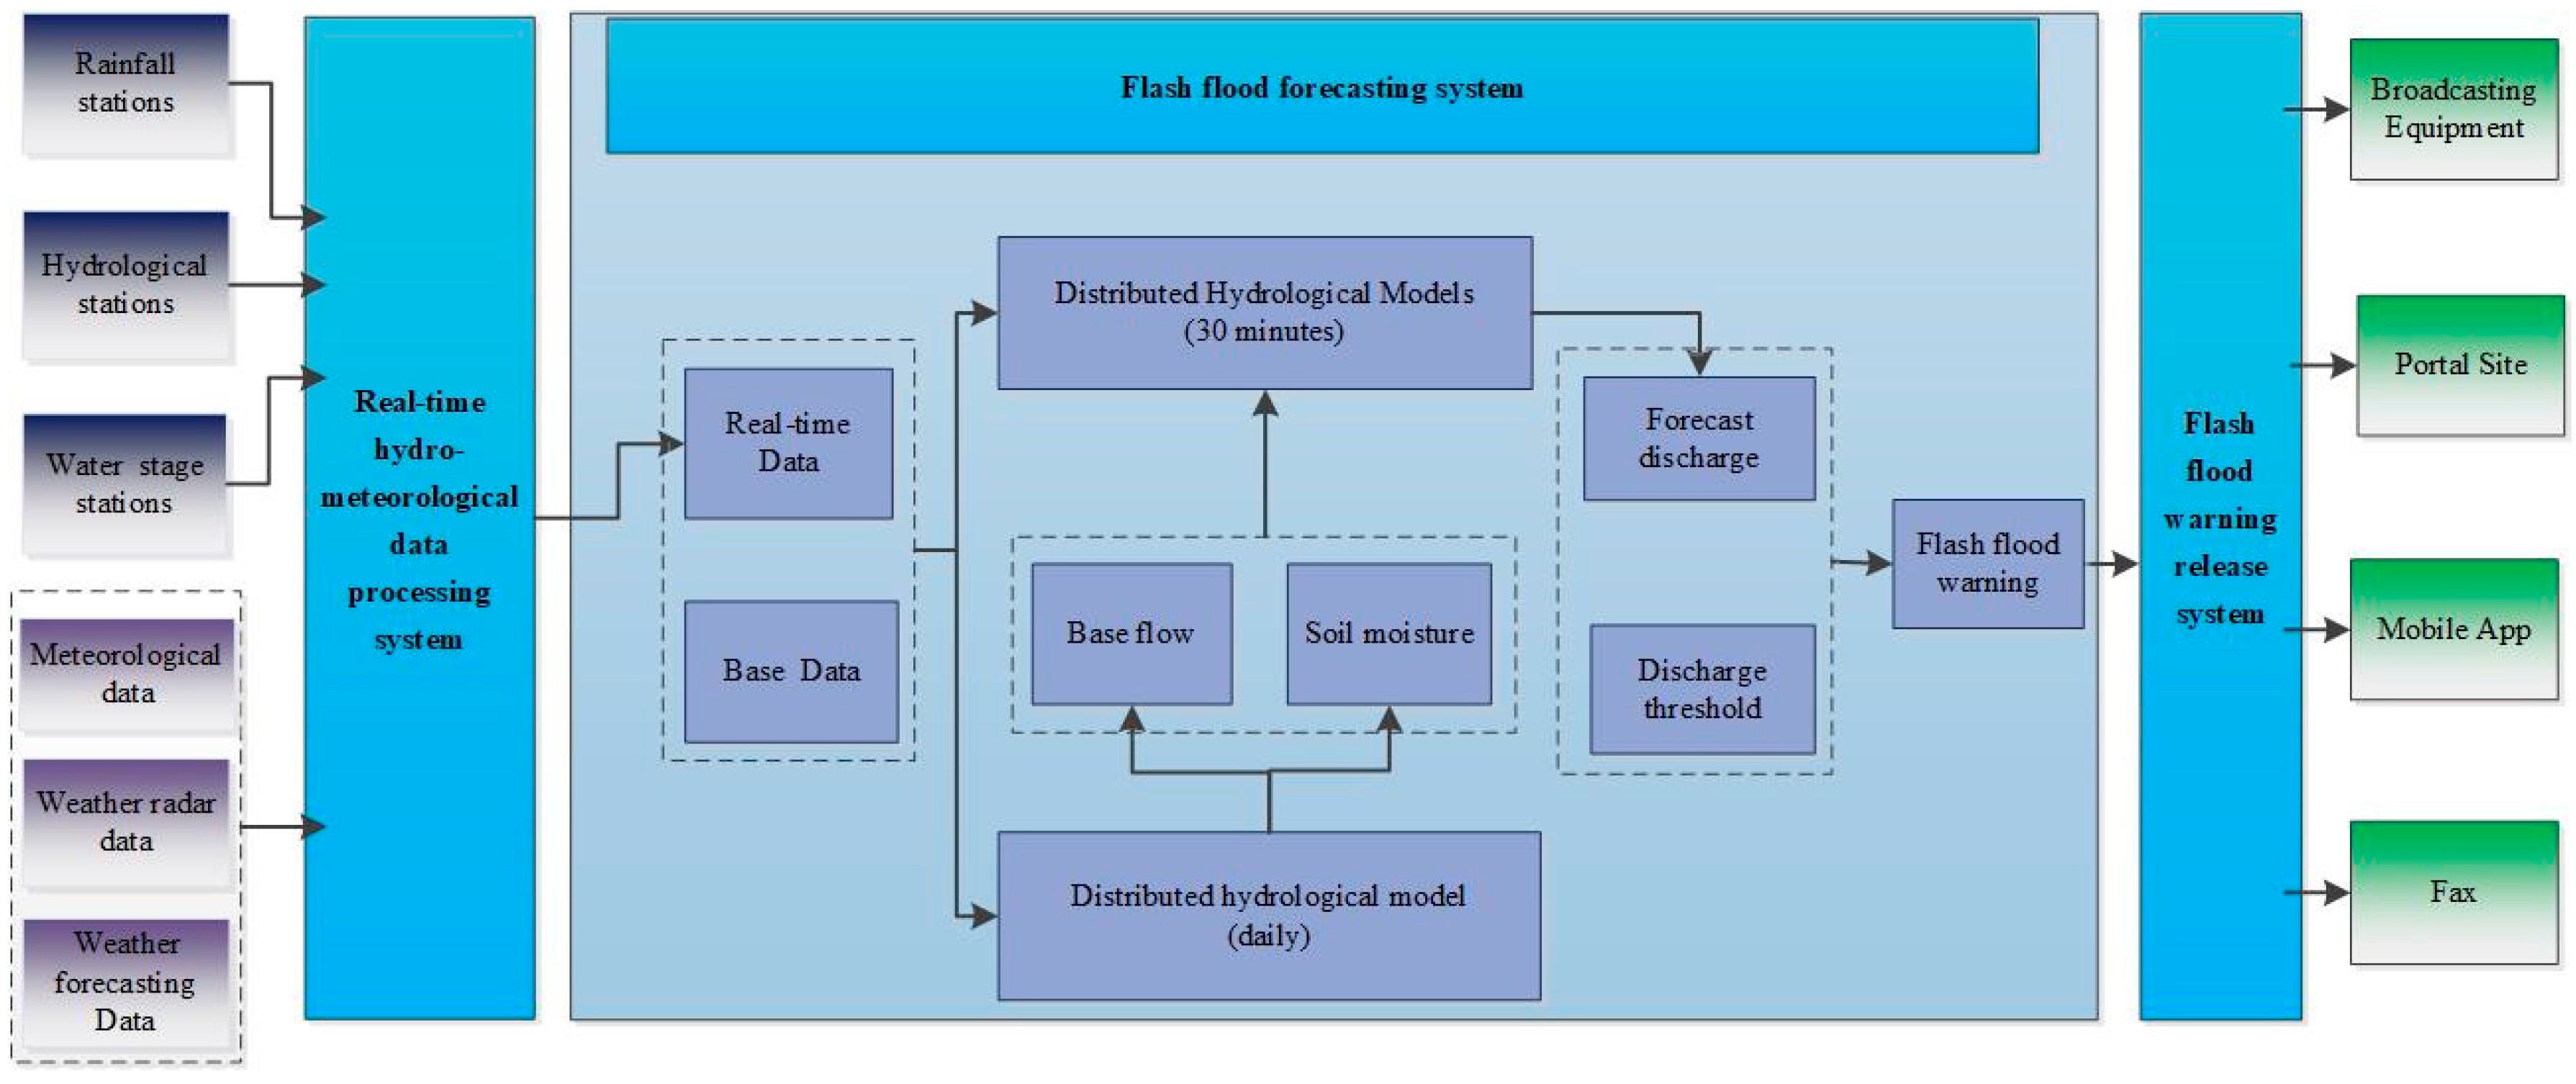
Figure 6 show the rainfall from 7:00 on 28 September to 13:00 on 29 September, as determined using data from rainfall stations. The flash flood warning system that uses the CNFF-HM has been employed in Zherong since 2015. The system runs at a daily time step for soil moisture simulation. When a rainfall event is detected, the system employs a 30-min time step for flash flood forecast. During Typhoon Megi on 28 September 2016, this flash flood system began operation with 30-min time step at 00:00 on 28 September. The maximum forecast discharge (over 2000 m3/s) appeared in Qianyangxi, and a 100-year flood occurred in the left tributary of Qianyangxi. The details of the flash flood warnings are shown in Figure 9.
The process by which the warnings were issued and withdrawn from 8:30 to 12:30 is indicated by the six maps of Figure 9 by the red and orange colors. The warning condition started at 8:30 with a red warning in the left branch of Qianyangxi. The forecast indicated a 5-year flood. At 9:00, 10-year, 50-year, and 20-year flash floods were indicated as possibly occurring in the upstream, midstream, and downstream portions of the right branch of Qianyangxi, respectively. Moreover, the tributary and principal stream of left branch were indicated as possibly experiencing 10-year floods. A 10-year flood also might occur in Jiaoxi. Furthermore, the warnings are in concert with rainfall, which reached maximum value at 8:00–9:00.
As the rainfall decreased, the warnings became weaker and moved towards the downstream reaches of the rivers. At 10:00, the 20-year flood of the right branch moved to the principal stream in Qianyangxi. The flash flood in the upstream left branch of Jiaoxi increased in severity to a 20-year event. At 11:00, the flood in Jiaoxi faded away, and the red warnings in the right branch and the principal stream of Qianyangxi became orange warnings. At 12:00, the flood in the principal stream of Qianyangxi fell to a five-year event, and most of the warnings in its branches were dismissed. The flash flood warning was completely dismissed everywhere within Zherong after 12:30.
In the flash flood forecast and warning on 28 September 2016, accurate forecast and alerts were released successively and in a timely fashion. These warnings helped in the effective coordination of emergency and rescue operations. The losses due to the flash floods were significantly reduced. Although Xiping was seriously affected in this flash flood event, it did not experience casualties, because the people there evacuated after receiving an alert. Despite its good performance in providing flash flood warnings, the system provided warnings of flash floods without an effective lead time because forecast rainfall is unavailable in Zherong. Only rainfall data from the gauging stations is used in the operation of this system.

4. Conclusions

With the development of the hydroinformatics, flash flood forecasting and warning increasingly rely on the automated system. In this study, a flash flood warning system based on a new distributed hydrological model, CNFF-HM, was established. The flash flood forecasts with high accuracy can be obtained using the CNFF-HM, and methods for flash flood forecasts and hydrological model validation in ungauged mountainous regions are provided. In this study, the CNFF-HM is applied to simulate 131 flash flood events in five small mountainous catchments in northern Fujian, China. The model displays a strong ability to capture the flash floods that occur within the study area, particularly in Siqian catchment, where the NSE reaches 0.9. To use the CNFF-HM in the ungauged regions of Shunchang and Zherong, the regionalization approach is used to estimate the model parameters, and river water stage data from five flood events, as well as reservoir water stage data from four flash flood events, are adopted to validate the models. The effectiveness of validations performed using river water stage data is better than that obtained using reservoir water stage data in terms of the difference in the timing of flood peaks. Inaccurate water stage and capacity relationships cause high uncertainty in validations performed using reservoir water stage data. In addition, accurate and timely warnings were provided for the flash flood that occurred on 28 September 2016 by the flash flood forecast and warning system based on the CNFF-HM, which provides further evidence that this system is effective and can be widely employed in China.
This study provides a methodology and a reference for providing forecasts and warnings of flash floods in ungauged mountainous regions, especially in humid southern China. However, its applicability in areas with different climates needs to be studied in the future. On the other hand, to perform model validation in ungauged regions, various types of data (e.g., discharge, water stage data, reservoir water stage data, tides, etc.) should be considered. The lead time of flash flood warnings will be improved by including rainfall forecasts, and the warnings will be more efficient.

Acknowledgments

This research is supported by the National Natural Science Foundation of China (project Nos. 51579131 and 51579248), the Flood Control, Drought Relief and Disaster Mitigation Project in Fujian, China, and China Institute of Water Hydropower Research (IWHR) Research & Development Support Program (project Nos. JZ0145B042016 and JZ0145B2017).

Author Contributions

All of authors contributed to the conception and development of this manuscript. Yali Wang carried out the analysis and wrote the paper. Ronghua Liu developed the CNFF-HM model and organized the project implementation. Liang Guo and Liuqian Ding designed the system framework and developed the project implementation plan. Jiyang Tian and Chuanhai Wang participated in the results analysis and paper correction. Xiaolei Zhang and Yizi Shang provided assistance in performing the calculations and producing the figures.

Conflicts of Interest

The authors declare no conflict of interest.

References

  1. Ministry of Water Resources the People’s Republic of China. Available online: http://www.mwr.gov.cn/english/ ( accessed on 18 February 2017).
  2. Ntelekos, A.A.; Georgakakos, K.P.; Krajewski, W.F. On the uncertainties of flash flood guidance: Toward probabilistic forecasting of flash floods. J. Hydrometeorol. 2006, 7, 896–915. [Google Scholar] [CrossRef]
  3. Montesarchio, V.; Lombardo, F.; Napolitano, F. Rainfall thresholds and flood warning: An operative case study. Nat. Hazards Earth Syst. Sci. 2009, 9, 135–144. [Google Scholar] [CrossRef]
  4. Wu, S.J.; Hsu, C.T.; Lien, H.C.; Chang, C.H. Modeling the effect of uncertainties in rainfall characteristics on flash flood warning based on rainfall thresholds. Nat. Hazards 2015, 75, 1677–1711. [Google Scholar] [CrossRef]
  5. Modrick, T.M.; Graham, R.; Shamir, E.; Jubach, R.; Spencer, C.R.; Sperfslage, J.A.; Georgakakos, K.P. Operational flash flood warning systems with global applicability. In Proceedings of the 7th International Congress on International Environmental Modelling and Software Society, San Diego, CA, USA, 15–19 June 2014; pp. 15–19. [Google Scholar]
  6. Alfieri, L.; Thielen, J.; Pappenberger, F. Ensemble hydro-meteorological simulation for flash flood early detection in southern Switzerland. J. Hydrol. 2012, 424, 143–153. [Google Scholar] [CrossRef]
  7. Feyen, L.; Vrugt, J.A.; Nualláin, B.Ó.; van der Knijff, J.; De Roo, A. Parameter optimisation and uncertainty assessment for large-scale streamflow simulation with the LISFLOOD model. J. Hydrol. 2007, 332, 276–289. [Google Scholar] [CrossRef]
  8. Javelle, P.; Demargne, J.; Defrance, D.; Pansu, J.; Arnaud, P. Evaluating flash-flood warnings at ungauged locations using post-event surveys: A case study with the AIGA warning system. Hydrol. Sci. J. 2014, 59, 1390–1402. [Google Scholar] [CrossRef]
  9. Javelle, P.; Organde, D.; Demargne, J.; Saint-Martin, C.; de Saint-Aubin, C.; Garandeau, L.; Janet, B. Setting up a French national flash flood warning system for ungauged catchments based on the AIGA method. In E3S Web of Conferences; Édition Diffusion Presse Sciences: Les Ulis, France, 2016; Volume 7, p. 18010. [Google Scholar]
  10. Demargne, J.; Javelle, P.; Organde, D.; de Saint Aubin, C.; Janet, B. Flash flood warnings for ungauged basins based on high-resolution precipitation forecasts. In EGU General Assembly Conference Abstracts; EGU General Assembly: Vienna, Austria, 2016; Volume 18, p. 10119. [Google Scholar]
  11. Gourley, J.J.; Flamig, Z.L.; Vergara, H.; Kirstetter, P.E.; Clark, R.A., III; Argyle, E.; Arthur, A.; Martinaitis, S.; Terti, G.; Erlingis, J.M.; et al. The FLASH Project: Improving the tools for flash flood monitoring and prediction across the United States. Bull. Am. Meteorol. Soc. 2017, 98, 361–372. [Google Scholar]
  12. Maidment, D.R. Conceptual Framework for the National Flood Interoperability Experiment. JAWRA J. Am. Water Resour. Assoc. 2017, 53, 245–257. [Google Scholar] [CrossRef]
  13. Michaud, J.; Sorooshian, S. Comparison of simple versus complex distributed runoff models on a midsized semiarid watershed. Water Resour. Res. 1994, 30, 593–605. [Google Scholar] [CrossRef]
  14. Delrieu, G.; Nicol, J.; Yates, E.; Kirstetter, P.E.; Creutin, J.D.; Anquetin, S.; Obled, C.; Payrastre, O. The catastrophic flash-flood event of 8–9 September 2002 in the Gard Region, France: A first case study for the Cévennes-Vivarais Mediterranean Hydrometeorological Observatory. J. Hydrometeorol. 2005, 6, 34–52. [Google Scholar] [CrossRef]
  15. Reed, S.; Schaake, J.; Zhang, Z. A distributed hydrologic model and threshold frequency-based method for flash flood forecasting at ungauged locations. J. Hydrol. 2007, 337, 402–420. [Google Scholar] [CrossRef]
  16. Blöschl, G.; Reszler, C.; Komma, J. A spatially distributed flash flood forecasting model. Environ. Model. Softw. 2008, 23, 464–478. [Google Scholar] [CrossRef]
  17. Miao, Q.; Yang, D.; Yang, H.; Li, Z. Establishing a rainfall threshold for flash flood warnings in China’s mountainous areas based on a distributed hydrological model. J. Hydrol. 2016, 541, 371–386. [Google Scholar] [CrossRef]
  18. Nguyen, P.; Thorstensen, A.; Sorooshian, S.; Hsu, K.; AghaKouchak, A.; Sanders, B.; Koren, V.; Cui, Z.; Smith, M. A high resolution coupled hydrologic-hydraulic model (HiResFlood-UCI) for flash flood modeling. J. Hydrol. 2016, 541, 401–420. [Google Scholar] [CrossRef]
  19. Sivapalan, M.; Takeuchi, K.; Franks, S.W.; Gupta, V.K.; Karambiri, H.; Lakshmi, V.; Liang, X.; Mendiondo, E.M.; O’connell, P.E.; Oki, T.; et al. IAHS Decade on Predictions in Ungauged Basins (PUB), 2003–2012: Shaping an exciting future for the hydrological sciences. Hydrol. Sci. J. 2003, 48, 857–880. [Google Scholar] [CrossRef]
  20. Dunn, S.M.; Lilly, A. Investigating the relationship between a soils classification and the spatial parameters of a conceptual catchment scale hydrological model. J. Hydrol. 2001, 252, 157–173. [Google Scholar] [CrossRef]
  21. Hrachowitz, M.; Savenije, H.H.G.; Blöschl, G.; McDonnell, J.J.; Sivapalan, M.; Pomeroy, J.W.; Arheimer, B.; Blume, T.; Clark, M.P.; Ehret, U.; et al. A decade of Predictions in Ungauged Basins (PUB)—A review. Hydrol. Sci. J. 2013, 58, 1198–1255. [Google Scholar] [CrossRef]
  22. Kay, A.L.; Jones, D.A.; Crooks, S.M.; Calver, A.; Reynard, N.S. A comparison of three approaches to spatial generalization of rainfall-runoff models. Hydrol. Process. 2006, 20, 3953–3973. [Google Scholar] [CrossRef]
  23. Li, H.; Zhang, Y.; Ao, T.; Zhang, X. Comparison of regionalization approaches for runoff prediction in free of observational data catchments. J. Yangtze River Sci. Res. Inst. 2010, 27, 11–15. (In Chinese) [Google Scholar]
  24. Swain, J.B.; Patra, K.C. Streamflow estimation in ungauged catchments using regionalization techniques. J. Hydrol. 2017. [CrossRef]
  25. Oudin, L.; Andréassian, V.; Perrin, C.; Michel, C.; Le Moine, N. Spatial proximity, physical similarity, regression and ungaged catchments: A comparison of regionalization approaches based on 913 French catchments. Water Resour. Res. 2008, 44, W03413. [Google Scholar] [CrossRef]
  26. Yang, X.; Magnusson, J.; Xu, C.Y. Runoff prediction in ungauged catchments in Norway: Comparing different regionalization approaches. In EGU General Assembly Conference Abstracts; European Geosciences Union General Assembly: Vienna, Austria, 2017; Volume 19, p. 3457. [Google Scholar]
  27. Norbiato, D.; Marco, B.; Roberto, D. Flash flood warning in ungauged basins by use of the flash flood guidance and model-based runoff thresholds. Meteorol. Appl. 2009, 16, 65–75. [Google Scholar] [CrossRef]
  28. Razavi, T.; Coulibaly, P. An evaluation of regionalization and watershed classification schemes for continuous daily streamflow prediction in ungauged watersheds. Can. Water Resour. J. Rev. Can. Des. Ressour. Hydr. 2017, 42, 2–20. [Google Scholar] [CrossRef]
  29. Ragettli, S.; Zhou, J.; Wang, H. Assessment of parameter regionalization methods for modeling flash floods in China. In EGU General Assembly Conference Abstracts; EGU General Assembly: Vienna, Austria, 2017; Volume 19, p. 8018. [Google Scholar]
  30. China Soil Database. Available online: http://vdb3.soil.csdb.cn/ (accessed on 1 October 2016).
  31. Ren-Jun, Z. The Xinanjiang model applied in China. J. Hydrol. 1992, 135, 371–381. [Google Scholar] [CrossRef]
  32. Jayawardena, A.W.; Zhou, M.C. A modified spatial soil moisture storage capacity distribution curve for the Xinanjiang model. J. Hydrol. 2000, 227, 93–113. [Google Scholar] [CrossRef]
  33. Cheng, C.T.; Ou, C.P.; Chau, K.W. Combining a fuzzy optimal model with a genetic algorithm to solve multi-objective rainfall-runoff model calibration. J. Hydrol. 2002, 268, 72–86. [Google Scholar] [CrossRef]
  34. Liao, S.L.; Li, G.; Sun, Q.Y.; Li, Z.F. Real-time correction of antecedent precipitation for the Xinanjiang model using the genetic algorithm. J. Hydroinform. 2016, 18, 803–815. [Google Scholar] [CrossRef]
  35. Maidment, D.R. Developing a spatially distributed unit hydrograph by using GIS. IAHS Publ. 1993, 181. [Google Scholar]
  36. Maidment, D.R.; Olivera, F.; Calver, A.; Eatherall, A.; Fraczek, W. Unit hydrograph derived from a spatially distributed velocity field. Hydrol. Process. 1996, 10, 831–844. [Google Scholar] [CrossRef]
  37. Cunge, J.A. On the subject of a flood propagation computation method (Musklngum method). J. Hydraul. Res. 1969, 7, 205–230. [Google Scholar] [CrossRef]
  38. Song, X.; Kong, F.; Zhu, Z. Application of Muskingum routing method with variable parameters in ungauged basin. Water Sci. Eng. 2011, 4, 1–12. [Google Scholar]
  39. Wilson, B.N.; Ruffini, J.R. Comparison of physically-based Muskingum methods. Trans. ASABE 1988, 31, 91–97. [Google Scholar] [CrossRef]
  40. Nash, J.E.; Sutcliffe, J.V. River flow forecasting through conceptual models part I—A discussion of principles. J. Hydrol. 1970, 10, 282–290. [Google Scholar] [CrossRef]
  41. Yuan, X.; Liu, Y.; Huang, Y. An approach to quality validation of large-scale data from the Chinese Flash Flood Survey and Evaluation (CFFSE). Nat. Hazards 2017, 2. [Google Scholar] [CrossRef]
  42. Thompson, D.B. The Rational Method, regional regression equations, and site-specific flood-frequency relations. Tex. Depart. Trans. 2006, 8–13. [Google Scholar]
  43. Sun, D.; Zhang, D.; Cheng, X. Framework of national non-structural measures for flash flood disaster prevention in china. Water 2012, 4, 272–282. [Google Scholar] [CrossRef]
  44. Merz, R.; Blöschl, G. Regionalization of catchment model parameters. J. Hydrol. 2004, 287, 95–123. [Google Scholar] [CrossRef]
Figure 1. Locations of the study areas (A); and the locations of the hydrological stations and catchments in: Shunchang (B); and Zherong (C).
Water 09 00776 g001
Figure 2. Diagram of model elements and their topological relationships.
Water 09 00776 g002
Figure 3. Structure of the process by which saturation excess runoff is produced.
Water 09 00776 g003
Figure 4. Schematic of the flash flood warning system technical components.
Water 09 00776 g004
Figure 5. Summary of the performances of the CNFF-HM in five data-rich catchments.
Water 09 00776 g005
Figure 6. Verification results of five flash flood events using river water stage data: (a) Verification result of Zhengfang 20160508 event; (b) Verification result of Zhengfang 20160618 event; (c) Verification result of Renshou 20160709 event; (d) Verification result of Renshou 20160915 event; (e) Verification result of Zhongyutian 20160915 event.
Water 09 00776 g006
Figure 7. Verification results of four flash flood events using reservoir water stage data: (a) Verification result of Longxi 20160915 event; (b) Verification result of Longxi 20160928 event; (c) Verification result of Qinglan 20160915 event; (d) Verification result of Qinglan 20160928 event.
Water 09 00776 g007
Figure 8. Rainfall map in Zherong on 28 September from 7:00 to 13:00.
Water 09 00776 g008
Figure 9. Warning map from 8:00 to 13:00 on 28 September 2016.
Water 09 00776 g009
Table 1. Characteristics of the study area.
Study AreaArea (km2)Annual Rainfall (mm)Forest Coverage (%)Clay Loam Coverage (%)Slope
Shunchang1985175676%65%0.41
Zherong538203568%87%0.43
Siqian139186477%89%0.44
Qigu89174275%88%0.46
Xiaoanxia14170073%90%0.39
Tangkou240185478%80%0.38
Qibu129206572%73%0.34
Table 2. Available hydrometeorological data.
Data TypeCatchmentStation NameData PeriodFlood Events
DischargeSiqianSiqian1971–199269
QiguQigu1987–19904
XiaoanxiaXiaoanxia1986–19927
TangkouTangkou1972–200225
QibuQibu1985-201226
River water stageZhengfangZhengfangJuly 2016–September 20162
RenshouRenshou-sMay 2016–June 20162
ZhongyutianZhongyutianSeptember 20161
Reservoir water stageLongxiLongxiSeptember 20162
QinglanQinglanSeptember 20162
Table 3. Performances of the discharge simulations in data-rich catchments.
CatchmentAverage NSE E Q ¯ (%) E R ¯ (%) D T ¯ (h)
Siqian0.97.3981.01
Qigu0.78816.020.25
Xiaoanxia0.878.8910.830.64
Tangkou0.7710.4811.311.4
Qibu0.75.767.871.29
Table 4. Results of catchment/region similarity.
φSiqianQiguXiaoanxiaTangkouQibuShunchangZherong
Siqian00.771.350.962.551.671.58
Qigu0.77011.582.851.421.88
Xiaoanxia1.35101.422.271.591.97
Tangkou0.961.581.4201.821.372.23
Qibu2.552.852.271.8202.211.78
Shunchang1.671.421.591.372.2102.66
Zherong1.581.881.972.231.782.660
Table 5. Donor catchments for ungauged regions.
Ungauged RegionDonor Catchments (√ = YES, × = NO)
SiqianQiguXiaoanxiaTangkouQibu
Shunchang×
Zherong×
Table 6. Hydrological parameters used in the CNFF-HM.
ModuleParameterParameter MeaningParameter Value for ShunchangParameter Value for Zherong
Evapotranspiration moduleKCCoefficient of evapotranspiration0.90.9125
UMAverage soil moisture storage capacity of the upper layer (mm)2020
LMAverage soil moisture storage capacity of the middle layer (mm)6060
DMAverage soil moisture storage capacity of the deep layer (mm)4040
CCoefficient of deep layer0.110.11
ECDaily mean evaporation (mm)1010
Runoff production module (saturation excess runoff production)BExponent parameter0.2750.275
IMPPercentage of impervious areas in the catchment (%)0.00750.01
SMStorage of surface free water (mm)32.535
EXExponent of the free water capacity curve1.2751.2
KSOutflow coefficients of surface free water to interflow relationship0.450.425
KGOutflow coefficients of surface free water to groundwater relationship0.3750.3925
KKSRecession constants of the interflow storage0.20.225
KKGRecession constants of the groundwater storage0.10.225
Table 7. Model verification performance using river water stage data.
CatchmentFlood Event D T (h)
Renshou201605081
201606180
Zhengfang201607090
201609150
Zhongyutian201609150
Table 8. Model verification performance using reservoir water stage data.
ReservoirFlood Event D w (m) D T (h)
Longxi20160915−0.0130.5
20160928−0.30.5
Qinglan20160915−0.20
20160928−0.40

