Reactive Transport Modeling for Mobilization of Arsenic in a Sediment Downgradient from an Iron Permeable Reactive Barrier


1
Department of Earth and Environmental Sciences, Chonbuk National University, Jeonju-si, Jeollabuk-do 54896, Korea
2
The Earth and Environmental Science System Research Center, Chonbuk National University, Jeonju-si, Jeollabuk-do 54896, Korea
Water 2017, 9(11), 890; https://doi.org/10.3390/w9110890
Submission received: 2 October 2017
/
Revised: 3 November 2017
/
Accepted: 11 November 2017
/
Published: 14 November 2017
(This article belongs to the Special Issue Heavy Metals and Potentially Toxic Elements (PTEs) in Water)
Abstract
:Arsenic (As) can be naturally present in the native aquifer materials and can be released to groundwater through reduction dissolution of iron oxides containing As. While granular iron permeable reactive barriers (PRBs) can be effective for the treatment of arsenic in groundwater, the mobilization of arsenic in the sediment downgradient of the PRB might be an issue due to the reduced geochemical conditions generated by reactions in the PRB. The release of arsenic in the sediment downgradient from a proposed iron PRB was studied through laboratory column experiments and reactive transport modeling. The laboratory column experiments showed a significant removal of arsenic from the groundwater by granular iron (from the influent concentration of about 0.7 mg L−1 to less than 0.006 mg L−1 at the effluent); however, arsenic can be flushed out from the aquifer sediments (up to 0.09 mg L−1). The reactive transport modeling based on the geochemical reactions as suggested from the experiments, i.e., reductive dissolution of As-bearing goethite, was successful to reproduce the observed geochemical trends in the column experiments. This study can provide implications regarding the installation of iron PRBs to treat arsenic in groundwater and also be useful to understand geochemical behavior of arsenic under reduced conditions.
1. Introduction
Arsenic is naturally present in a variety of rocks and minerals, including sulfides, oxides, and hydroxides [1,2]. Especially, mineral deposits that are associated with gold (e.g., pyrite and arsenopyrite) and sedimentary rocks (e.g., marine shales) are sources of arsenic in groundwater [3,4]. Anthropogenic sources include mine sites, combustion of coal, and wood treatment [2].
Arsenic contamination of groundwater water is identified in many countries, such as Bangladesh [5,6], China [7], and Nepal [8]. Acute and chronic effects from arsenic exposure include several cancers (e.g., skin, lung, liver, bladder, etc.), skin disorders (e.g., melanosis and keratosis), cardiovascular disease, diabetes, and reproductive effects [9,10].
Arsenic is released through sulfide mineral oxidation (e.g., arseno-rich pyrite, arsenopyrite), desorption (increase in pH), and reductive dissolution of arsenic-bearing Fe(III) and Mn(IV) oxyhydroxides [11,12,13]. Options to avoid potential problems related to arsenic intake from groundwater may include avoiding locating wells in high As regions, to use alternative water sources (e.g., surface water sources), and to treat groundwater contaminated with arsenic.
Regarding treatment options for As-contaminated groundwater, permeable reactive barriers (PRBs) have been suggested to be an effective remediation technology [14]. PRBs have been proven to be effective not only for inorganic contaminants including arsenic [15,16,17,18], but also for many organic contaminants [19,20]. Particularly, granular iron (commonly referred as zero-valent iron (ZVI)) has been the most commonly used reactive material in PRBs. Arsenic was removed through the precipitation of ferrous arsenate and adsorption to iron oxide and iron sulfide surfaces [21].
Besides the treatability of iron PRBs with regard to contaminants, typical geochemistry downgradient of PRBs are characterized by high pH (~10), low Eh, and high alkalinity due to reduction of granular iron, generating H2 gas and hydroxide [16,22]. While these geochemical conditions downgradient from PRBs may be quickly stabilized to the original groundwater conditions [23], one of concerns regarding treatment of arsenic is that the reduced geochemical conditions downgradient from PRBs may contribute to the mobilization of arsenic that is present in the background aquifer materials.
This study evaluated the potential release of arsenic in a sediment downgradient of a proposed iron PRB to treat groundwater that is contaminated with arsenic. In the study site, laboratory treatability testing simulating the proposed iron PRB suggested an effective treatment of arsenic in groundwater; however, a concern remained with regard to mobilization of arsenic in the native aquifer materials downgradient from the proposed PRB, which may be caused by the reduced groundwater generated by reactions in the PRB. Arsenic may be present in mineral form within the aquifer sediments or as sorbed species that are associated with the grain surfaces or coatings on the surfaces of the aquifer sediments.
The purpose of this study was to evaluate the mobilization of As in the sediment caused by effluent of an iron PRB through laboratory column experiments and reactive transport modeling. The laboratory column experiments were performed using granular iron materials as well as site aquifer materials and groundwater. At the conclusion of the laboratory column experiments, the collected geochemical data were used to set up a site-specific reactive transport model. Numerical simulations were then performed to predict the spatial and temporal As concentration trends downgradient of the proposed iron PRB. An evaluation of mobilization of arsenic in aquifers containing As-bearing minerals not only can provide information that is directly relevant to the application of PRBs to particular sites but also can be useful to understand geochemical behavior of arsenic in sediments under reduced conditions.
2. Methods
2.1. Laboratory Column Experiments
2.1.1. Materials
The soil cores of representative aquifer material were collected from the potential site for the PRB installation. The cores were collected and shipped to the laboratory in sealed plastic core barrels. The core barrels were capped and sealed immediately following collection to minimize the interaction between atmospheric oxygen with the aquifer material. The cores were stored and shipped at about 4 °C. Aquifer materials from a core with depth of 12.2 to 13.4 m and from another core with depth of 12.2 to 13.4 m were used. These cores were obtained from approximately 180 m upgradient of the proposed location of the PRB. At the laboratory, the core barrels were cut in half, capped, and immediately transferred to an anaerobic chamber. Inside the chamber, core material was extruded and re-packed in two columns.
Separate columns containing granular iron, obtained from Connelly-GPM of Chicago, IL, USA (ETI CC-1004), were prepared to condition the groundwater of the site prior to its introduction to each of the aquifer columns. Influent water to the granular iron columns was the groundwater, which was collected and shipped to the laboratory. The groundwater was stored at 4 °C until it was used at the laboratory.
The effluent from two granular iron columns was pumped through the two native aquifer columns using a single multi-channel pump. The quality of the groundwater and the water entering, within and being discharged from the aquifer columns was monitored for a period of three months.
2.1.2. Column System
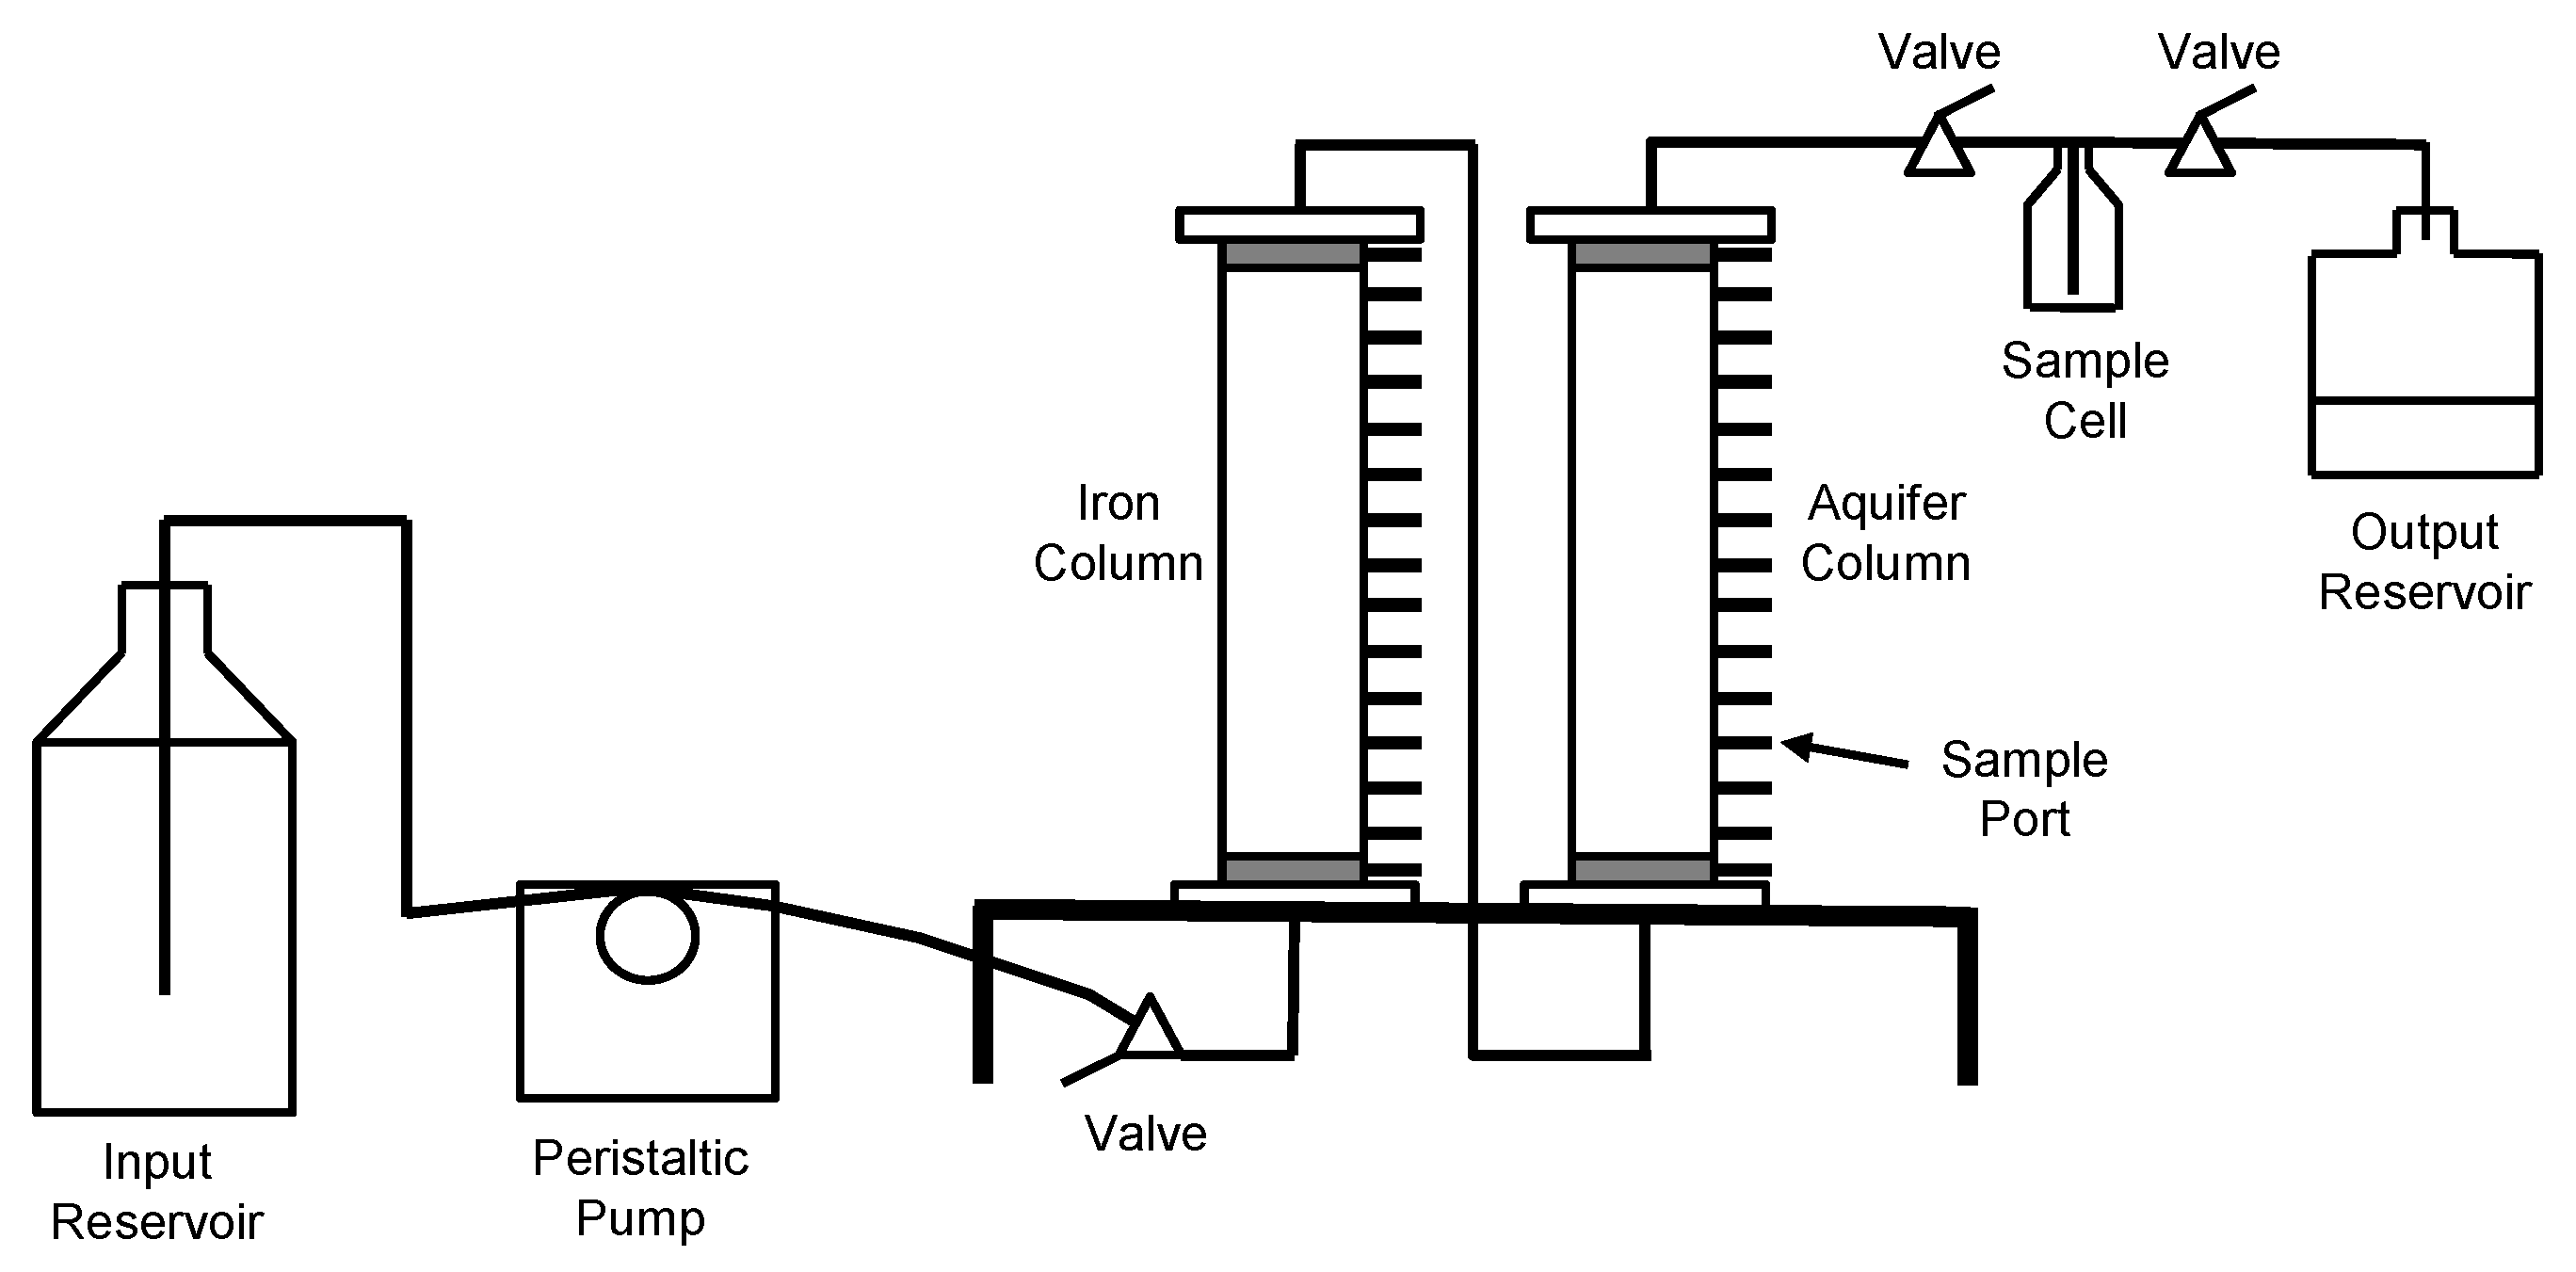
A representative column apparatus is shown schematically in Figure 1. Each column consisted of a plexiglass tube, 0.4 m long with an internal diameter of 51 mm, which was fitted with top and basal plates. There were two ports on both the top and basal plates of the column. Each port consisted of a threaded nylon fitting, to which a length of Teflon® tubing was attached. There were 15 sample ports that were spaced equally along the length of the column. These ports consisted of small threaded nylon connectors. Syringe needles, which had been partially filled with glass wool, were inserted through these ports to the column interior. The base of each needle was sealed by a plug, which could be removed for sampling.
The column contents included a basal sand filter zone (washed silica sand, 20 to 30 US Standard Mesh; 0.64 to 0.85 mm), a predominant central zone containing granular iron or the aquifer material, and an upper sand filter zone adjacent to the top plate. The columns were filled in a vertical position and the contents were gently tapped into place as they were added. The mass of the column was measured after each portion of its contents was added. The granular iron was added in a dry state as received from the vendor. The aquifer materials were added directly from the core barrels. Samples of the aquifer materials were set aside for moisture content measurements.
De-aired nanopure de-ionized water was introduced to the columns prior to initiating the flow of the groundwater of the site. The pore volume of each column was determined by comparing the masses prior to and after the addition of water. The moisture content of the aquifer materials was considered in the estimate of pore volumes for the aquifer columns. For the experiment, the groundwater of the site was introduced to the basal plate of the granular iron columns (Columns CA and CB) by using a multi-channel, low-flow peristaltic pump. The aquifer columns (Columns AA and AB) received the effluent from the granular iron columns. The effluent from Column CA was directed through Column AA, and the effluent from Column CB was directed through Column AB. Three-way valves were inserted in the lines that were connecting the granular iron and aquifer columns. These facilitated the collection of influent samples to the aquifer columns. The effluent lines from the two aquifer columns (Columns AA and AB) had in-line glass sample cells to facilitate the collection of effluent samples. The discharge from the sample cells was directed to separate wastewater containers. The groundwater vessel, the granular iron columns, three-way valves, and wastewater containers were situated on the laboratory bench. The aquifer columns and sample cells were set up inside an anaerobic chamber. The tubes from the iron columns to the aquifer columns and the tubes from the sample cells to the wastewater containers passed through the walls of the anaerobic chamber through airtight ports. The column experiment was conducted at room temperature (23 °C). The characteristics of the granular iron columns (Columns CA and CB) and the aquifer columns (Columns AA and AB) are summarized in Table 1.
2.1.3. Column Operation
Flow of the groundwater to the granular iron columns (Columns CA and CB) was initiated during a several hour period on a day. Then, the effluent from Column CA was introduced to aquifer Column AA and the effluent from Column CB was introduced to aquifer Column AB. Flow rates were determined by measuring the mass of water that was discharged to the wastewater containers as a function of time, and accounting for the volume of water removed from the two sets of columns during the sample collection process. The flow rate was regulated on the basis of the pore volumes of the aquifer columns.
Flow rates through granular iron Column CA and aquifer Column AA typically ranged from between 50 and 150 mL per day. Consequently, the residence time of effluent from Column CA in Column AA generally exceeded 1.6 days. Total flow through Column AA was approximately 41 pore volumes (9.87 L) during the operation period. Similar flow rates were achieved in granular iron Column CB and aquifer Column AB, and the residence time of effluent from Column CB in Column AB was generally about two days. Total flow through Column AB during the operation period was approximately 32 pore volumes (8.78 L). The flow rates through the two sets of columns (Columns CA and AA; Columns CB and AB) were consistent and were maintained through separate channels of a single pump.
2.1.4. Sampling and Analyses
The samples of the groundwater and the effluent from the granular iron columns were collected in conjunction with samples from the column ports (pore water) and effluent from the aquifer columns. Due to the limited flow through the columns, sampling of effluent from the granular iron columns and individual ports required a period of several to as much as eight hours to collect to generate sufficient volumes of water for chemical analyses. While these samples were being collected, flow through the portion of the column system downstream of the sample location (valve or port) was temporarily blocked. The groundwater, iron-column effluent, and aquifer-column-port samples were collected in a glass syringe, and were re-apportioned into specific sample containers as necessary. For the portions that required filtration, this was achieved using a 0.45 μm acetate syringe filter.
The pH and Eh were measured in the laboratory immediately following sample collection, each requiring several milliliters of unfiltered water. The pH was measured using a Ross combination electrode (815600; Thermo Scientific, Beverly, MA, USA) calibrated with standard buffer solutions at pH 7, 4, and 1. Eh measurements were made using an Orion platinum redox electrode (model 96-78BN; Thermo Scientific, Beverly, MA, USA) that was checked in Light’s solution and Zobell solution. A single point calibration was used for the oxidation-reduction potential (ORP) meter each time, providing Eh values. Alkalinity measurements were made using a Hach digital titrator on filtered samples that were titrated with 0.16 N H2SO4, using bromocresol green-methyl red indicator. For As(III) and As(V) determinations, total arsenic and As(III) were analyzed by hydride generation atomic absorption (AA; Perkin Elmer PinAAcle 900T; Perkin Elmer, Waltham, MA, USA) and As(V) was calculated by the difference. Detection limit for As(III), As(V), and total As was 0.001 mg L−1. The major cations and metals were analyzed by Inductively Coupled Plasma-Mass Spectrometry (ICP-MS; Thermo Scientic XSeries 2; Thermo Scientific, Waltham, MA, USA) (EPA Method 6010), and the major anions were analyzed by Ion Chromatography (IC; Dionex DX 600; Thermo Scientific, Waltham, MA, USA) (EPA Method 9056). Detection limits for each parameter are provided in Table 2. Detailed geochemical profiles as a function of distance through each of the two columns were determined at approximately 40 to 42 pore volumes for Column AA and 32 to 44 pore volumes for Column AB.
Acid-leach tests were performed on representative samples of aquifer materials that were used for filling Column AA and Column AB. Hydrochloric acid (HCl 36–37%) was used for the leaching tests. The tests were conducted in triplicates, and involved the introduction of 1 g of solid material to 20 mL of acid. A 24-h test was conducted using 0.5 M HCl and a 6-h leach test was conducted using 5 M HCl. The extraction fluid was analyzed for total arsenic by hydride generation AA.
2.2. Reactive Transport Modeling
The aquifer column data were evaluated using the geochemical reaction-groundwater transport model MIN3P [24]. In MIN3P, reactions can be defined as equilibrium reactions or kinetically controlled reactions. MIN3P has been successfully used to interpret the multicomponent geochemical changes, including Ni reduction by granular iron [25], effects of chromate [26] and nitrate [27] on TCE degradation, and geochemical interactions of mine seepage water with an aquifer [28]. In this study, the database of MIN3P was modified to include the proposed reaction for the arsenic release from the aquifer sediments. Minerals that were identified as potentially important by the speciation calculations were also included. The column data were simulated in the one-dimensional case in the principal direction of groundwater flow.
The aquifer column and acid-leach tests suggested that the release of As from the aquifer sediments could be due to the reductive dissolution of iron oxides, which contain small amounts of As. Assuming that iron oxides can be represented by goethite, the reaction for oxidation of dissolved hydrogen combined with reductive dissolution of goethite containing As can be written as:
FeOOH·0.0017H3AsO3 + ½H2(aq) + 2H+ → Fe2+ + 2H2O + 0.0017H3AsO3
The stiochiometric coefficient of H3AsO3 (0.0017) was obtained by calibration to reproduce the maximum concentration of As in the column effluents. The volume fraction of the mineral (0.003) was calculated based on the acid-leach test (the maximum As/aquifer material ratio of 8.0 mg kg−1).
The rate expression for dissolution-precipitation of minerals is described as follows:
where is the effective rate constant for the dissolution of mineral phase i (mol m−2 s−1), is the reactive surface area of mineral phase i (m2 L−1 bulk), and and are the ion activity product and the corresponding equilibrium constant for mineral dissolution-precipitation reactions, respectively. The equilibrium constant for As-bearing goethite was estimated from the equilibrium constant for reductive dissolution of goethite combined with oxidation of H2(aq) (log K = −28.9600), which was calculated based on redox half reactions, as reported by Stumm and Morgan [29]. The reactive surface area of the As-bearing goethite (1.0 × 10⁻¹ m2 L−1 bulk) was taken from that of goethite, which was estimated by Mayer et al. [23]. The rate constant (log = −8.2757 mol m−2 s−1) was adjusted to approximately reproduce the dissolved Fe and As concentrations for the column data. The reactive surface area was updated using a two-thirds power-relationship [24] to account for the reactivity change due to the depletion of the mineral.
As additional mineral phases, Fe(OH)2(s), siderite, and calcite was included as possible secondary minerals for the simulation. Aqueous complexes of As(III), such as H3AsO3, H2AsO3−, HAsO32−, and AsO33−, from MINTEQA2 database [30], were also included for appropriate determination of the mineral solubility. The chemical composition (Table 2) and pH (10.56) of the water leaving the iron column (Column AA) was used as the influent boundary conditions. The concentration of H2(aq) leaving the iron column was assumed to be the maximum solubility (1.5 mg L−1).
To represent the column system, one-dimensional discretization was used, with a spatial discretization interval of 0.01 m for the 0.4 m long column, giving a total of 41 grid points. The initial porosity (0.28) was taken from the column data (Column AA), and the hydraulic conductivity was assumed to be 1.0 × 10⁻⁴ m s−1 [31], although the value is not critical to the simulation results as long as the flow velocity is the same as the condition in the column experiment. The groundwater velocity was set to be 0.1 m day−1, as calculated from the column experiment. A diffusion coefficient of 1.5 × 10⁻⁹ m2 s−1 and longitudinal dispersivity of 9.9 × 10⁻⁴ m, as in Jeen et al. [32], were used for the transport parameters.
3. Results and Discussion
3.1. Column Experiments
3.1.1. Arsenic Concentrations
The influent groundwater contained around 0.7 mg L−1 arsenic. Arsenic concentrations in the effluent of the iron columns (and influent of the aquifer column) were low, ranging from less than 0.12 mg L−1 during the initial week of flow to less than 0.02 mg/L after one month. Beyond this period, arsenic concentrations in the effluent from the granular iron columns ranged between 0.002 and 0.006 mg L−1. When the arsenic concentrations were above 0.01 mg L−1, As(V) was the dominant valence state. As(III) and As(V) were present at similar levels when total arsenic concentrations were less than 0.006 mg L−1.
Arsenic concentrations in the aquifer column effluents were initially several hundred micrograms per liter (up to 0.264 mg L−1 and 0.353 mg L−1 in Columns AA and AB, respectively), but these tended to decrease with time. After two months of flow (18 pore volumes), the total arsenic concentrations in the aquifer column effluents were less than 0.1 mg L−1. The analyses indicated that As(III) and As(V) were present in the aquifer column effluents, with As(III) comprising between approximately 33% and 67% of the total arsenic concentration.
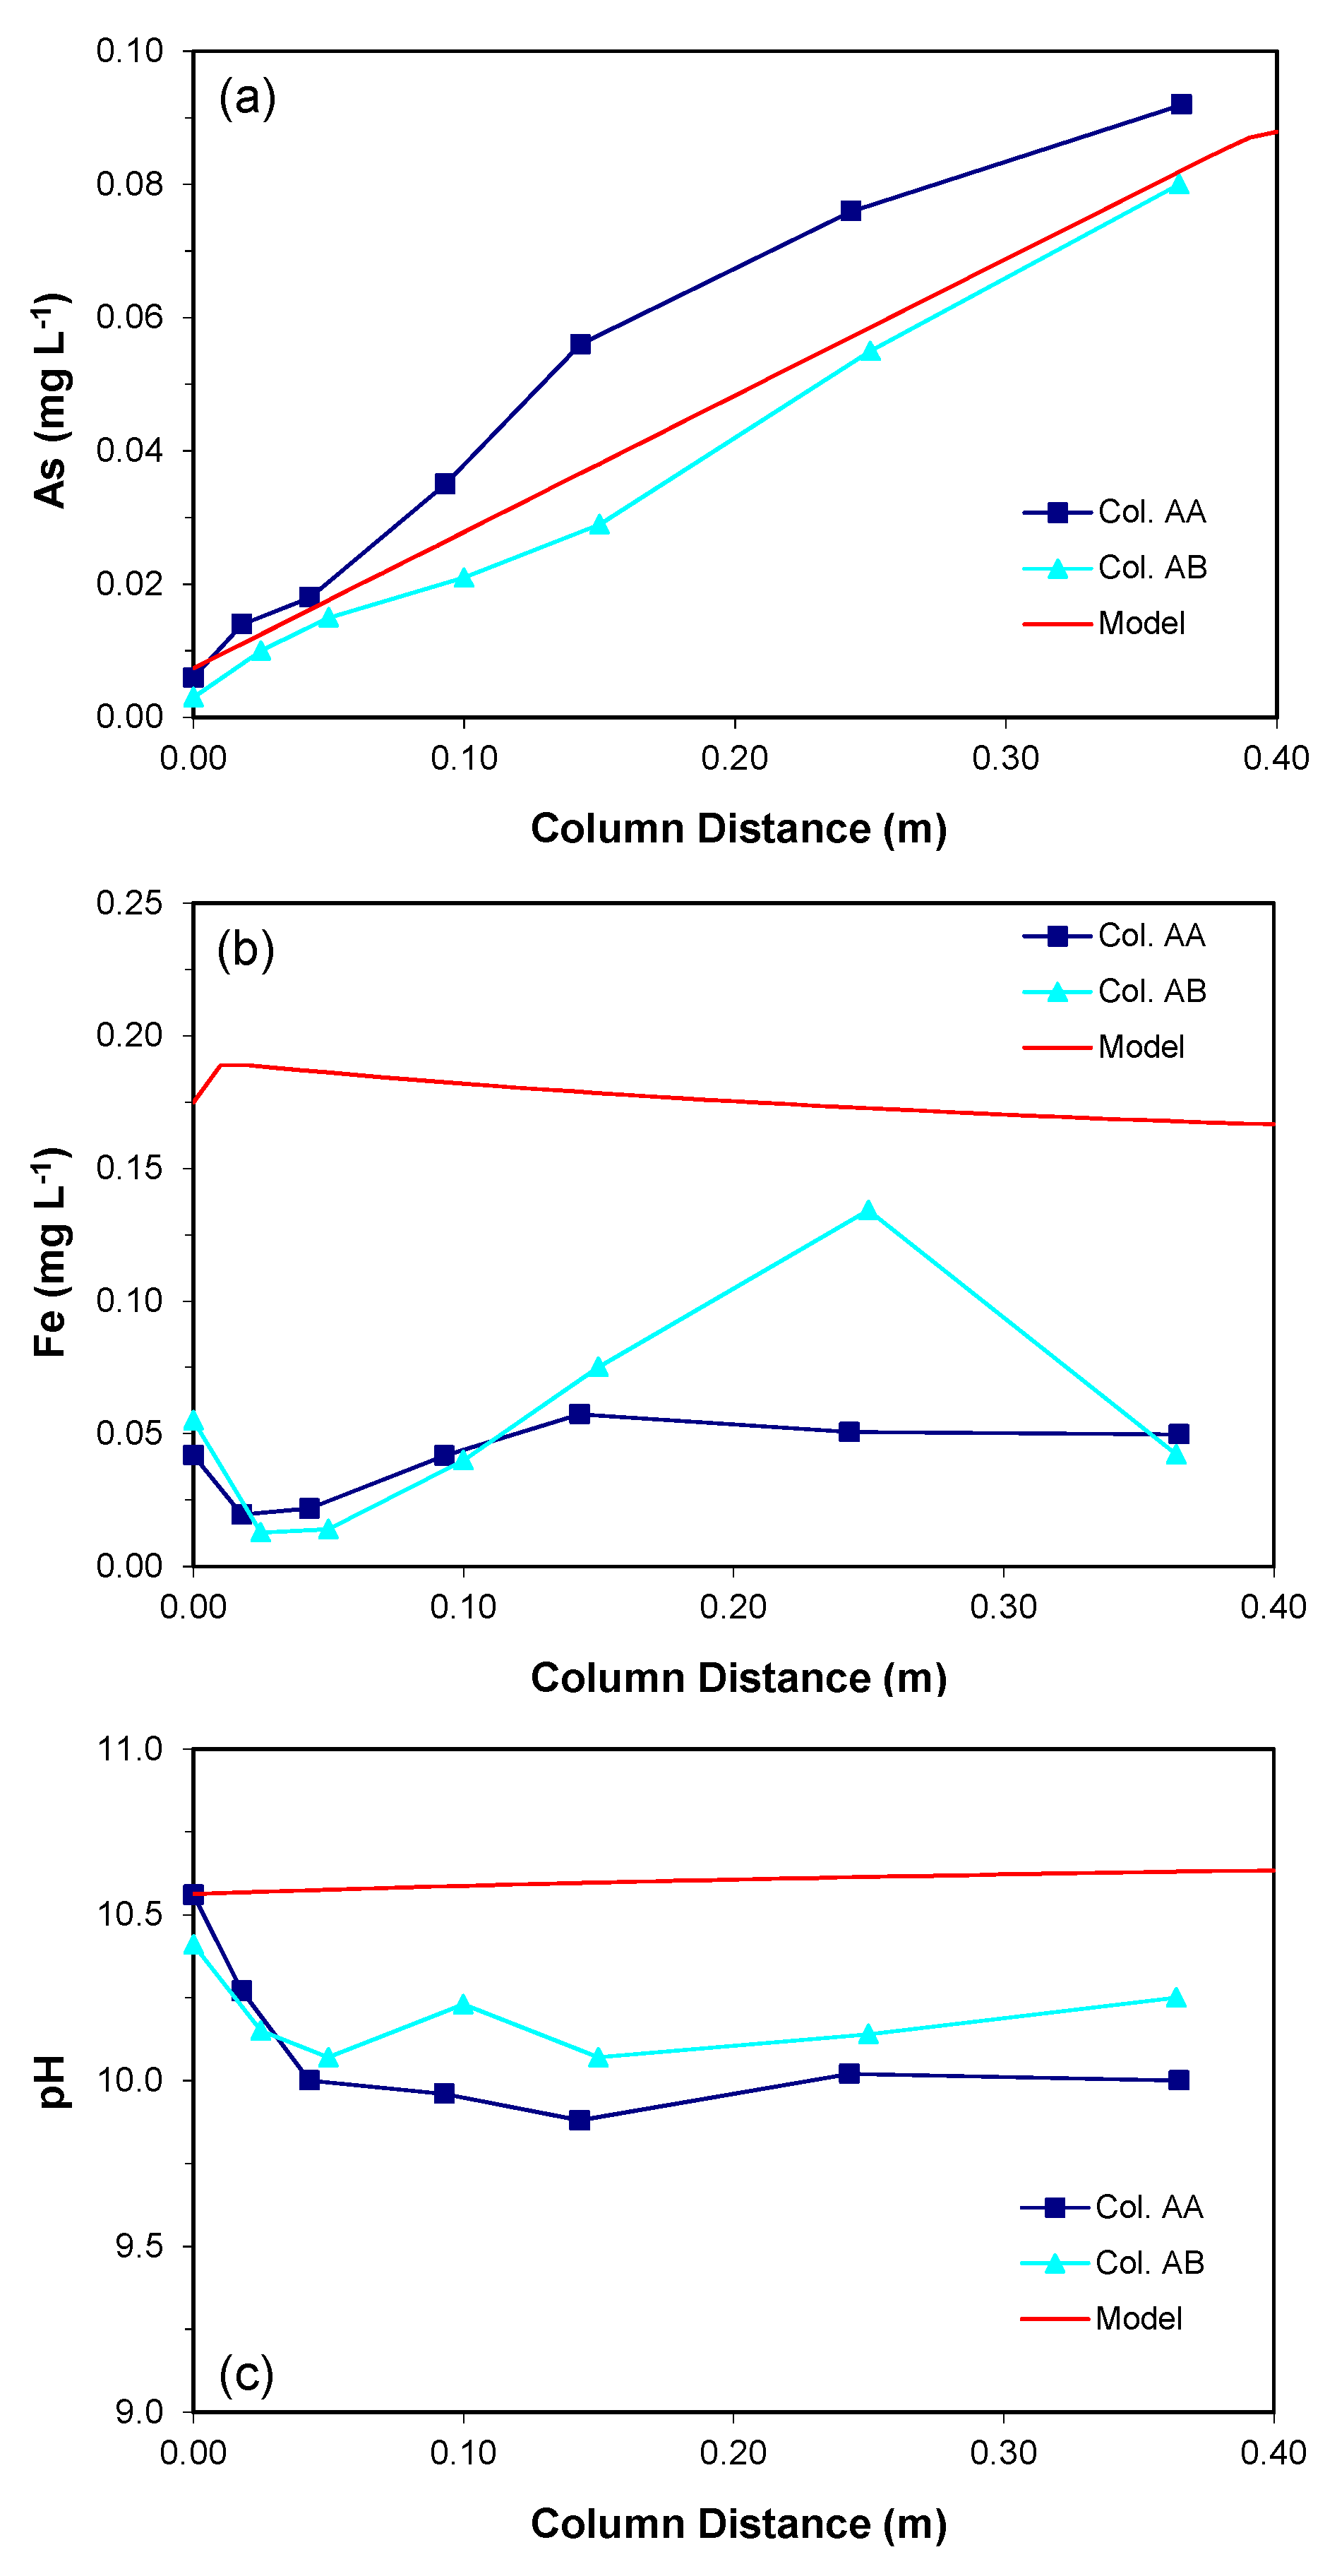
Dissolved arsenic concentrations profiles along both aquifer columns were collected at the end of the test period and are shown in Figure 2a. A gradual increase in arsenic concentration was observed along the distance of both columns, from influent values of about 0.005 mg/L to about 0.08 mg/L in the column effluents. The observed increase is attributed to the leaching of arsenic from aquifer sediments.
The results of the weak and strong acid-leach tests on aquifer sediments showed that for the test on the aquifer materials that were used in Columns AA and AB, the solid-phase concentrations of arsenic were 4.5 and 4.6 mg kg−1 in the 0.5 M HCl (24-h) test and 6.5 and 8.0 mg kg−1 in the 5 M HCl (six-hour) test. The corresponding iron solid-phase concentrations were 1.6 and 1.4 g kg−1 in the 0.5 M HCl (24-h) test and 2.5 and 2.8 g kg−1 in the 5 M HCl (6-h) test. Based on the obtained results, it was postulated that the major mechanism of arsenic mobilization from the aquifer materials was reductive dissolution of iron minerals containing natural levels of arsenic. The results of the leaching tests were used in reactive transport simulations.
3.1.2. Water Chemistry
The pH of the groundwater entering the granular iron columns ranged from 8.1 to 8.6, Eh between 283 and 530 mV, and alkalinity ranging from 130 to 303 mg L−1 (as CaCO3). The groundwater contained about 0.7 mg L−1 arsenic, approximately 30 mg L−1 of fluoride and sulfate, and between 13 and 15 mg L−1 chloride. The dominant cation was sodium (~125 to 140 mg L−1). As(V) was the dominant valence state, comprising between 75% and 95% of the total arsenic.
The effluent from the granular iron columns exhibited an increased pH, decreased Eh, and slightly increased alkalinity relative to the groundwater of the site. pH ranged from 9.5 to 10.6. Eh ranged from 69 to 485 mV. It is well documented that the corrosion of granular iron in the presence of groundwater causes elevated pH and strongly reducing conditions (Eh < 0 mV) to develop within laboratory columns and/or field-scale PRB systems [22,33,34]. The Eh values measured in the iron columns in this study did not reflect these conditions, and were likely an artifact of sample collection and measurement rather than actual conditions in the iron columns. Thus, for the purposes of the reactive transport modeling, hydrogen gas was assumed to be present within the granular iron, and Eh values were estimated under the assumption of equilibrium between the H2 gas and H+ redox couple.
For the effluent from the granular iron columns, alkalinity initially exceeded 1000 mg L−1 (as CaCO3), and decreased to between 50 and 300 mg L−1 (as CaCO3) after more than a month of flow. Initially, sulfate concentrations in the effluent of granular iron columns exceeded those in the groundwater (in excess of 100 mg L−1), but decreased to levels similar to the groundwater concentrations (~30 mg L−1) within two weeks of flow. Chloride concentrations were also higher in the granular iron column effluent than in the groundwater (as much as 50 mg L−1), but these also decreased with time. Sodium concentrations increased to as much as 1000 mg L−1 in the pore volume of flow in association with the elevated concentrations of sulfate and chloride, but decreased to influent levels after several weeks of flow.
In general, the effluents from the aquifer columns exhibited similar geochemical characteristics to the effluent from the granular iron columns. There was little attenuation of pH and the concentrations of sodium and the major anions (sulfate, chloride, and fluoride) are similar. Table 2 summarizes a detailed inorganic chemistry along the two columns systems, including the influent groundwater, the effluents of the iron columns (used as influents of the aquifer columns), and the effluents of the aquifer columns.
3.2. Reactive Transport Modeling
3.2.1. Column Data
The concentration profiles of the one-dimensional reactive transport simulations were compared to the measured dissolved concentrations of As, Fe, and pH along the length of the aquifer columns at the simulation time of 90 days, which is the same operation period of the column experiments.
With the given equilibrium constant (log K = −28.9600), the simulated As concentration increased linearly along the length of the column (Figure 2a). The slope of the increase was determined by the stiochiometric coefficient of H3AsO3 and rate constant for the proposed reaction. By adjusting the stiochiometric coefficient and rate constant to reproduce the As concentrations that were observed in the column experiments, respectively, the maximum As concentration was 0.09 mg L−1 at the effluent end of the column. The proposed reaction generated 3-orders of magnitude higher Fe concentration than As concentration without considering Fe-consuming reactions; however, consideration of precipitation of two Fe-containing minerals, Fe(OH)2(s) and siderite, controlled the dissolved Fe concentrations. The resulting Fe concentration within the column was still about 2–3 times higher than the measured values (Figure 2b); however, when considering the potential 3-orders of magnitude higher Fe concentration, as expected by the proposed reaction stoichiometry, the difference in Fe concentration was considered to be not significant.
About 40% of the simulated influent H2(aq) was consumed within the column (not shown) due to the oxidation of H2(aq) combined with the reductive dissolution of the As-bearing goethite, indicating that the decrease in H2(aq) concentration is relatively fast. The simulation of pH was not satisfactory (Figure 2c). While the measured profiles show a slight decrease in pH (pH of 0.5) within the column, the simulated pH profile shows a very slight increase. None of the potentially important secondary mineral phases could be identified as a pH-controlling mineral. It is speculated that some unidentified acid-generating reactions in the aquifer sediments contributes to the observed pH decrease.
3.2.2. Prediction along the Downgradient of the Proposed PRB
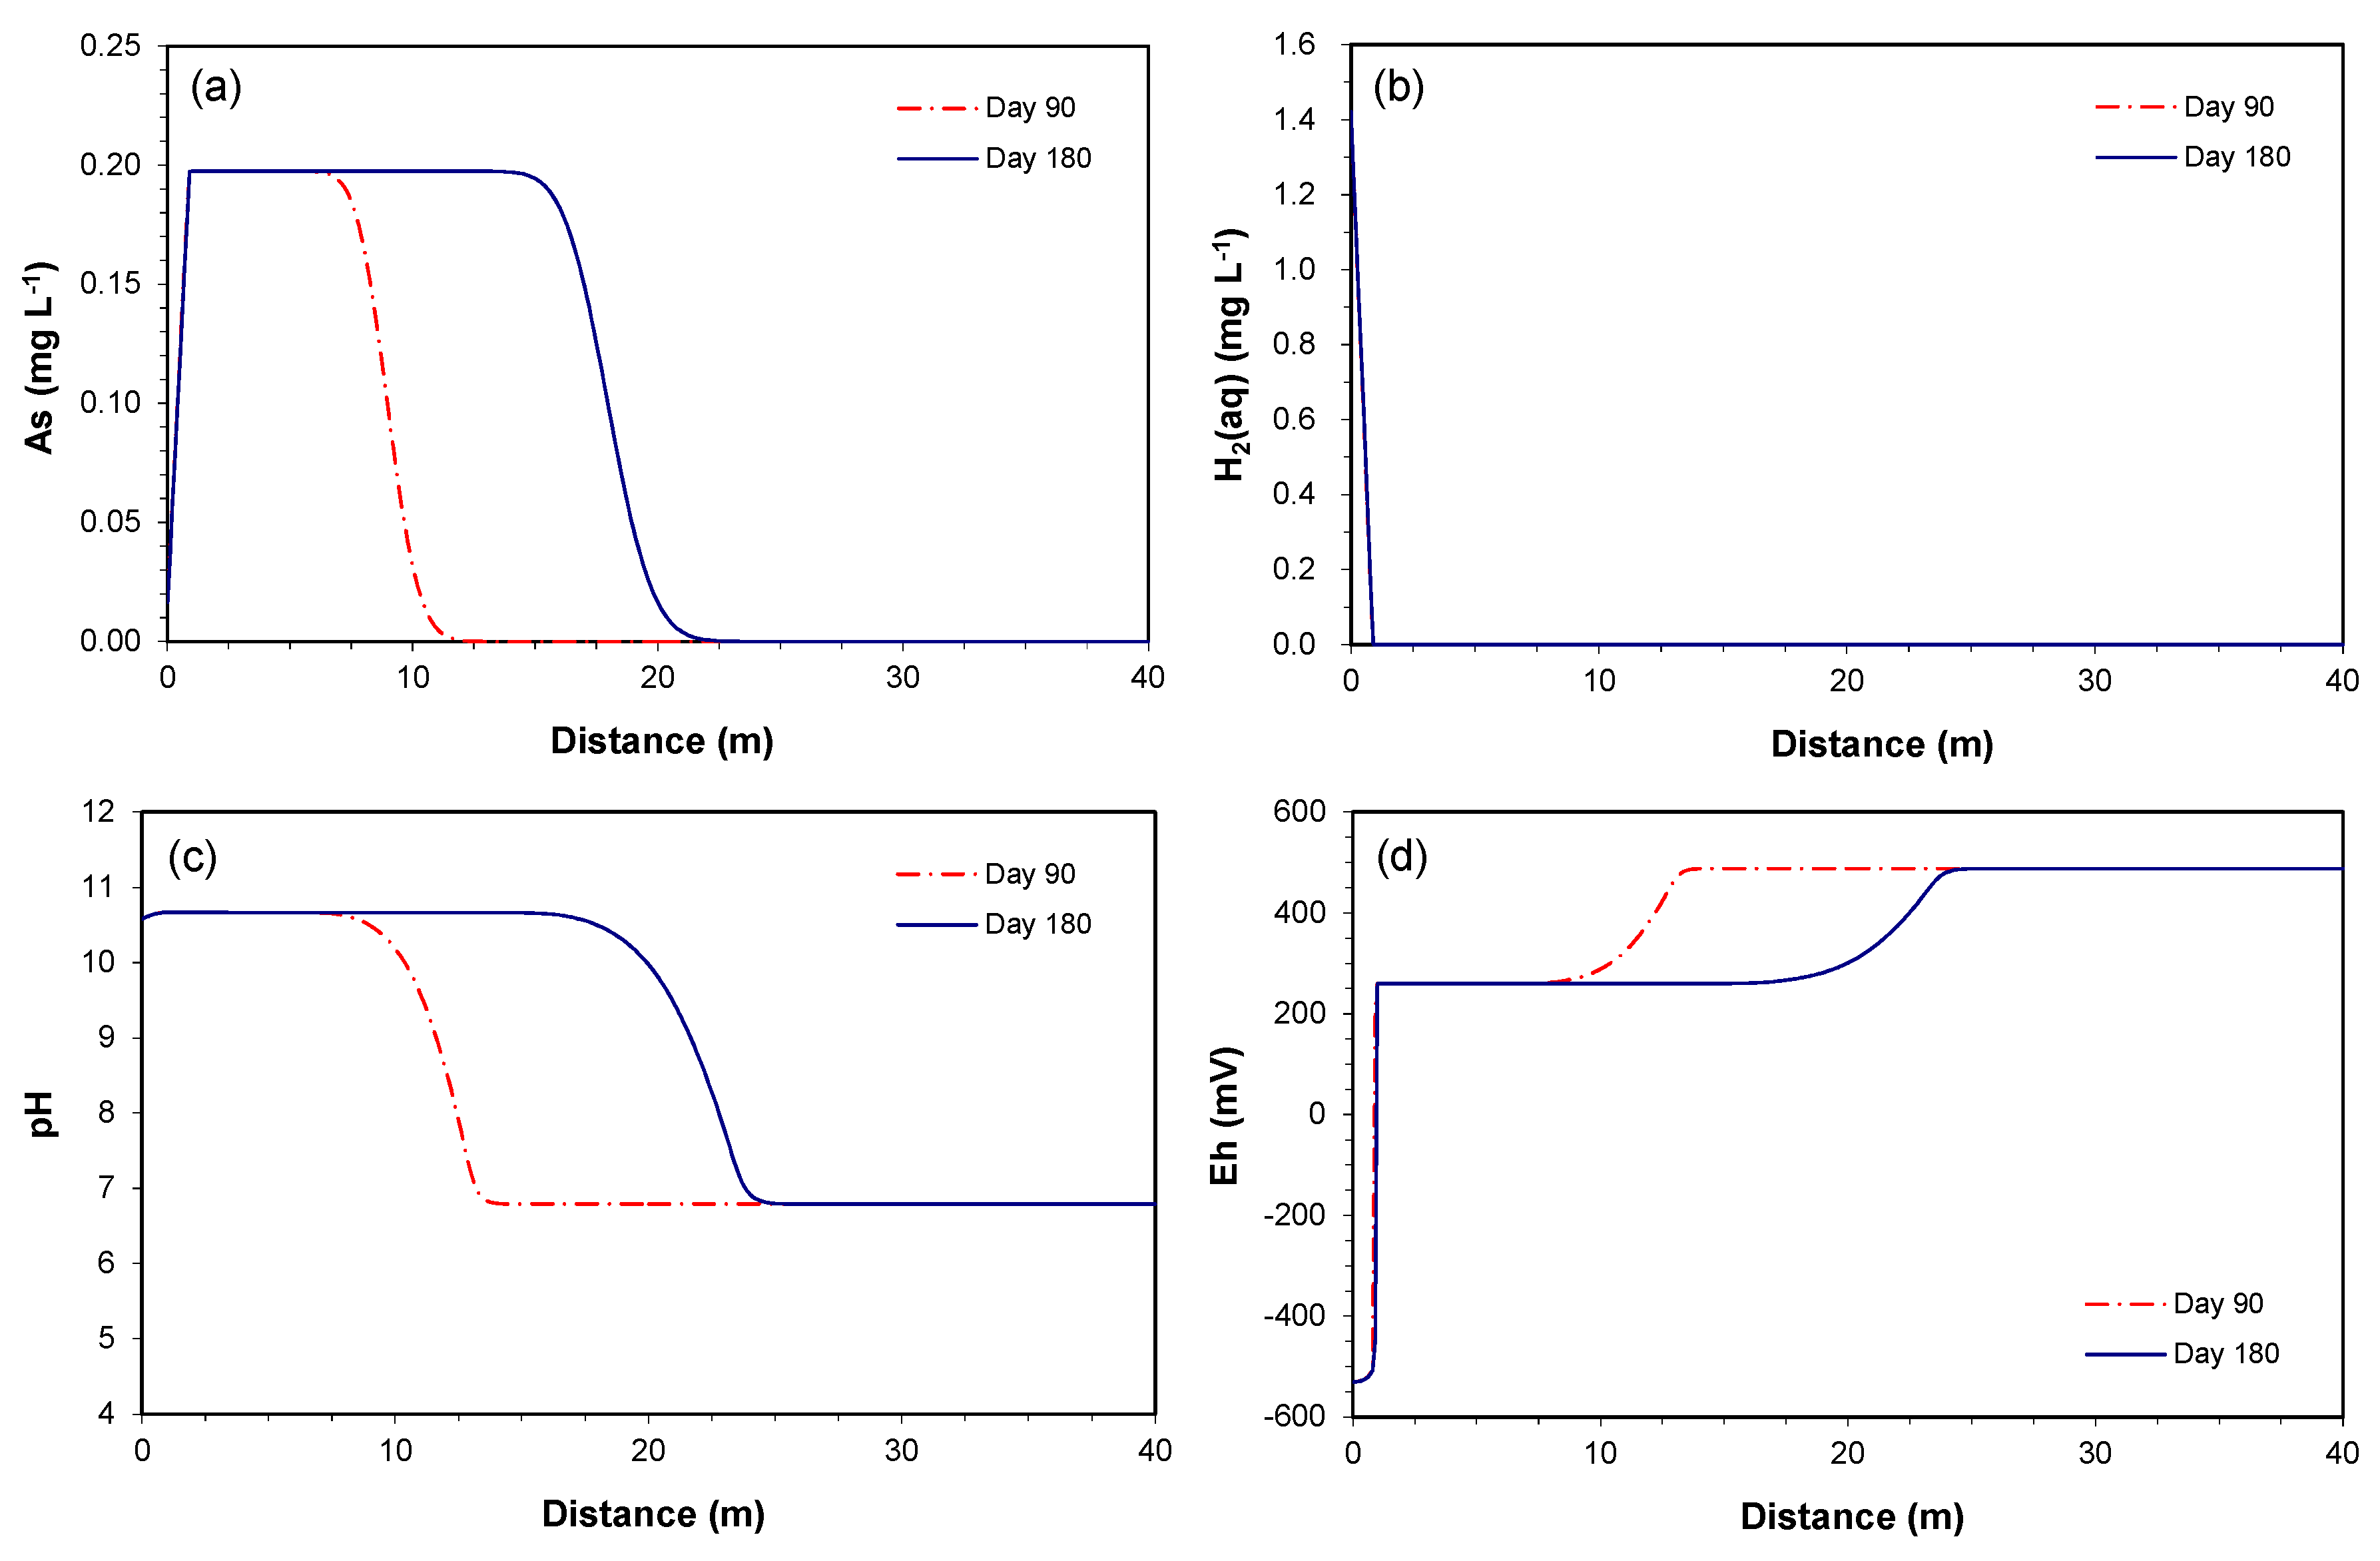
Using the model parameters for the column data, predictive simulations were conducted to assess the fate of the released As along the down-gradient of a potential iron PRB. The spatial profiles for the simulated concentrations were evaluated at 90 and 180 days along the 40 m downgradient of the proposed PRB.
The simulated profiles show that the maximum concentration of the As plume reaches about 0.2 mg L−1 (Figure 3a). The released As is not re-precipitated to the original state, even when all of the incoming H2(aq) is completely consumed within 1 m from the effluent end of the PRB (Figure 3b). Thus, without identifying potential As-sinking processes, the As plume continuously migrates to the down-gradient of the PRB at the groundwater velocity. At the given groundwater velocity of 0.1 m day−1, the plume arrives in 9 and 18 m at 90 and 180 days, respectively. Similar trends were observed for the Fe concentrations (with the maximum concentration of 0.18 mg L−1) (not shown).
The H2(aq) concentration profiles remain the same between 90 and 180 days (Figure 3b), because the H2(aq) is rapidly and completely consumed in the vicinity of the PRB. The maximum As concentration is thus controlled by the availability of H2(aq) rather than the solubility of As-bearing goethite. In other words, the H2(aq) is completely consumed before the As concentration reaches the maximum solubility. Because the incoming H2(aq) concentration is saturated to the maximum solubility of dissolved hydrogen, it is not expected that a higher As concentration will be observed in the given model setting, unless the proposed stiochiometric coefficient is changed.
As shown in the simulations for the column data, the pH-buffering reactions were not identified. As a result, the elevated pH conditions leaving the PRB travel along the downgradient of the PRB (Figure 3c), similar to the trends that are observed for As and Fe concentrations. In Mayer et al. [23], the observed pH-buffering was ascribed to the proton desorption from oxide and clay mineral surfaces. If such a pH-buffering reaction is included, the simulated pH profiles may look different than the currently simulated profiles. However, information for the parameters for the proton desorption reaction was not sufficient in this study.
The redox potential (Eh) was computed based on the H2(aq) concentration, reflecting the state of the H2(aq)/H+ redox couple. The Eh leaving the PRB has a value of −530 mV, it increases to 260 mV at 1 m from the effluent end, consistent with the H2(aq) concentration, and further increases the downgradient to 490 mV because of the change in pH (Figure 3d). The higher Eh values observed in the column experiment than the simulated values within 1 m from the effluent end may indicate that the conditions in the iron columns are less reducing than calculated by the model, or that the measured Eh does not correspond to the redox condition defined by the H2(aq)/H+ redox couple.
3.2.3. Consumption of As-Bearing Iron Oxides
The amount of the As-bearing goethite (volume fraction of 0.003) only had negligible effects on the simulated results within a period of 180 days; however, it is expected that the dissolution of this mineral may result in gradual depletion of the mineral over time, and this will affect the released As concentration. Therefore, simulations were conducted over a time period of 40 years to assess how much of depletion of the mineral can occur.
Figure 4a shows the time series simulation for the As concentration at 1 m downgradient of the PRB over a time period of 40 years. The maximum As concentration of 0.2 mg L−1 is maintained until two years, but begins to decrease gradually until it reaches the influent level at 28 years. This is because the As release rate is based on the reactive surface area of the As-bearing goethite, and the reactive surface area is updated using a two-thirds power-relationship, as the dissolution of the mineral occurs over time. Similarly, the initial volume fraction is maintained until 0.7 years, but decreases to zero by 28 years (Figure 4b).
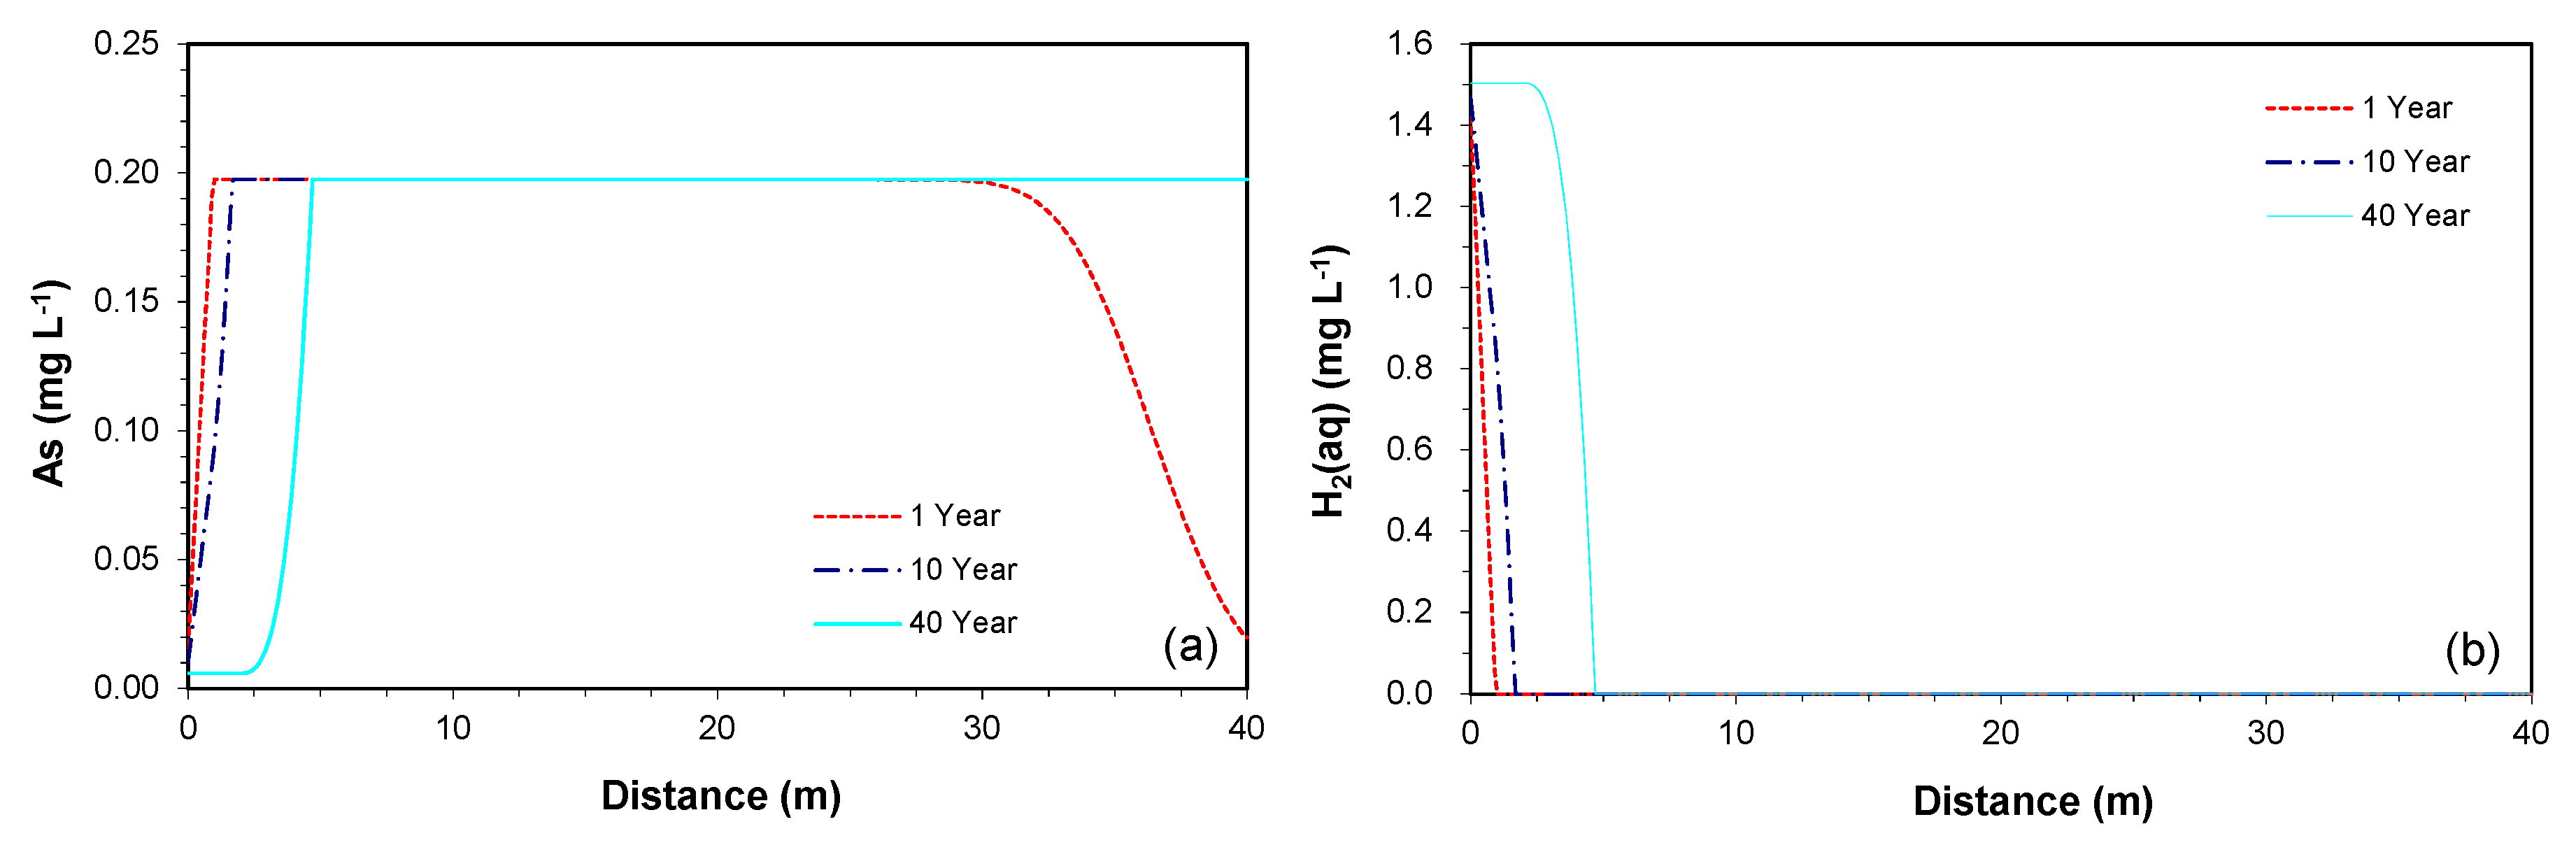
The depletion of the mineral, however, is observed only in the region where the reductive dissolution of goethite combined with the oxidation of H2(aq) actively occurs. For example, the time series simulation at 5 m downgradient of the PRB showed no changes in As concentration and volume fraction over a time period of 40 years. The spatial results along the downgradient of the PRB at 1, 10, and 40 years of the simulation confirms this explanation, as the fronts of increase in As concentration (Figure 5a) and depletion of H2(aq) concentration (Figure 5b) migrate further down-gradient over time. Therefore, as long as the aquifer sediments contain the As contents throughout the downgradient of the PRB, the depletion of the As-bearing goethite is not expected to be a potential cause for the decrease in As concentration.
4. Conclusions
This study evaluated the release of arsenic in the aquifer sediment downgradient from the proposed iron PRB through laboratory column experiments and reactive transport modeling. The results of laboratory column experiments showed that the concentrations of arsenic in the effluents from the aquifer columns were less than 0.1 mg/L, or approximately 20% of the groundwater concentration. The trend in the release of arsenic from the aquifer sediments to the post-treatment effluent from granular iron was consistent with the general flushing of arsenic from an arsenic-impacted aquifer. The solid-phase acid-leach tests indicated that there was arsenic available for leaching from the aquifer sediments in the vicinity of the contaminant plume at the field site, and thus it could be a potential source for release of arsenic downgradient from the proposed PRB.
The reactive transport modeling generally reproduced the observed geochemistry of the columns, having about 0.09 mg L−1 of arsenic concentration at the column effluent. This was represented by including the oxidation of dissolved hydrogen when combined with reductive dissolution of As-bearing goethite in the model reaction network. Predictive simulations, conducted to assess the fate of the released As along the downgradient of the potential iron PRB, showed that without identifying potential As-sinking processes, the As plume may continuously migrate to the downgradient of the PRB at the groundwater velocity. The depletion of the arsenic-bearing goethite was observed only in the region where the reductive dissolution of goethite actively occurred, indicating that the release of arsenic in the area downgradient of the proposed PRB could last for a long period of time.
This study shows that reactive transport modeling based on the site geochemistry data can be useful to understand reactions that are associated with reductive dissolution of arsenic-bearing minerals, which could be a potential source of release of arsenic in the sediments under reduced conditions. Further studies should be warranted to assess effectiveness of methods prohibiting the reductive dissolution of As-bearing iron oxides and reducing the increased arsenic concentration downgradient from RRBs.
Acknowledgments
This research was supported by the Basic Science Research Program through the National Research Foundation of Korea (NRF) funded by the Ministry of Education (NRF-2016R1D1A1A02937479) and by the “R&D Project on Environmental Management of Geologic CO2 Storage” from the KEITI (Project Number: 2014001810003).
Author Contributions
Sung-Wook Jeen conceived, designed, and performed the experiments and modeling; Sung-Wook Jeen analyzed the data; Sung-Wook Jeen wrote the paper.
Conflicts of Interest
The author declares no conflict of interest. The founding sponsors had no role in the design of the study; in the collection, analyses, or interpretation of data; in the writing of the manuscript, and in the decision to publish the results.
References
- Jain, C.; Ali, I. Arsenic: Occurrence, toxicity and speciation techniques. Water Res. 2000, 34, 4304–4312. [Google Scholar] [CrossRef]
- Garelick, H.; Jones, H.; Dybowska, A.; Valsami-Jones, E. Arsenic pollution sources. Rev. Environ. Contam. Toxicol. 2008, 197, 17–60. [Google Scholar] [PubMed]
- Smedley, P.L.; Kinniburgh, D.G. A review of the source, behaviour and distribution of arsenic in natural waters. Appl. Geochem. 2002, 17, 517–568. [Google Scholar] [CrossRef]
- Kim, K.; Kim, S.-H.; Jeong, G.Y.; Kim, R.-H. Relations of As concentrations among groundwater, soil, and bedrock in Chungnam, Korea: Implications for as mobilization in groundwater according to the as-hosting mineral change. J. Hazard. Mater. 2012, 199–200, 25–35. [Google Scholar] [CrossRef] [PubMed]
- Anawar, H.M.; Akai, J.; Mihaljevič, M.; Sikder, A.M.; Ahmed, G.; Tareq, S.M.; Rahman, M.M. Arsenic contamination in groundwater of Bangladesh: Perspectives on geochemical, microbial and anthropogenic issues. Water 2011, 3, 1050–1076. [Google Scholar] [CrossRef]
- McBean, E.A.; Rajib, M.A.; Rahman, M.M. Improved sustainability of water supply options in areas with arsenic-impacted groundwater. Water 2013, 5, 1941–1951. [Google Scholar] [CrossRef]
- Tian, Y.; Yu, C.; Zha, X.; Wu, J.; Gao, X.; Feng, C.; Luo, K. Distribution and potential health risks of arsenic, selenium, and fluorine in natural waters in Tibet, China. Water 2016, 8, 568. [Google Scholar] [CrossRef]
- Thakur, J.K.; Thakur, R.K.; Ramanathan, A.L.; Kumar, M.; Singh, S.K. Arsenic contamination of groundwater in Nepal—An overview. Water 2011, 3, 1–20. [Google Scholar] [CrossRef]
- Kapaj, S.; Peterson, H.; Liber, K.; Bhattacharya, P. Human health effects from chronic arsenic poisoning—A review. J. Environ. Sci. Health A 2006, 41, 2399–2428. [Google Scholar] [CrossRef] [PubMed]
- Duan, Y.; Gan, Y.; Wang, Y.; Liu, C.; Yu, K.; Deng, Y.; Zhao, K.; Dong, C. Arsenic speciation in aquifer sediment under varying groundwater regime and redox conditions at Jianghan Plain of Central China. Sci. Total Environ. 2017, 607–608, 992–1000. [Google Scholar] [CrossRef] [PubMed]
- Xie, X.; Wang, Y.; Su, C.; Liu, H.; Duan, M.; Xie, Z. Arsenic mobilization in shallow aquifers of Datong Basin: Hydrochemical and mineralogical evidences. J. Geochem. Explor. 2008, 98, 107–115. [Google Scholar] [CrossRef]
- Kim, K.; Moon, J.-T.; Kim, S.-H.; Ko, K.-S. Importance of surface geologic condition in regulating As concentration of groundwater in the alluvial plain. Chemosphere 2009, 77, 478–484. [Google Scholar] [CrossRef] [PubMed]
- Donselaar, M.E.; Bhatt, A.G.; Ghosh, A.K. On the relation between fluvio-deltaic flood basin geomorphology and the wide-spread occurrence of arsenic pollution in shallow aquifers. Sci. Total Environ. 2017, 574, 901–913. [Google Scholar] [CrossRef] [PubMed]
- Wilkin, R.T.; Acree, S.D.; Ross, R.R.; Beak, D.G.; Lee, T.R. Performance of a zerovalent iron reactive barrier for the treatment of arsenic in groundwater: Part 1. Hydrogeochemical studies. J. Contam. Hydrol. 2009, 106, 1–14. [Google Scholar] [CrossRef] [PubMed]
- Su, C.; Puls, R.W. Arsenate and arsenite removal by zerovalent iron: Kinetics, redox transformation, and implications for in situ groundwater remediation. Environ. Sci. Technol. 2001, 35, 1487–1492. [Google Scholar] [CrossRef] [PubMed]
- Blowes, D.W.; Ptacek, C.J.; Benner, S.G.; McRae, C.W.T.; Puls, R.W. Treatment of dissolved metals and nutrients using permeable reactive barriers. J. Contam. Hydrol. 2000, 45, 123–137. [Google Scholar] [CrossRef]
- Morrison, S.J.; Metzler, D.R.; Dwyer, B.P. Removal of As, Mn, Mo, Se, U, V and Zn from groundwater by zero-valent iron in a passive treatment cell: Reaction progress modeling. J. Contam. Hydrol. 2002, 56, 99–116. [Google Scholar] [CrossRef]
- Luwig, R.D.; Smyth, D.J.A.; Blowes, D.W.; Spink, L.E.; Wilkin, R.T.; Jewett, D.G.; Weisener, C.J. Treatment of arsenic, heavy metals, and acidity using a mixed ZVI-compost PRB. Environ. Sci. Technol. 2009, 43, 1970–1976. [Google Scholar] [CrossRef]
- Phillips, D.H.; Van Nooten, T.; Bastiaens, L.; Russell, M.I.; Dickson, K.; Plant, S.; Ahad, J.M.E.; Newton, T.; Elliot, T.; Kalin, R.M. Ten year performance evaluation of a field-scale zero-valent iron permeable reactive barrier installed to remediate trichloroethene contaminated groundwater. Environ. Sci. Technol. 2010, 44, 3861–3869. [Google Scholar] [CrossRef] [PubMed]
- Guan, X.; Sun, Y.; Qin, H.; Li, J.; Lo, I.M.C.; He, D.; Dong, H. The limitations of applying zero-valent iron technology in contaminants sequestration and the corresponding countermeasures: The development in zero-valent iron technology in the last two decades (1994–2014). Water Res. 2015, 75, 224–248. [Google Scholar] [CrossRef] [PubMed]
- Beak, D.; Wilkin, R.T. Performance of a zerovalent iron reactive barrier for the treatment of arsenic in groundwater: Part 2. Geochemical modeling and solid phase studies. J. Contam. Hydrol. 2009, 106, 15–28. [Google Scholar] [CrossRef] [PubMed]
- O’Hannesin, S.F.; Gillham, R.W. Long-term performance of an in-situ “iron wall” for remediation of VOCs. Ground Water 1998, 36, 164–170. [Google Scholar] [CrossRef]
- Mayer, K.U.; Blowes, D.W.; Frind, E.O. Reactive transport modeling of an in situ reactive barrier for the treatment of hexavalent chromium and trichloroethylene in groundwater. Water Resour. Res. 2001, 37, 3091–3103. [Google Scholar] [CrossRef]
- Mayer, K.U.; Frind, E.O.; Blowes, D.W. Multicomponent reactive transport modeling in variably saturated porous media using a generalized formulation for kinetically controlled reactions. Water Resour. Res. 2002, 38, 1174. [Google Scholar] [CrossRef]
- Bilardi, S.; Amos, R.T.; Blowes, D.W.; Calabrò, P.S.; Moraci, N. Reactive transport modeling of ZVI column experiments for nickel remediation. Ground Water Monit. Remediat. 2013, 33, 97–104. [Google Scholar] [CrossRef]
- Jeen, S.-W.; Yang, Y.; Gui, L.; Gillham, R.W. Treatment of trichloroethene and hexavalent chromium by granular iron in the presence of dissolved CaCO3. J. Contam. Hydrol. 2013, 144, 108–121. [Google Scholar] [CrossRef] [PubMed]
- Lu, Q.; Jeen, S.-W.; Gui, L.; Gillham, R.W. Nitrate reduction and its effects on trichloroethylene degradation by granular iron. Water Res. 2017, 112, 48–57. [Google Scholar] [CrossRef] [PubMed]
- Jeong, H.Y.; Jeen, S.-W. Geochemical interactions of mine seepage water with an aquifer: Laboratory tests and reactive transport modeling. Environ. Earth Sci. 2016, 75, 1333. [Google Scholar] [CrossRef]
- Stumm, W.; Morgan, J.J. Aquatic Chemistry: Chemical Equilibria and Rates in Natural Waters, 3rd ed.; John Wiley & Sons, Inc.: New York, NY, USA, 1996. [Google Scholar]
- Allison, J.D.; Brown, D.S.; Novo-Gradac, K.J. MINTEQA2/PRODEFA2, A Geochemical Assessment Model for Environmental Systems: Version 3.0 User’s Manual; EPA-600/3-91-021; U.S. Environmental Protection Agency: Athens, GA, USA, 1991.
- Freeze, R.A.; Cherry, J.A. Groundwater; Prentice-Hall: Englewood Cliffs, NJ, USA, 1979. [Google Scholar]
- Jeen, S.-W.; Mayer, K.U.; Gillham, R.W.; Blowes, D.W. Reactive transport modeling of trichloroethene treatment with declining reactivity of iron. Environ. Sci. Technol. 2007, 41, 1432–1438. [Google Scholar] [CrossRef] [PubMed]
- Blowes, D.W.; Puls, R.W.; Gillham, R.W.; Ptacek, C.J.; Bennett, T.A.; Bain, J.G.; Hanton-Fong, C.J.; Paul, C.J. An In Situ Permeable Reactive Barrier for Treatment of Hexavalent Chromium and Trichloroethene in Groundwater: Volume 2 Performance Monitoring; EPA 600/R-99/095b; U.S. Environmental Protection Agency: Washington, DC, USA, 1999.
- Wilkin, R.T.; Puls, R.W.; Sewell, G.W. Long-Term Performance of Permeable Reactive Barriers Using Zero-Valent Iron: An Evaluation at Two Sites; Report EPA/600/S-02/001; U.S. Environmental Protection Agency: Cincinnati, OH, USA, 2002.
Figure 1.
Schematic diagram of the column apparatus.

Figure 2.
The measured and simulated concentrations along the aquifer columns at the end of the test (simulation) period: (a) As, (b) Fe, and (c) pH.
Figure 2.
The measured and simulated concentrations along the aquifer columns at the end of the test (simulation) period: (a) As, (b) Fe, and (c) pH.

Figure 3.
The predictive simulation for concentrations along the downgradient of the permeable reactive barriers (PRB) at days 90 and 180: (a) As, (b) H2(aq), (c) pH, and (d) redox potential (Eh).
Figure 3.
The predictive simulation for concentrations along the downgradient of the permeable reactive barriers (PRB) at days 90 and 180: (a) As, (b) H2(aq), (c) pH, and (d) redox potential (Eh).

Figure 4.
The simulated time series of (a) As concentration and (b) As-bearing goethite volume fraction at 1 m downgradient of the PRB over a time period of 40 years.
Figure 4.
The simulated time series of (a) As concentration and (b) As-bearing goethite volume fraction at 1 m downgradient of the PRB over a time period of 40 years.
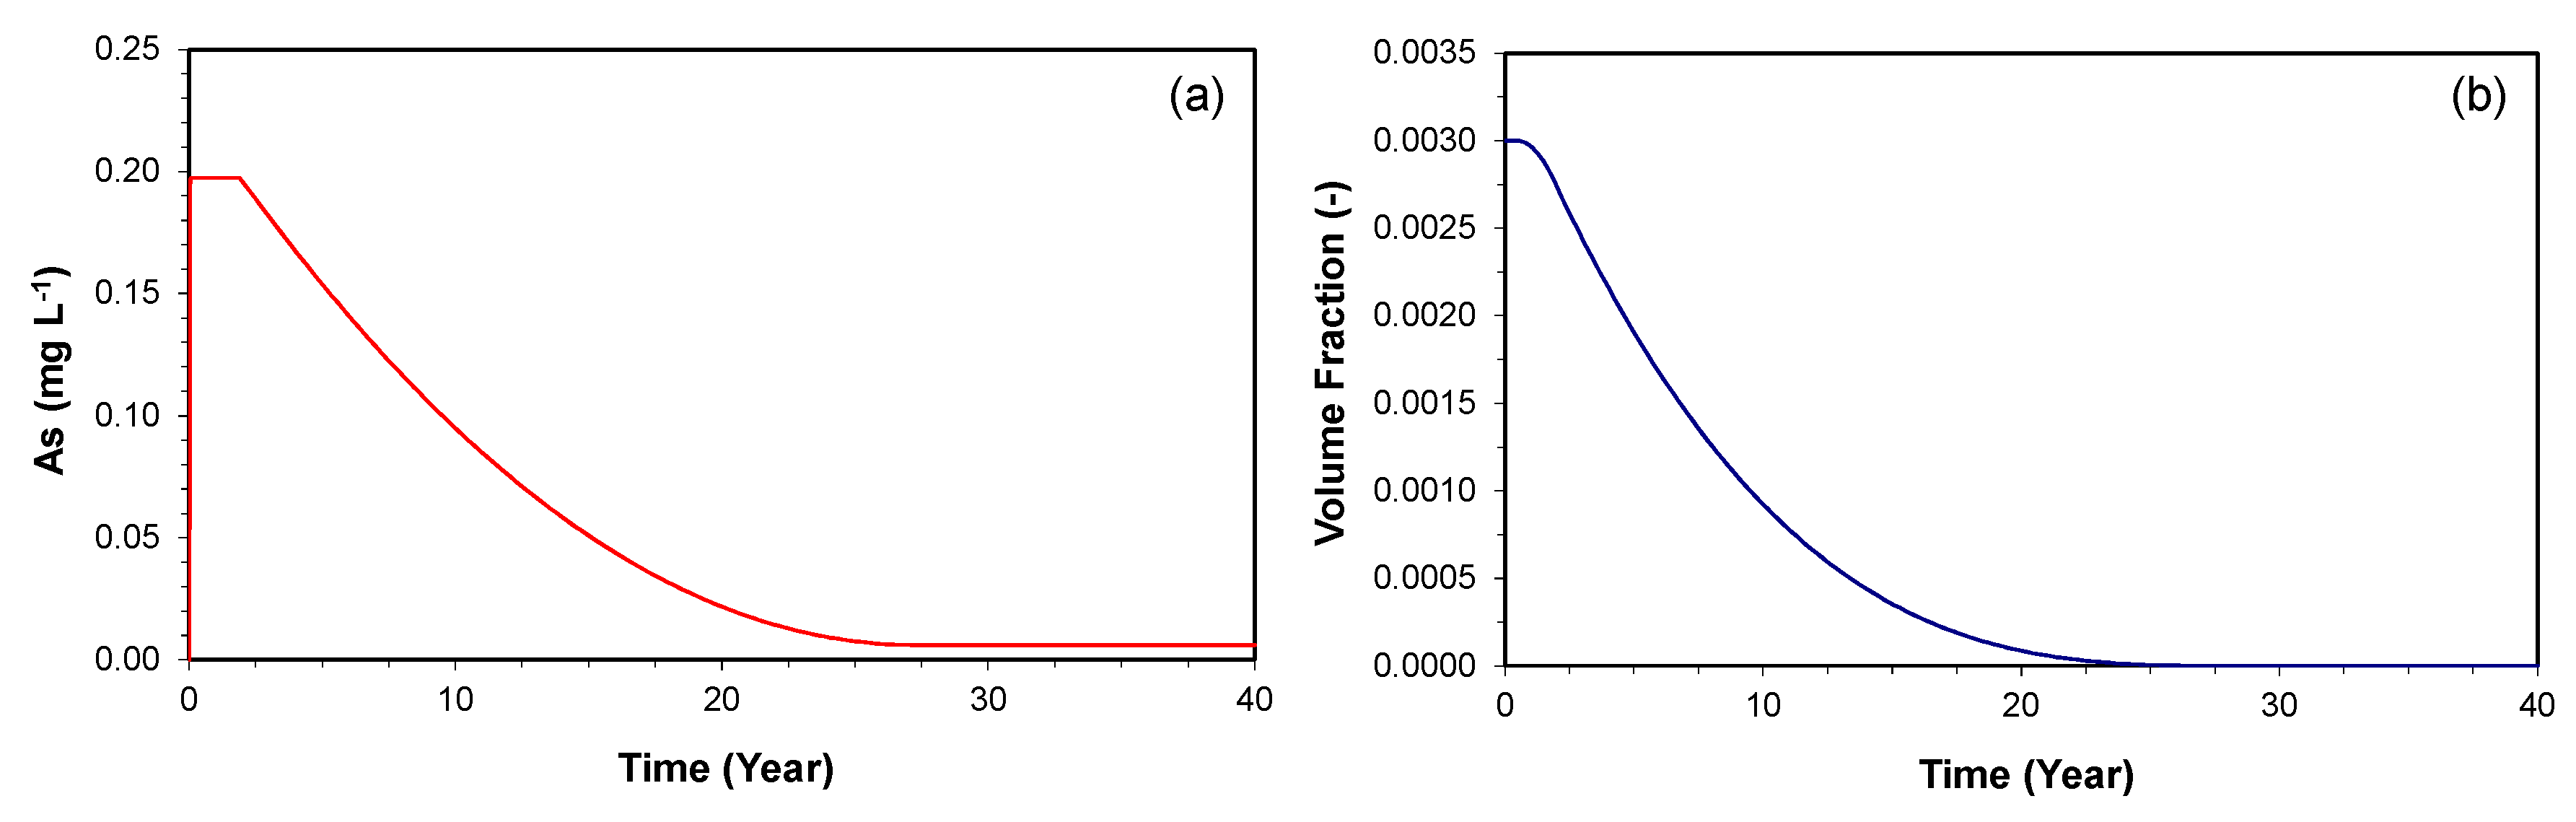
Figure 5.
The simulated profiles of (a) As and (b) H2(aq) concentrations along the downgradient of the PRB at 1, 10, and 40 years.
Figure 5.
The simulated profiles of (a) As and (b) H2(aq) concentrations along the downgradient of the PRB at 1, 10, and 40 years.

Table 1.
Column contents and characteristics.
| Height (g) | Mass (g) | Sand (g) | Iron/Aquifer (g) | Pore Volume (mL) | Porosity | |
|---|---|---|---|---|---|---|
| Granular Iron Columns | ||||||
| Column CA | ||||||
| Sand | 2.4 | 82.54 | ||||
| Granular Iron | 39 | 2106.19 | ||||
| Sand | 41 | 80.3 | ||||
| Column Total | 162.8 | 2106.2 | 440 | 0.53 | ||
| Column CB | ||||||
| Sand | 3.1 | 101.86 | ||||
| Granular Iron | 39.6 | 1282.44 | ||||
| Sand | 41 | 57.54 | ||||
| Column Total | 159.4 | 1282.4 | 448 | 0.54 | ||
| Aquifer Columns | ||||||
| Column AA | ||||||
| Sand | 3.1 | 101.86 | ||||
| Aquifer | 39.6 | 1353.6 | ||||
| Moisture a | 95.43 | |||||
| Sand | 41 | 70.62 | ||||
| Column Total | 172.5 | 1258.2 | 233 | 0.28 | ||
| Column AB | ||||||
| Sand | 3 | 99.1 | ||||
| Aquifer | 39.4 | 1407.27 | ||||
| Moisture a | 161.30 | |||||
| Sand | 41 | 49.04 | ||||
| Column Total | 148.1 | 1245.9 | 268 | 0.32 | ||
Note: a Moisture content of Column AA sediment was 0.0705 and of Column AB sediment was 0.1146.
Table 2.
Major influent and effluent inorganic concentrations at steady state.
| Parameter | Concentration (mg L−1) | |||||
|---|---|---|---|---|---|---|
| Influent for Iron Columns | Aquifer Column AA | Aquifer Column AB | Detection Limit | |||
| Influent | Effluent | Influent | Effluent | |||
| As (total) | 0.66 | 0.006 | 0.092 | 0.003 | 0.080 | 0.001 |
| Al | <0.037 | <0.037 | 0.33 | 0.24 | 0.45 | 0.037 |
| Ca | 1.7 | 0.49 | 0.88 | <0.10 | 0.59 | 0.10 |
| Fe | 0.273 | 0.041 | 0.049 | 0.054 | 0.042 | 0.003 |
| K | 1.25 | 1.38 | 1.12 | 1.52 | 0.91 | 0.25 |
| Mg | 0.64 | <0.025 | 0.06 | <0.025 | <0.025 | 0.025 |
| Na | 117 | 116 | 115 | 117 | 125 | 0.05 |
| SiO2 | 20 | 1.9 | 9.9 | 3.8 | 11.6 | 0.25 |
| F | 32 | 32 | 32 | 32 | 32 | 0.40 |
| Cl | 14 | 15 | 16 | 17 | 16 | 1.0 |
| SO4 | 32 | 34 | 36 | 31 | 31 | 1.0 |
| Alkalinity (as CaCO3) | 165 | 154 | 132 | 170 | 169 | 0.10 |
© 2017 by the author. Licensee MDPI, Basel, Switzerland. This article is an open access article distributed under the terms and conditions of the Creative Commons Attribution (CC BY) license (http://creativecommons.org/licenses/by/4.0/).
Share and Cite
MDPI and ACS Style
Jeen, S.-W. Reactive Transport Modeling for Mobilization of Arsenic in a Sediment Downgradient from an Iron Permeable Reactive Barrier. Water 2017, 9, 890. https://doi.org/10.3390/w9110890
AMA Style
Jeen S-W. Reactive Transport Modeling for Mobilization of Arsenic in a Sediment Downgradient from an Iron Permeable Reactive Barrier. Water. 2017; 9(11):890. https://doi.org/10.3390/w9110890
Chicago/Turabian StyleJeen, Sung-Wook. 2017. "Reactive Transport Modeling for Mobilization of Arsenic in a Sediment Downgradient from an Iron Permeable Reactive Barrier" Water 9, no. 11: 890. https://doi.org/10.3390/w9110890
Note that from the first issue of 2016, this journal uses article numbers instead of page numbers. See further details here.