Treatment of Rural Wastewater Using a Spiral Fiber Based Salinity-Persistent Sequencing Batch Biofilm Reactor


1
School of Environmental Science and Engineering, Tianjin University, 135 Yaguan Road, Tianjin 300350, China
2
Tianjin Engineering Research Center of Urban River Eco-Purification Technology, Tianjin 300350, China
*
Author to whom correspondence should be addressed.
Water 2017, 9(12), 970; https://doi.org/10.3390/w9120970
Submission received: 13 October 2017
/
Revised: 5 November 2017
/
Accepted: 8 December 2017
/
Published: 12 December 2017
(This article belongs to the Special Issue Biological Treatment of Wastewater)
Abstract
:Differing from municipal wastewater, rural wastewater in salinization areas is characterized with arbitrary discharge and high concentration of salt, COD, nitrogen and phosphorus, which would cause severe deterioration of rivers and lakes. To overcome the limits of traditional biological processes, a spiral fiber based salinity-persistent Sequencing Biofilm Batch Reactor (SBBR) was developed and investigated with synthetic rural wastewater (COD = 500 mg/L, NH4+-N = 50 mg/L, TP = 6 mg/L) under different salinity (0.0–10.0 g/L of NaCl). Results indicated that a quick start-up could be achieved in 15 days, along with sufficient biomass up to 7275 mg/L. During operating period, the removal of COD, NH4+-N, TN was almost not disturbed by salt varying from 0.0 to 10.0 g/L with stable efficiency reaching 92%, 82% and 80%, respectively. Although TP could be removed at high efficiency of 90% in low salinity conditions (from 0.0 to 5.0 g/L of NaCl), it was seriously inhibited due to nitrite accumulation and reduction of Phosphorus Accumulating Organisms (PAOs) after addition of 10.0 g/L of salt. The behavior proposed in this study will provide theoretical foundation and guidance for application of SBBR in saline rural wastewater treatment.
1. Introduction
With the development of society and economy, living situation in rural areas has been improved. At the same time, domestic wastewater in rural areas is also increasing unexpectedly. The World Health Organization (WHO) and the Water Supply and Sanitation Collaborative Council illustrated that less than 18% of people in rural areas had access to sanitation services in developing countries such as China [1]. Actually, the amount of rural wastewater that has been treated in China is less than 1% for rural areas and 11% for county towns. Rural wastewater is characterized with high concentration of Chemical Oxygen Demand (COD), nitrogen and phosphorus, and the excessive nitrogen and phosphorus always cause eutrophication of lakes [2,3], deterioration of water quality and human health problems [4]. Furthermore, the rural wastewater is difficult to collect due to scattered villages. Therefore, efficient pollutants removal from rural wastewater has been an urgent task for researchers.
Until now, biological technologies have been widely applied in wastewater treatment plants (WWTPs), such as oxidation ditch process, conventional suspended-growth activated sludge process, sequencing batch reactor and anaerobic/anoxic/oxic (A/A/O) process [5,6]. They are considered to be the most sufficient processes in treating municipal wastewater compared with physical adsorption and chemical reaction. However, considering the differences between rural wastewater and municipal wastewater, such as collection, quantity and quality of wastewater, the mentioned biological processes are not that suitable for pollutants removal in villages. Moreover, these processes are relatively complicated and a bit expensive for farmers to operate and manage [7].
Compared to traditional biofilm system and suspended activated sludge system, the Sequencing Batch Biofilm Reactor (SBBR) has a variety of merits. It combines the advantages of activated sludge process and biofilm process, which benefits to endure the sudden shock load in the system [8]. At the same time, biofilm carrier creates a gradient of dissolved oxygen concentration from the surface to the interior, providing an opportune aerobic and anoxic environment for direct denitrification [9]. Many successful pollutant removals have been obtained in SBBR system [10,11], and the most important point is that the SBBR could adapt to the variation of rural wastewater and it is easy to install and manage.
However, there are still some shortcomings in the SBBR system, such as short solid retention time (SRT) (about 20–30 days) [12], and long start-up period (more than 30 days) [13,14,15]. The Suspended Solids (SS) content in the effluent is also usually high due to the uncertain settling characteristic [16]. Furthermore, many villages are salinization areas, which generate much wastewater rich in both nutrient and salt (NaCl). High salt concentration may directly or indirectly cause plasmolysis and inhibit cell division, enlargement and growth, eventually leading to a low productivity of the biological system [17,18]. Some researchers have focused on the effect of salinity in single pollutant removal processes, such as two stage biological contact oxidation process, up-flow anaerobic sludge blanket (UASB), expanded granular sludge bed reactor (EGSBR), sequencing batch reactor (SBR), anaerobic filter, etc. [19,20,21,22]. Owing to the differences in wastewater quality, there are different opinions on microorganism behaviors in biological treatment systems. Sun et al. [23] indicated that the activity of Nitrite Oxidizing Bacteria (NOB) was inhibited by the seawater salinity but NOB could gradually adapt to seawater salinity in nitrogen removal process. It was also illustrated that higher than 30.0 g/L of NaCl had significantly adverse effects on the nitrification efficiency, and addition of 20.0 g/L of salt suppressed NH4+-N oxidation to N2 at different SRT [18]. Abu-ghararah and Sherrard [24] proposed 4.0 g/L salt concentration had little effects on nitrogen removal.
The aforementioned studies were mostly restricted to the single pollutant removal process, such as single nitrogen or phosphorous removal in the activated sludge system under salinity. That is, few studies have reported the complete removal behaviors (COD, SS, TN, NH4+-N, NO2−-N, NO3−-N, TP, and potential of hydrogen (pH)) in the SBBR system in different salt conditions. Hence, developing a salinity-persistent reactor with high removal efficiency of COD, TN, TP, etc. is quite significant.
In this study, a lab-scale, time controlling SBBR, based on spiral fiber carriers, was conducted to investigate the removal behavior of COD, SS, TN, NH4+-N, NO2−-N, NO3−-N, and TP under the condition of increasing salinity from 0.0 to 10.0 g/L of NaCl, gradually. The quick start-up of the bioreactor and stable pollutant removal performance are discussed in detail.
2. Materials and Methods
2.1. Inoculation and Synthetic Wastewater
The SBBR was seeded with activated sludge from a secondary sedimentation tank in Jingu wastewater treatment plant (Tianjin, China). The mixed liquor suspended solids (MLSS) and mixed liquor volatile suspended solids (MLVSS) of the seed sludge were 9660 and 6080 mg/L, respectively. The value of MLVSS/MLSS was 0.63, and the value of SVI was 61.59 mL/g. As the pollutants in rural wastewater were always fluctuant, the rural wastewater used in this experiment consisted of the following substances dissolved in tap water: C6H12O6, 411.22–523.36 mg/L; NH4Cl, 181.68–200.38 mg/L; KH2PO4·3H2O, 23.72–28.12 mg/L; NaHCO3, 198.03–218.41 mg/L; NaCl, 0.0–10.0 g/L; and the ratio of COD/TN/TP was 83/8.3/1. Thus, the influent concentration of COD, NH4+-N, TN, TP, and pH in this study was maintained at around 500.0 mg/L, 50.0 mg/L, 50.0 mg/L, 5.9 mg/L and 7.4, respectively, as shown in Table 1. NaHCO3 in the influent was used to offer carbon source for nitrification process and to maintain the pH value at 7.3 ± 0.4.
It was reported that the concentration of salt in the rural wastewater in salinization areas, such as Binhai District in Tianjin, ranges from 5000 to 9000 mg/L [25]. The salinity was adapted from 0.0 to 10.0 g/L of NaCl gradually in this study. The influence of salinity caused by other nutrients in the synthesized wastewater was neglected [26].
2.2. The SBBR System
The experiment was conducted in a laboratory scale cylinder SBBR controlled by a timer system. As shown in Figure 1A, the reactor was made of Plexiglas with the dimensions of 28.0 cm diameter × 18.3 cm height × 27.0 cm inner diameter and a working volume of 13.0 L. A holey water collector was equipped in the center of the SBBR for effluent. The reactor was covered by a lid, but not closed. An air compressor was set to create an intermittent aerobic and anaerobic environment. A set of SBBR acquired two peristaltic pumps for automatic influent and effluent.
Normally, biofilm carrier affects the status of microbe in the SBBR, which is a key factor for the successful start-up of the reactor. In this study, 38 imitation-aquatic-grass spiral fibers (18.0 cm of each) were tightly plugged into all the holes (76 holes) on the water collector. The biofilm carrier shown in Figure 1B (Shijiazhuang Green Environmental Protection Technology Co., Ltd., Shijiazhuang, China) is composed of dacron (70%) and polypropylene (30%). While the biofilm provides strong attachment of bacteria, it also serves as a filter preventing suspended solids (SS) and other substances into the treated water. Thus, the content of SS in effluent could remain less than 0.5 mg/L in this SBBR system, which is better than that in traditional SBBR system [17].
2.3. Operating Conditions
About 13.0 L activated sludge was initially cultured in the reactor without salt addition, and air was supplied by diffuser and Dissolved Oxygen (DO) level was maintained at 7.0–8.0 mg/L during aerobic phase for biofilm domestication. During the start-up period, the cycle of the operation was set at 12.0 h (influent 0.5 h, anaerobic phase 3.0 h, aerobic phase 9.0 h, and effluent 0.5 h). The exchange volume was fixed at 50%, and the temperature was kept at 20 ± 1 °C during the whole process. When the removal efficiency of COD, TN, TP kept stable for a week, it is considered that the domestication of the activated sludge has been completed.
After the acclimation period, the cycle of the operation was set at 10.0 h, operated with 0.5 h inlet phase, 3.0 h anaerobic phase followed by 6.0 h aeration phase, and 0.5 h outlet phase for the whole experiment. Considering a sudden increase of the salinity might lead to a destabilization of the SBBR, salt concentration in the influent was increased from 0.0 to 2.5, 5.0, 7.5 and 10.0 g/L, progressively. For each salinity, the biofilm and activated sludge would be inoculated for about seven days to acclimate the salinity.
2.4. Analytical Methods
The influent and effluent samples were collected every day. The COD was measured by cuvette rapid tests using HACH DR2800 (21259-15, USA), and HgCl2 was added into the samples to avoid the interference of high Cl− concentration. TN, NH4+-N, NO2−-N, NO3−-N and TP were measured by Chinese national standard methods (HJ636-2012, HJ535-2009, GB7493-87, HJ/T346-2007, GB11893-89). MLSS and MLVSS were also quantified according to the standard methods. The temperature and DO were monitored using an online detector (Model 6308DT, Jenco Electronics, Ltd., Shanghai, China), the pH was tested through a pH meter (Mettler FP20, Mettler-Toledo AG, Schwerzenbach, Switzerland), and salinity was measured with a Salinity Analyzer (HACH sensION5, HACH, Loveland, CO, USA). These measurements were conducted in parallel, and the results were taken in the average. Removal efficiency of COD, TN, NH4+-N and TP was calculated according to the influent and effluent of the reactor.
The concentration of biofilm in the SBBR was calculated by the ratio of total biomass quantity in all carriers to bioreactor effective volume. Before being measured, the biofilm carrier was freeze dried and stripped by ultrasonic, and the biomass quantity in single carrier was determined by electronic balance. To obtain the average quantity of biofilm in single carrier, three carriers in different positions were collected.
3. Results
3.1. SBBR Performance during Start-Up Period
3.1.1. Variation of COD during Start-Up Period
As shown in Figure 2A, the SBBR removed up to 80.0% of COD and the effluent concentration was reduced to less than 80.0 mg/L at the incipient stage during start-up period. Then, with the acclimation time extending (After 12 days), the removal efficiency of COD improved gradually with a stability efficiency at 97.0–99.0% and an average effluent COD concentration at 10 mg/L. During the whole start-up period, the removal efficiency of COD in the reactor reached nearly 100.0%, which indicated that the reactor had obtained an excellent start-up state for removing COD.
3.1.2. Variation of Nitrogen during Start-Up Period
Figure 2B demonstrates the variation of total nitrogen in the SBBR. Compared with the tendency of COD, total nitrogen in the SBBR had certain fluctuations. The total nitrogen values in the reactor was reduced from 50.0 mg/L to 10.9 mg/L after seven days, achieving a high total nitrogen removal efficiency. With the extension of domestication time, total nitrogen concentration appeared to increase, but then slowly reduced to about 12.5 mg/L.
Figure 2C illustrates that the variation of ammonia nitrogen was similar to that of total nitrogen; the effluent concentration of the ammonia nitrogen also fluctuated certainly. The accumulation of NO3−-N and NO2−-N in this system during the start-up period are shown in Figure 2D. The concentration of ammonia nitrogen was degraded slowly at first, possibly due to the poor metabolism of Ammonia Oxidizing Bacteria (AOB). Then, ammonia nitrogen concentration in the effluent decreased from the initial value of 40.0 mg/L to 10.0 mg/L, indicating that the reactor started successfully in removing nitrogen.
3.1.3. Variation of TP during Start-Up Period
In Figure 2D, the concentration of total phosphorus rapidly declined from 5.9 ± 0.5 mg/L to 1.2 ± 0.3 mg/L during the first two days. However, the total phosphorus concentration increased to 3.0 mg/L at Day 5; thereafter, the concentration of total phosphorus in the SBBR decreased gradually to less than 1.0 mg/L and the removal efficiency reached up to 95.6%.
3.2. SBBR Performance during Operating Conditions
Moderate acclimation of activated sludge to high salinity could minimize detrimental effect of salt on bacteria activity [27]. In this study, the concentration of influent salt was increased with a moderate degree.
3.2.1. Variation of COD during Operating Conditions
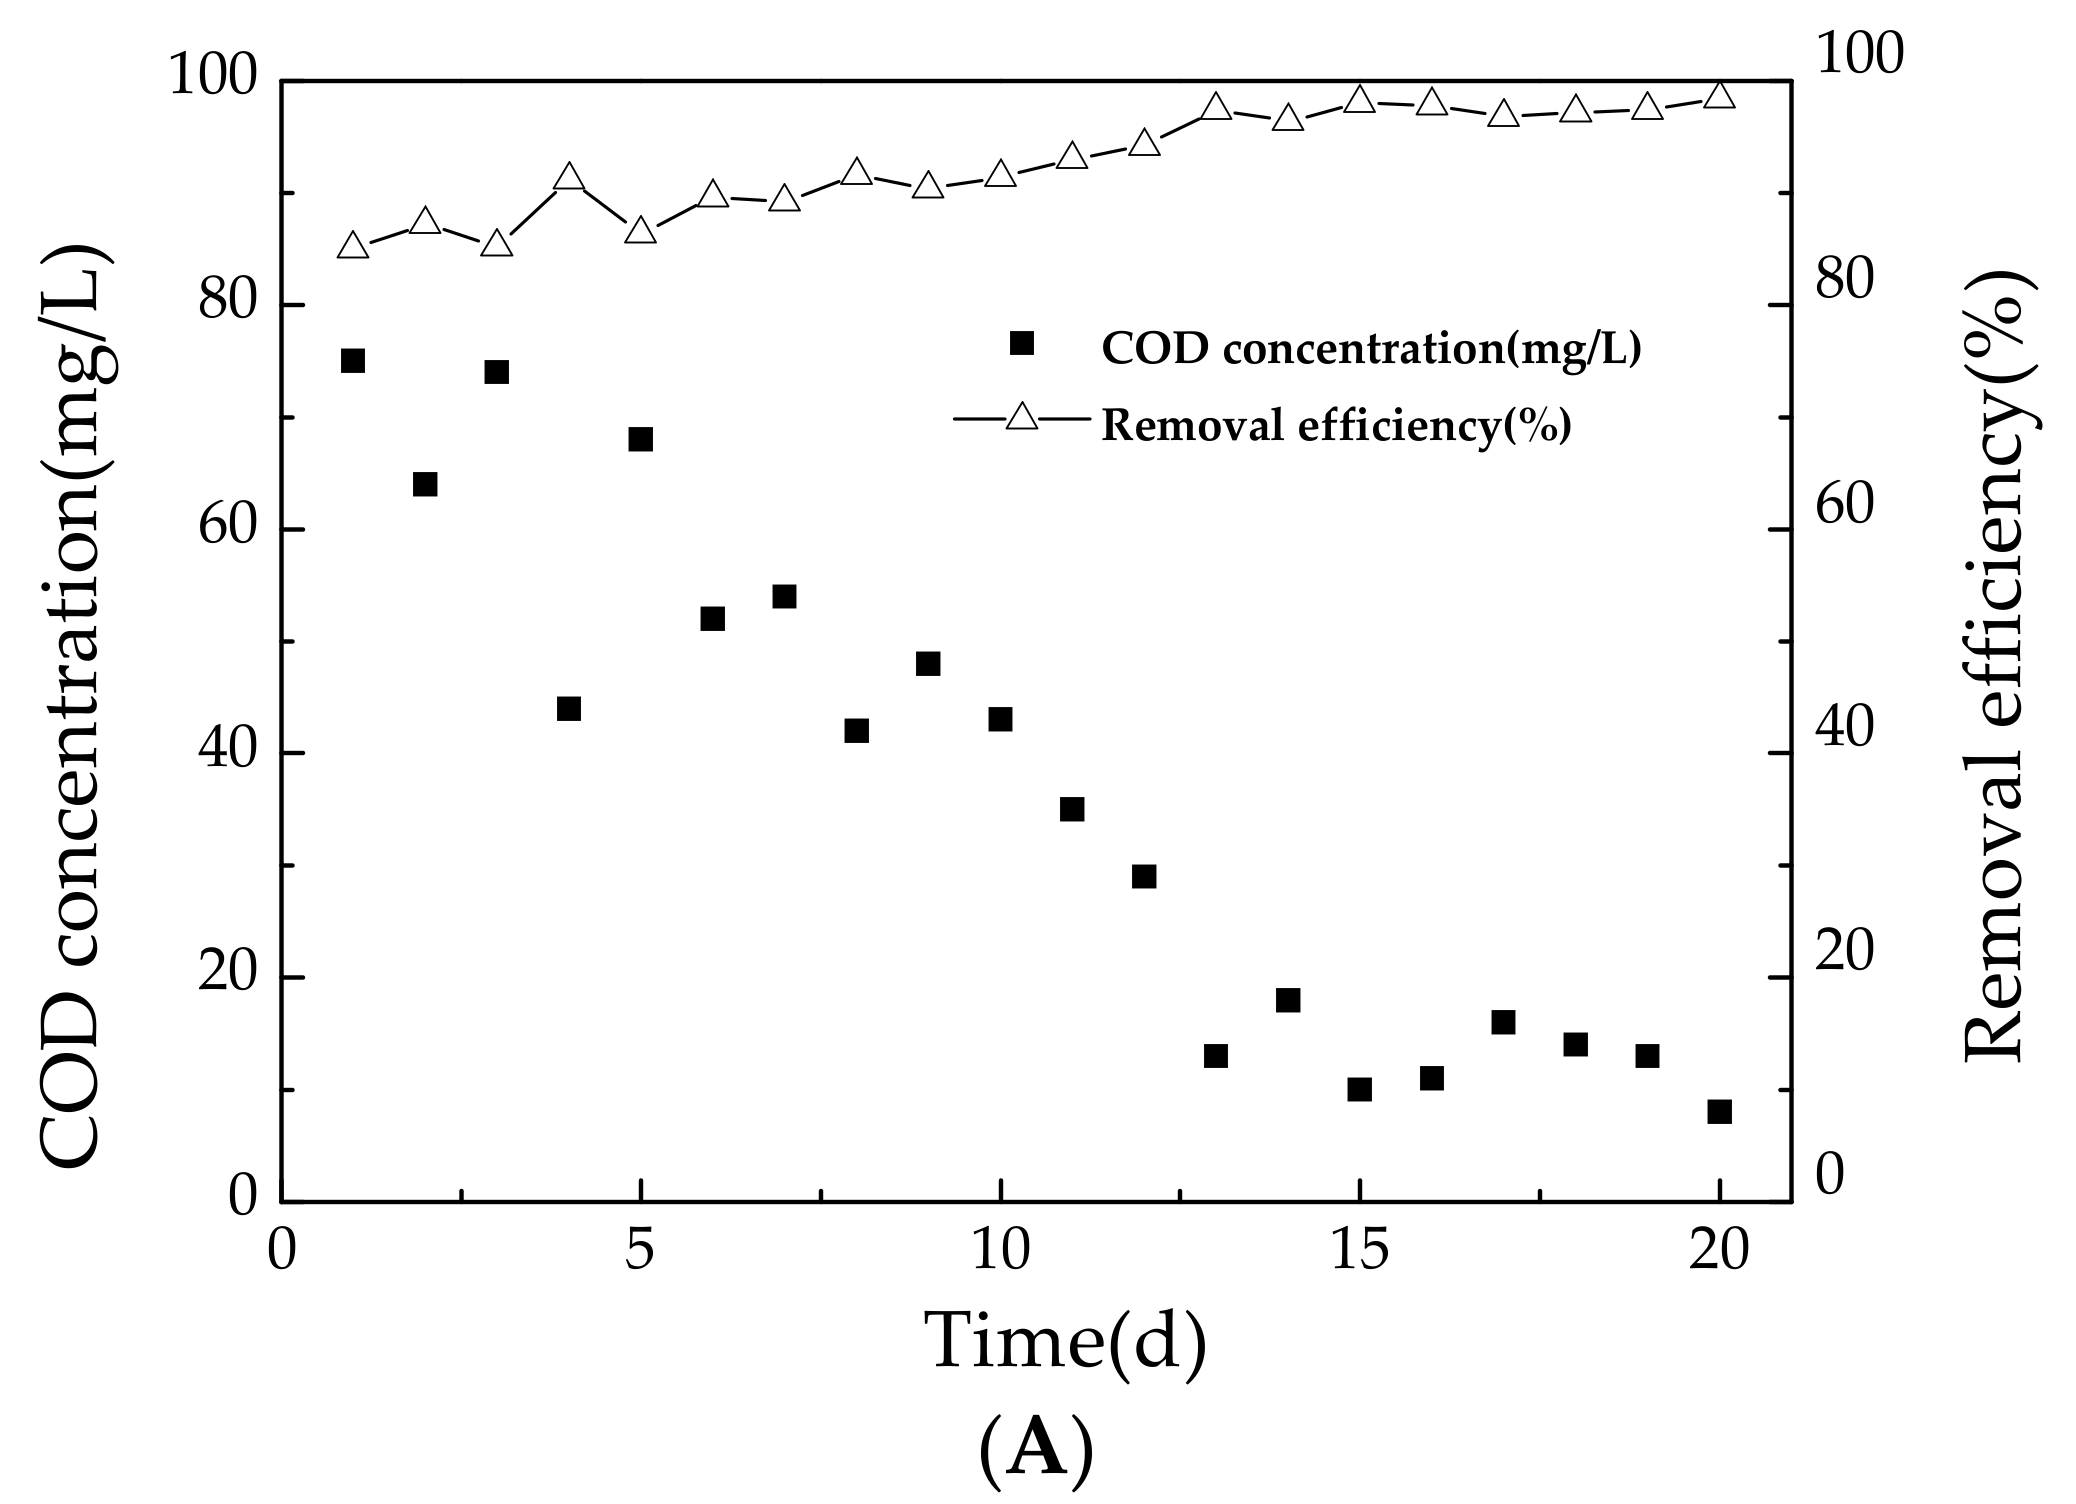
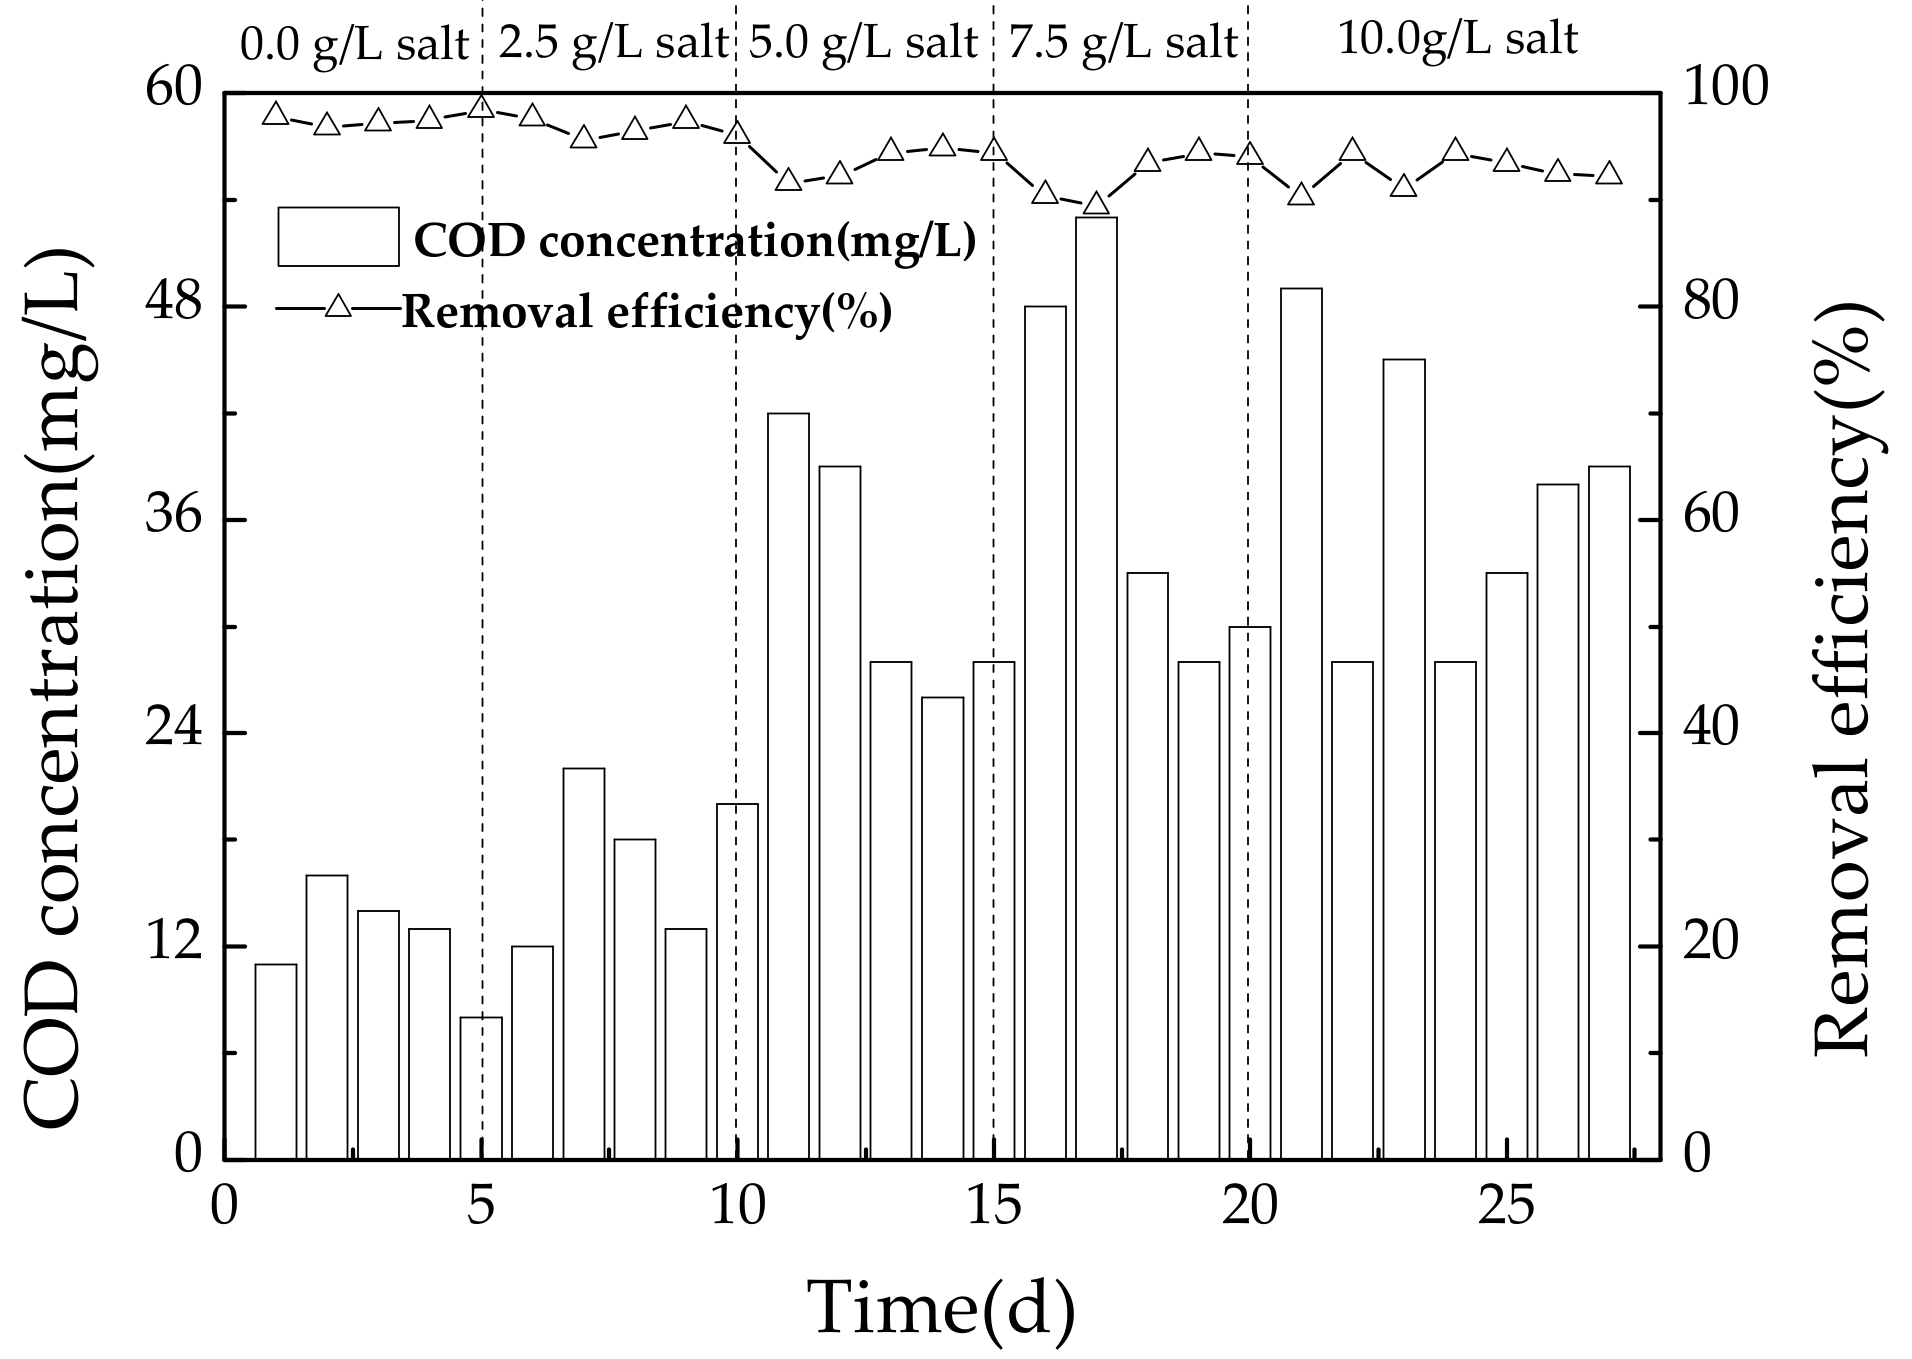
Figure 3 demonstrates the behavior of COD in the SBBR in different salinity conditions. It indicates that the increasing salinity inhibited the growth of bacteria and degradation of pollutant in the system. At salinity of 0.0 and 2.5 g/L of NaCl, the COD concentration in the effluent kept stable at 15.0 mg/L and 20.0 mg/L, respectively. The removal efficiency of both could reach up to 95.0%. However, after addition of 5.0 g/L of salt, the removal efficiency of COD reduced to 90.0% and COD content in the effluent was twice that at 2.5 g/L of NaCl. The trend of COD removal efficiency at 7.5 g/L and 10.0 g/L salinity were similar to those at 5.0 g/L salt concentration. Compared with the high removal efficiency on salt-free condition, the COD concentration in effluent increased slightly, but the reactor could bear the salinity of 10.0 g/L of NaCl and the removal efficiency of COD was still about 90.0%. These results illustrated that microorganisms removing COD were not sensitive to salt stress.
3.2.2. Variation of Nitrogen during Operating Conditions
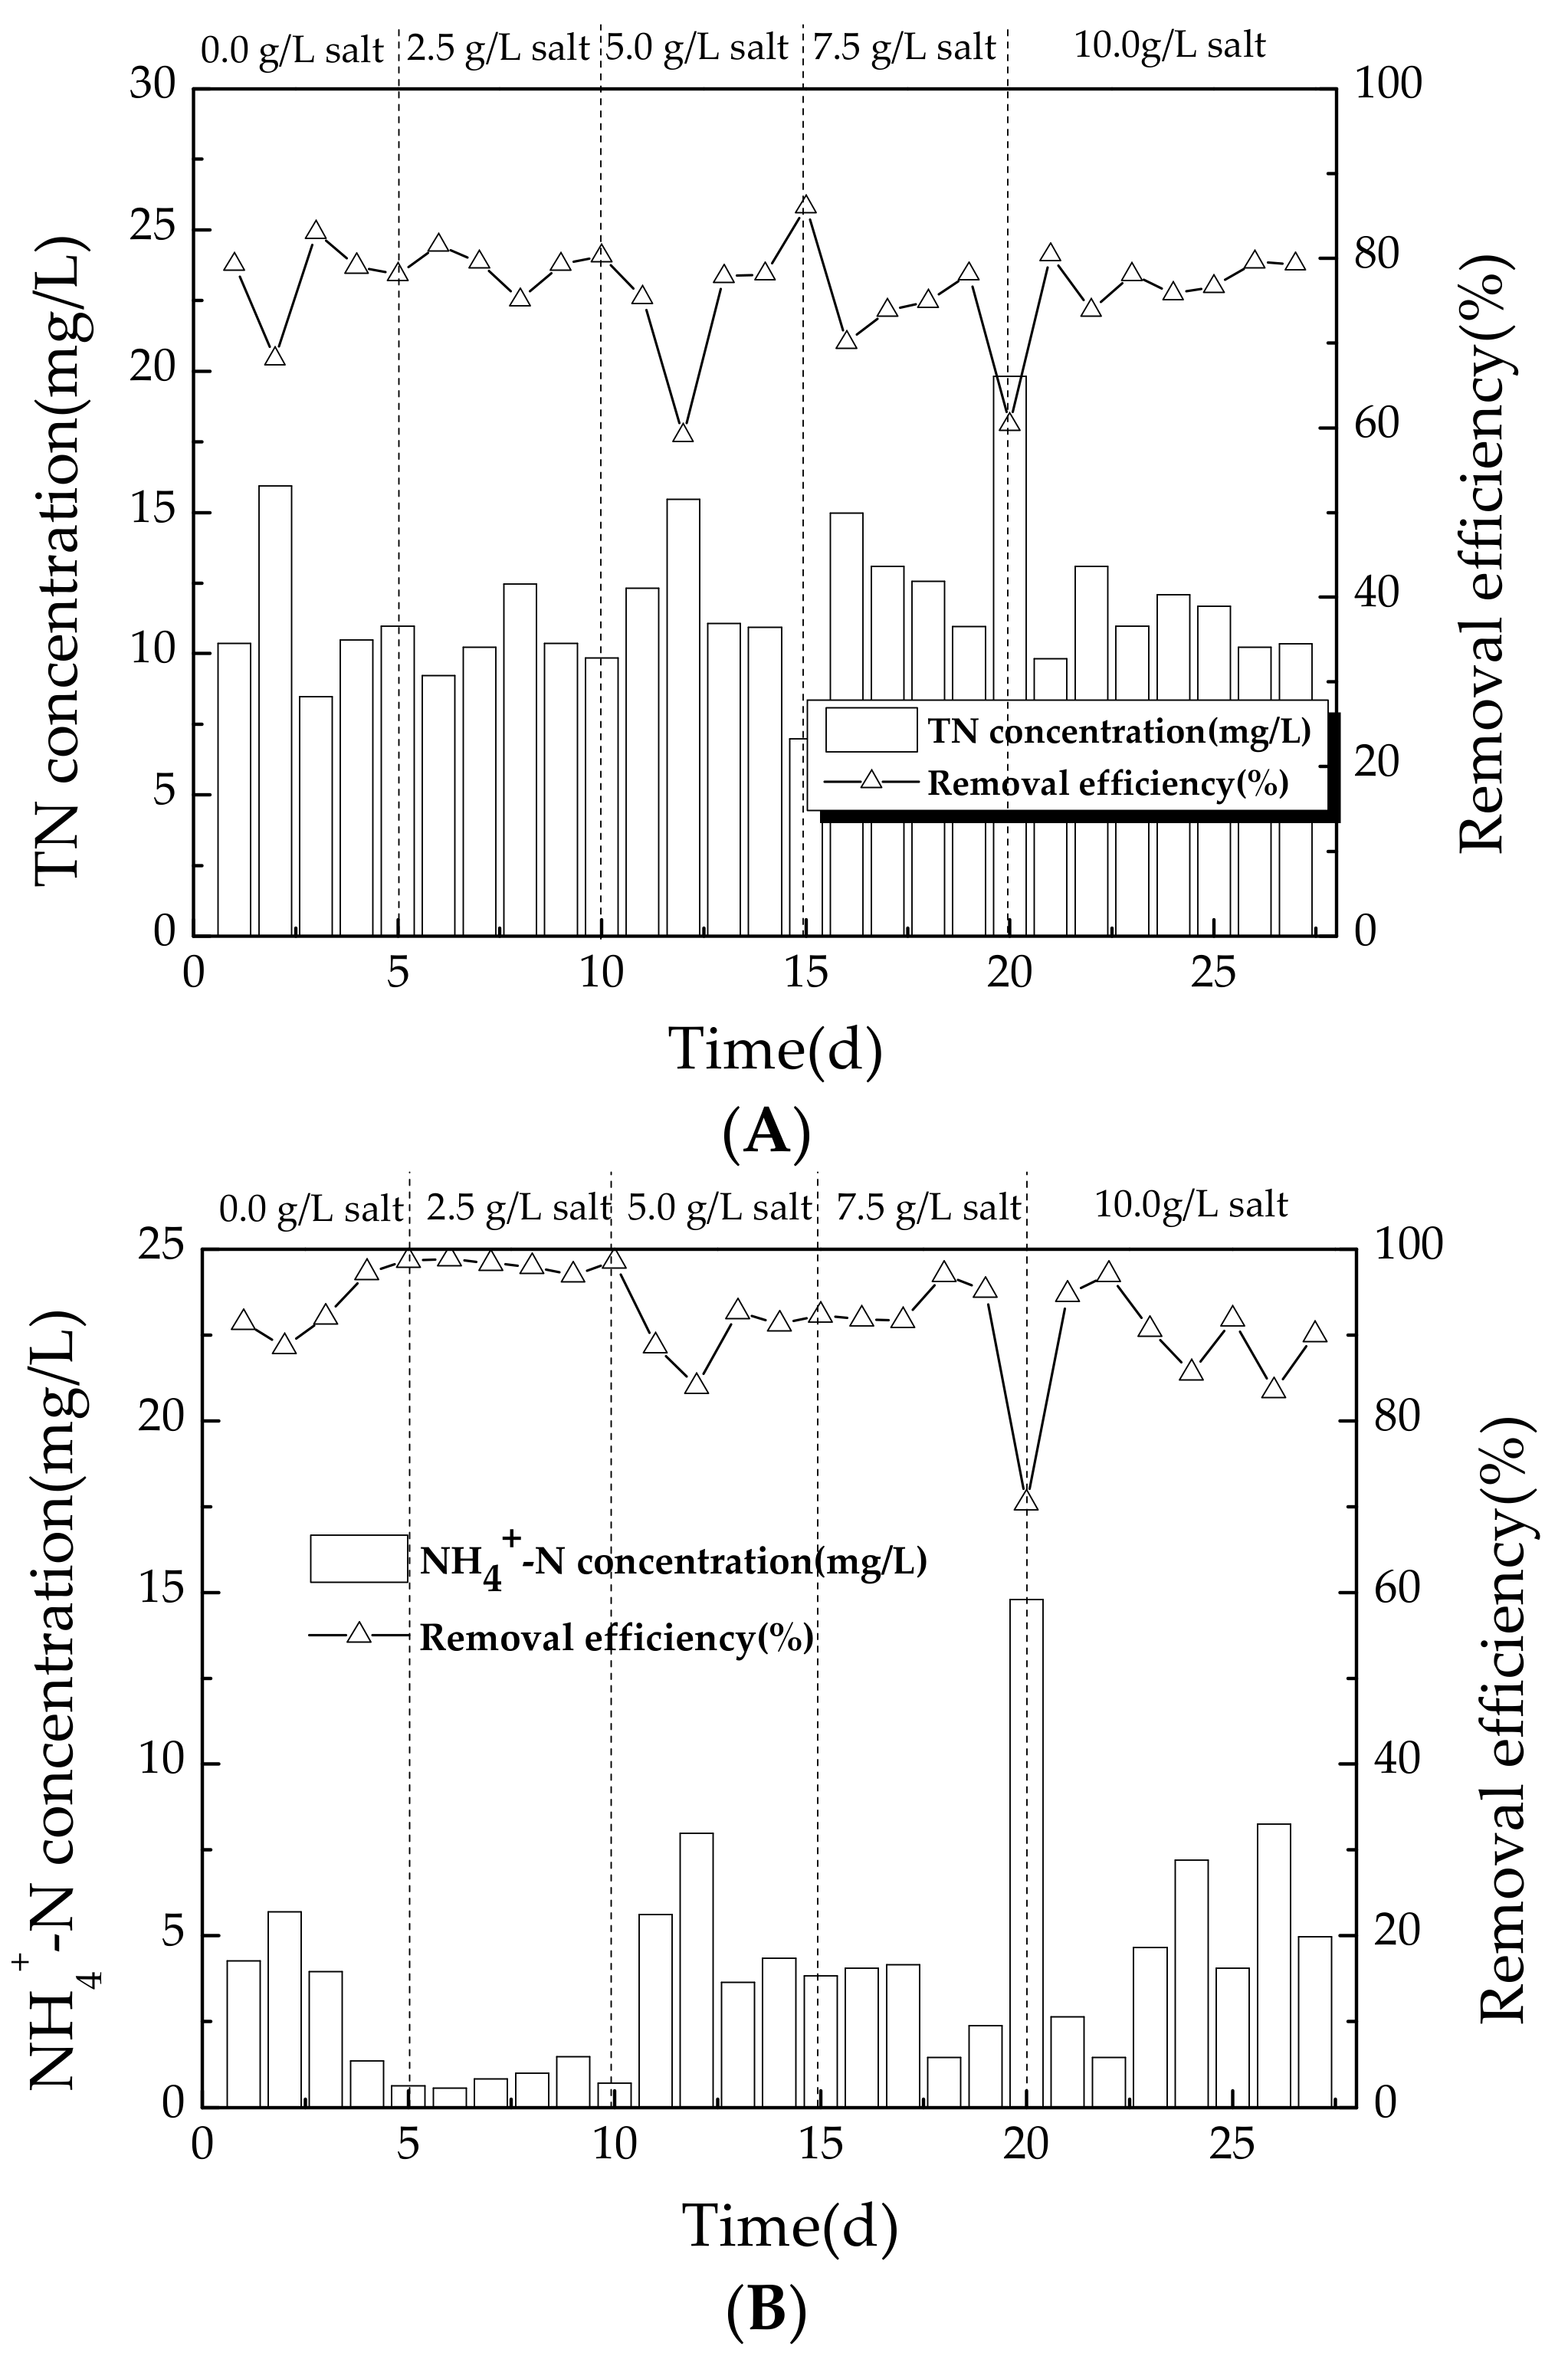
In Figure 4A, total nitrogen removal efficiency was 90.0% at salt concentration of 0.0 and 2.5 g/L, which indicated that the total nitrogen degradation in the reactor had a strong adaptability to salinity variation. Nevertheless, after addition of 5.0 g/L of salt, the acclimation time was much longer, and there was a sudden increase of total nitrogen in effluent. At 7.5 g/L and 10.0 g/L salinity, the total nitrogen in the effluent increased significantly, which indicated that the bacteria could not endure the salinity suddenly. After a period of cultivation, the removal of total nitrogen was improved.
Figure 4B shows the variation of ammonia nitrogen on different salinity conditions. It could be seen that, with the increasing salinity (from 0.0 to 5.0 g/L of salt), ammonia nitrogen concentration was in a small range of fluctuation (below 8.0 mg/L). However, the concentration of ammonia nitrogen in the effluent increased to 14.0 mg/L after addition of 7.5 and 10.0 g/L of salt, along with the removal efficiency reduced to 60.0%. After a long acclimation time, the concentration of ammonia nitrogen could remain under 10.0 mg/L.
The variation of NH4+-N, NO2−-N and NO3−-N are introduced in Figure 4C. Performances at salt concentration of 0.0, 2.5, 5.0 and 7.5 g/L indicated that the residual nitrite nitrogen was almost 0.0 mg/L, most of which was oxidized into nitrate nitrogen and then reduced to nitrogen. Meanwhile, behavior at salinity of 10.0 g/L of NaCl had a significant aggrandizement (10.9 mg/L) indicating the degradation of ammonia nitrogen in the system under salinity stress. The nitrification process was inhibited. At the same time, the content of nitrate remained under 3.0 mg/L during the whole experiment process. There were almost no specific changes of nitrate, due to the similar speed of denitrification and nitrite oxidation process. The variation of nitrogen including nitrate nitrogen, nitrite nitrogen and ammonia nitrogen in Figure 4C was almost the same as total nitrogen concentration in Figure 4A.
3.2.3. Variation of TP during Operating Conditions
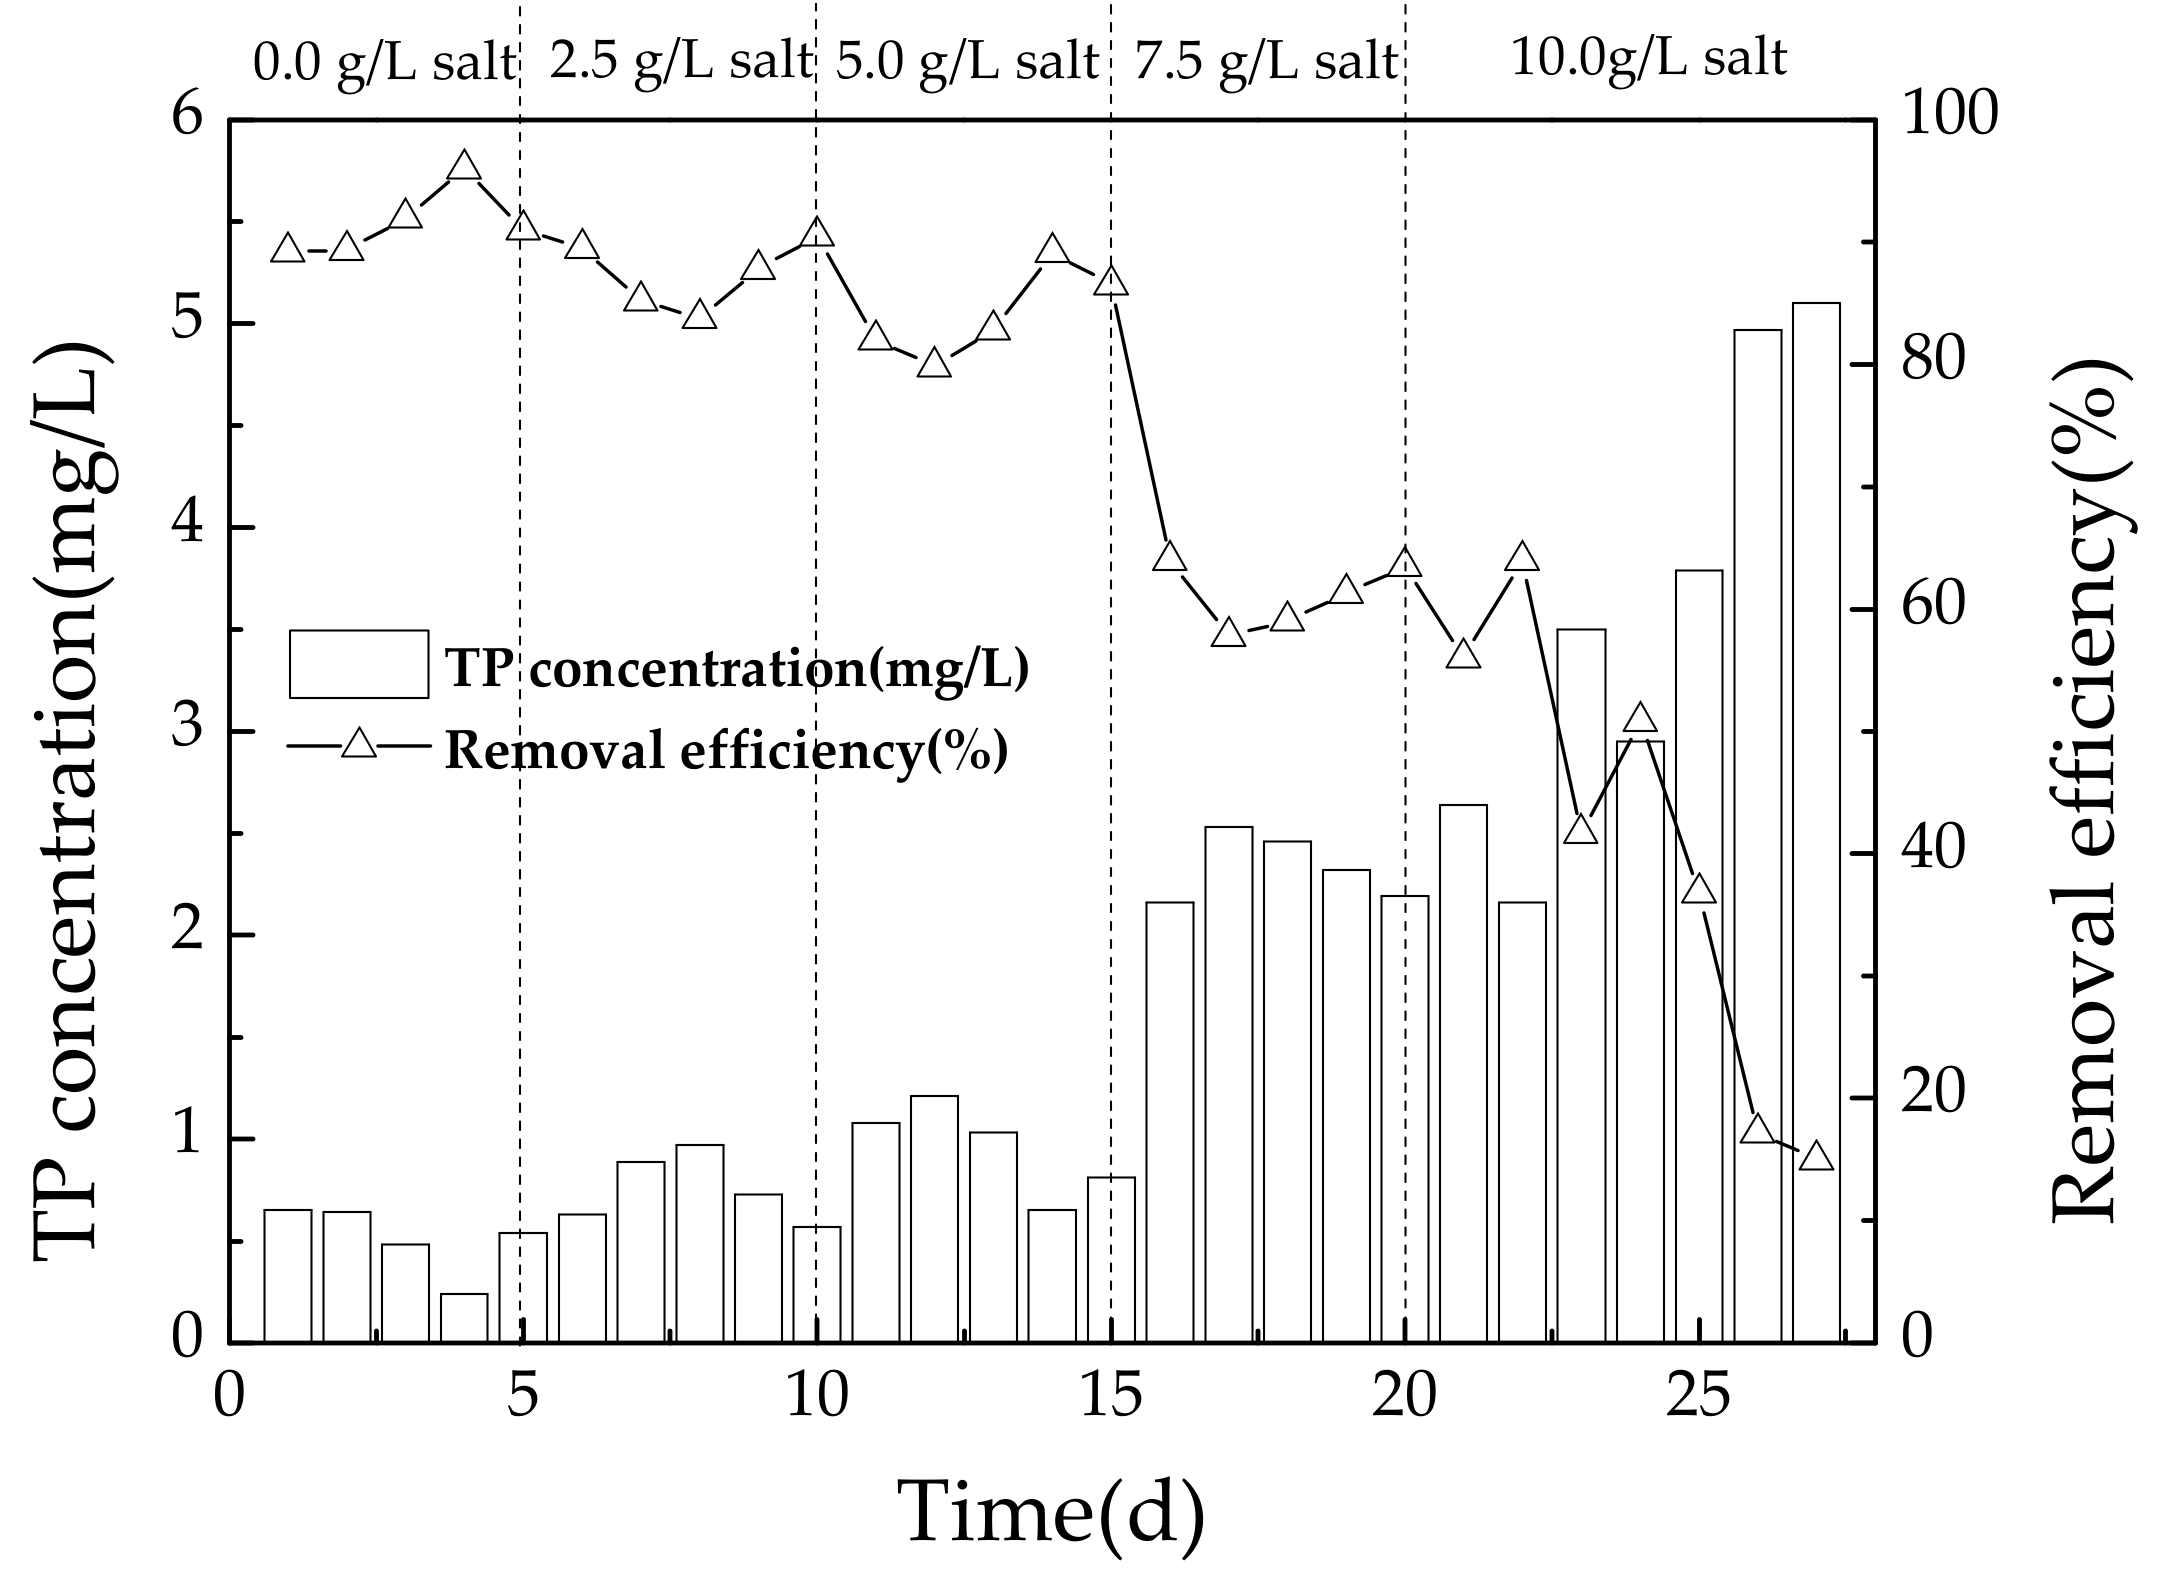
It could be concluded that TP was removed with high efficiency under salt-free condition after the acclimation in the SBBR (Figure 5). The concentration of TP in the influent was 5.9 ± 0.5 mg/L while effluent TP concentration was 0.4 ± 0.2 mg/L with the removal efficiency up to 89.2–96.0%. When the salinity increased gradually to less than 5.0 g/L of NaCl, the removal efficiency of TP reduced. Surprisingly, as domestication time extended, the removal efficiency of TP recovered to 90.2%. Nevertheless, the high salinity, such as 7.5 and 10.0 g/L of salt had significant inhibitory effects on the removal of TP, which was indicated by previous reports [24]. In addition, TP concentration in the effluent became steady at 2.5 mg/L and 5.0 mg/L after addition of 7.5 and 10.0 g/L of salt, respectively. Their lowest removal efficiency was 57.8% and 15.0%, respectively, much lower than those at lower salinity, such as 0.0, 2.5 and 5.0 g/L of salt, indicating that salinity had significant adverse effect on phosphorus removal.
3.3. pH Variation
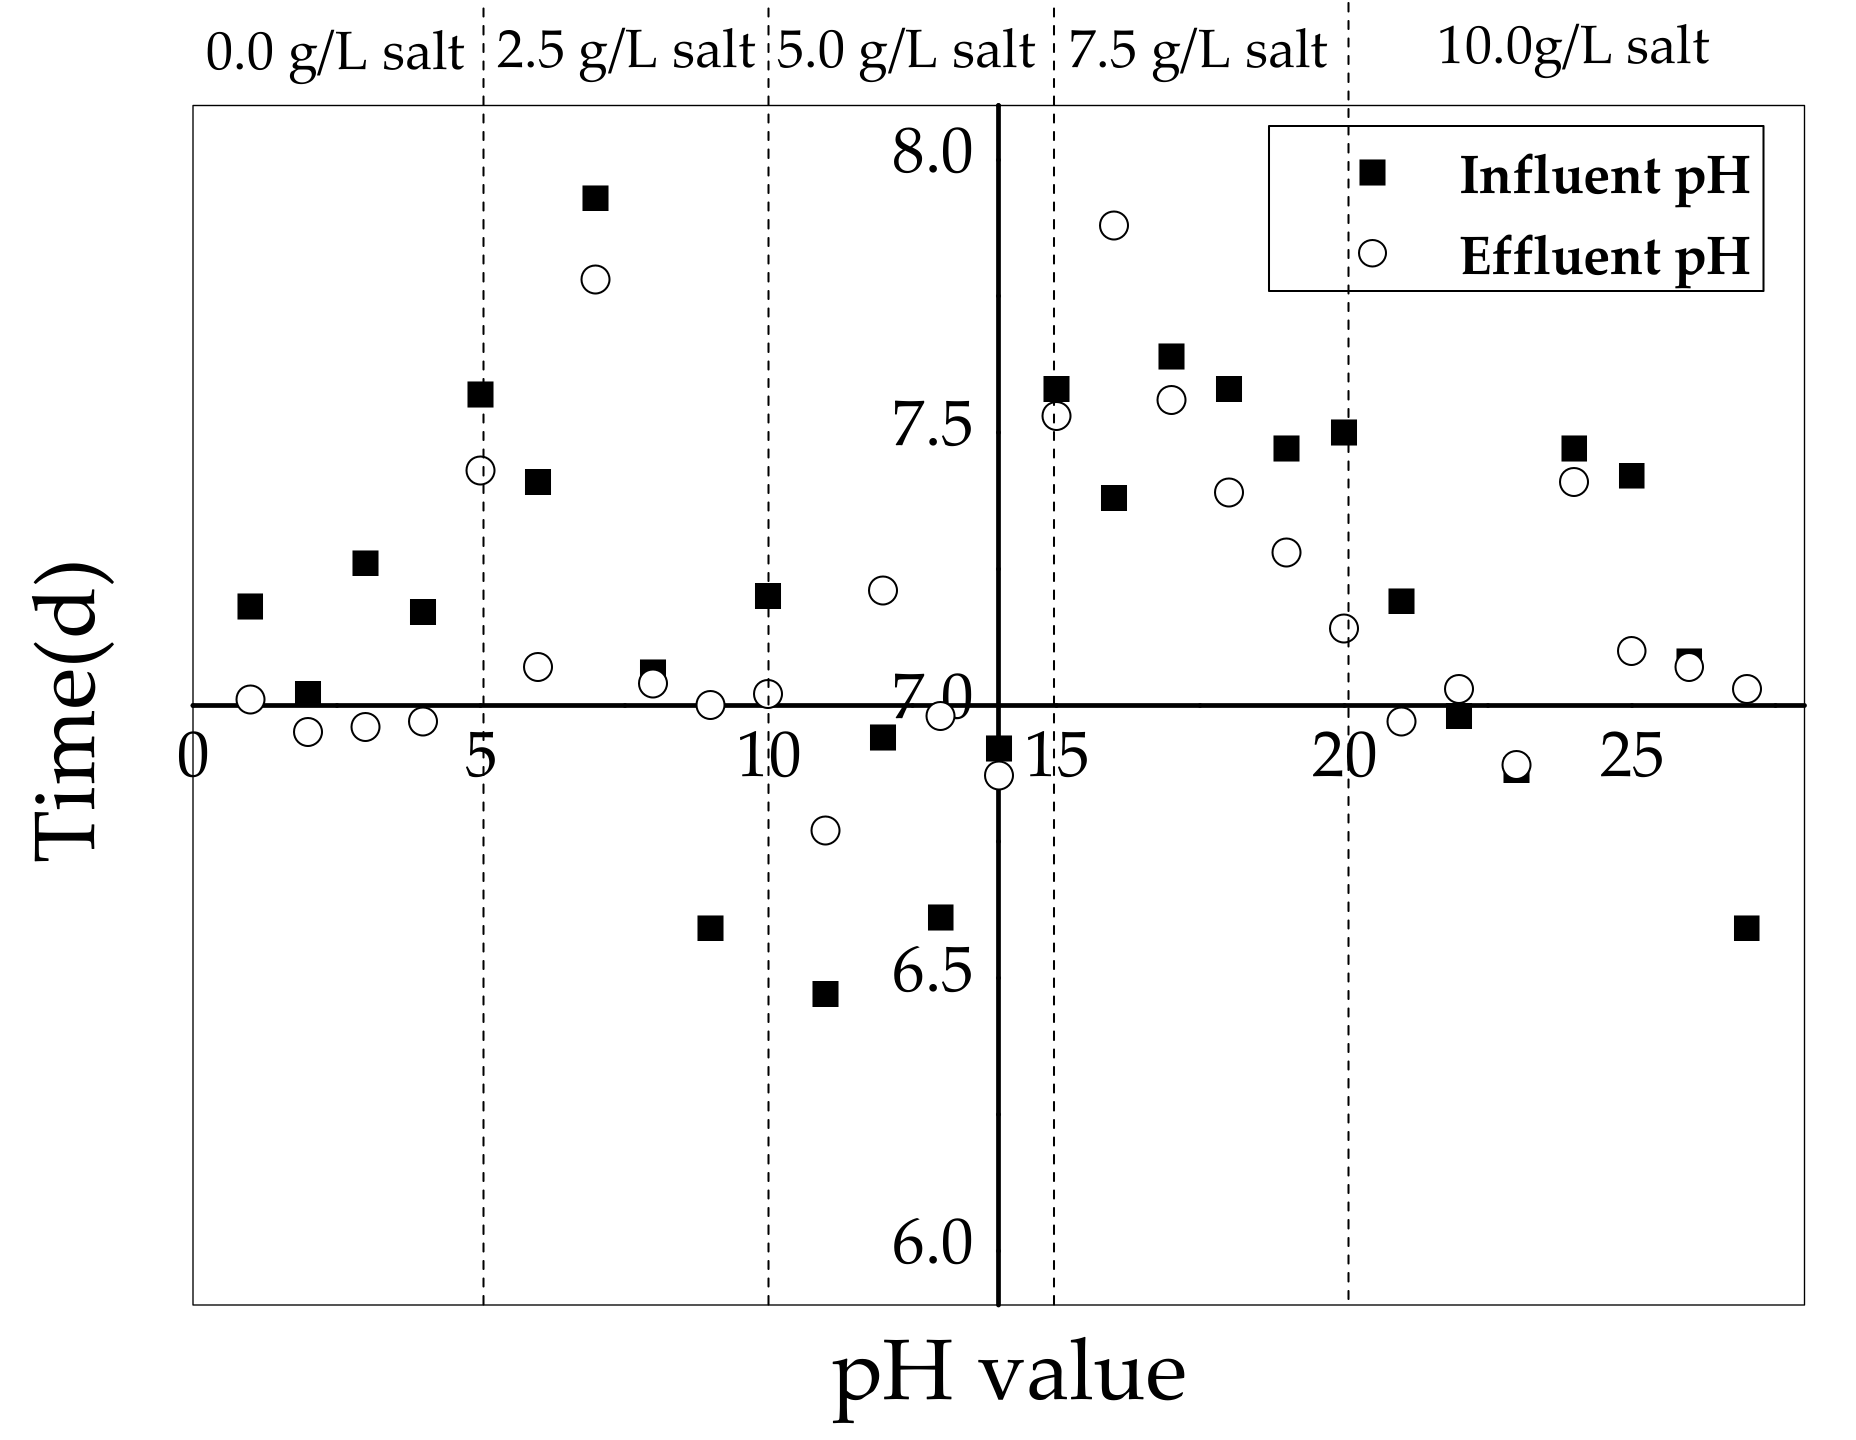
The pH variation in the SBBR during the whole operation is presented in Figure 6. The pH in influent varied from 7.96 to 6.50 and the highest pH in effluent was 7.90 and the lowest was 6.82. In biological process, pH is a significant element indicative of the operation in the system. For example, when the pH in the effluent was lower than 6.50, the denitrification process could not be achieved successfully. Moreover, the increase of pH in reactor indicated the stabilization of the system. The pH values in the system was around 7.00 because the nitrification process consumed pH, while the denitrification process increased alkalinity [28].
4. Discussion
4.1. Start-Up of Bioreactors
The start-up of bioreactors is a challenging and sensitive phase during the biological process, because the balance of microorganisms, such as AOB, NOB, Phosphorus Accumulating Organisms (PAOs) and Glycogen Accumulating Organisms (GAOs), is difficult to establish [29].
Many researchers have reported the start-up of bioreactors. For example, Sukru and Erdal [30] stated that a submerged biofilter reactor could be operated successfully after 150-day acclimation. Stable removal behaviors were achieved in an aerobic granule sludge system after the sludge was inoculated for 70 days [31]. Zhang et al. [13] operated a SBBR system for Completely Autotrophic Nitrogen removal Over Nitrite (Canon) process with a start-up period of 118 days. Fortunately, a quick start-up was achieved in 15 days in this SBBR system (Figure 2). This might because the spiral fiber in this SBBR system could offer a more optimal environment for the bacteria growth than other biofilm carriers. Another reason that could explain this phenomenon was that the biofilm grew rapidly in this reactor with biofilm concentration up to 7275 mg/L, more than that in other systems [32].
4.2. Effect of Salinity on COD Removal
As we mentioned, this reactor could bear the salinity of 10.0 g/L of NaCl along with removal efficiency of COD up to 90% (Figure 3). These results agreed with the study of Zhao et al. [27] who proposed that heterotrophic organisms performed well even at high salinity (2.0 wt %), obtaining COD removal efficiency to 81.0%. Nevertheless, Kargi and Dincer [33] observed that the COD removal efficiency fell from 85% to 59% when salinity increased from 0.0 wt % to 5.0 wt %. Uygur and Kargi [34] also utilized a SBR to treat synthetic saline wastewater, they observed a drop of COD removal efficiency from 90% to 32% when salinity increased from 0.0 wt % to 6.0 wt %. These results illustrated that the SBBR system was sensitive to salinity shock but dominant halophilic bacteria could be adapted at low salt concentration.
4.3. Effect of Salinity on Nitrogen Removal
During the start-up period, the total nitrogen concentration decreased gradually in the first nine days, but there was a sudden increase on Day 10 (Figure 2B). At the same time, there were about 27.0 mg/L of ammonia nitrogen and 2.1 mg/L of nitrite nitrogen accumulation in this SBBR system (Figure 2C,D). Eldon et al. [35] reported a similar result: when 20.0 mg/L of ammonia nitrogen and 15.0 mg/L nitrite nitrogen were accumulated in sequencing batch reactor, TN concentration in effluent increased to 48.0 mg/L. Thus, the sudden increase of TN might due to the inactivity of AOB and self-inhibition caused by nitrite.
As shown in Figure 4A,B, after addition of 7.5 g/L and 10.0 g/L of salt, the total nitrogen and ammonia nitrogen in the effluent increased significantly. However, their efficient removal could be recovered with subsequent cultivation, which indicated the adaptability of AOB to salinity. Zhao et al. [26] reported a similar result: when the salinity increased gradually to 20 g/L of NaCl, NH4+-N removal efficiency decreased. However, with domestication time extending, the removal efficiency of NH4+-N could be stable and return to the value of the previous period. This result was also consistent with Jang’s study [36]. Furthermore, he observed an increment in floc size when the salt concentrations increased. Maybe it could explain that with the increase of salinity, the removal efficiency of total nitrogen and ammonia almost did not change. On the other hand, the alkaline environment (Figure 6) formed by denitrification process was conducive to ammonia nitrogen removal [37].
However, there were about 5.0 mg/L nitrite nitrogen and 6.0 mg/L nitrate nitrogen (Figure 4C) accumulated under 7.5 g/L and 10.0 g/L of salt condition, indicating an inhibition of NOB and nitrate reduction bacteria (NRB) activity under salt stress. It was reported that the nitrite and nitrate clearly accumulated as the NaCl concentration increased from 5.5 g/L to 6.5 g/L [13], which was in accordance with our conclusion. In summary, AOB are more capable for adapting to salinity than NOB [38], and, once they were inhibited, a longer cultivation period would be needed.
4.4. Effect of Salinity on Phosphorus Removal
The effluent concentration of total phosphorus increased greatly from Day 3 to Day 5 during start-up period, and then there was a sudden decrease in TP effluent concentration on Day 6. By analyzing previous studies [39], we found that the fluctuation of TP concentration in effluent during start-up period was a very common phenomenon. Hence, the initial increase in TP concentration was probably due to the release of excessive phosphorus in domesticated sludge at the beginning of cultivation.
Similar to AOB and NOB, the activity of PAOs in terms of phosphorus uptake activity was also inhibited at a salinity level higher than 7.5 g/L of NaCl in this study (Figure 5), and long-period exposure to salt adaptation did not help in the removal of TP. Pronk et al. [40] reported that the decrease of phosphorus removal efficiency in bioreactor was mainly due to nitrite accumulation caused by the inhibition of salt on NOB activities rather than the salt itself. This could explain the observation in this study, since there was nitrite accumulated in SBBR (Figure 5C). As is known, there was a competition between PAOs and GAOs. Bassin et al. [41] reported that at high salinity levels (33.0 g/L NaCl), GAOs gained advantage over PAOs in their long-term experiment. Welles et al. [42] conducted a short-term experiment and also suggested that salinity higher than 6.0 g/L of NaCl favored GAOs over PAOs. Thus, the activity of PAOs in this system was almost not observed.
4.5. Comparisons with Other SBBRs
As we discussed, a quick start-up could be achieved in this salinity-persistent SBBR within 15 days. Although the removal of TP (less than 60%) was inhibited by the salinity more than 7.5 g/L of NaCl, stable removal efficiency of COD (92%), TN (80%), and NH4+-N (82%) could be obtained from 0.0 to 10.0 g/L salt concentration. This SBBR is compared with previous SBBRs in Table 2. Some researchers [14,32,43] investigated the behavior of pollutants removal in an intelligent, controlled SBBR on salt-free condition for municipal wastewater treatment, and high removal efficiency of TP was achieved. Although a stable and persistent partial nitrification was observed in an SBBR when the salinity was gradually increased to 6.5 g/L of NaCl by Zhang et al. [13], the start-up period for Canon process was about 37 days. The behaviors of granular sludge in an aerobic granule sequencing batch reactor were investigated at different salinities by Wang et al. [44], but the removal efficiency of COD and NH4+-N was not that satisfying. Moreover, Lu et al. [37] evaluated a laboratory scale SBBR under high salinity (1.40 wt % salinity), with COD and NH4+-N removal efficiency of 75.0% and 63.0%. The performance and bacteria community profiled in a SBBR treating saline wastewater was studied by Zhao et al. [26], and the removal efficiency of NH4+-N and TP could reach 95.0% at salinity of 2.0 wt %, but the removal of COD, TN, and TP was deteriorated at 2.5 wt % salinity. Overall, the SBBR developed in present study was competitive in the treatment of saline rural wastewater.
To achieve lower energy consumption, a reasonable intermittent operation (the distribution of aerobic time and anaerobic time) and an intelligent control mode based on the feedback of ammonia nitrogen concentration will be further studied in this SBBR system. Molecular biological analysis will also be conducted to further demonstrate the mechanism of nutrients removal.
5. Conclusions
A spiral fiber based salinity-resisted SBBR was developed to treat rural wastewater in salinization areas. A quick start-up has been achieved in this system with the biofilm quantity up to 7275 mg/L on average in 15 days. Furthermore, stable removal efficiency of COD (92.0%), TN (80.0%), and NH4+-N (82.0%) could be obtained with salinity levels from 0.0 to 10.0 g/L of NaCl. Nevertheless, the removal of TP (less than 60.0%) was inhibited by the salinity due to nitrite accumulation and plasmolysis of PAOs when the concentration after addition of higher than 7.5 g/L of salt.
Acknowledgments
This work was financed by the National Key Technology Research and Development Program (Project No. 2015BAL04B03, China) and Tianjin Research Program of Application Foundation and Advanced Technology (15JCQNJC08700).
Author Contributions
Y.-X.Z. and C.-F.C. conceived and designed the experiments; C.-F.C. performed the experiments; C.-F.C. analyzed the data; M.J., S.-Y.Z. and Z.-J.W. contributed reagents/materials/analysis tools; and Y.-X.Z. and C.-F.C. wrote the paper.
Conflicts of Interest
The authors declare no conflict of interest.
References
- Massoud, M.A.; Tarhini, A.; Nasr, J.A. Decentralized approaches to wastewater treatment and management: Applicability in developing countries. J. Environ. Manag. 2009, 90, 652–659. [Google Scholar] [CrossRef] [PubMed]
- Wang, Q.H.; Feng, C.P.; Zhao, Y.X.; Hao, C.B. Denitrification of nitrate contaminated groundwater with a fiber-based biofilm reactor. Bioresour. Technol. 2009, 100, 2223–2227. [Google Scholar] [CrossRef] [PubMed]
- Chae, S.R.; Chung, J.H.; Heo, Y.R.; Kang, S.T.; Lee, S.M.; Shin, H.S. Full-Scale implementation of a vertical membrane bioreactor for simultaneous removal of organic matter and nutrients from municipal wastewater. Water 2015, 7, 1164–1172. [Google Scholar] [CrossRef]
- Wan, D.J.; Liu, H.J.; Qu, J.H.; Lei, P.J.; Xiao, S.H.; Hou, Y.N. Using the combined bioelectrochemical and sulfur autotrophic denitrification system for groundwater denitrification. Bioresour. Technol. 2009, 100, 142–148. [Google Scholar] [CrossRef] [PubMed]
- Rodgers, M.; Healy, M.G.; Prendergast, J. Nitrification in a vertically moving biofilm system. J. Environ. Manag. 2006, 79, 242–246. [Google Scholar] [CrossRef] [PubMed]
- Oehmen, A.; Keller-Lehmann, B.; Zeng, R.J.; Yuan, Z.J.; Keller, E. Review: Optimisation of poly-b-hydroxyalknoate analysis using gas chromatography for enhanced biological phosphorus removal systems. J. Chromatogr. A 2005, 1070, 131–136. [Google Scholar] [CrossRef] [PubMed]
- Andreas, N.A.; Shane, A.S. Wastewater treatment and reuse: Past, present, and future. Water 2015, 7, 4887–4895. [Google Scholar]
- Zhang, Z.Y.; Zhou, J.T.; Wang, J.; Guo, H.Y.; Tong, J. Integration of nitrification and denitrifying dephosphatation in airlift loop sequencing batch biofilm reactor. Process Biochem. 2006, 41, 599–608. [Google Scholar] [CrossRef]
- Fu, B.; Liao, X.Y.; Ding, L.L.; Ren, H.Q. Characterization of microbial community in an aerobic moving bed biofilm reactor applied for simultaneous nitrification and denitrification. World J. Microbial. Biotechnol. 2010, 2, 1981–1990. [Google Scholar] [CrossRef]
- Brito, A.G.; Rodrigues, A.C.; Melo, F.L. Feasibility of a pulsed sequencing batch reactor with anaerobic aggregated biomass for the treatment of low strength wastewaters. Water Sci. Technol. 1997, 35, 193–198. [Google Scholar]
- Laconi, D.C.; Bonemazzi, F.; Lopez, A.; Ramadori, R. Integration of chemical and biological oxidation in a SBBR for tannery wastewater treatment. Water Sci. Technol. 2004, 50, 107–114. [Google Scholar]
- Ferraina, A.R.; Hu, Z.Q.; Ericson, F.J.; MacKey, A.A.; Smets, F.B. Biomass characteristics in three sequencing batch reactors treating a wastewater containing synthetic organic chemicals. Water Res. 2005, 39, 710–720. [Google Scholar]
- Zhang, Z.J.; Chen, S.H.; Wu, P.; Lin, L.F.; Luo, H.Y. Start-up of the Canon process from activated sludge under salt stress in a sequencing batch biofilm reactor (SBBR). Bioresour. Technol. 2010, 101, 6309–6314. [Google Scholar] [CrossRef] [PubMed]
- Cai, W.; Zhang, B.G.; Jin, Y.X.; Lei, Z.F.; Feng, C.P.; Ding, D.H.; Hu, W.W.; Chen, N.; Suemura, T. Behavior of total phosphorus removal in an intelligent controlled sequencing batch biofilm reactor for municipal wastewater treatment. Bioresour. Technol. 2013, 132, 190–196. [Google Scholar] [CrossRef] [PubMed]
- She, Z.L.; Zhao, L.T.; Zhang, X.L.; Jin, C.J.; Gu, L.; Yang, S.Y.; Zhao, Y.G.; Gao, M.C. Partial nitrification and denitrification in a sequencing batch reactor treating high-salinity wastewater. Chem. Eng. J. 2016, 288, 207–215. [Google Scholar] [CrossRef]
- Rodrigues, J.A.D.; Ratusznei, S.M.; Camargo, E.F.M.; Zaiat, M. Influence of the agitation rate on the performance of an anaerobic sequencing batch reactor containing granulated biomass treating low strength wastewater. Adv. Environ. Res. 2003, 7, 405–410. [Google Scholar] [CrossRef]
- Dincer, A.R.; Kargi, F. Salt inhibition kinetics in nitrification of synthetic saline wastewater. Enzym. Microb. Technol. 2001, 28, 661–665. [Google Scholar] [CrossRef]
- Bencherif, K.; Boutekrabt, A.; Fontaine, J.; Laruelle, F.; Yolande, D.; Anissa, A.L.H. Impact of soil salinity on arbuscular mycorrhizal fungi biodiversity and microflora biomass associated with Tamarix articulata Vahll rhizosphere in arid and semi-arid Algerian areas. Sci. Total Environ. 2015, 533, 488–494. [Google Scholar] [CrossRef] [PubMed]
- Liao, R.H.; Yan, L.; Wang, Z.; Miao, Y.; Shen, K.; Peng, S.; Ma, Y.; Tao, L.W.; Li, A.M. 454 pyrosequencing analysis on microbial diversity of an expanded granular sludge bed reactor treating high NaCl and nitrate concentration wastewater. Biotechnol. Bioprocess Eng. 2014, 19, 183–190. [Google Scholar] [CrossRef]
- Wang, J.L.; Zhan, X.M.; Feng, Y.C.; Qian, Y. Effect of salinity variations on the performance of activated sludge system. Biomed. Environ. Sci. 2005, 18, 5–8. [Google Scholar] [PubMed]
- Gao, F.; Zhang, H.M.; Yang, F.L.; Qian, G.H.; Li, H.G.; Zhang, R. Study of an innovative anaerobic (A)/Oxic (O)/aerobic (A) bioreactor based on denitrification-anammox technology treating low C/N municipal sewage. Chem. Eng. J. 2013, 232, 65–73. [Google Scholar] [CrossRef]
- Ferrer-Polonio, E.; Mendoza-Roca, J.A.; Iborra-Clar, A.; Alonso-Molina, J.L.; Pastor-Alcaniz, L. Biological treatment performance of hypersaline wastewaters with high phenols concentration from table olive packaging industry using sequencing batch reactors. J. Ind. Eng. Chem. 2016, 43, 44–52. [Google Scholar] [CrossRef]
- Sun, C.; Leiknes, T.; Jan, W.; Bernt, T. Salinity effect on a biofilm-MBR process for shipboard wastewater treatment. Sep. Purif. Technol. 2010, 72, 380–387. [Google Scholar] [CrossRef]
- Uygur, A. Specific nutrient removal rates in saline wastewater treatment using sequencing batch reactor. Process Biochem. 2006, 41, 61–66. [Google Scholar] [CrossRef]
- Zhai, S.Y.; Ji, M.; Zhao, Y.X.; Pavlostathis, S.G.; Zhao, Q. Effects of salinity and COD/N on denitrification and bacterial community in dicyclic-type electrode based biofilm reactor. Chemosphere 2018, 192, 328–336. [Google Scholar] [CrossRef] [PubMed]
- Zhao, Y.Y.; Park, H.; Park, J.; Zhang, F.S.; Chen, C.; Li, X.K.; Zhao, D.; Zhao, F.B. Effect of different salinity adaptation on the performance and microbial community in a sequencing batch reactor. Bioresour. Technol. 2016, 216, 808–816. [Google Scholar] [CrossRef] [PubMed]
- Olivier, L.; Vasudevan, N.; Margarita, T.; Moletta, R. Anaerobic digestion of tannery soak liquor with an aerobic post-treatment. Water Res. 2006, 40, 1492–1500. [Google Scholar]
- Ge, S.J.; Peng, Y.Z.; Wang, S.Y.; Guo, J.H.; Ma, B.; Zhang, L.; Cao, X. Enhanced nutrient removal in a modified step feed process treating municipal wastewater with different inflow distribution ratios and nutrient ratios. Bioresour. Technol. 2010, 101, 9012–9019. [Google Scholar] [CrossRef] [PubMed]
- Lins, P.; Reitschuler, C.; Illmer, P. Development and evaluation of inocula combating high acetate concentrations during the start-up of an anaerobic digestion. Bioresour. Technol. 2012, 104, 37–43. [Google Scholar] [CrossRef] [PubMed]
- Sukru, A.; Erdal, S. Influence of salinity on partial nitrification in a submerged biofilter. Bioresour. Technol. 2012, 118, 24–29. [Google Scholar]
- Wang, Z.W.; Mark, C.M.; van Loosdrecht, M.C.M.; Pascal, E.S. Gradual adaptation to salt and dissolved oxygen: Strategies to minimize adverse effect of salinity on aerobic granular sludge. Water Res. 2017, 124, 702–712. [Google Scholar] [CrossRef] [PubMed]
- Jin, Y.X.; Ding, D.H.; Feng, C.P.; Tong, S.; Suemura, T.; Zhang, F. Performance of sequencing batch biofilm reactors with different control systems in treating synthetic municipal wastewater. Bioresour. Technol. 2012, 104, 12–18. [Google Scholar] [CrossRef] [PubMed]
- Karg, F.; Dincer, A.R. Use of halophilic bacteria in biological treatment of saline wastewater by fed-batch operation. Water Environ. Res. 2000, 72, 170–174. [Google Scholar] [CrossRef]
- Uygur, A.; Kargi, F. Salt inhibition on biological nutrient removal from saline wastewater in a sequencing batch reactor. Enzym. Microb. Technol. 2004, 34, 313–318. [Google Scholar] [CrossRef]
- Eldon, R.R.; Sung, J.K.; Hung, S.P. Effect of COD/N ratio and salinity on the performance of sequencing batch reactors. Bioresour. Technol. 2008, 99, 839–846. [Google Scholar]
- Jang, D.; Hwang, Y.; Shin, H.; Lee, W. Effects of salinity on the characteristics of biomass and membrane fouling in membrane bioreactors. Bioresour. Technol. 2013, 141, 50–56. [Google Scholar] [CrossRef] [PubMed] [Green Version]
- Lu, J.; Yan, X.; Ma, Y.F.; Tian, C.X.; Ding, J.C. Impact of salinity on treatment of saline wastewater by sequencing batch biofilm reactor process. J. Cent. South Univ. Technol. 2014, 21, 1989–1994. [Google Scholar] [CrossRef]
- Liu, S.T.; Yang, F.L.; Gong, Z.; Su, Z.C. Assessment of the positive effect of salinity on the nitrogen removal performance and microbial composition during the start-up of CANON process. Appl. Microbial. Biotechnol. 2008, 80, 339–348. [Google Scholar] [CrossRef] [PubMed]
- Yang, S.; Yang, F.L.; Fu, Z.M.; Wang, T.; Lei, R.B. Simultaneous nitrogen and phosphorus removal by a novel sequencing batch moving bed membrane bioreactor for wastewater treatment. J. Hazard. Mater. 2010, 175, 551–557. [Google Scholar] [CrossRef] [PubMed]
- Pronk, M.; Bassin, J.P.; de Kreuk, M.K.; Kleerebezem, R.; van Loosdrecht, M.C.M. Evaluating the main and side effects of high salinity on aerobic granular sludge. Appl. Microbiol. Biotechnol. 2014, 98, 1339–1348. [Google Scholar] [CrossRef] [PubMed]
- Guo, N.; Zhang, J.; Xie, H.J.; Tan, L.R.; Luo, J.N.; Tao, Z.Y.; Wang, S.J. Effects of the Food-to-Microorganism (F/M) Ratio on N2O Emissions in Aerobic Granular Sludge Sequencing Batch Airlift Reactors. Water 2017, 9, 477–488. [Google Scholar] [CrossRef]
- Welles, L.; Lopez-Vazquez, C.M.; Hooijmans, C.M.; van Loosdrecht, M.C.M.; Brdjanovic, D. Impact of salinity on the anaerobic metabolism of phosphate-accumulating organisms (PAO) and glycogen-accumulating organisms (GAO). Appl. Microbiol. Biotechnol. 2014, 98, 7609–7622. [Google Scholar] [CrossRef] [PubMed]
- Ding, D.H.; Feng, C.P.; Jin, Y.X.; Hao, C.B.; Zhao, Y.X.; Suemura, T. Domestic sewage treatment in a Sequencing Batch Biofilm Reactor (SBBR) with an intelligent controlling system. Desalination 2011, 276, 260–265. [Google Scholar] [CrossRef]
- Wang, Z.C.; Gao, M.C.; She, Z.L.; Wang, S.; Jin, C.J.; Zhao, Y.G.; Yang, S.Y.; Guo, L. Effects of salinity on performance, extracellular polymeric substances and microbial community of an aerobic granular sequencing batch reactor. Sep. Purif. Technol. 2015, 144, 223–231. [Google Scholar] [CrossRef]
Figure 1.
(A) Scheme of the sequencing biofilm batch reactor: (1) bioreactor; (2) influent; (3) effluent; (4) diffusers; (5) overflow pipe; (6) inlet tank; (7) peristaltic pump; (8) air compressor; (9) biofilm carrier; and (10) water collector; and (B) a photo of the biofilm carrier.
Figure 1.
(A) Scheme of the sequencing biofilm batch reactor: (1) bioreactor; (2) influent; (3) effluent; (4) diffusers; (5) overflow pipe; (6) inlet tank; (7) peristaltic pump; (8) air compressor; (9) biofilm carrier; and (10) water collector; and (B) a photo of the biofilm carrier.
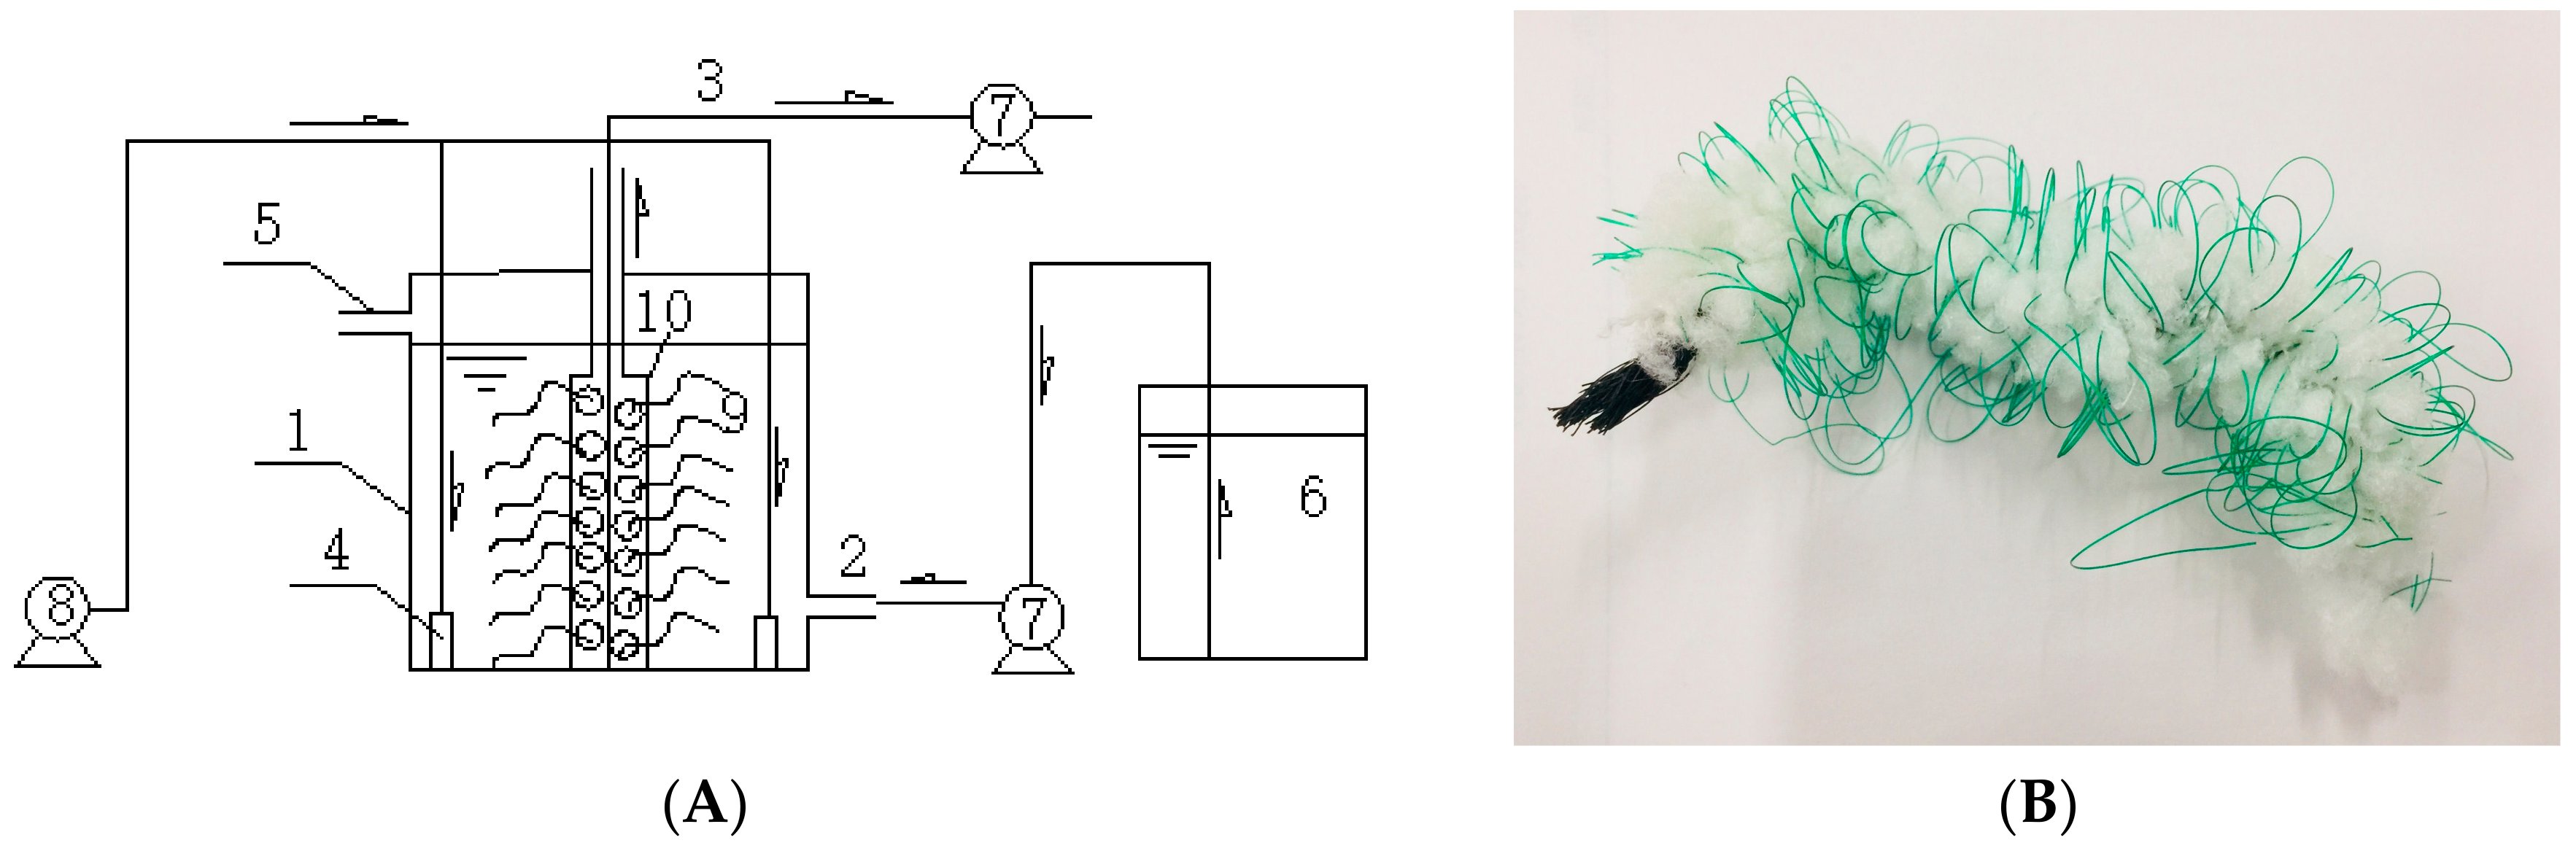
Figure 2.
Performance of SBBR during start-up period: the effluent concentration and removal efficiency of COD (chemical oxygen demand), TN (total nitrogen), NH4+-N (ammonia nitrogen), and TP (total phosphorus), respectively (A–E); and the effluent concentration of NO3−-N (nitrate nitrogen) and NO2−-N (nitrite nitrogen) (D); the “d” refers to “day” in the horizontal axis (Time).

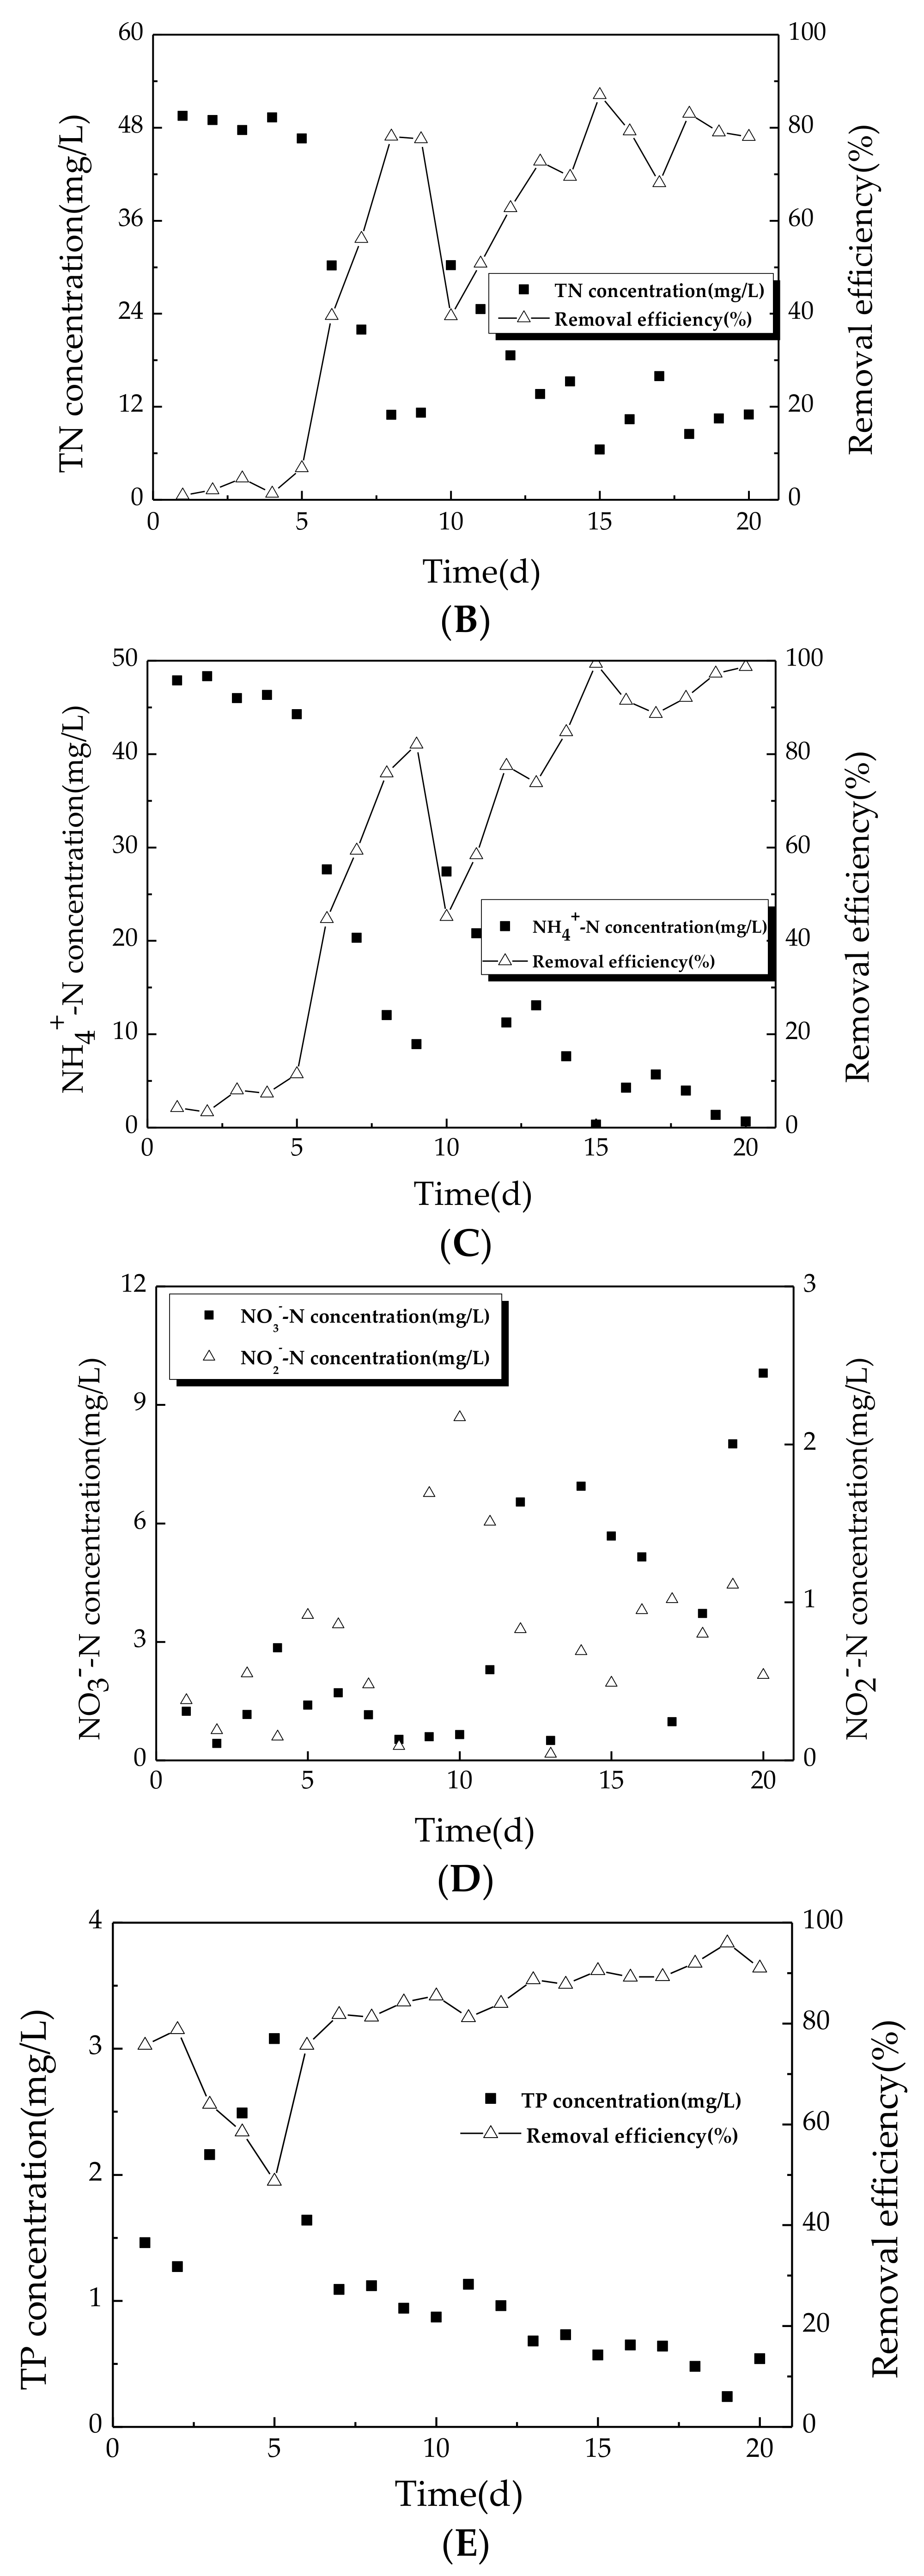
Figure 3.
Removal of COD at varying salinity.

Figure 4.
Removal of nitrogen at varying salinity: the effluent concentration and removal efficiency of TN and NH4+-N, respectively (A,B); and the effluent concentration of NO3−-N and NO2−-N (C).
Figure 4.
Removal of nitrogen at varying salinity: the effluent concentration and removal efficiency of TN and NH4+-N, respectively (A,B); and the effluent concentration of NO3−-N and NO2−-N (C).

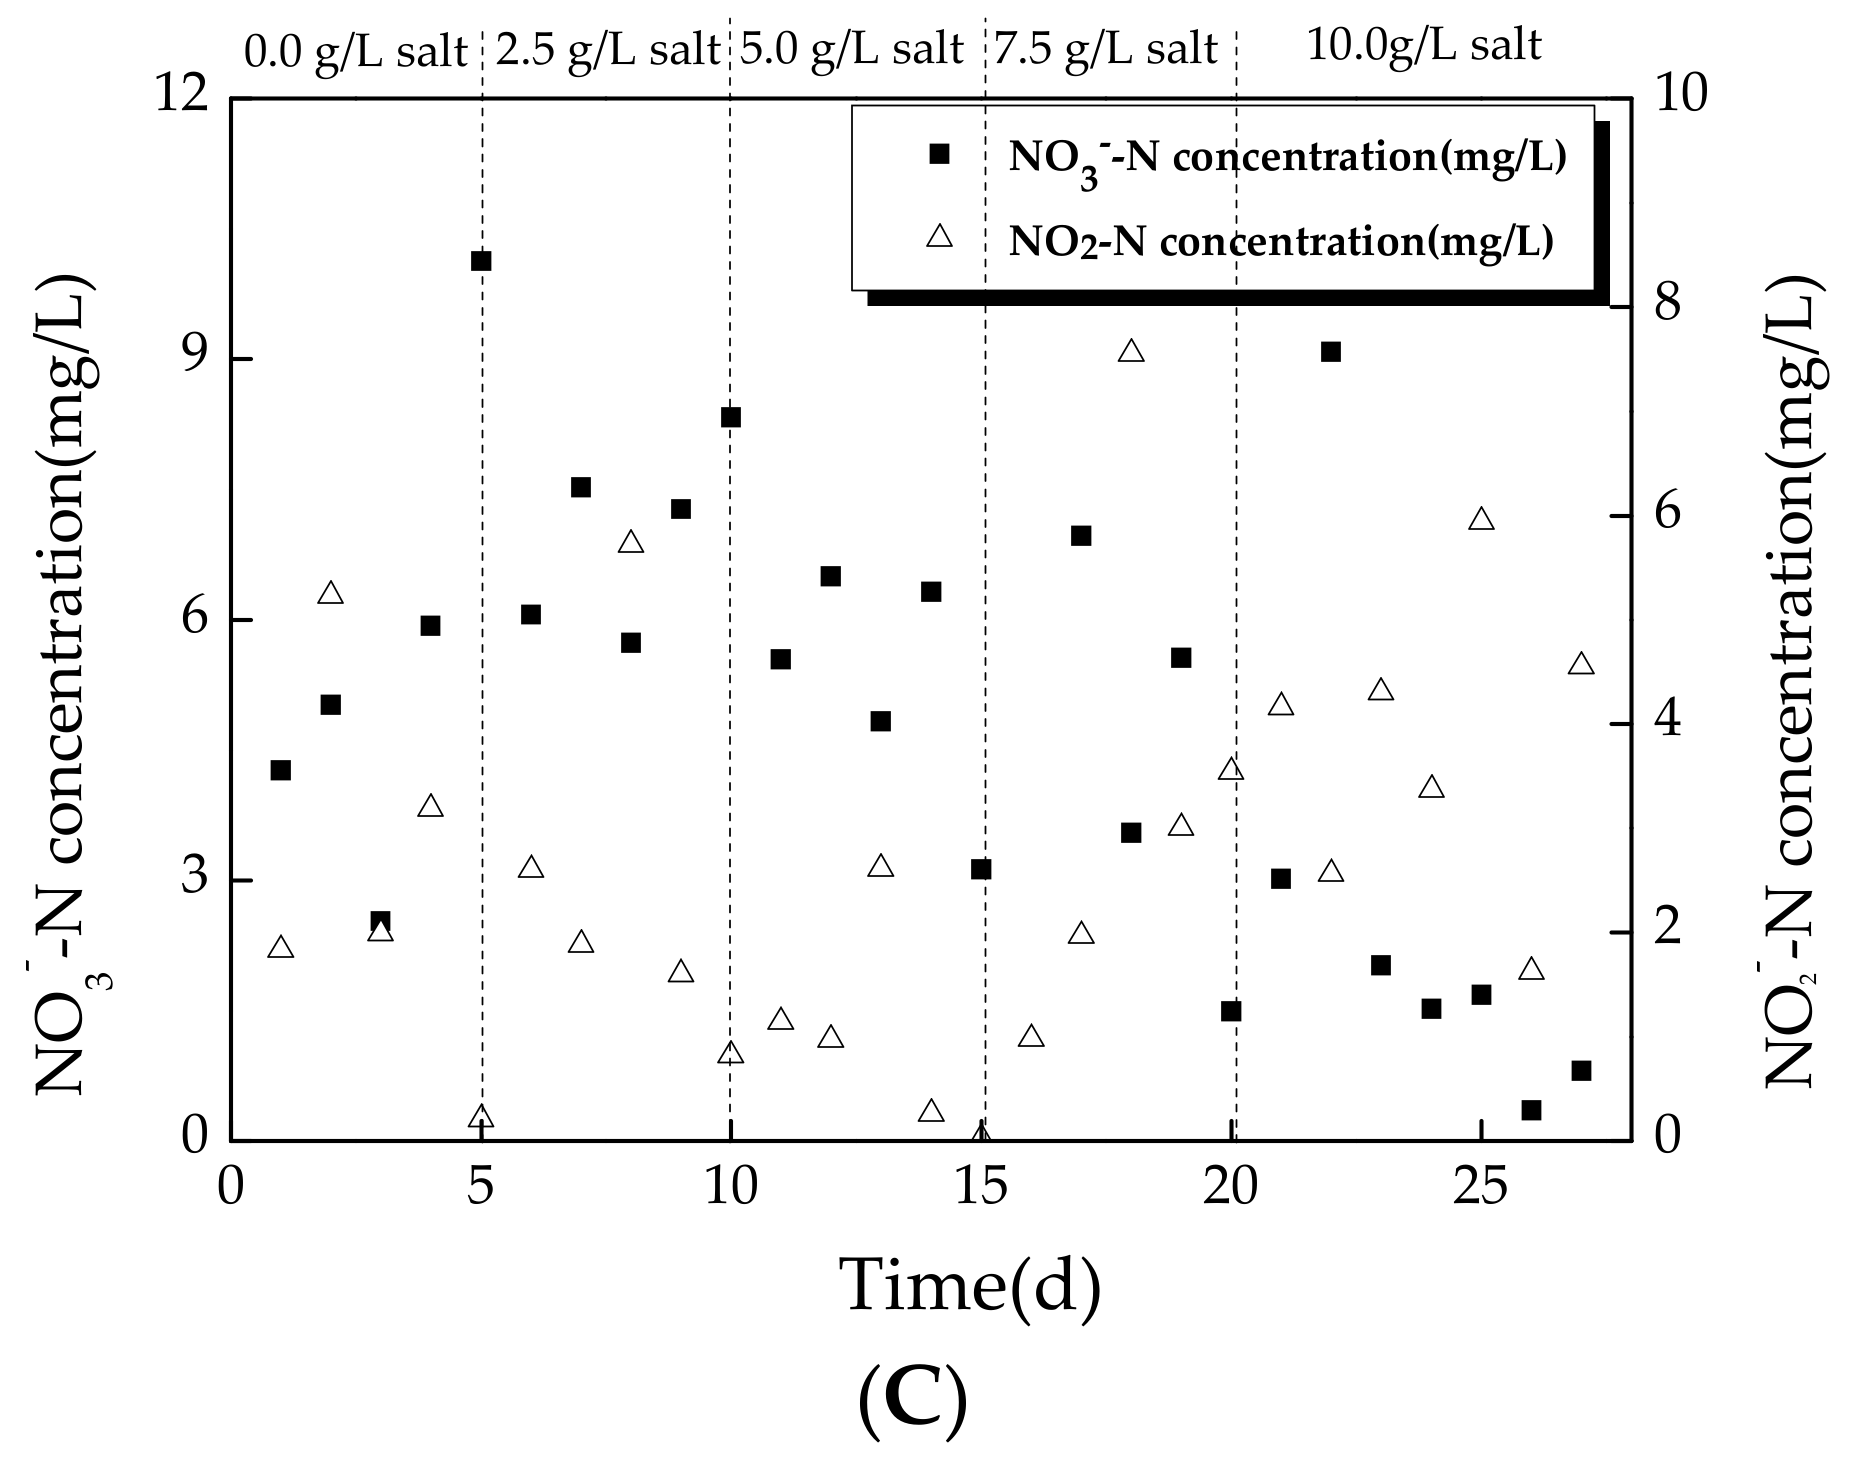
Figure 5.
Removal of TP at varying salinity.

Figure 6.
Variation of pH (potential of hydrogen) at varying salinity.


Table 1.
Characteristics of the synthesis wastewater during start-up operation.
| Parameter | COD (mg/L) | NH4+-N (mg/L) | TN (mg/L) | TP (mg/L) | pH |
|---|---|---|---|---|---|
| Values | 500.0 ± 60.0 | 50.0 ± 2.5 | 50.0 ± 2.5 | 5.9 ± 0.5 | 7.4 ± 0.5 |
Table 2.
Comparisons with other Biological Systems (Initial con. refers to initial concentration; Removal Effic. refers to removal efficiency of the pollutants; and Refs. refers to references).
Table 2.
Comparisons with other Biological Systems (Initial con. refers to initial concentration; Removal Effic. refers to removal efficiency of the pollutants; and Refs. refers to references).
| Salinity | Acclima-Tion Period (d) | TN (Total Nitrogen) | TP (Total Phosphorus) | COD (Chemical Oxygen Demand) | NH4+-N (Ammonia Nitrogen) | Refs. | ||||
|---|---|---|---|---|---|---|---|---|---|---|
| Initial Con. (mg/L) | Rem-Oval Effic. | Initial Con. (mg/L) | Rem-Oval Effic. | Initial Con. (mg/L) | Rem-Oval Effic. | Initial Con. (mg/L) | Rem-Oval Effic. | |||
| 0.00 wt % | - | - | - | 6 | 92% | 370 | 86% | - | - | [14] |
| 0.00 wt % | 7 | 35 | 90% | 5.5 | 93% | 350 | 85% | 35 | 92% | [32] |
| 0.00 wt % | 45 | 50 | 80% | 2.5 | 90% | 500 | 93% | 50 | 85% | [44] |
| 0.65 wt % | 37 | 150 | 27% | - | - | - | - | 150 | 35% | [13] |
| 0.75 wt % | 15 | 50 | 85% | 6 | 60% | 500 | 97% | 50 | 92% | This study |
| 1.00 wt % | 80 | - | - | - | - | 1300 | 90% | 70 | 90% | [43] |
| 1.40 wt % | 34 | - | - | - | - | 500 | 75% | 30 | 63% | [37] |
| 2.00 wt % | 40 | - | - | 25 | 95% | 1000 | 93% | 50 | 96% | [26] |
© 2017 by the authors. Licensee MDPI, Basel, Switzerland. This article is an open access article distributed under the terms and conditions of the Creative Commons Attribution (CC BY) license (http://creativecommons.org/licenses/by/4.0/).
Share and Cite
MDPI and ACS Style
Zhao, Y.-X.; Chao, C.-F.; Zhai, S.-Y.; Wang, Z.-J.; Ji, M. Treatment of Rural Wastewater Using a Spiral Fiber Based Salinity-Persistent Sequencing Batch Biofilm Reactor. Water 2017, 9, 970. https://doi.org/10.3390/w9120970
AMA Style
Zhao Y-X, Chao C-F, Zhai S-Y, Wang Z-J, Ji M. Treatment of Rural Wastewater Using a Spiral Fiber Based Salinity-Persistent Sequencing Batch Biofilm Reactor. Water. 2017; 9(12):970. https://doi.org/10.3390/w9120970
Chicago/Turabian StyleZhao, Ying-Xin, Chun-Fang Chao, Si-Yuan Zhai, Zi-Jian Wang, and Min Ji. 2017. "Treatment of Rural Wastewater Using a Spiral Fiber Based Salinity-Persistent Sequencing Batch Biofilm Reactor" Water 9, no. 12: 970. https://doi.org/10.3390/w9120970
Note that from the first issue of 2016, this journal uses article numbers instead of page numbers. See further details here.