Effect of Sediment Accumulation on Best Management Practice (BMP) Stormwater Runoff Volume Reduction Performance for Roadways

1
Civil Engineering Department, Southern Illinois University Edwardsville, 61 Circle Dr., Edwardsville, IL 62026, USA
2
Illinois Department of Transportation, 2300 S. Dirksen Parkway, Springfield, IL 62764, USA
*
Author to whom correspondence should be addressed.
Water 2017, 9(12), 980; https://doi.org/10.3390/w9120980
Submission received: 28 September 2017
/
Revised: 5 December 2017
/
Accepted: 8 December 2017
/
Published: 15 December 2017
Abstract
:Best management practices (BMPs) are commonly used to reduce the adverse effects of post-construction runoff. BMP deterioration happens over time when these age and the infiltration rate decreases as a result of sediment accumulation. The objective of this paper was to investigate the effect of sediment accumulation on BMP stormwater runoff volume reduction performances. The BMPs studied included a bioswale and an infiltration trench. To undertake this research, both field tests and numerical simulations were conducted under five different and single rainfall events with a wide range of intensities and duration. The minimal sediment accumulation of 0.22 kg/m2·year was considered in this study. Three different sedimentation accumulation configurations (i.e., new, 2-year-old, and 10-year-old BMPs) were considered. According to the results, the infiltration trench had 100% runoff reduction efficiency in all conditions including high-intensity rain and 10-year-old BMP age. The performance of the bioswale for the first 2 and 10 years deteriorated by about 55% and 70%, respectively.
1. Introduction
Hydrologic performance of stormwater best management practices (BMPs) is critical to their effectiveness in reducing the adverse impacts of urbanization and development on receiving waters [1,2,3,4]. While many studies show effectiveness of the BMPs in treating stormwater runoff quality, the focus of this paper is more on quanitity aspects. Various studies focused on the performance of BMPs at different scales. For example, the National Cooperative Highway Research Program (NCHRP) 565 [5], NCHRP 728 [6] and NCHRP 792 [7] reports, which refer to the Poresky et al. [1] study, summarized the monitoring data of BMP sites reported to the International BMP Database. This database shows an average volume reduction of 35% to 65% for bioswales with underdrain practices. Other studies show that the percentage runoff volume reduction for vegetated filter strips range from 40% to 85% and for vegetated swales from 50% to 94% [8,9]. Studies demonstrated almost 100% mitigation capacity for infiltration trenches [10,11]. Therefore, for linear projects such as roadways in urban areas, volume reduction can be achieved using infiltration trenches, and bioswales [6,12]. Although the literature offers extensive information regarding BMP performance, monitoring efforts have been limited to short-term and localized evaluations.
The difference in performances may be due to the sizes of the BMPs studied, magnitudes of storm events, site conditions, and BMP conditions at the time of monitoring. It should be noted that the majority of the grass swales in the BMP database (approximately 70%) were designed in the 1990s and 1980s or earlier, and they may not have performed at their full capacity at the time of monitoring [13]. The reported sites might have significant differences in site conditions including geometry, soil conditions, vegetated surface cover, age of BMP and topography.
Since a lot of information is missing from reported sites to make this comparison effective, some studies used numerical simulations to evaluate the effect of each parameter on BMP system performance. Some of the numerical simulation studies include the Hydrological Simulation Program–Fortran (HSPF) [3,14], the Soil and Water Assessment Tool (SWAT) [15,16], the Long-Term Hydrologic Impact Assessment–Low Impact Development (L-THIA–LID) [17,18,19], and the Storm Water Management Model (SWMM) [20,21,22,23,24]. This paper seeks to explore BMP performance deterioration due to sediment accumulation using field and numerical simulations. The BMPs were subjected to single rainfall events and their performances were monitored.
2. Field Test
2.1. Location
BMPs are designed according to the physical site constraints such as the infiltration capacity of the soil, soil permeability, depth to groundwater table, size of the drainage area, type of vegetation, and site slope. In this study, the BMPs were designed for linear projects and simulated to collect highway stormwater runoff. The test site was at the Southern Illinois University Edwardsville (i.e., SIUE) campus in Edwardsville, Illinois.
2.2. Soil Type and Sedimentation
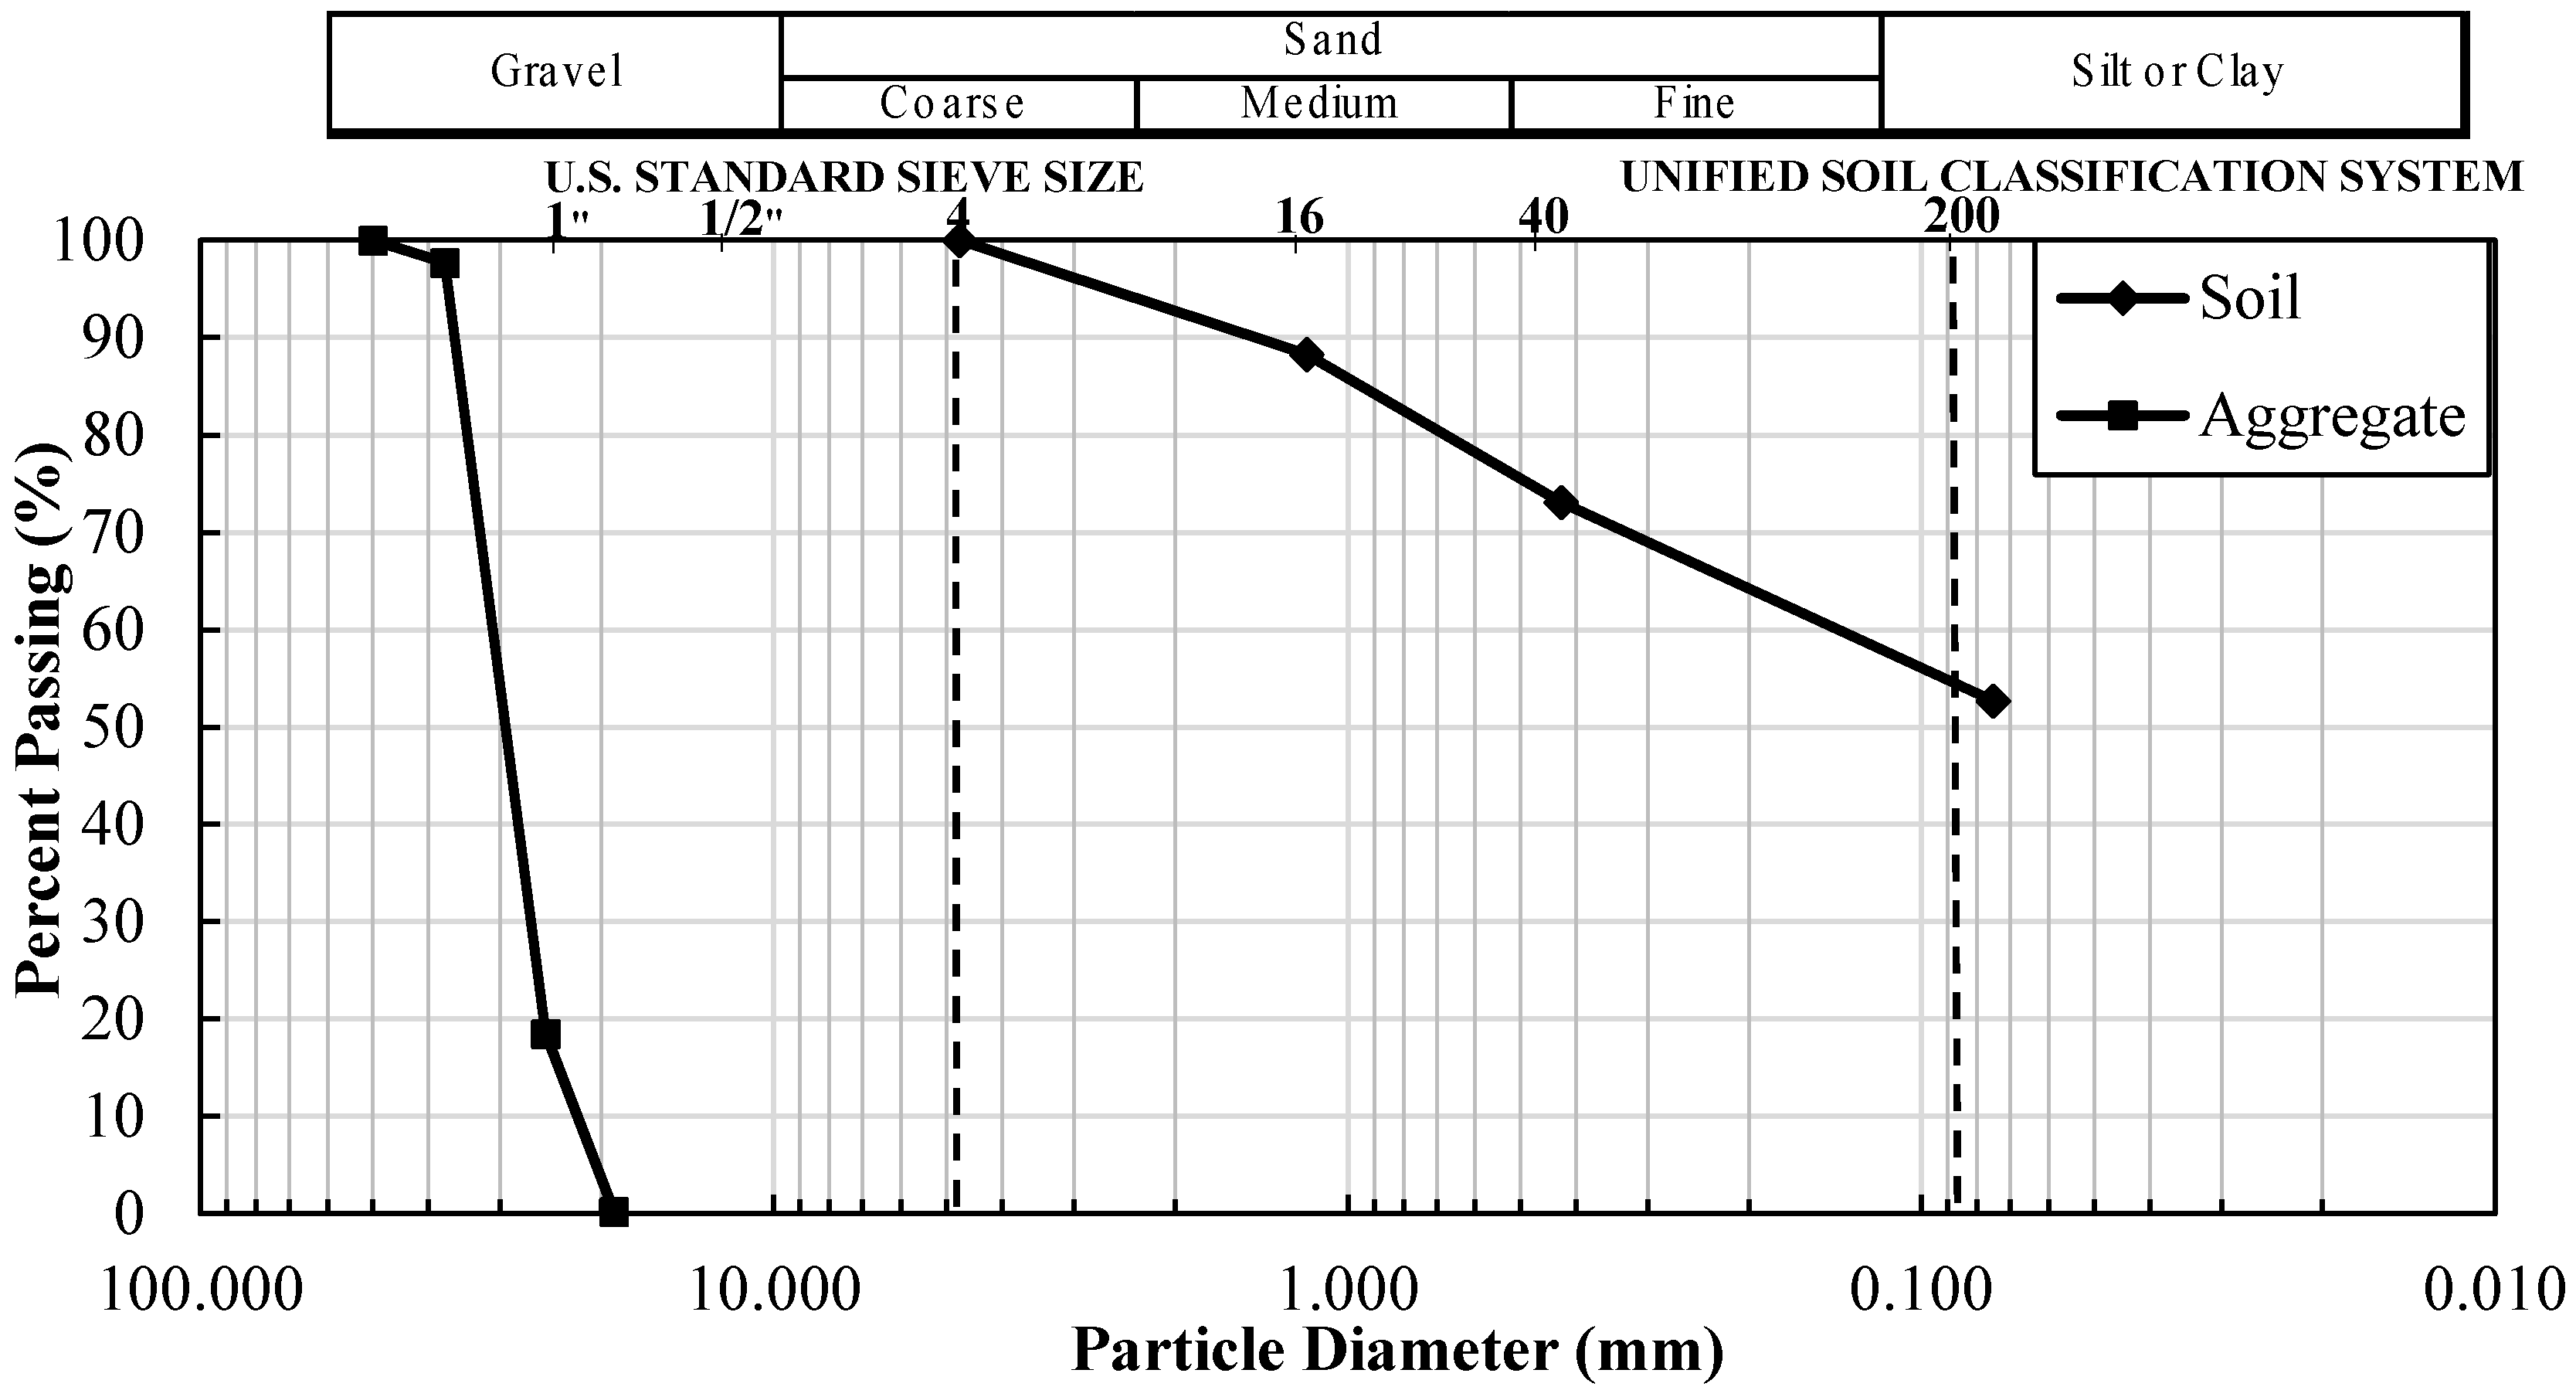
To classify the in situ soil, three samples were taken from three different locations on the site from depths of 0.1 m, 0.5 m, and 1.5 m below the ground level. Grain size distribution is shown in Figure 1. The soil plasticity index was 10% with the liquid limit of 30%. According to the Unified Soil Classification System (USCS), the soil type was classified as Sandy Lean Clay. To simulate aging in the test cells, the passing No. 8 sieve of native soil was tested for sedimentation. The infiltration rate of the sediments in a loose state utilizing a Turf-Tec infiltrometer was determined at 11.7 mm/min, and 3.3 mm/min in unsaturated and saturated conditions, respectively. The infiltration rate of the native soil, at the depth of 1.5 m below the ground level, in a low- and high-saturated state was measured as 53 mm/min and 5 mm/min, respectively. The aggregate used in the test cells had the specific gravity of 2.53 with a bulk density and void ratio of 1466 kg/m3 and 42% in the loose state. The gradation curve for the utilized aggregate is also shown in Figure 1.
In order to represent different ages of the BMP or different levels of regular maintenance, transported sediments were deposited on BMPs. The amount of sediment deposited on the bioswale was estimated by calculating the soil loss close to the highway environment based on the Universal Soil Loss Equation (USLE) [25]. As per the Environmental and Resource Policy of Madison County Soil and Water Conservation District (SWCD) and the National Conservation District Employees Association (NCDEA), the sediment accumulation can be 1 kg/m2·year, 5 kg/m2·year, 12 kg/m2·year and more than 17.6 kg/m2·year for a stabilized small watershed area with fine-textured soils, agricultural areas, and construction sites, respectively.
2.3. Field-Test Design
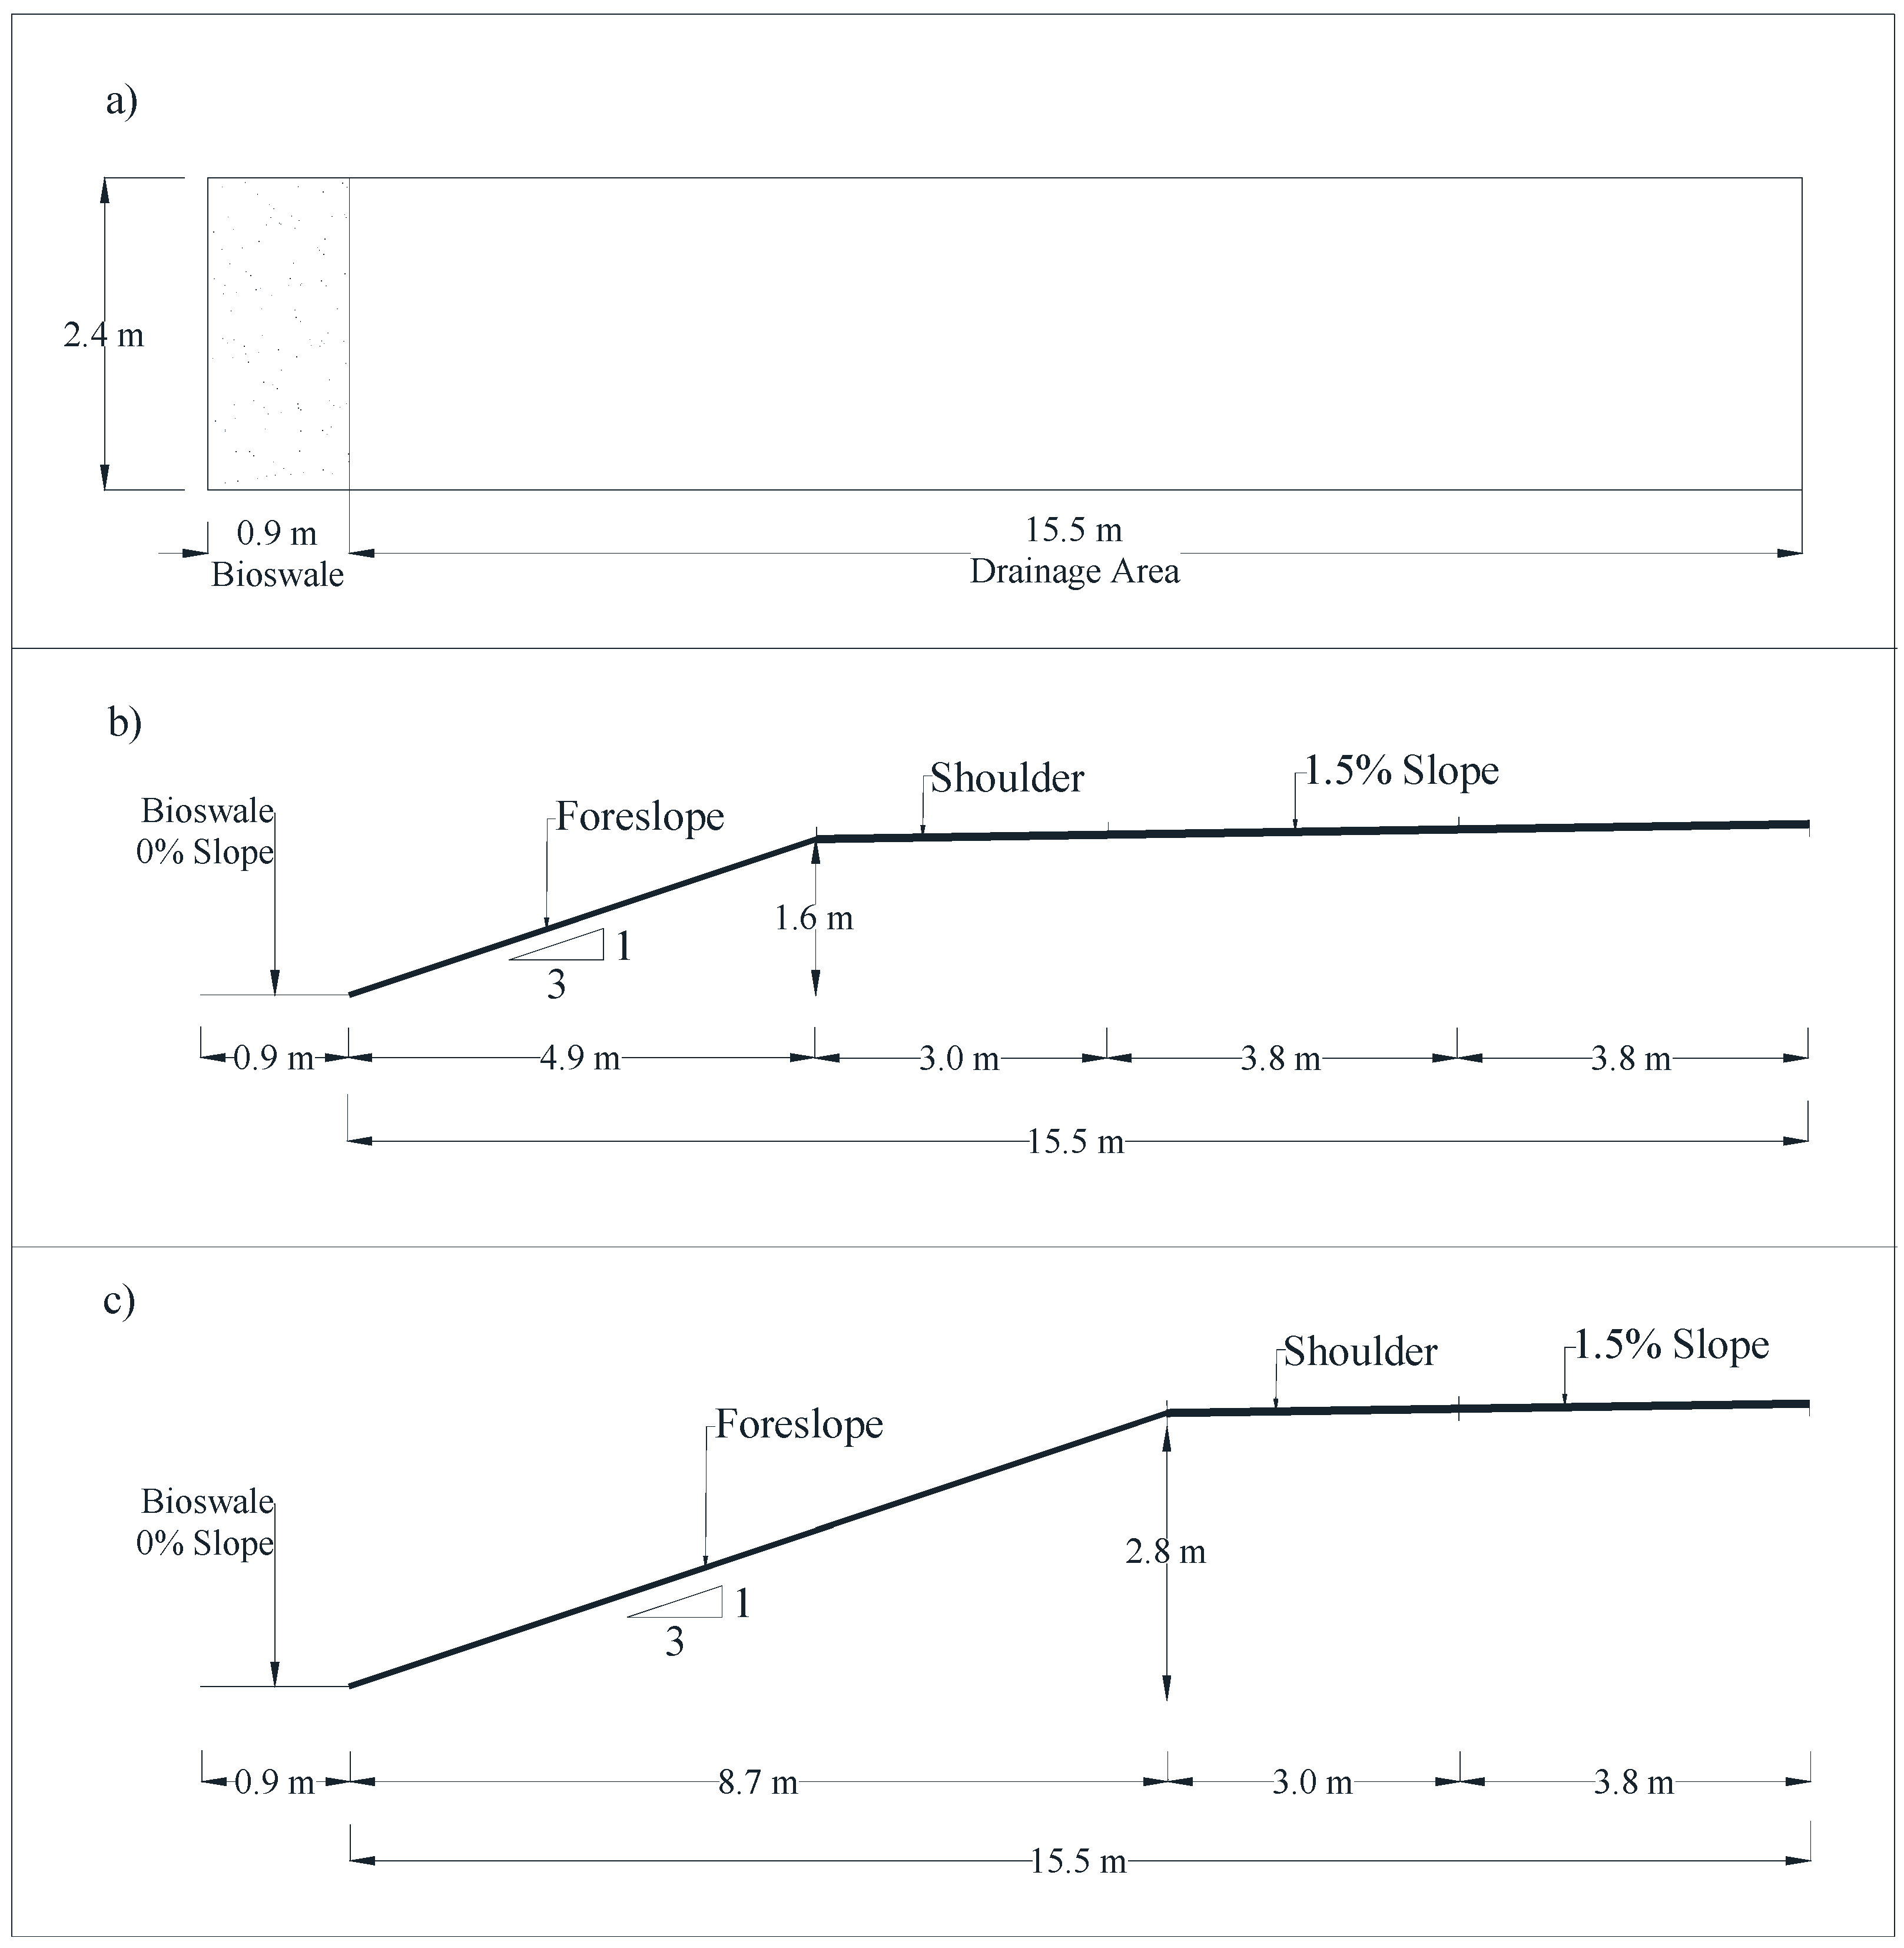
The different possible highway layout scenarios that were considered are shown in Figure 2. As shown in Figure 2a, the width of the drainage area for the field test and modeling is considered as 15.25 m (50 ft) to accommodate the hydraulic constraints in a constructed facility. In Figure 2b,c, one-lane with a shoulder and two-lane with a shoulder highways are illustrated as two possible design scenarios for a highway with the aforementioned constraints.
Figure 3a shows the layout of all the test cells, tanks, and piping systems. Three test cells, B1, B2, and B3 are 10-year-old, 2-year-old, and with new bioswales, respectively; while, IT1, IT2, and IT3 are 10-year-old, 2-year-old, and with new infiltration trenches. The water was stored in the tanks and conveyed through pipes based on gravity to test cells during the tests. The water flow was controlled by a valve adjacent to a flowmeter. The elevation difference between test cells and the water level in the tanks varied from 2.7 m to 3.4 m when the tanks were empty and full.
As Figure 3b shows, in order to introduce the water to the surface of the BMP as a sheet flow, perforated pipes were placed on both sides of the longitudinal direction of the BMP. The test cells were surrounded by impermeable berms in order to prevent water runoffs from other areas of the site interfering with the test cells. When the depth of the accumulated water in test cells exceeded 0.05 m, the runoff was directed to the overflow tanks.
The depth of a test cell was 1.2 m as shown in Figure 4. After excavating the trenches of 0.9 m by 2.4 m, a perforated 0.3 m diameter pipe was installed at the corner of each test cell. The tip elevation of the pipe was 0.15 m less than the bottom elevation of the test cell. When the runoff infiltrated through the BMP, the water level within the 1.2 m depth of each trench was monitored every 60 s via a HOBO U20L water-level logger placed at the bottom of the observation wells.
The bioswale test cells (Figure 4a) were filled with a 0.9 m thick layer of gravel and a 0.3 m thick top-growing medium. A non-woven Geofabric layer was placed between the growing medium and the gravels to prevent the growing medium traveling into the void space in the gravel. As Figure 4b illustrates, the infiltration trench cells were 1.2 m deep and were filled with gravel only.
3. Simulated Scenarios
3.1. Rain Storm Events
In 2013, the Illinois Environmental Protection Agency (IEPA) workgroup recommended that new development sites should either demonstrate no net increase in runoff due to the development or retain runoff from a 25.4 mm (1-inch) storm event, which is approximately equivalent to a 90th percentile storm in Illinois [26]. Therefore, for simulation of the tests in this study, the precipitation depth of 15.5 m by a 2.4 m simulated watershed area was selected as 25.4 mm (1-inch) but with various intensities using Illinois storm intensity-duration frequency (IDF) functions. Assuming all rainfall will produce runoff, the total volume of runoff introduced to the BMP is 946 L (250 gallons) for a 25.4 mm rainfall. As shown in Figure 5, 10-year, 2-year and 9-month storm returns were selected and, per the IDF tables, their corresponding precipitation takes about 10, 20 and 45 min, respectively. Therefore, the intensity of the rainfall would be 152 mm/h, 76 mm/h, and 33 mm/h for the 10-year, 2-year and 9-month storm returns, respectively.
Moreover, Belleville rain gauge data was studied to identify on average what rainfall magnitudes and intensities occurred during the last 10 years around southern Illinois. According to this data, the 88 and 99.7 percentiles of the recorded rains had less than 25.4 mm and 152.4 mm rain depths with average durations of 8.0 and 6.8 h, respectively. These events were also included in the study and are referred to as medium- and high-rain events. The volume introduced to the BMP for medium- and high-rain events were 946 L and 3774 L, respectively. It is worth mentioning that the intensities of these rains was much lower than the intensities from the IDF curves. The graphical representation of the rainfall scenarios with duration and flow rate are shown in Figure 5.
The implemented flow meter was constantly monitored during the test to make sure that the system was exposed to a targeted flow rate. As mentioned earlier, a water level logger was placed at the bottom of the observation well before the beginning of the test up to 24 h after the test, in order to monitor the level of water every two minutes.
3.2. Sediment Accumulation and BMP Aging
Sediment is delivered by runoff from upstream, as runoff water erodes the soil in the watershed. The sediment settles on the surface of the BMP as the runoff infiltrates the BMPs. Total sediment accumulation or deposition on the surface of the BMPs represents the BMP aging herein. In this study, the sediments were loosely and evenly placed on BMP surface with thicknesses representing 2-year-old and 10-year-old BMP. In order to create the 2-year-old and 10-year-old BMPs, the amount of total sediment accumulation or deposition on the surface of the BMP from roadways and surrounding rights of way was estimated by the Universal Soil Loss Equation (USLE) approach (Equation (1)) [25].
Using Equation (1), a minimal sediment accumulation of 0.19 kg/m2·year was calculated, which is very close to 0.22 kg/m2·year sediment accumulation suggested by Madison County SWCD and NCDEA for a stabilized small watershed. Therefore, 0.22 kg/m2·year sediment accumulation was considered as a rate of sediment deposition for this research. It is worth noting that the soil loss from the highway catchment area occurs in the foreslope and level ground and there is minimal sediment from the highway. Therefore, the corresponding equivalent amount of sediments from 15.5 m width of the 2-lane highway and its right-of-way was estimated to be 30 kg (13.6 kg/m2 or 18 mm sediment depth) and 6 kg (2.7 kg/m2 or 3 mm sediment depth) for a 10-year-old and 2-year-old BMP, respectively. The sediments used in this study were from the same soil, i.e., sandy lean clay, that BMPs were located in. The calculated thickness of the sediment layer covering the area of the BMP was 17.8 mm for the 10-year-old and 2.5 mm for the 2-year-old BMP. The infiltration rates at the surface of the bioswale were measured on-site as 1812 mm/h, 541 mm/h, and 191 mm/h for new, 2-year-old, and 10-year-old bioswales, respectively.
3.3. Numerical Simulation of the Field Model
In most cases, numerical simulations are used to model the performance of BMPs [15,18,19,20,21,22,27,28,29]. However, most of the previous studies model a new BMP and neglect the effect of deterioration. Since this study provided field-test data, it was aimed at stimulating the same field conditions of the bioswale and comparing the numerical and field-test simulation results.
The Personal Computer Storm Water Management Model (PCSWMM) considering the Green–Ampt method was used for the modeling and numerical simulation of the field tests. The field-test model represents two subcatchments, including the BMP and upstream, shown in Figure 2a. As noted earlier, the upstream subcatchments that contributed stormwater to the BMP were 15.5 m wide in the field tests. Since all the stormwater runoff from the upstream subcatchment was directed to the BMP, the imperviousness of the upstream subcatchments was considered to be 100%.
In the model, the same as the field, 0% slope was considered for the area of the BMP. A Manning coefficient of 0.15 was used for the bioswale with 6.35 m depression storage of the pervious area. The measured infiltration rates were used in the numerical simulations.
4. Field-Test Results
4.1. Bioswale
The runoff from the test cell increases with the aging of the BMP. The infiltration rate of the bioswale depends on the sediment thickness or clogging effect. The total inflow to and runoff from 10-year-old (B1) and 2-year-old (B2) bioswale in different rainfall events is shown in Figure 6. It should be noted that no runoff was observed for the new bioswale (i.e., B3), therefore, the efficiency of the new bioswale (B3) in controlling the stormwater runoff from considered rainfall events was 100%.
As shown in Figure 6, the 10-year-old bioswale produced 681 L, 511 L, and 530 L of runoff for 10-year, 2-year, 9-month return rainfalls, respectively. In addition, there was no runoff produced for the medium rainstorm, and 2384 L of runoff for the high-rainfall storm event on the 10-year-old bioswale. For the 2-year-old bioswale, 548 L and 265 L of runoff were observed for the 10-year and 2-year return rainfalls, respectively. There was no runoff produced for the 9-month and medium rainstorm events. The runoff for the high-rainfall storm event was 2384 L for the 10-year old bioswale.
An understanding of the performance of aged bioswale combined with the magnitude and quantity of the designed storm event will help in the adoption of an economical and feasible plan for maintenance. For example, in the 10-year-old bioswale, the medium-rain event caused no runoff. This notion indicates that, if in such a climate, the medium scenario is the most probable scenario, even after 10 years of aging the bioswale would perform properly. It is worth mentioning that if the rate of sediment accumulation is different from 0.22 kg/m2·year in a site, the data of the 2-year-old and 10-year-old BMPs of this study can be interpolated to estimate the performance of the BMP for that particular site.
The BMP’s efficiency is associated with runoff volume reduction computed for the BMP subcatchment only, and was calculated as shown in Equation (2).
According to Figure 7, the efficiency of the 10-year-old bioswale (i.e., B1) in controlling a 25.4 mm rainfall was 27%, 44% and 57% under 10-year, 2-year, and 9-month return storm events, respectively. The efficiencies of the 10-year-old bioswale in capturing storm water runoff from medium- and high-rain events was 100% and 37%, respectively. The 2-year-old bioswale (i.e., B2) exhibited 20% to 45% higher efficiency depending on the intensity of rainfall.
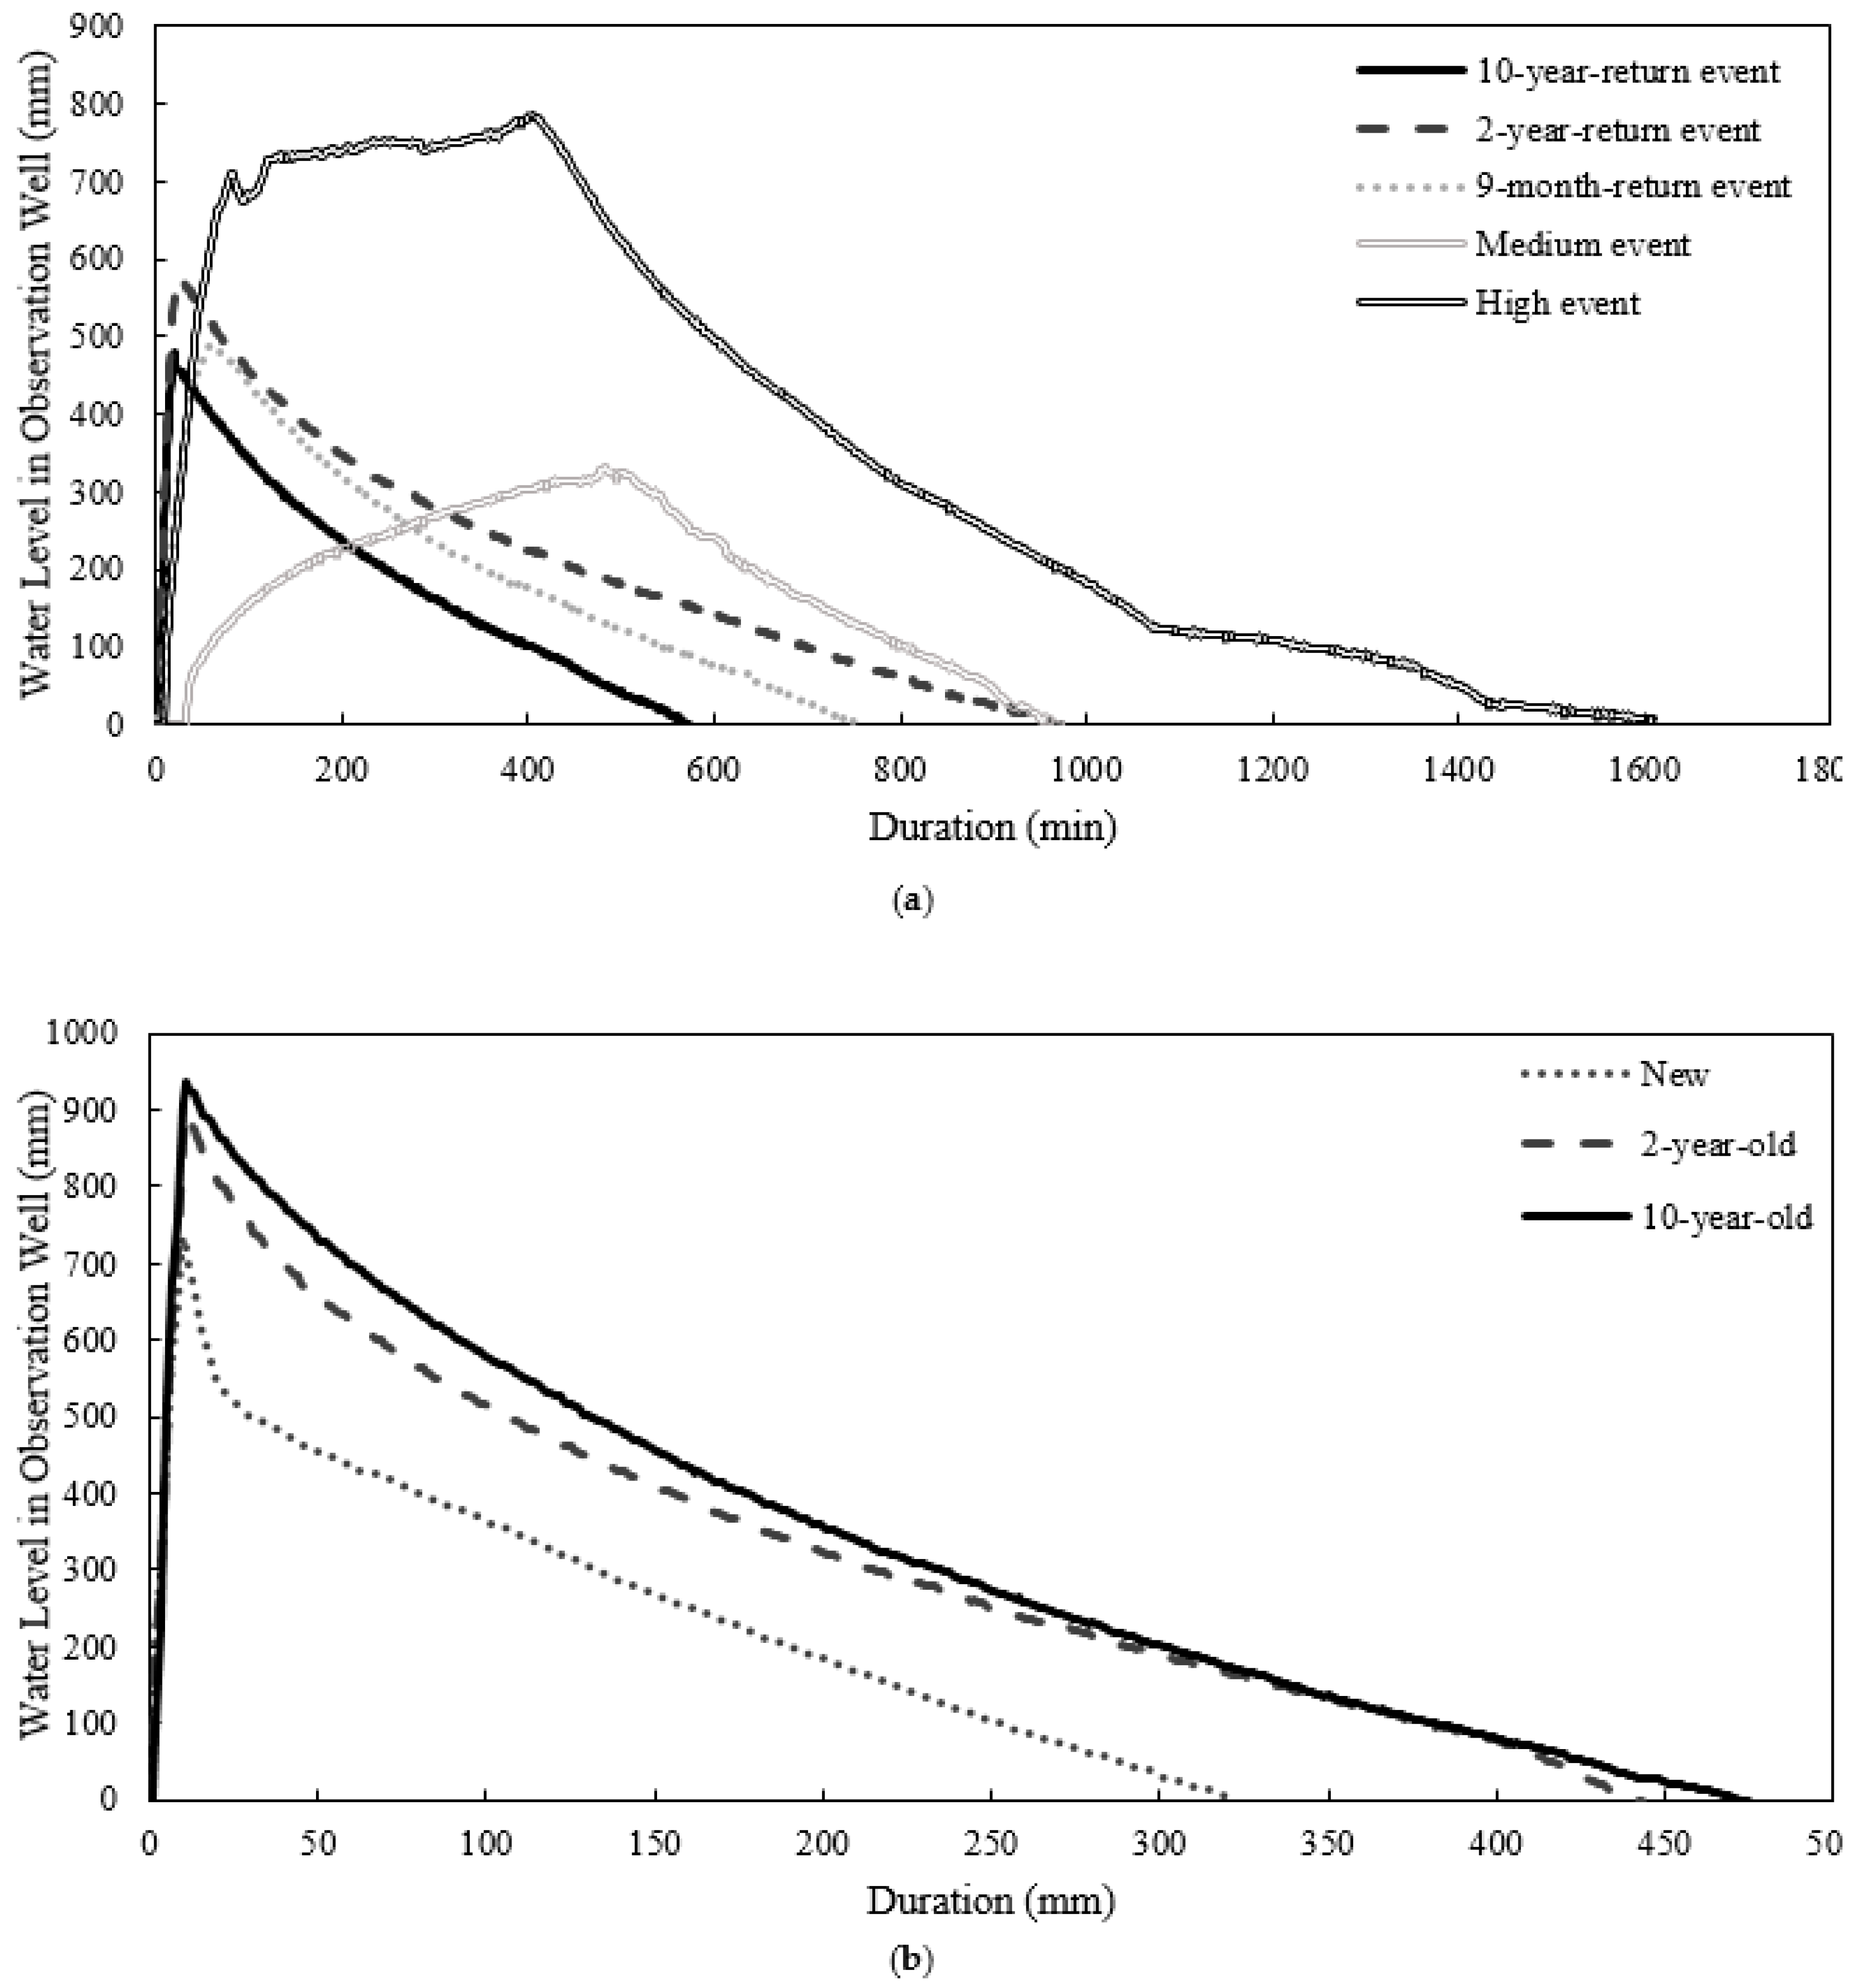
Figure 8a shows the monitored water levels for tests conducted in the 10-year-old bioswale test cell. The slope of each curve before its peak represents the infiltration rate of the bioswale, while the slope of the water head curve immediately after the peak indicates a rough estimation of the infiltration rate of the native soil located beneath the test cell.
For the 10-year-old bioswale, the performance of the BMP under 9-month, 2-year, and 10-year storm returns as well as medium- and high-rain events was tested. The infiltration rates of bioswales were estimated at 25.2 mm/min, 22.1 mm/min, and 7.8 mm/min for the 10-year return, 2-year return, and 9-month return storm events, respectively. The first three hours of the descending part of the curves show the maximum infiltration rates into native soil under a full water head. These rates were 1.4, 1.3, and 1.1 mm per minute for the 10-year return, 2-year return, 9-month return storm events, respectively. For medium-rain event, the infiltration rate into the bioswale varied non-linearly from 10.3 mm per minute to 0.3 mm per minute within 8 h. The infiltration rate into native soil was almost constant at 0.9 mm/min. For the high-rain event, the infiltration rate into the bioswale and native soil was 15.7 mm/min and 1.5 mm/min, respectively. The reason for variation in infiltration rates of the sediment for different tests might be due to the compaction of the material as water infiltrates. However, the difference in the measured infiltration rates of native soil at 1.5 m below ground surface was minimal, and they reasonably agreed with measurements before the installation of the BMPs. Figure 8a shows that in the early part of the rain event, since the soil was unsaturated, the infiltration rate was higher, and it decreased as the soil became saturated.
4.2. Infiltration Trench
The infiltration trench tests showed that there was no runoff regardless of the rainfall event and age of the infiltration trench. The void ratio for the infiltration trench was as high as 40% of the total volume, which was about 1.1 m3. Therefore, the inflow water was 100% captured by the infiltration trench. The same observation was made by previous studies [10,11].
The BMP aging and storm event scenarios were repeated for the infiltration trench. In these tests, the aging of the infiltration trench had no effect on the infiltration rate of the BMP. The inflow water washed the sediment layer placed at the surface into the void space in the infiltration trench. It was predicted that the infiltration trench would capture all the runoff until its void was filled up. According to the sediment density in the studied case, the weight of the sediment that filled the test cell was about 880 kg. This would not result in any major malfunctioning of the BMP in its 15 to 20-year life if the sediment accumulation rate stayed at minimal levels and the debris was not clogging the surface of the BMP.
Figure 8b illustrates the performance results of new, 2-year-old, and 10-year-old infiltration trenches subjected to a 10-year return storm event. The infiltration rates of the infiltration trenches were in a range of 74 mm/min to 81 mm/min, which show an insignificant effect of aging on the infiltration rate of these BMPs. The infiltration rate into native soil at the bottom of the trench was estimated at 3.1 mm/min for all three tests based on the descending part of the water level curves in the first three hours after their peak. This value reasonably matches the infiltration rates measured in the infiltrometer tests conducted at 1.5 m depth before the placement of aggregates in the cells.
Since the sediment does not accumulate on the surface of the infiltration trench, the aging process does not affect the infiltration capacity of these BMPs. Therefore, there will be no runoff. However, the sediment accumulates at the bottom of the infiltration trench and it changes the infiltration rate of the infiltrated water into the natural soil depending on the infiltration rate of the sediment. In this study, the sediment and natural soil were the same; however, it is possible that the natural soil and sediment have different infiltration rates. If the sediment infiltration rate is less than that of the natural soil, the accumulation of the sediment at the bottom of the infiltration trench results in less water infiltration into the natural soil. Therefore, the infiltration trench may fill up quicker and can produce runoff.
5. Numerical Simulation of Field Tests
In order to compare the numerical models’ ability to represent the field tests, the BMP performances with different soil sedimentation and rainfall storm returns were modeled. Simulations were run. Sensitivity-test analysis was conducted to identify the parameters that the results of the numerical model are most sensitive to, which in this case was the infiltration rate. Therefore, the infiltration rates at the surface of the bioswale, which were measured on-site, were used in numerical modeling for simulating new, 2-year, and 10-year-old bioswales.
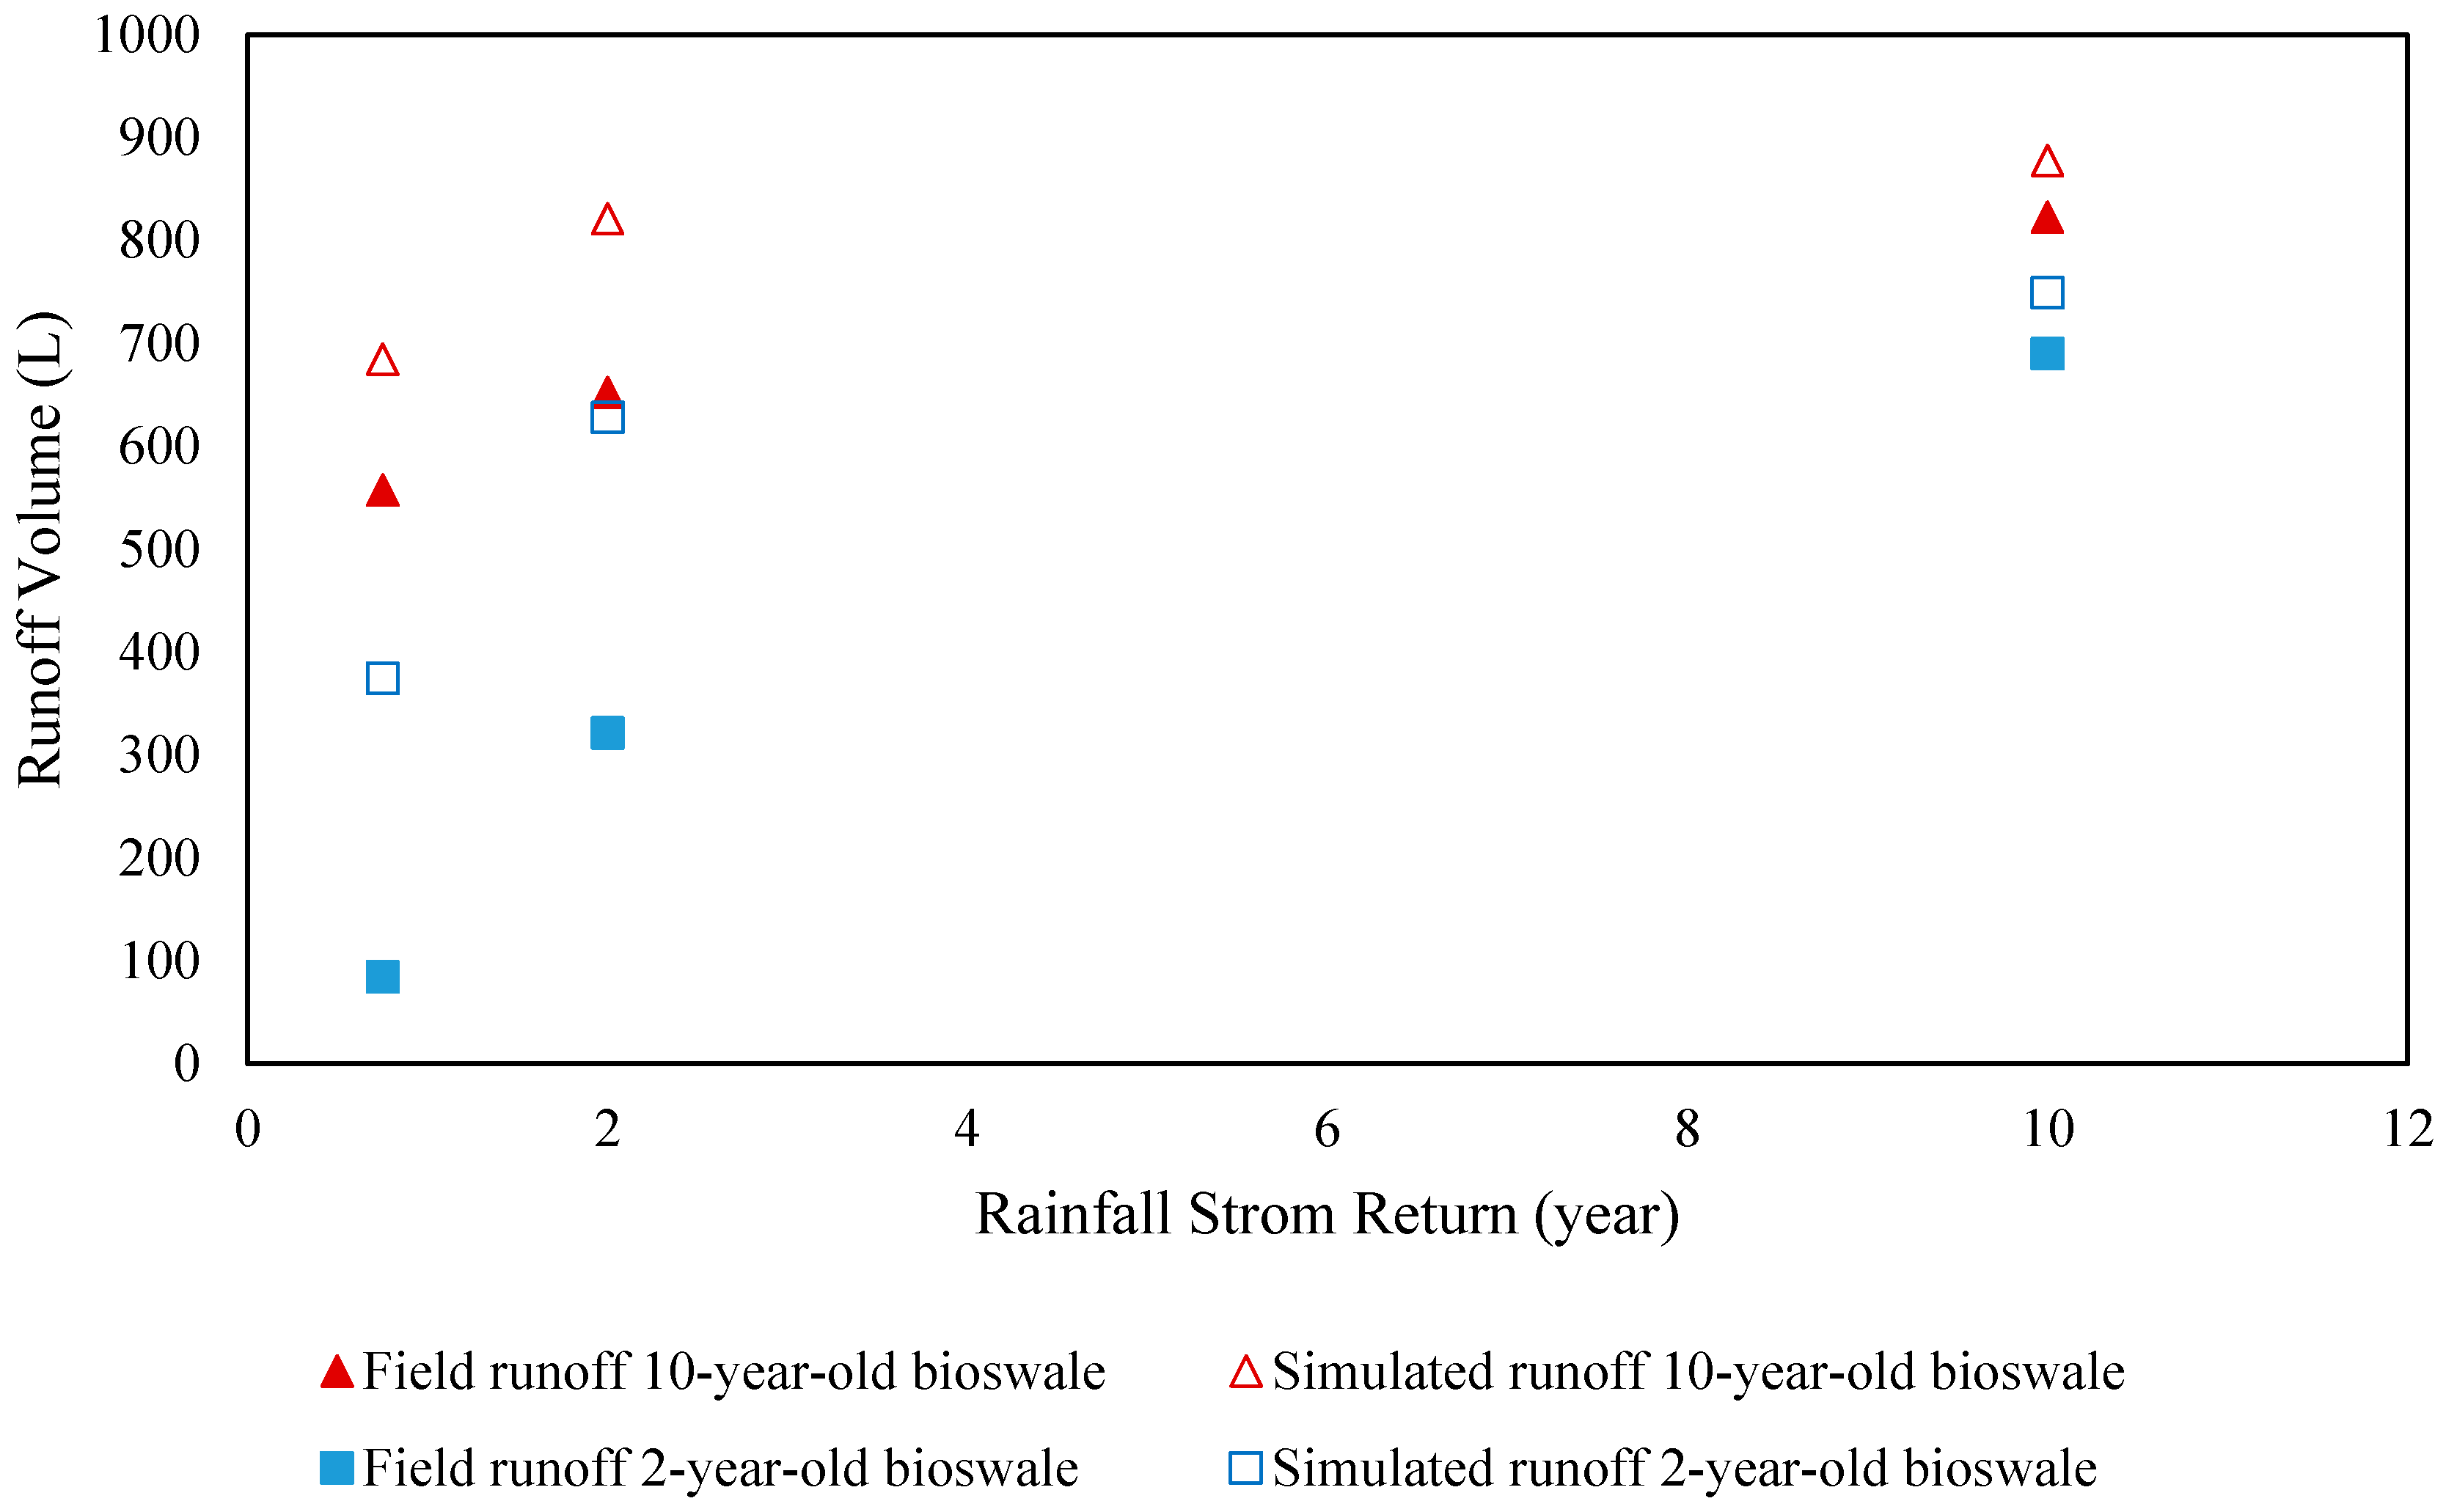
In similarity with the field, the input flow to the bioswale for all the simulated scenarios was 946 L. The brand new bioswale and all ages of infiltration trench produced no runoff both in field and numerical simulations. However, as shown in Figure 9, for aged bioswales a runoff is observed and the amount of runoff is magnified for rain events with higher intensities. From Figure 9, it can be observed that with a 9-month rainfall return storm, the runoff volume from numerical model was 375 L in a 2-year-old bioswale and about 685 L for the 10-year-old bioswale. For a 2-year return rainfall storm, the runoff volume was 628 L and 821 L in 2-year-old and 10-year-old bioswales, respectively. Finally, for a 10-year return rainfall storm, the runoff volume was 749 L and 878 L in 2-year-old and 10-year-old bioswales, respectively.
The aged bioswales’ efficiency for a 10-year return storm experienced a 10% to 20% runoff reduction performance and turned almost all the input runon (volume) into the runoff. Hence, it is predicted that the studied bioswale might not be able to capture any input volume for the rainfall storms with higher than 152 mm/h intensity.
Comparing the results of simulations and field tests showed that for higher intensity rainstorms (i.e., 10-year-return storms), the results in the field and simulations were relatively close. However, for the lower intensity rainfall scenarios (i.e., 2-year return or 9-month return storm events), the simulation results predicted 20% to 50% higher runoff production than the field results. The runoff overestimation by the numerical model might be due to: (1) the variations and non-uniformity in native soil conditions at the bottom of the cell; (2) ignorance of numerical simulations to account for the existence of escape ways or soil fissures; (3) non-uniformities in the thickness of a growing medium or accumulated sediment; (4) the reorientation of loosely placed gravel layers in the bioswale under runon loading and uneven settlement at the surface of the BMP and the creation of water escape ways which would reduce the runoff. According to measured performances in the field, for 2-year-old bioswales the runoff reduction can range from 65% to 91%, and 30% to 38%, for rainfall events with less than a 2-year return. The runoff volume efficiency of the aged bioswales such as 10-year-old with a 0.22 kg/m2·year sediment accumulation rate is not more than 25%, which is minuscule. Therefore, the simulations can be used to identify the design life of BMPs such as bioswales.
With the amount of 0.22 kg/m2·year sediment accumulation on the BMPs, both simulation and field results show that the efficiency of the bioswales in retaining runoff depends on the rainfall intensity and follows a non-linear trend. Regardless of the age of the bioswale and the extent of deterioration, the runoff volume reduction efficiency of a bioswale is reduced with a faster rate for rainfalls with less than 4–6-year storm returns. Therefore, it is critical to implement maintenance practices in the early days and years of the life of the BMP in order to prevent fast deterioration and loss of functionality.
6. Conclusions
This study investigated the effect of sediment accumulation on BMPs’ stormwater runoff reduction capacities. The BMPs studied included a bioswale and infiltration trench. Field tests and numerical simulation methods were used. According to the USLE, the amount of soil loss and sediment accumulation was about 0.22 kg/m2 annually. Three different ages of BMPs were considered based on different sedimentation accumulation in order to represent new, 2-year-old and 10-year-old BMPs. In addition, five rainfall events with various durations and intensities were tested.
Both field tests and numerical models resulted in 100% runoff reduction with different rainfall intensity and sediment accumulation for the infiltration trench, which could be due to the high infiltration rate capacity of the gravels. The result showed that sediment accumulation on the BMP surface affected the infiltration rate of the bioswale. The results revealed that there is a correlation between sediment accumulation and bioswale efficiency. For instance, the efficiency of a 10-year-old bioswale exposed to a 2-year return storm is about half the efficiency of a 2-year-old bioswale.
Comparing the results of the field tests and numerical simulations showed that the simulations are generally overestimating the runoff and, therefore, they are conservative. The trend of overestimation by model is about 6% for the higher intensity to 40% for the lower intensity rainfall events. The potential cause of overestimating by simulations could be non-uniformity of the material placed in the field or the existence of water escape ways or fissures within the BMP area.
The results of this study can be used in other cases where the sediment accumulation rate differs from what has been assumed here. The interpolation between common rain events and ages of BMPs considered here would allow the findings to be applied to other cases.
Acknowledgments
This publication is based on the results of R27-141, Effective Post-Construction Best Management Practices (BMPs) to Infiltrate and retain Stormwater Run-off. ICT R27-141 was conducted in cooperation with the Illinois Center for Transportation; the Illinois Department of Transportation, Office of Program Development, and the US Department of Transportation, Federal Highway Administration. The authors would like to acknowledge the members of IDOT Technical Review Panel (TRP) for their useful advice at different stages of this research. The contents of this paper reflect the views of the authors only. This paper does not constitute a standard, specification, or regulation.
Author Contributions
Abdolreza Osouli was the lead in conducting research and preparing the manuscript, Azadeh Akhavan Bloorchian conducted the simulations, Sina Nassiri conducted the field tests. All authors contributed in preparation of the paper.
Conflicts of Interest
The authors declare no conflict of interest.
References
- Poresky, A.; Bracken, C.; Strecker, E.; Clary, J. International Stormwater Best Management Practices (BMP) Database, Technical Summary: Volume Reduction; GeoSyntec Consultants & Wright Water Engineers, Inc.: Denver, CO, USA, 2011. [Google Scholar]
- Li, H. Green infrastructure for highway stormwater management: Field investigation for future design, maintenance, and management needs. J. Infrastruct. Syst. 2015, 21, 05015001. [Google Scholar] [CrossRef]
- Ackerman, D.; Stein, E.D. Evaluating the effectiveness of best management practices using dynamic modeling. J. Environ. Eng. 2008, 134, 628–639. [Google Scholar] [CrossRef]
- David, N.; Leatherbarrow, J.E.; Yee, D.; McKee, L.J. Removal efficiencies of a bioretention system for trace metals, PCBs, PAHs, and dioxins in a semiarid environment. J. Environ. Eng. 2014, 141, 04014092. [Google Scholar] [CrossRef]
- NCHRP. Evaluation of Best Management Practices for Highway Runoff Control; Report 565; Transportation Research Board: Washington, DC, USA, 2006. [Google Scholar]
- NCHRP. Guidelines for Evaluating and Selecting Modifications to Existing Roadway Drainage Infrastructure to Improve Water Quality in Ultra-Urban Areas; Report 728; Transportation Research Board: Washington, DC, USA, 2012. [Google Scholar]
- NCHRP. Long-Term Performance and Life-Cycle Costs of Stormwater Best Management Practices; Report 792; Transportation Research Board: Washington, DC, USA, 2014. [Google Scholar]
- Hunt, W.F.; Hathaway, J.M.; Winston, R.J.; Jadlocki, S.J. Runoff Volume Reduction by a Level Spreader–Vegetated Filter Strip System in Suburban Charlotte, NC. J. Hydrol. Eng. 2009, 15, 499–503. [Google Scholar] [CrossRef]
- Xiao, Q.; McPherson, E.G. Testing a Bioswale to Treat and Reduce Parking Lot Runoff; University of California: Oakland, CA, USA; Davis and USDA Forest Service: Davis, CA, USA, 2009. [Google Scholar]
- GeoSyntec. Post-Construction BMP Technical Guidance Manual; Storm Water BMP Guidance Manual: Santa Barbara, CA, USA, 2008. [Google Scholar]
- Caltrans. BMP Retrofit Pilot Program Final Report; CTSW-RT 01-050; California Department of Transportation: Sacramento, CA, USA, 2004.
- Valinski, N.A.; Chandler, D.G. Infiltration performance of engineered surfaces commonly used for distributed stormwater management. J. Environ. Manag. 2015, 160, 297–305. [Google Scholar] [CrossRef] [PubMed]
- Clary, J.; Leisenring, M.; Quigley, M.; Jones, J.; Strecker, E. International Stormwater Best Management Practices (BMP) Database, Narrative Overview of BMP Database Study Characteristics; Wright Water Engineers, Inc., GeoSyntec Consultant: Denver, CO, USA, 2012. [Google Scholar]
- Zimmerman, M.J.; Barbaro, J.R.; Sorenson, J.R.; Waldron, M.C. Effects of Selected Low-Impact-Development (LID) Techniques on Water Quality and Quantity in the Ipswich River Basin, Massachusetts—Field and Modeling Studies; U.S. Geological Survey Scientific Investigations Report 2010–5007; U.S. Environmental Protection Agency: Washington, DC, USA, 2010; p. 113.
- White, M.J.; Arnold, J.G. Development of a simplistic vegetative filter strip model for sediment and nutrient retention at the field scale. Hydrol. Process 2009, 23, 1602–1616. [Google Scholar] [CrossRef]
- Dennedy-Frank, P.J.; Muenich, R.L.; Chaubey, I.; Ziv, G. Comparing two tools for ecosystem service assessments regarding water resources decisions. J. Environ. Manag. 2016, 177, 331–340. [Google Scholar] [CrossRef] [PubMed]
- Ahiablame, L.M.; Engel, B.A.; Chaubey, I. Representation and evaluation of low impact development practices with L-THIA-LID: An example for site planning. Environ. Pollut. 2012, 1, 1. [Google Scholar] [CrossRef]
- Liu, Y.; Ahiablame, L.M.; Bralts, V.F.; Engel, B.A. Enhancing a rainfall-runoff model to assess the impacts of BMPs and LID practices on storm runoff. J. Environ. Manag. 2015, 147, 12–23. [Google Scholar] [CrossRef] [PubMed]
- Ahiablame, L.M.; Engel, B.A.; Chaubey, I. Effectiveness of low impact development practices in two urbanized watersheds: Retrofitting with rain barrel/cistern and porous pavement. J. Environ. Manag. 2013, 119, 151–161. [Google Scholar] [CrossRef] [PubMed]
- Abi Aad, M.; Suidan, M.; Shuster, W. Modeling techniques of Best Management Practices: Rain barrels and rain gardens using EPA SWMM-5. J. Hydrol. Eng. 2010, 15, 434–443. [Google Scholar] [CrossRef]
- McCutcheon, M.; Wride, D. Shades of Green: Using SWMM LID Controls to Simulate Green Infrastructure. J. Water Manag. Model. 2013, 21, 289–301. [Google Scholar]
- Sun, Y.W.; Li, Q.Y.; Liu, L.; Xu, C.D.; Liu, Z.P. Hydrological simulation approaches for BMPs and LID practices in highly urbanized area and development of hydrological performance indicator system. Water Sci. Eng. 2014, 7, 143–154. [Google Scholar]
- Zhu, Z.; Chen, X. Evaluating the Effects of Low Impact Development Practices on Urban Flooding under Different Rainfall Intensities. Water 2017, 9, 548. [Google Scholar] [CrossRef]
- Alamdari, N.; Sample, D.J.; Steinberg, P.; Ross, A.C.; Easton, Z.M. Assessing the Effects of Climate Change on Water Quantity and Quality in an Urban Watershed Using a Calibrated Stormwater Model. Water 2017, 9, 464. [Google Scholar] [CrossRef]
- Natural Resources Conservation Service (NRCS). Technical Guide, Section I, Erosion Prediction, NRCS, Illinois. 1997. Available online: https://efotg.sc.egov.usda.gov/references/public/IL/ArchivedRUSLE.pdf (accessed on 13 December 2017).
- IEPA. Stormwater Performance Standards Recommendations; Post-Development Stormwater Runoff Standards (PDSWRS); Workgroup and Association of Illinois Soil and Water Conservation Districts (AISWCD): Springfield, IL, USA, 2013.
- Osouli, A.; Akhavan Bloorchian, A.; Grinter, M.; Alborzi, A.; Marlow, S.; Ahiablame, L.; Zhou, J. Performance and Cost Perspective in Selecting BMPs for Linear Projects. Water 2017, 9, 302. [Google Scholar] [CrossRef]
- Akhavan Bloorchian, A.; Ahiablame, L.; Zhou, J.; Osouli, A. Modeling BMP and Vegetative Cover Performance for Highway Stormwater Runoff Reduction. Procedia Eng. 2016, 145, 274–280. [Google Scholar] [CrossRef]
- Akhavan Bloorchian, A.; Zhou, J.; Osouli, A.; Ahiablame, L.; Grinter, M. Modeling Low Impact Development (LID) for Controlling Highway Stormwater Runoff. In Proceedings of the 2016 EWRI International Low Impact Development Conference, Portland, OR, USA, 29–31 August 2016. [Google Scholar]
Figure 1.
Native soil and aggregate particle size distribution.

Figure 2.
(a) Plan view of field-test layout; potential cross-section layout of (b) one-lane highway, (c) two-lane highway.
Figure 2.
(a) Plan view of field-test layout; potential cross-section layout of (b) one-lane highway, (c) two-lane highway.

Figure 3.
(a) Schematic plan view of the best management practices (BMPs) and tests layout; (b) magnified version of a representative cell.
Figure 3.
(a) Schematic plan view of the best management practices (BMPs) and tests layout; (b) magnified version of a representative cell.
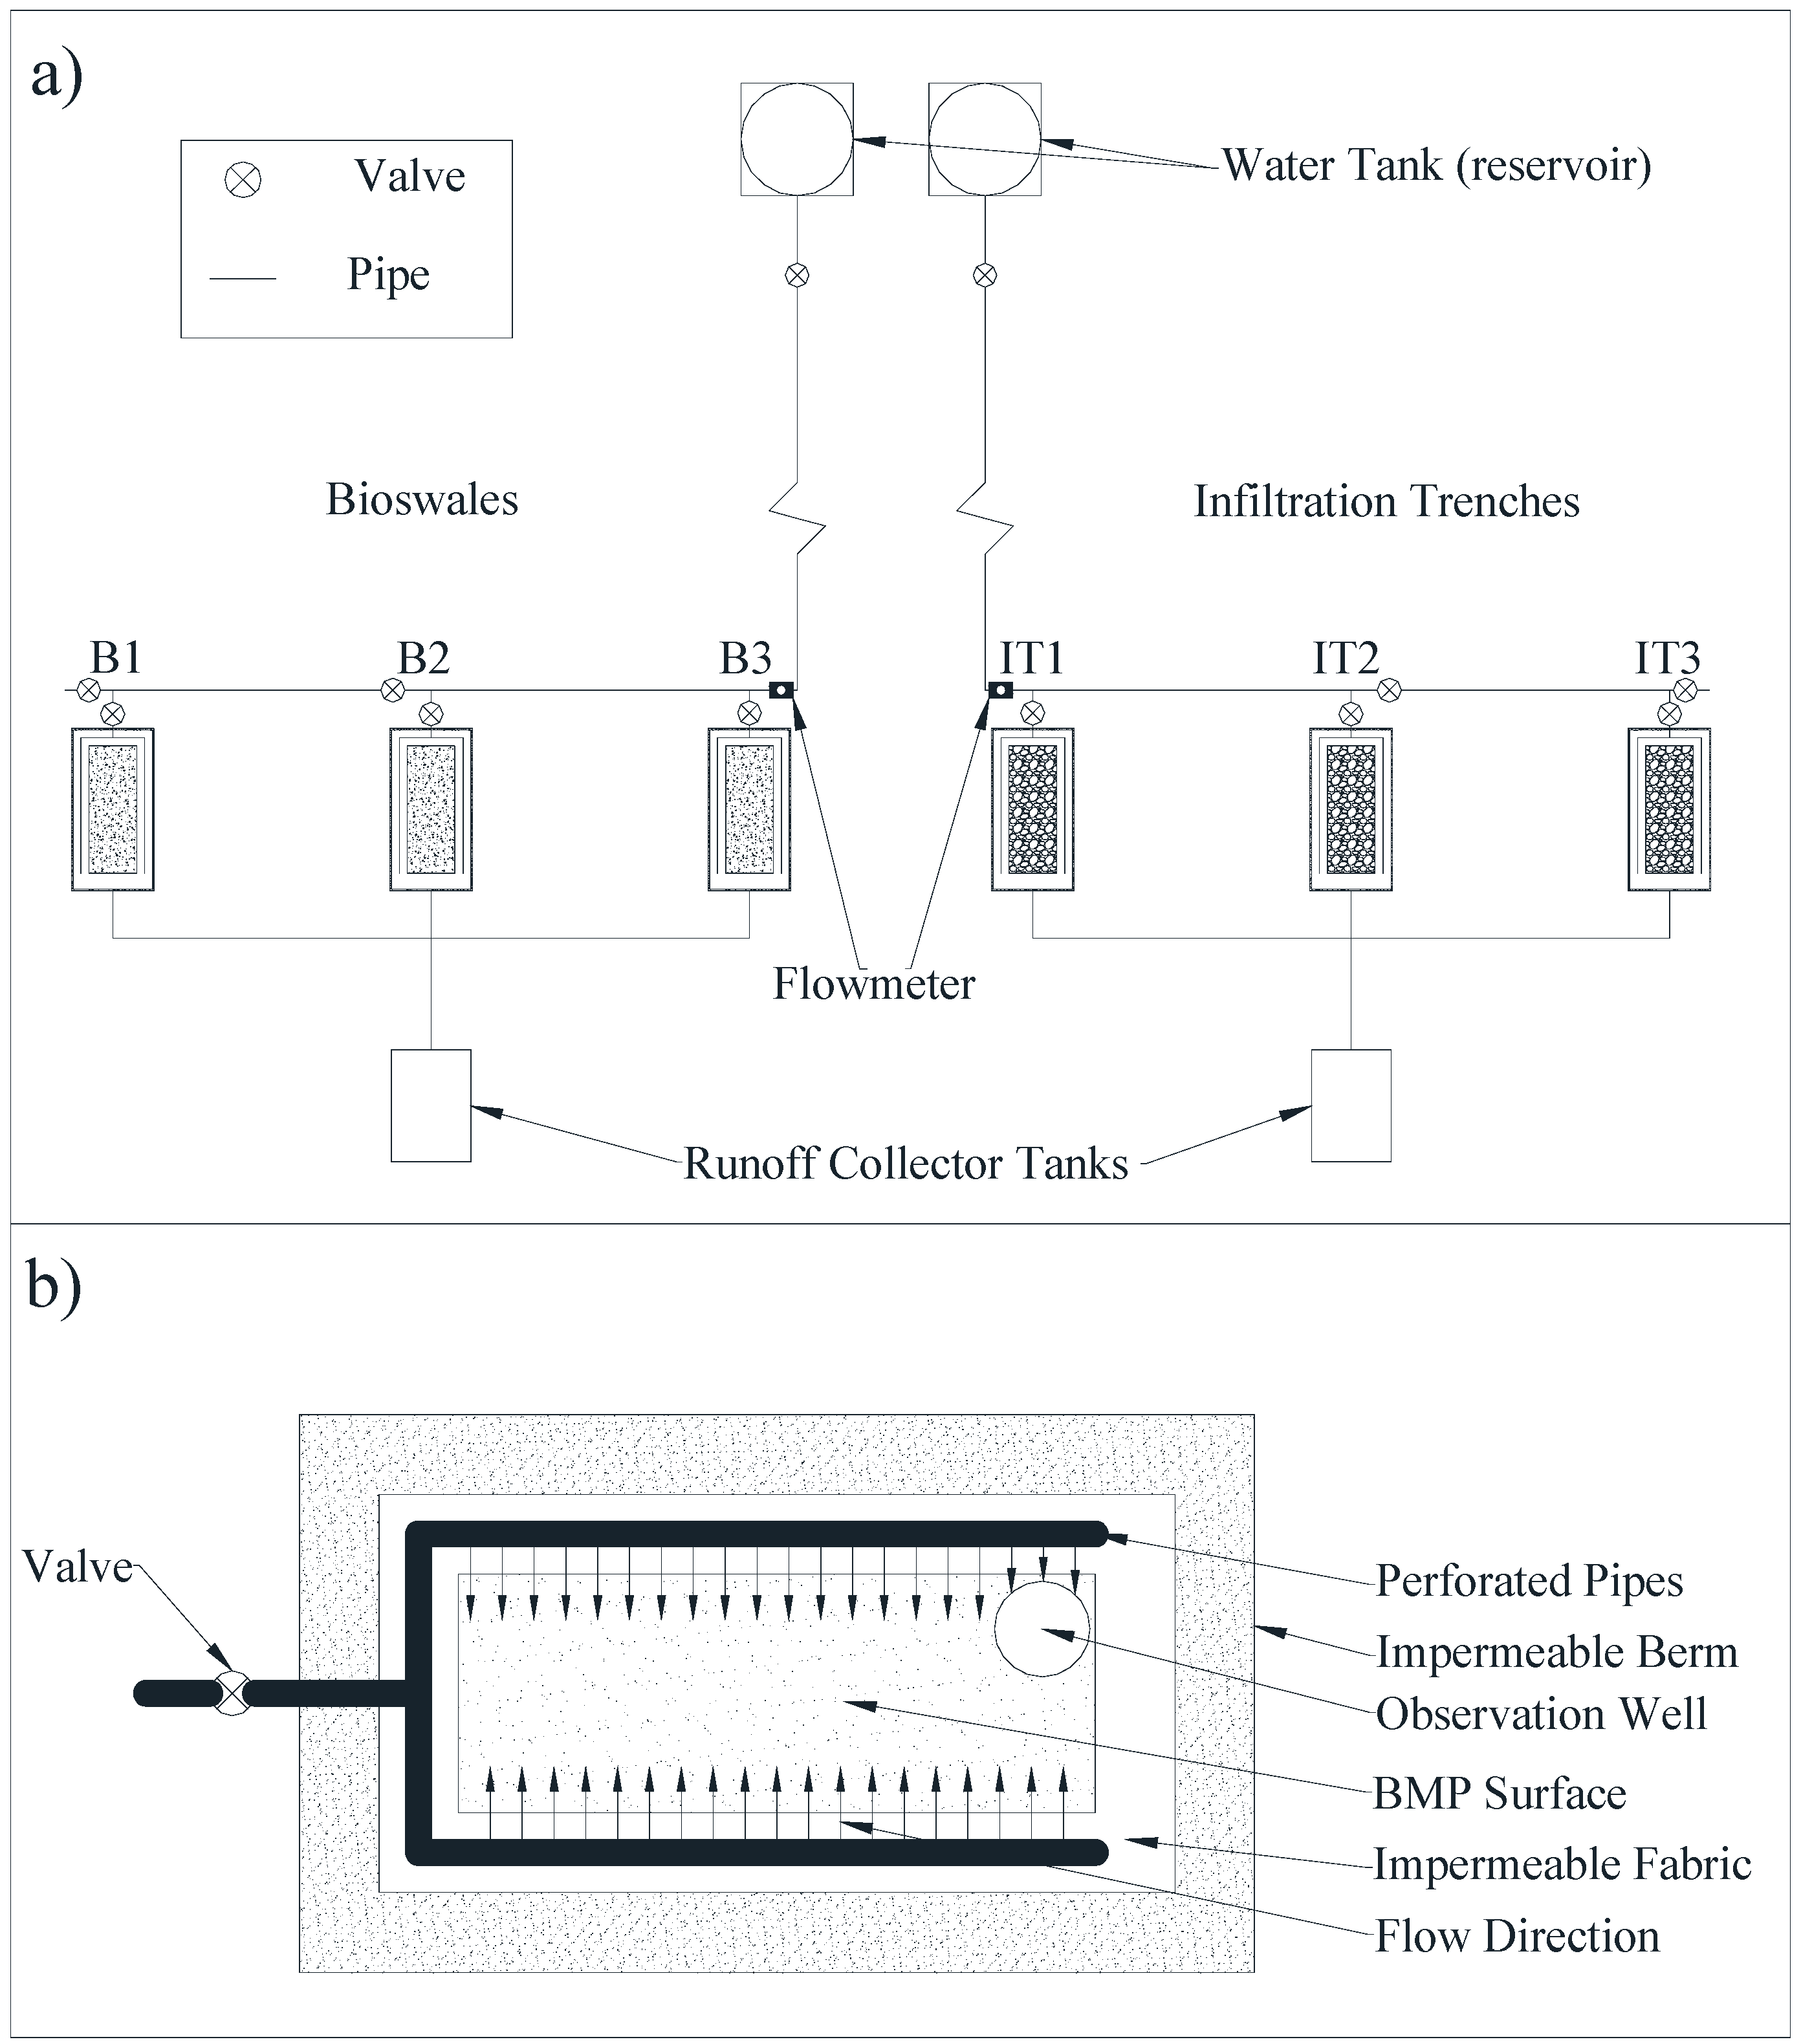
Figure 4.
Linear BMP cross section: (a) bioswale; (b) infiltration trench.
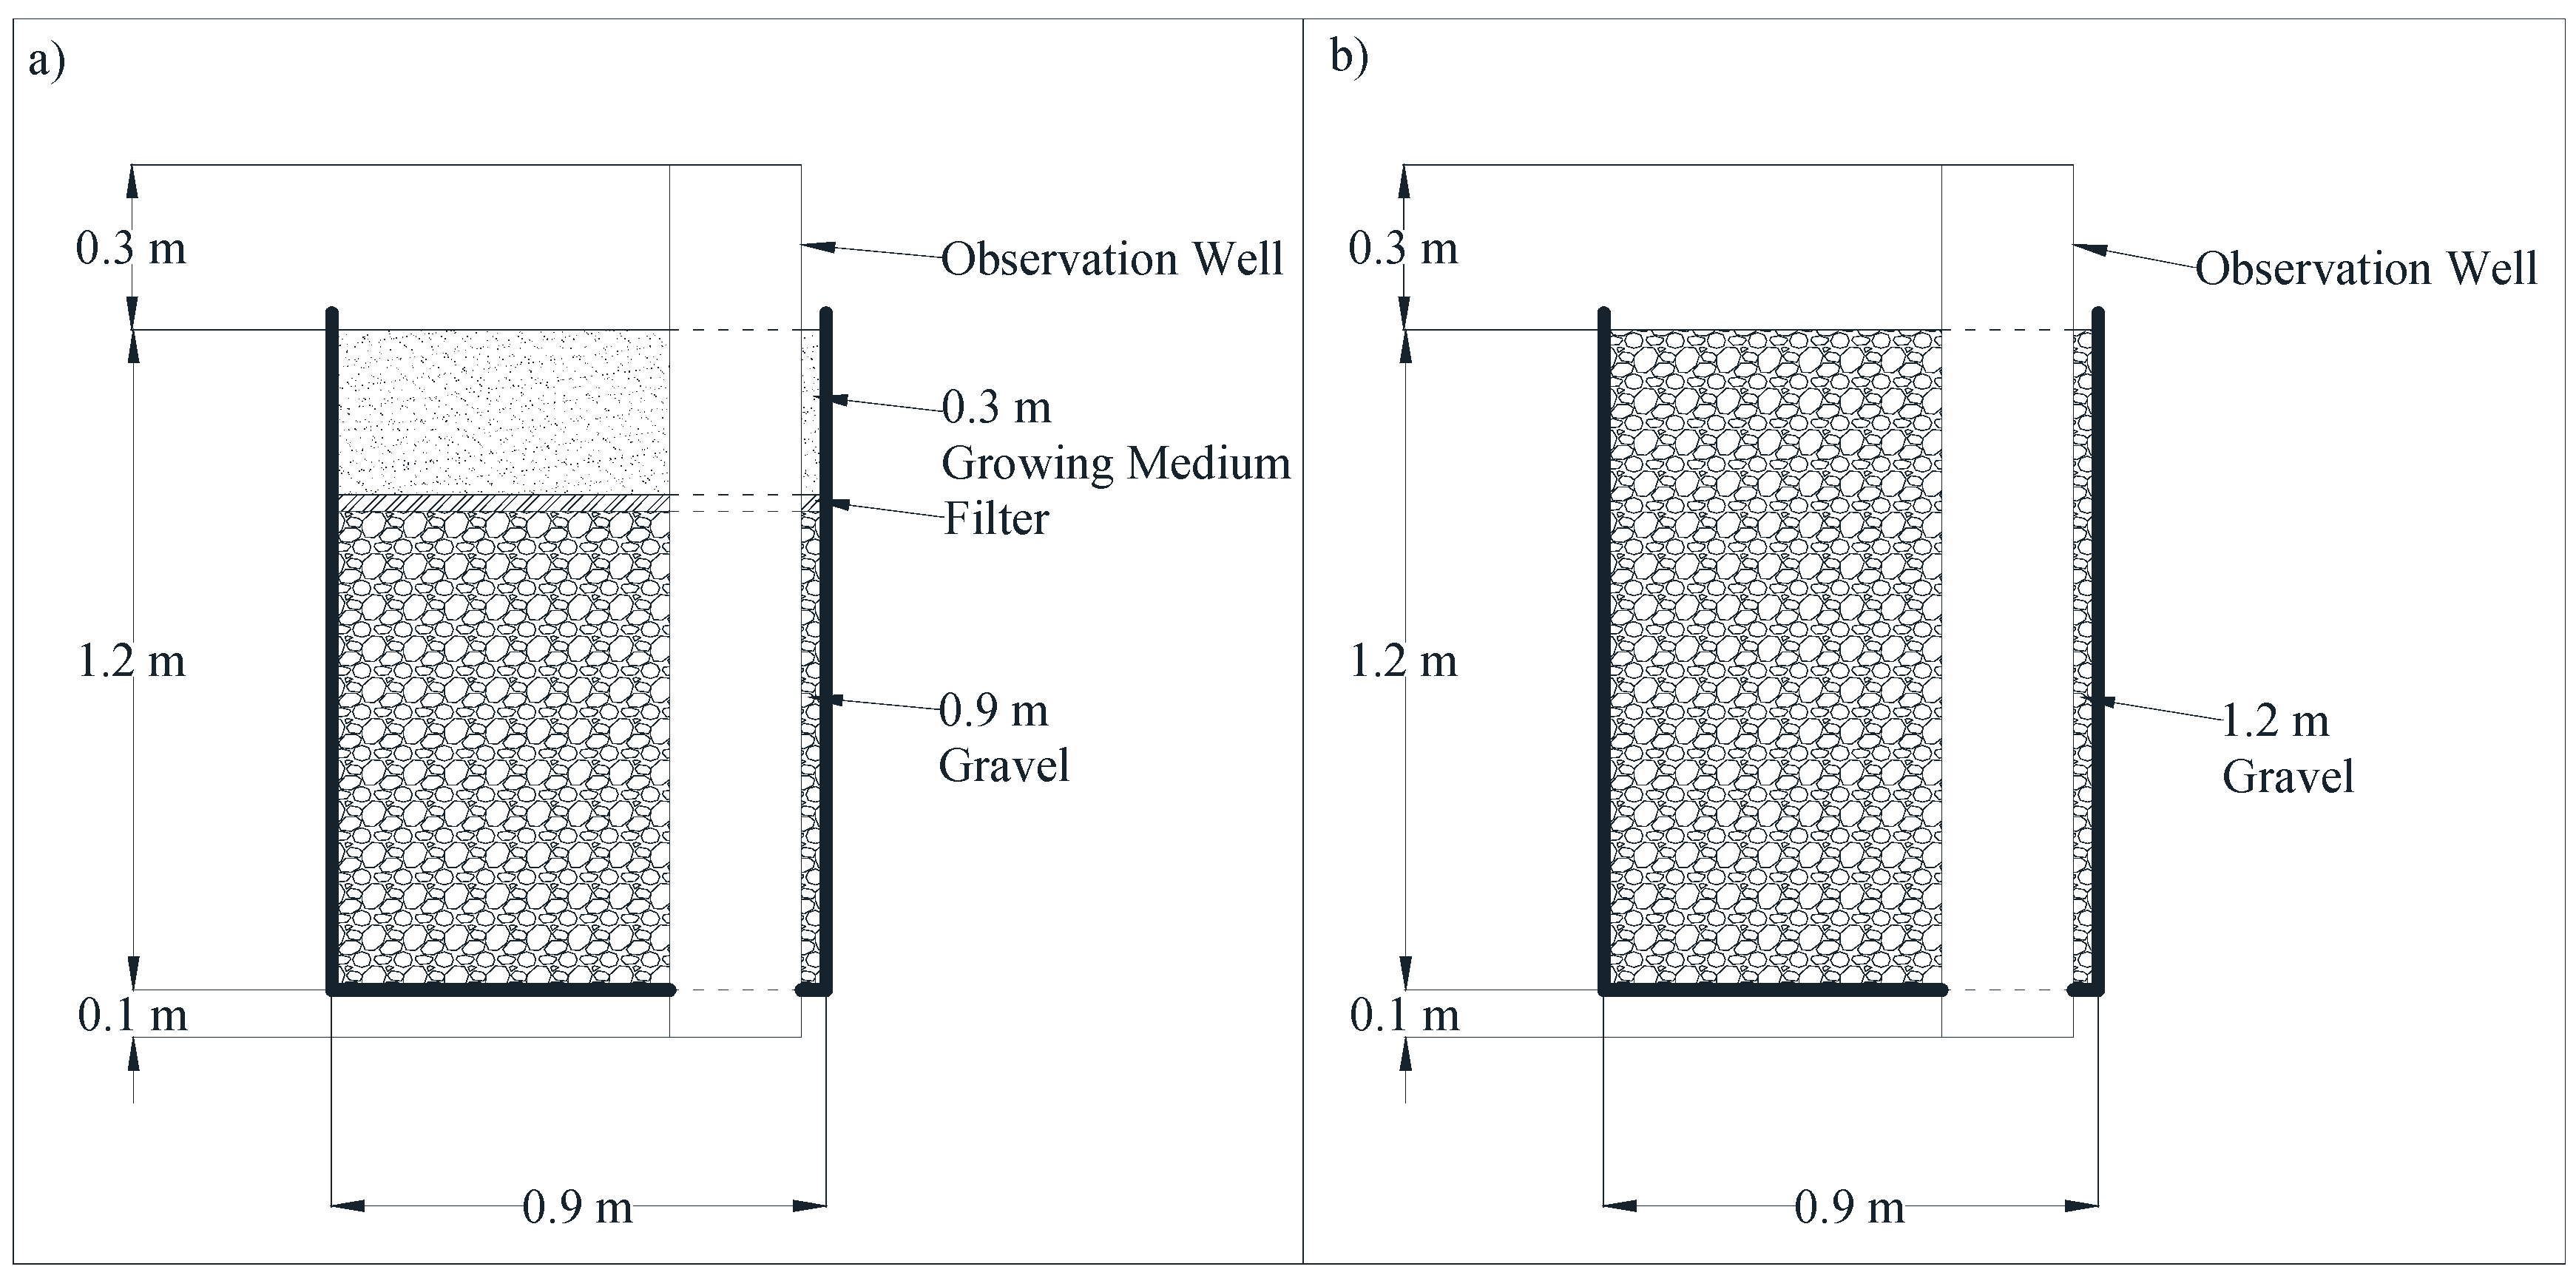
Figure 5.
Simulated rainfall scenarios.
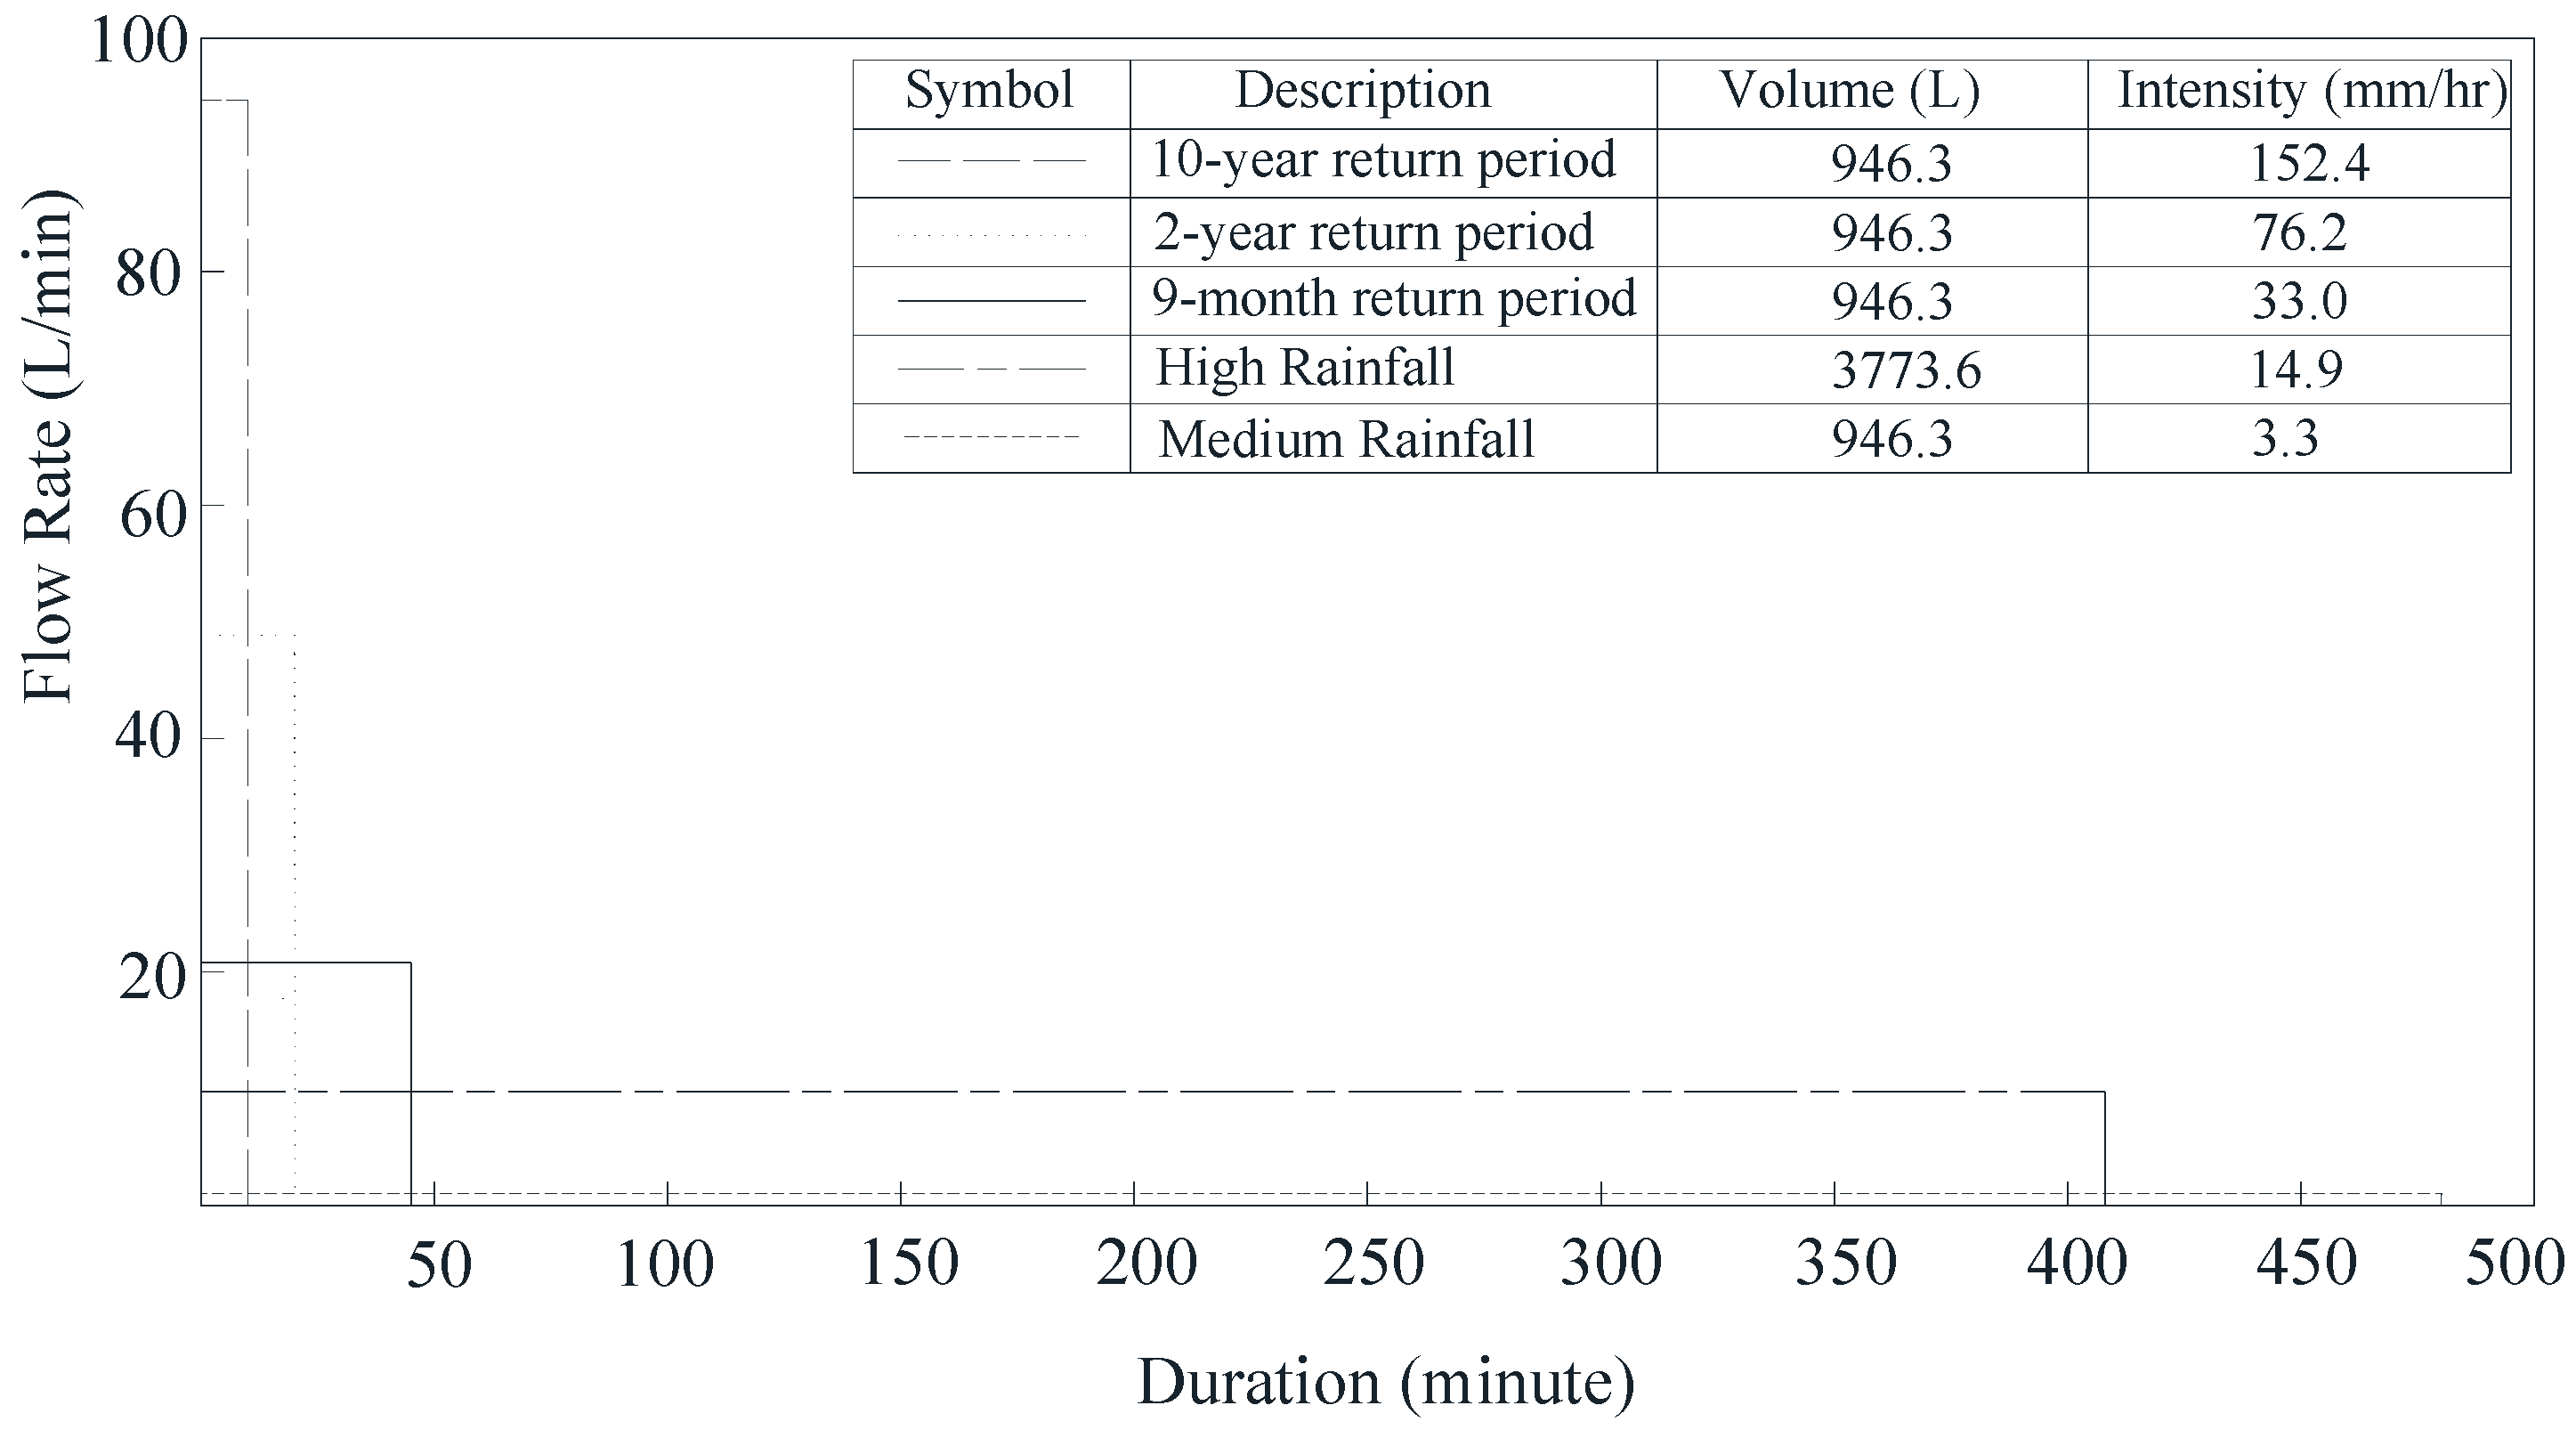
Figure 6.
Field-test results for the 10-year-old bioswale and 2-year-old bioswale under various rainfall scenarios.
Figure 6.
Field-test results for the 10-year-old bioswale and 2-year-old bioswale under various rainfall scenarios.
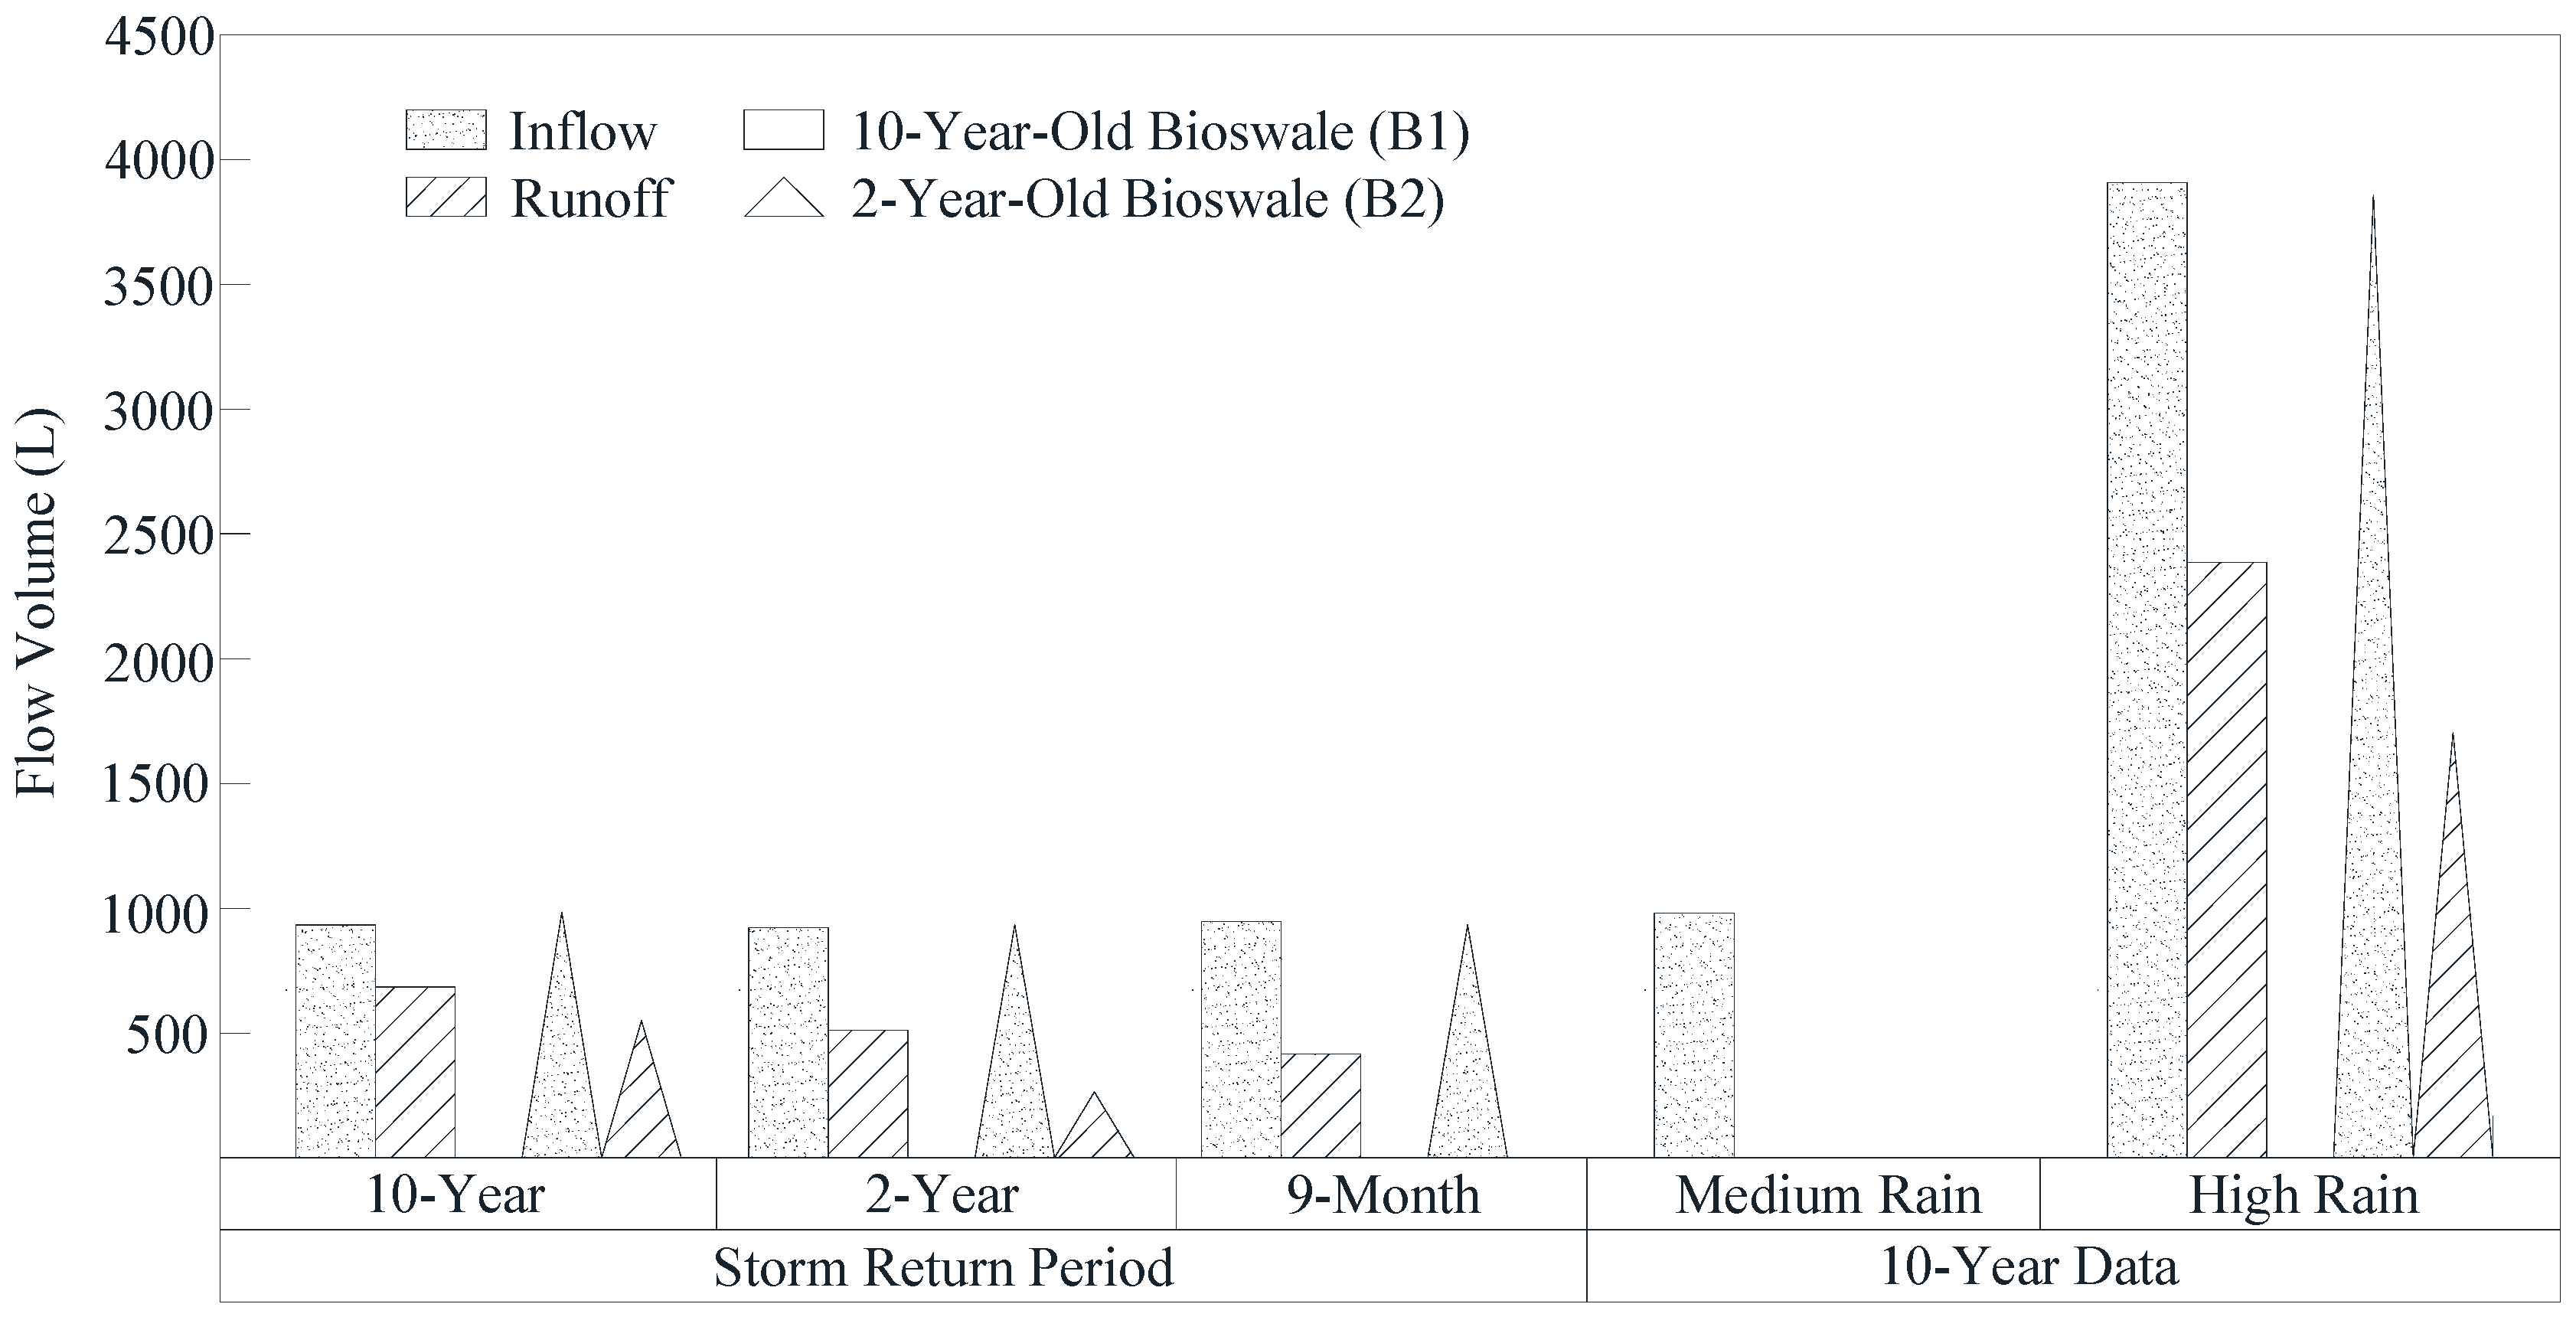
Figure 7.
BMPRVR of different cells on different rainfall scenarios.
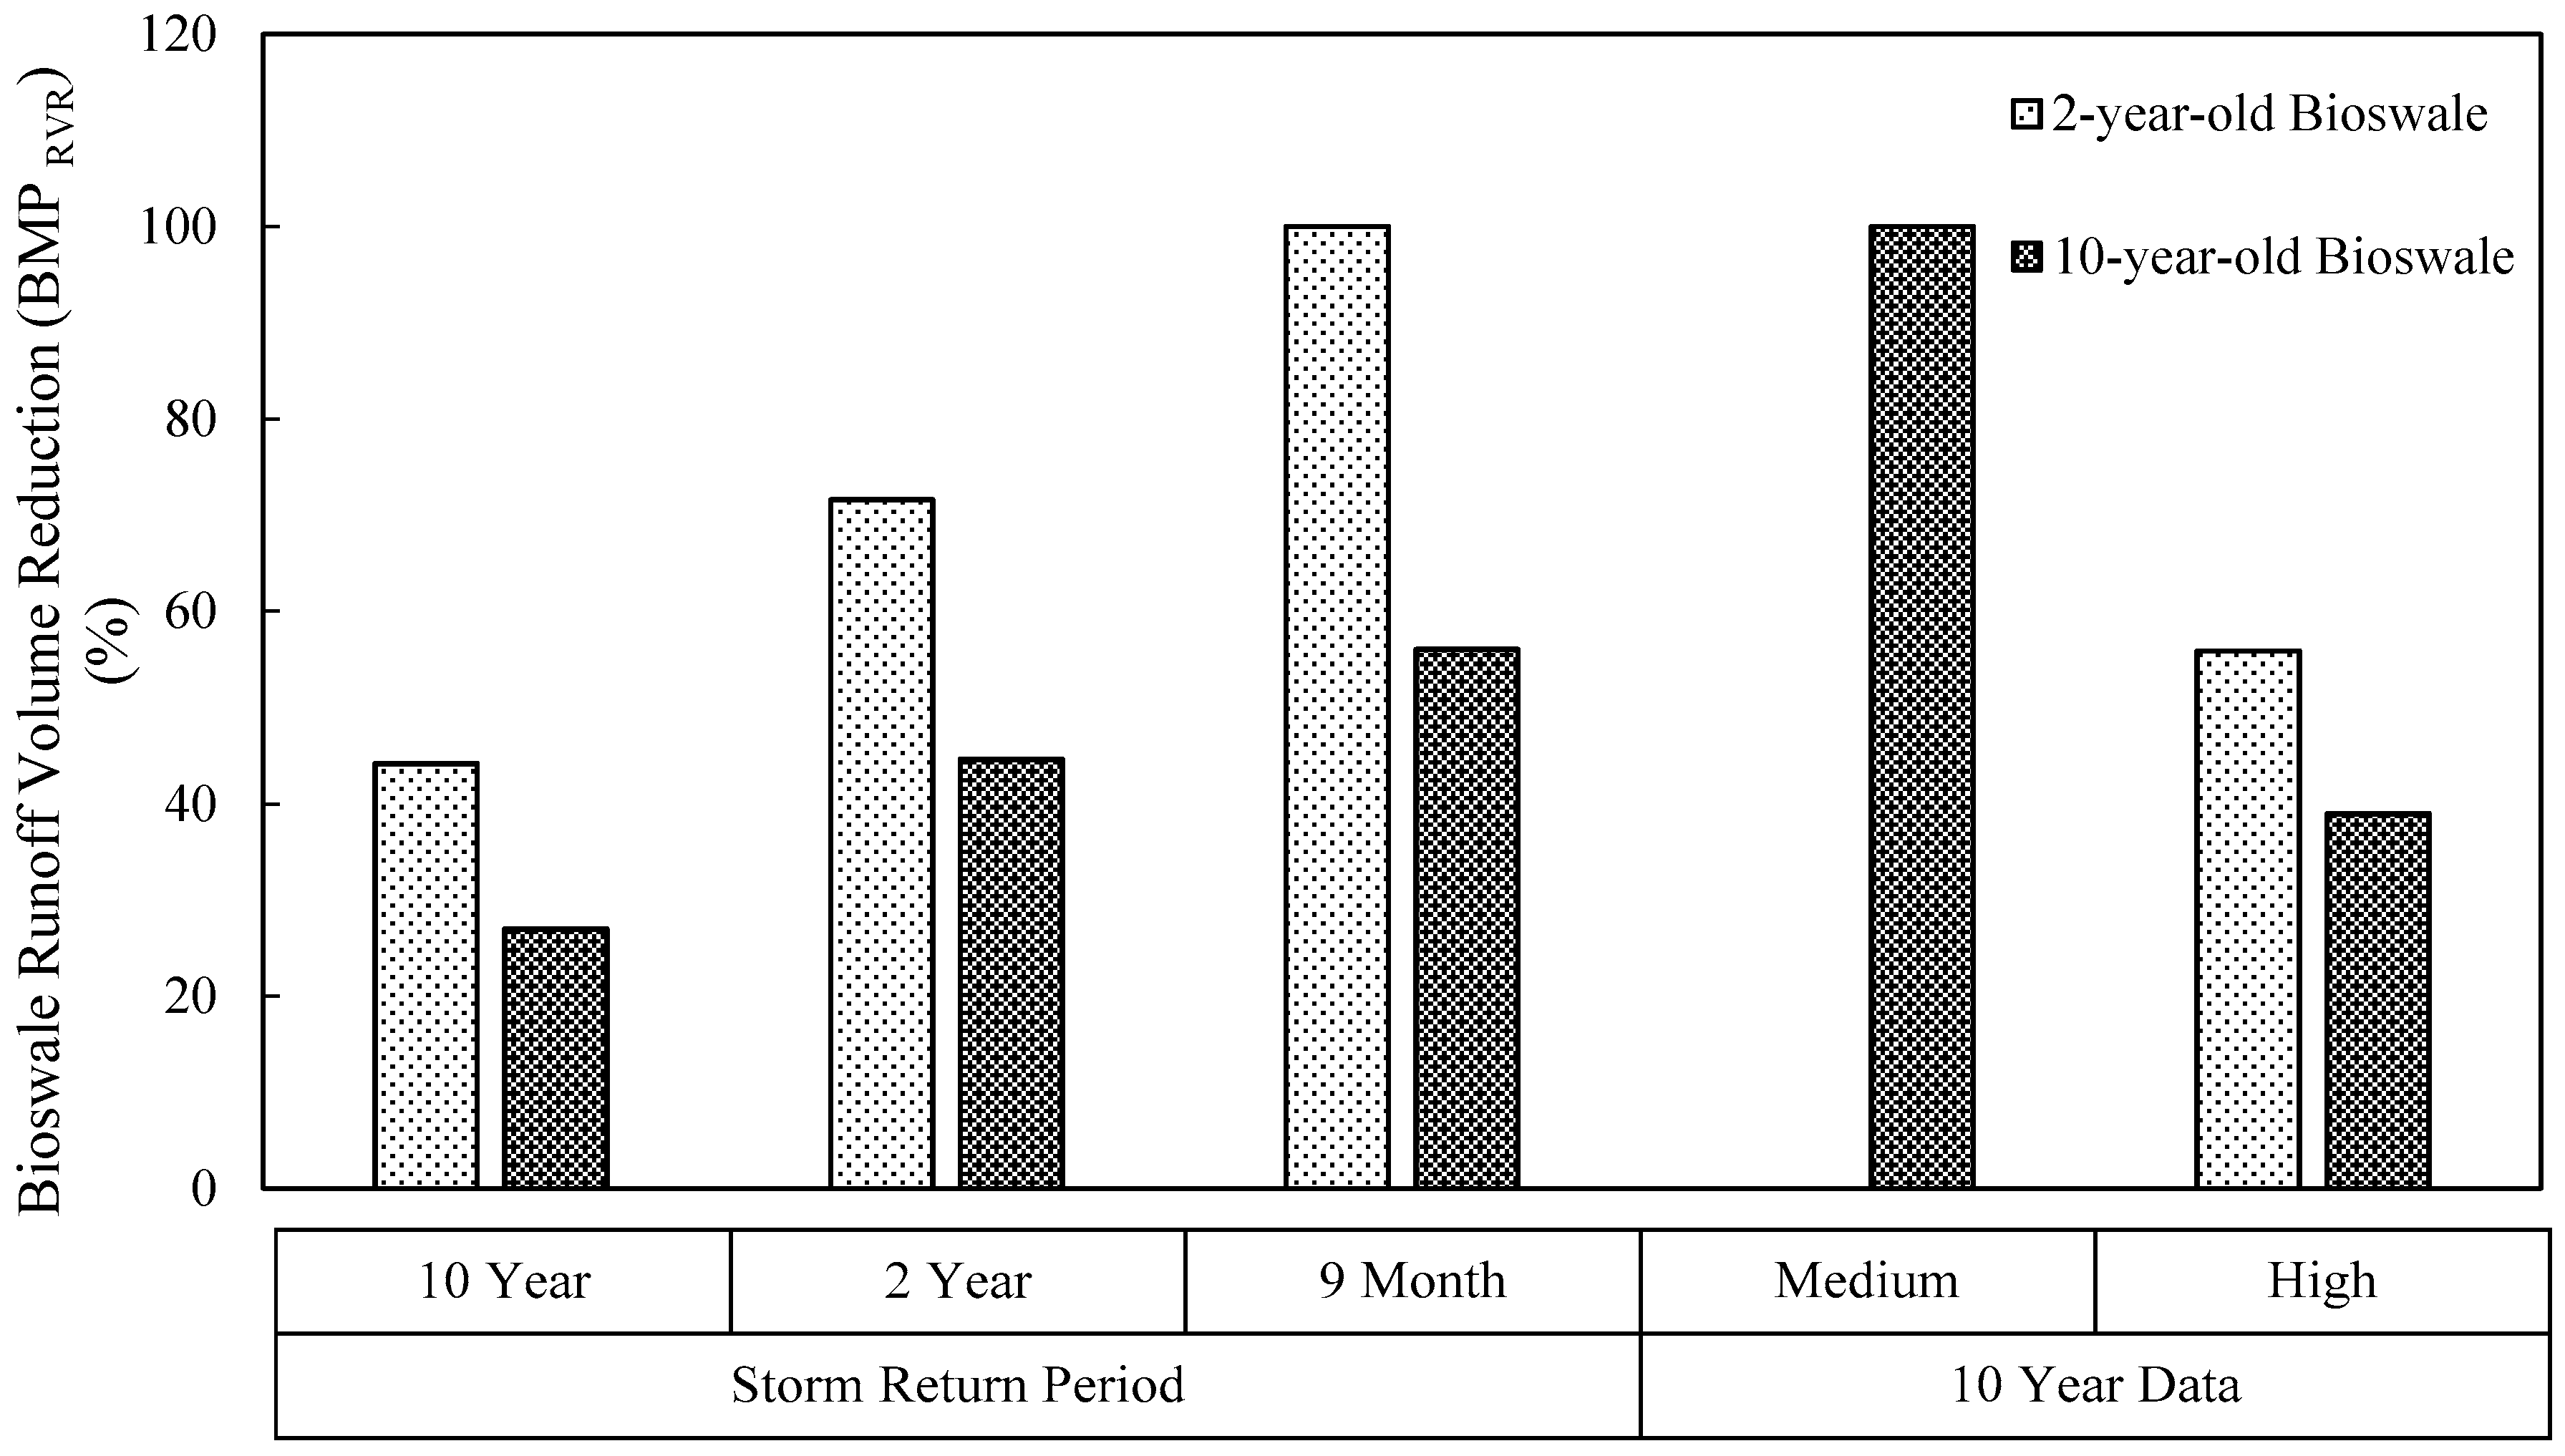
Figure 8.
Water level in the observation well for (a) bioswale; (b) infiltration trench. (a) Water level in the observation well in the 10-year-old bioswale for 10-year, 2-year, and 9-month return and medium and high storm events; (b) water level in the observation well in the new, 2-year-old, and 10-year-old infiltration trenches for a 10-year return storm event.

Figure 9.
Bioswale runoff volume.


Table 1.
Universal Soil Loss Equation (USLE) values and factors for the idealized catchment area.
| Equation Coefficients and Values | Highway | Foreslope | Level Ground |
|---|---|---|---|
| R (unitless factor) | 200 | 320 | 320 |
| K (unitless factor) | 0.01 | 0.35 | 0.35 |
| LS (rangeland) | 0.24 | 2.61 | 1.10 |
| C: No till (meadow grass) moderate productivity level | 0.01 | 0.01 | 0.01 |
| P (unitless factor) | 1 | 1 | 1 |
| USLE A (kg/m2·year) | 11.21 | 6552.49 | 2761.77 |
| Weighted average USLE A (kg/m2·year) | 0.19 | ||
© 2017 by the authors. Licensee MDPI, Basel, Switzerland. This article is an open access article distributed under the terms and conditions of the Creative Commons Attribution (CC BY) license (http://creativecommons.org/licenses/by/4.0/).
Share and Cite
MDPI and ACS Style
Osouli, A.; Bloorchian, A.A.; Nassiri, S.; Marlow, S.L. Effect of Sediment Accumulation on Best Management Practice (BMP) Stormwater Runoff Volume Reduction Performance for Roadways. Water 2017, 9, 980. https://doi.org/10.3390/w9120980
AMA Style
Osouli A, Bloorchian AA, Nassiri S, Marlow SL. Effect of Sediment Accumulation on Best Management Practice (BMP) Stormwater Runoff Volume Reduction Performance for Roadways. Water. 2017; 9(12):980. https://doi.org/10.3390/w9120980
Chicago/Turabian StyleOsouli, Abdolreza, Azadeh Akhavan Bloorchian, Sina Nassiri, and Scott L. Marlow. 2017. "Effect of Sediment Accumulation on Best Management Practice (BMP) Stormwater Runoff Volume Reduction Performance for Roadways" Water 9, no. 12: 980. https://doi.org/10.3390/w9120980
Note that from the first issue of 2016, this journal uses article numbers instead of page numbers. See further details here.