Article

Effect of Biological Contact Filters (BCFs) on Membrane Fouling in Drinking Water Treatment Systems

1
Center for Membrane and Film Technology, Department of Chemical Science and Engineering, Graduate School of Engineering, Kobe University, 1-1 Rokkodai-cho, Nada-ku, Kobe 657-8501, Japan
2
Research and Development Planning Department, Technical Development Division, Technical Research Center, Kobelco Eco-Solutions Co., Ltd., 1-1-4 Murotani, Nishi-ku, Kobe 651-2241, Japan
3
Kobe City Waterworks Bureau, 37-1 Kusudani-cho, Kobe 652-0004, Japan
*
Authors to whom correspondence should be addressed.
Water 2017, 9(12), 981; https://doi.org/10.3390/w9120981
Submission received: 5 October 2017 / Revised: 16 November 2017 / Accepted: 12 December 2017 / Published: 15 December 2017
(This article belongs to the Special Issue Biofilm Formation on Membranes in Water and Wastewater Treatment)

Abstract

:
Membrane fouling is a serious problem in drinking water treatment systems. Biological contact filters (BCFs) are often used as a pretreatment to remove ammonia, dissolved organic matter (DOM), and metal ions such as iron and manganese. In this study, the effect of BCF as a pretreatment for membrane fouling was evaluated using a laboratory-scale mini module consisting of a mini BCF column and a mini MF column. Initially, it was confirmed that the main foulant was a biopolymer (at low concentration) in the raw water. Subsequently, the biopolymer concentrations in the BCF influent and effluent were measured with the excitation emission matrix (EEM) fluorescence spectroscopy and the liquid chromatograph organic carbon detector (LC-OCD). The fouling potential of the BCF influent and effluent was also measured to evaluate MF membrane fouling rate. The results demonstrate that application of the BCF reduced the biopolymer concentration of the effluent and reduced membrane fouling. The effect of BCF was also established in an actual drinking water treatment plant. It was found that optimizing the contact time of raw water with the BCF was crucial to reduce membrane fouling.

1. Introduction

Microfiltration (MF) and ultrafiltration (UF) systems have been adopted in drinking water treatment systems to remove suspended solids and pathogenic microorganisms (e.g., cryptosporidium) from raw water. However, these membrane systems cannot remove dissolved matter such as substances that cause foul smell and dissolved metals. Thus, biological contact filters (BCFs) have been employed as a pretreatment system [1]. Compared with common pretreatment methods like coagulation and active carbon adsorption, the advantage of BCF treatment is that it can remove dissolved mater without chemicals and does not produce sludge [2]. Moreover, cleaning the filter media in BCF columns is straightforward, involving just weekly chemical-free water flashing and air bubbling. This process is extremely safe and easy to maintain. In contrast, although coagulation and active carbon adsorption are simple processes, the former method produces a large amount of sludge and the latter method requires expensive media.
BCF is a filter media onto which microorganisms are attached. When raw water such as river water flows through the BCF column, ammonia and dissolved organic matter (DOM), including those that produce foul smell, are oxidized and removed by the microorganisms attached to the filter media [3]. Additionally, iron and manganese are also oxidized to insoluble metal oxides and removed by autotrophic bacteria [4]. Microorganisms in the BCF trap the oxidized matter, thereby restricting its flow to the next process (MF or UF). Regarding the effect of BCF treatment on biopolymers, two types of effects are expected. First, biopolymers may be decomposed by microorganisms in the BCF column. Second, biopolymer may be produced by microorganisms as metabolites. It has been reported that the main foulants in water treatment systems are biopolymers [5,6]. Despite these on-going issues, few reports have emerged concerning the influence of BCF treatment on membrane fouling.
In this study, we investigated the effect of BCF pretreatment on membrane fouling in a drinking water treatment system. Initially, we confirmed that the main foulants were biopolymers. Then, we investigated the effect of BCF treatment on changing in the biopolymer concentration in the effluent of the BCF column to prevent membrane fouling. Essentially, the performance of BCF is based on biological reactions. Thus, the influences of temperature and the contact time of the raw water in the BCF column were also investigated.

2. Materials and Methods

2.1. Water Sample

In this study, the feed water was sampled from the Motoyama drinking water treatment plant in Kobe, Japan. In this plant, a MF system capable of treating 2000 m3/day of water has been introduced since 2010. Raw water taken from the Sumiyoshi River is fed to the BCF as a pretreatment for the membrane system, and the BCF effluent is provided to the MF system directly. The linear velocity in the BCF is ~75 m/day with down flow. The filter media in BCF is washed weekly by water flushing and air bubbling.
The water sample for our study was taken from the BCF influent and effluent in the Motoyama plant and used without any pretreatment.

2.2. Test Equipment

In order to confirm the identity of the main foulants in raw water from the Sumiyoshi River, we investigated the relationship between the water composition and membrane fouling using laboratory-scale mini test equipment. The mini test equipment consisted of a mini BCF column and mini MF modules, as shown in Figure 1.
The mini BCF column was a cylindrical pipe made from transparent acrylic with an inner diameter and height of 32 mm and 1.8 m, respectively. Ceramic beads 1.4 mm in diameter and 2.8 mm in length, onto which the microorganisms were adhered, were filled in the column to a height of 1.6 m. The raw water was fed into the column with down flow at a superficial velocity of 75 m/day. To consider the influence of contact time in the BCF column, four nozzles were set at 20, 40, 80, and 120 cm from the top surface of the filter media, which is equivalent to 3.75, 7.5, 15, and 22.5 min of contact time of raw water with filter media, respectively. To consider the effect of water temperature, a heater or condenser was placed in the feed tank to control the water temperature at 5 ± 0.2 °C, which corresponds to the average winter water temperature.
The water sample taken from the mini BCF column under each condition was fed to the mini MF module as a feed. The mini MF module consisted of three hollow fibers of polyvinylidene fluoride (PVDF) (Asahi Kasei Chemicals, Tokyo, Japan) of 12 cm in effective length. The fiber pore size was 0.08 μm, and its outer and inner diameters were 1.25 mm and 0.69 mm, respectively. One end of the module was closed with resin, while the other end was open to draw out the permeated water. The effective surface area of the module was ~15 cm2. The mini module was immersed in the cylindrical column of 25 mm in inner diameter and 40 cm in length. The sample water was circulated through the MF column by a micro tube pump at a superficial velocity of 100 m/day. The permeated water was drawn from the open side of the mini module by another micro tube pump. Table 1 shows the operating conditions of this system. The actual commercial plant employed in this study (i.e., the Motoyama drinking water treatment plant) utilizes external-type pressure for its use, whereas the mini module test equipment utilizes a vacuum for permeate withdrawal. However, this difference is unlikely to affect membrane fouling. Sodium hypochlorite (NaClO) was injected into the backwashing pipe line of the mini module test equipment since, in the actual plant, NaClO is used to sterilize the inside of the pipe line through which permeated water flows, and it also cleans the membrane. Additionally, although the actual plant module has an air bubbling system to remove sediments on the membrane surface, the test equipment did not have one. Thus, according to the method reported by Miyoshi et al. [7], the membrane surface was wiped with a sponge to remove the sediments once a week and at the end of the test.

2.3. Experimental Methods

2.3.1. Mini Biological Contact Filter (BCF) Column Test

To begin the mini BCF column test, 20 L of BCF effluent taken from the actual plant was circulated through the mini BCF column at a superficial velocity of 75 m/day with down flow operation for one week at room temperature (~20 °C). During this time, microorganisms within in the BCF effluent attached to the filter media in the mini BCF column. Then, the mini BCF feed water was changed to 20 L of BCF influent taken from the actual plant and circulated through the column. The mini BCF feed water was replaced once per week, and the operation continued for two months to stabilize the BCF column.
Subsequently, 20 L of BCF influent taken from the actual plant was circulated through the mini BCF test column for more than two weeks. The temperature of the BCF influent was controlled at 5 °C to acclimate the microorganisms to low temperature, which corresponded to the actual river water temperature during the season the tests were performed. The mini BCF feed water was replaced once per week. After more than two weeks of acclimation to 5 °C, the influence of the water temperature on the process was investigated by passing each new water sample controlled at 5, 10, 15, and 20 °C to the mini BCF column for more than 60 min. The processed water from each port was then collected to determine to effect of various contact times on the sampled water.

2.3.2. Filtration Test of Sampled Water

In order to evaluate the fouling potential of water sampled from the actual plant, the filtration test was performed using the mini MF module test equipment shown in Figure 1b. Sampled water was circulated through the mini MF column in which the mini MF module was set. The permeated water was drawn through the mini MF module at a constant velocity of 1.5 m3/(m2·day). The mini MF module was backwashed with permeated water mixed with NaClO (5 ppm) for 1 min every 30 min to reduce membrane fouling. The transmembrane pressure (TMP) was monitored for five days.
The fouling potential of the sampled water was evaluated by its membrane filtration resistance (1/m), Rm(t), which is defined by Equation (1).
Rm(t) = ΔP(t)/(μ·J)
where ΔP(t) is the transmembrane pressure (Pa) at time t (day), J is the filtration flux (m/s), and μ is the viscosity (Pa·s) of the sample water. Note that larger values of Rm(t) indicate a higher fouling potential of the sampled water.

2.3.3. Foulant Extraction Method

After the filtration test, the fouled mini MF module was removed from the casing column. The membrane surface was then wiped carefully to remove the reversible fouling materials, and the membrane was immersed in a NaOH solution (pH 12) for 24 h to extract the organic foulants. Although NaClO (5 ppm) was used for the backwashing step, NaOH was used to extract the organic foulants because NaClO may cause their oxidation.

2.4. Analytical Method

2.4.1. Excitation Emission Matrix (EEM) Fluorescence Spectroscopy

In order to characterize the dissolved organic matter (DOM) in the influent and effluent of the mini BCF column, EEM measurements were performed. Prior to the EEM measurements, however, all samples were filtered through a 0.45 μm hydrophilic polytetrafluoroethylene membrane (DISMIC 13HP045AN, ADVANTEC, Tokyo, Japan). An EEM spectrometer measured the EEM fluorescence (Aqualog, HORIBA Advanced Techno Co., Ltd., Kyoto, Japan). The excitation light was set from 220 to 800 nm and irradiated for 1 s at intervals of 3 nm. As in Chen et al. [8], when evaluating the three-dimensional fluorescence spectra, the spectra were divided into five domains and the sum of the fluorescence intensity within each domain was calculated.

2.4.2. Liquid Chromatograph Organic Carbon Detector (LC-OCD)

LC-OCD measurements were performed to analyze the concentration of natural organic matter (NOM) in the influent and effluent of the mini BCF column. Before the LC-OCD measurements, the same type of membrane filter used for the EEM measurements was used to filter all of the samples. The organic carbon content was measured with a Model 8 DOC-LABOR instrument (DOC-LABOR, Karlsruhe, Germany). The chromatographic column we used is a hydrophilic week cation exchange resin (TOYOPEARL HW-50, Tosoh, Tokyo, Japan). The NOMs separated in the chromatographic column were oxidized by UV in the thin film reactor. Then, NOMs were converted into CO2 by acidification liquid and removed from the feed. The concentration of NOMs were determined as the concentration of CO2 by non-diffusion infrared detector. The mobile phase consisted of a phosphorus acid buffer at pH 6.58 with sodium dihydrogen phosphate and disodium hydrogenphosphate (Sigma-Aldrich Japan, Tokyo, Japan), and the acidification liquid consisted of a phosphorus acid buffer at pH 1.5 with phosphoric acid and potassium peroxodisulfate (Sigma-Aldrich Japan, Tokyo, Japan). The mobile phase was injected at a flow rate of 1.1 mL/min, and the quantity of the sample injection was set to 1000 μL. The total retention time was set at 130 min. The concentration of NOMs was calculated using the software chromCALC (DOC-LABOR, Karlsruhe, Germany) customized to our system.

3. Results and Discussion

3.1. Identification of Foulants

To identify the foulants in the river water with the MF membrane, filtration tests of the BCF influent of an actual plant along the Sumiyoshi River were performed for two months using the mini MF module under the conditions listed in Table 1. After this period, the fouled mini MF module was removed from the casing column and the organic foulants were extracted by the procedure outlined in Section 2.3.3. The BCF influent and the foulants extracted from membrane surface were then subjected to EEM and LC-OCD analyses.
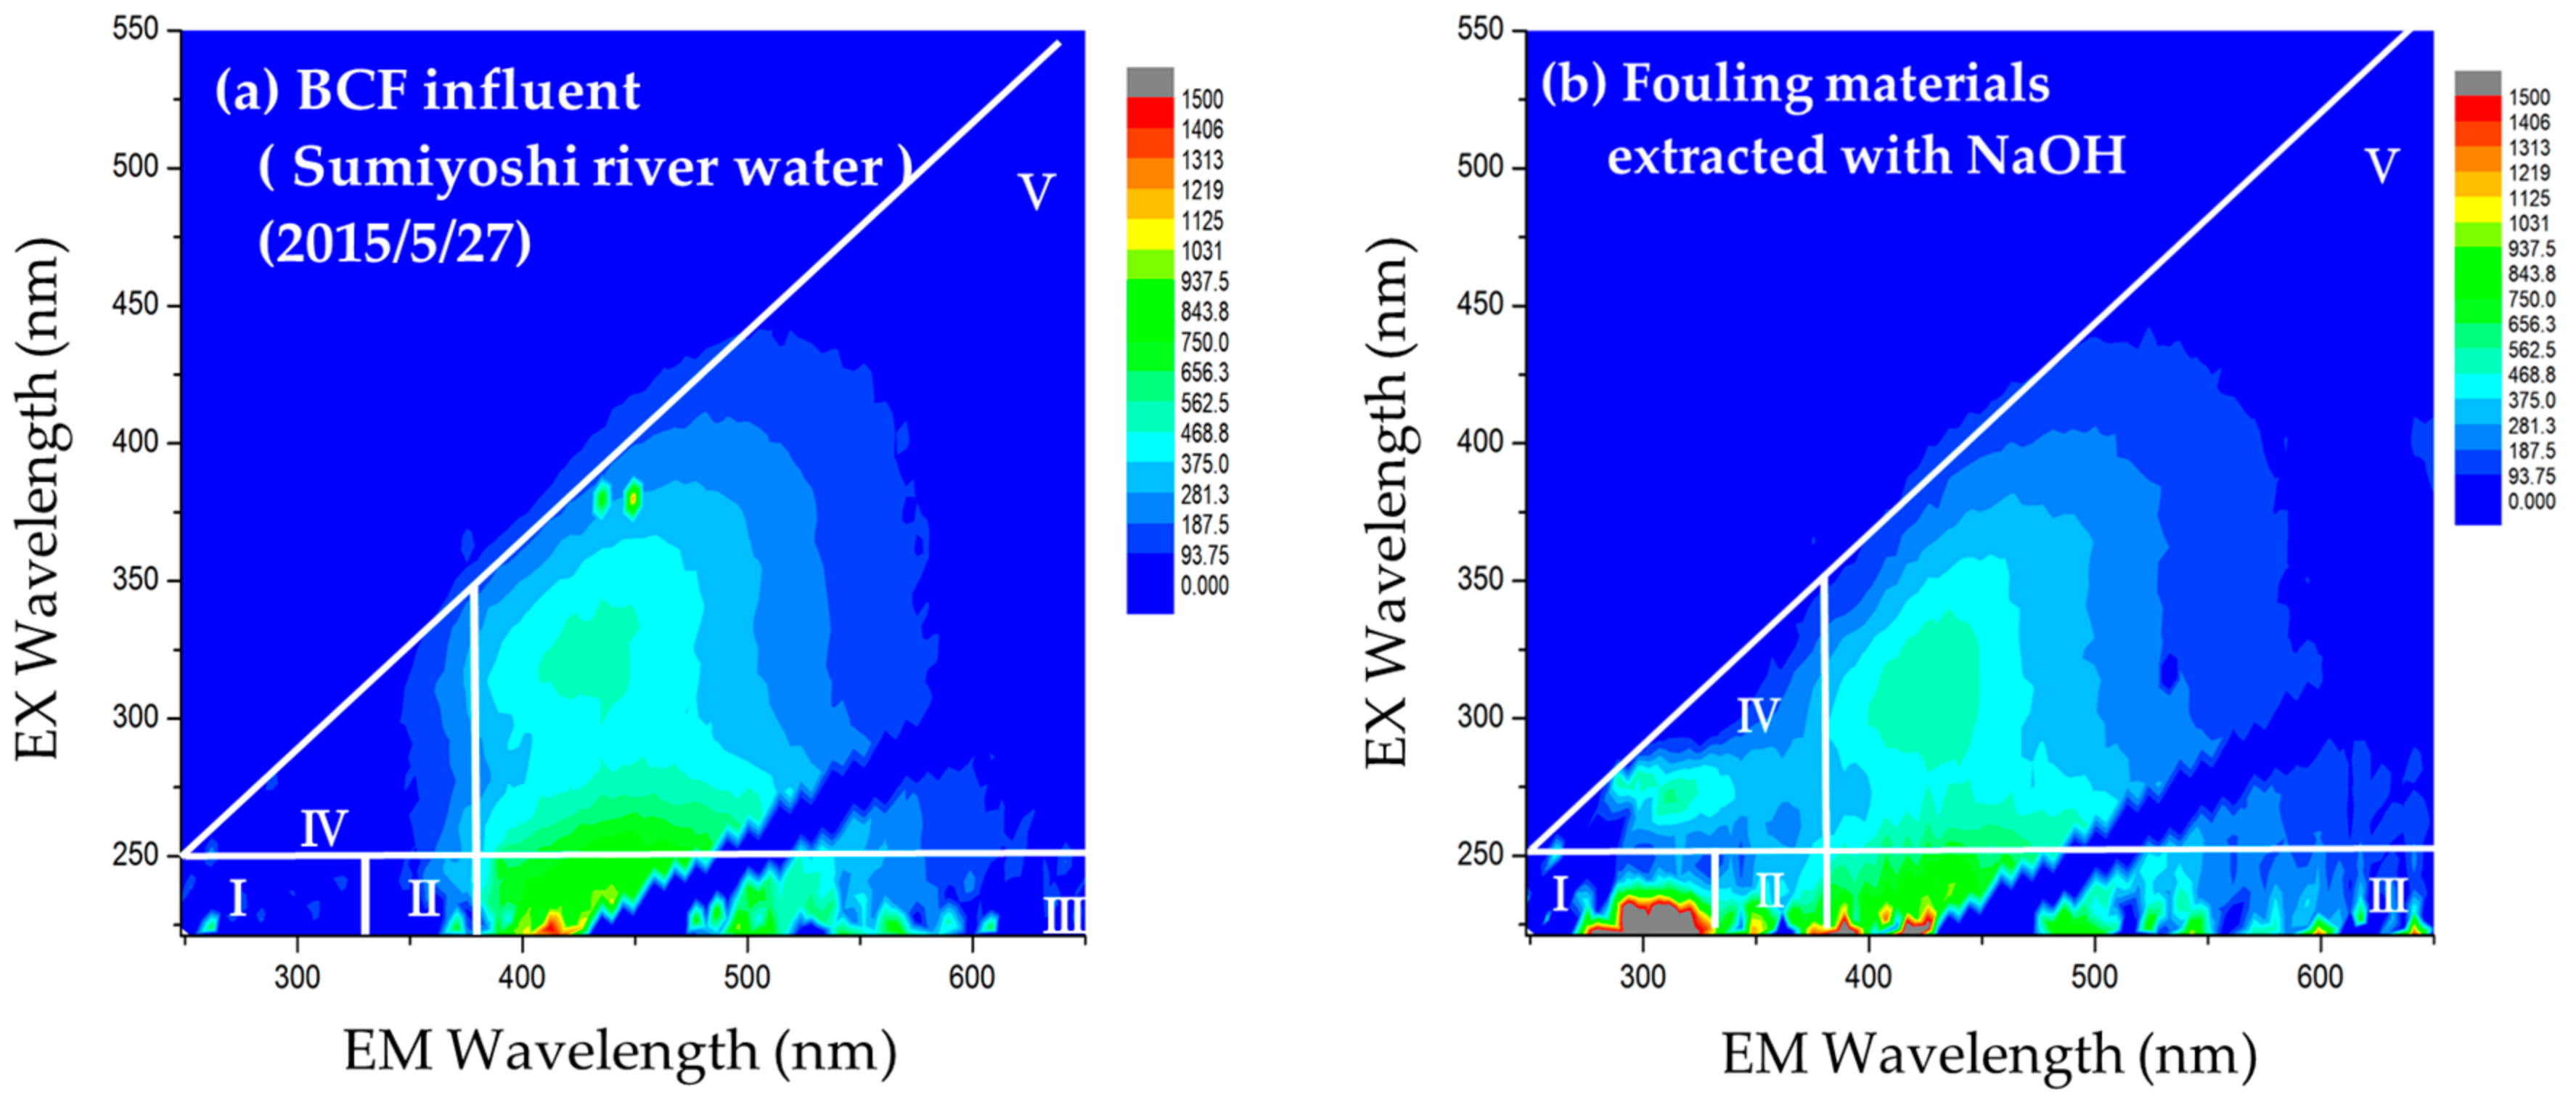
Figure 2 shows the results of the EEM analysis of the (a) BCF influent and (b) fouling material extracted from the MF membrane after two months of operation. According to the classification by Chen et al. [8], humic substances, including fulvic acid-like (Region III) and humic acid-like (Region V) materials, were the major components in the BCF influent; peaks corresponding to proteins (classified in Regions I, II, and IV) were scarcely detected. However, peaks corresponding to proteins were clearly detected in the fouling material extracted from membrane surface. The protein-like materials are contained in the river water, even though their concentration was negligibly low. They will also be produced by bacteria attached on the membrane surface when the biofouling takes place. However, in our experiment, the filtration test was carried out for five days with backwashing for 1 min every 30 min. So, the biofouling may scarcely take place. Thus, it is difficult to identify where these protein-like materials come from, the bacteria attached to the membrane surface, and/or the river water.
Figure 3 shows the results of the LC-OCD analysis of the (a) BCF influent and (b) fouling material extracted from the fouled MF membrane. As with the EEM results, it is clear from Figure 3a that the major component of the organic material in the BCF influent is the humic substances, which had a retention time of 43 min. In the fouling material, however, the concentration of biopolymers [7], located at a retention time of 31 min, was the highest or comparable with the humic substances, as shown in Figure 3b. This result is consistent with that of EEM. Overall, these results demonstrate that a very small amount of biopolymer in the BCF influent strongly influenced fouling of the MF membrane.

3.2. Effect of BCF Pretreatment on MF Membrane Fouling

Because BCF is a biological process, it is reasonable to consider that the water temperature and contact time between the water and the microorganisms in the BCF affect its performance. To this end, we investigated the influence of these variables following the procedure outlined in Section 2.3.1. The focus of these investigations involved the biopolymer and humic substances, since these were identified in Section 3.1 as the main foulants.
Figure 4a,b show the concentrations, as measured by LC-OCD, of the humic substances and biopolymers in the mini BCF effluent as a function of contact time, respectively. The data at zero contact time corresponds to the raw feed water. It is clear from Figure 4a that most of the humic substances were not removed by the BCF pretreatment; the concentrations were essentially identical regardless of the contact time. By comparison, the biopolymer was removed ~30% by the BCF pretreatment, even at the very low temperature of 5 °C. In addition, Figure 4b shows that the biopolymer concentration first decreased with the contact time and then increased after showing a concentration minimum at 15 min contact time for all temperatures investigated.
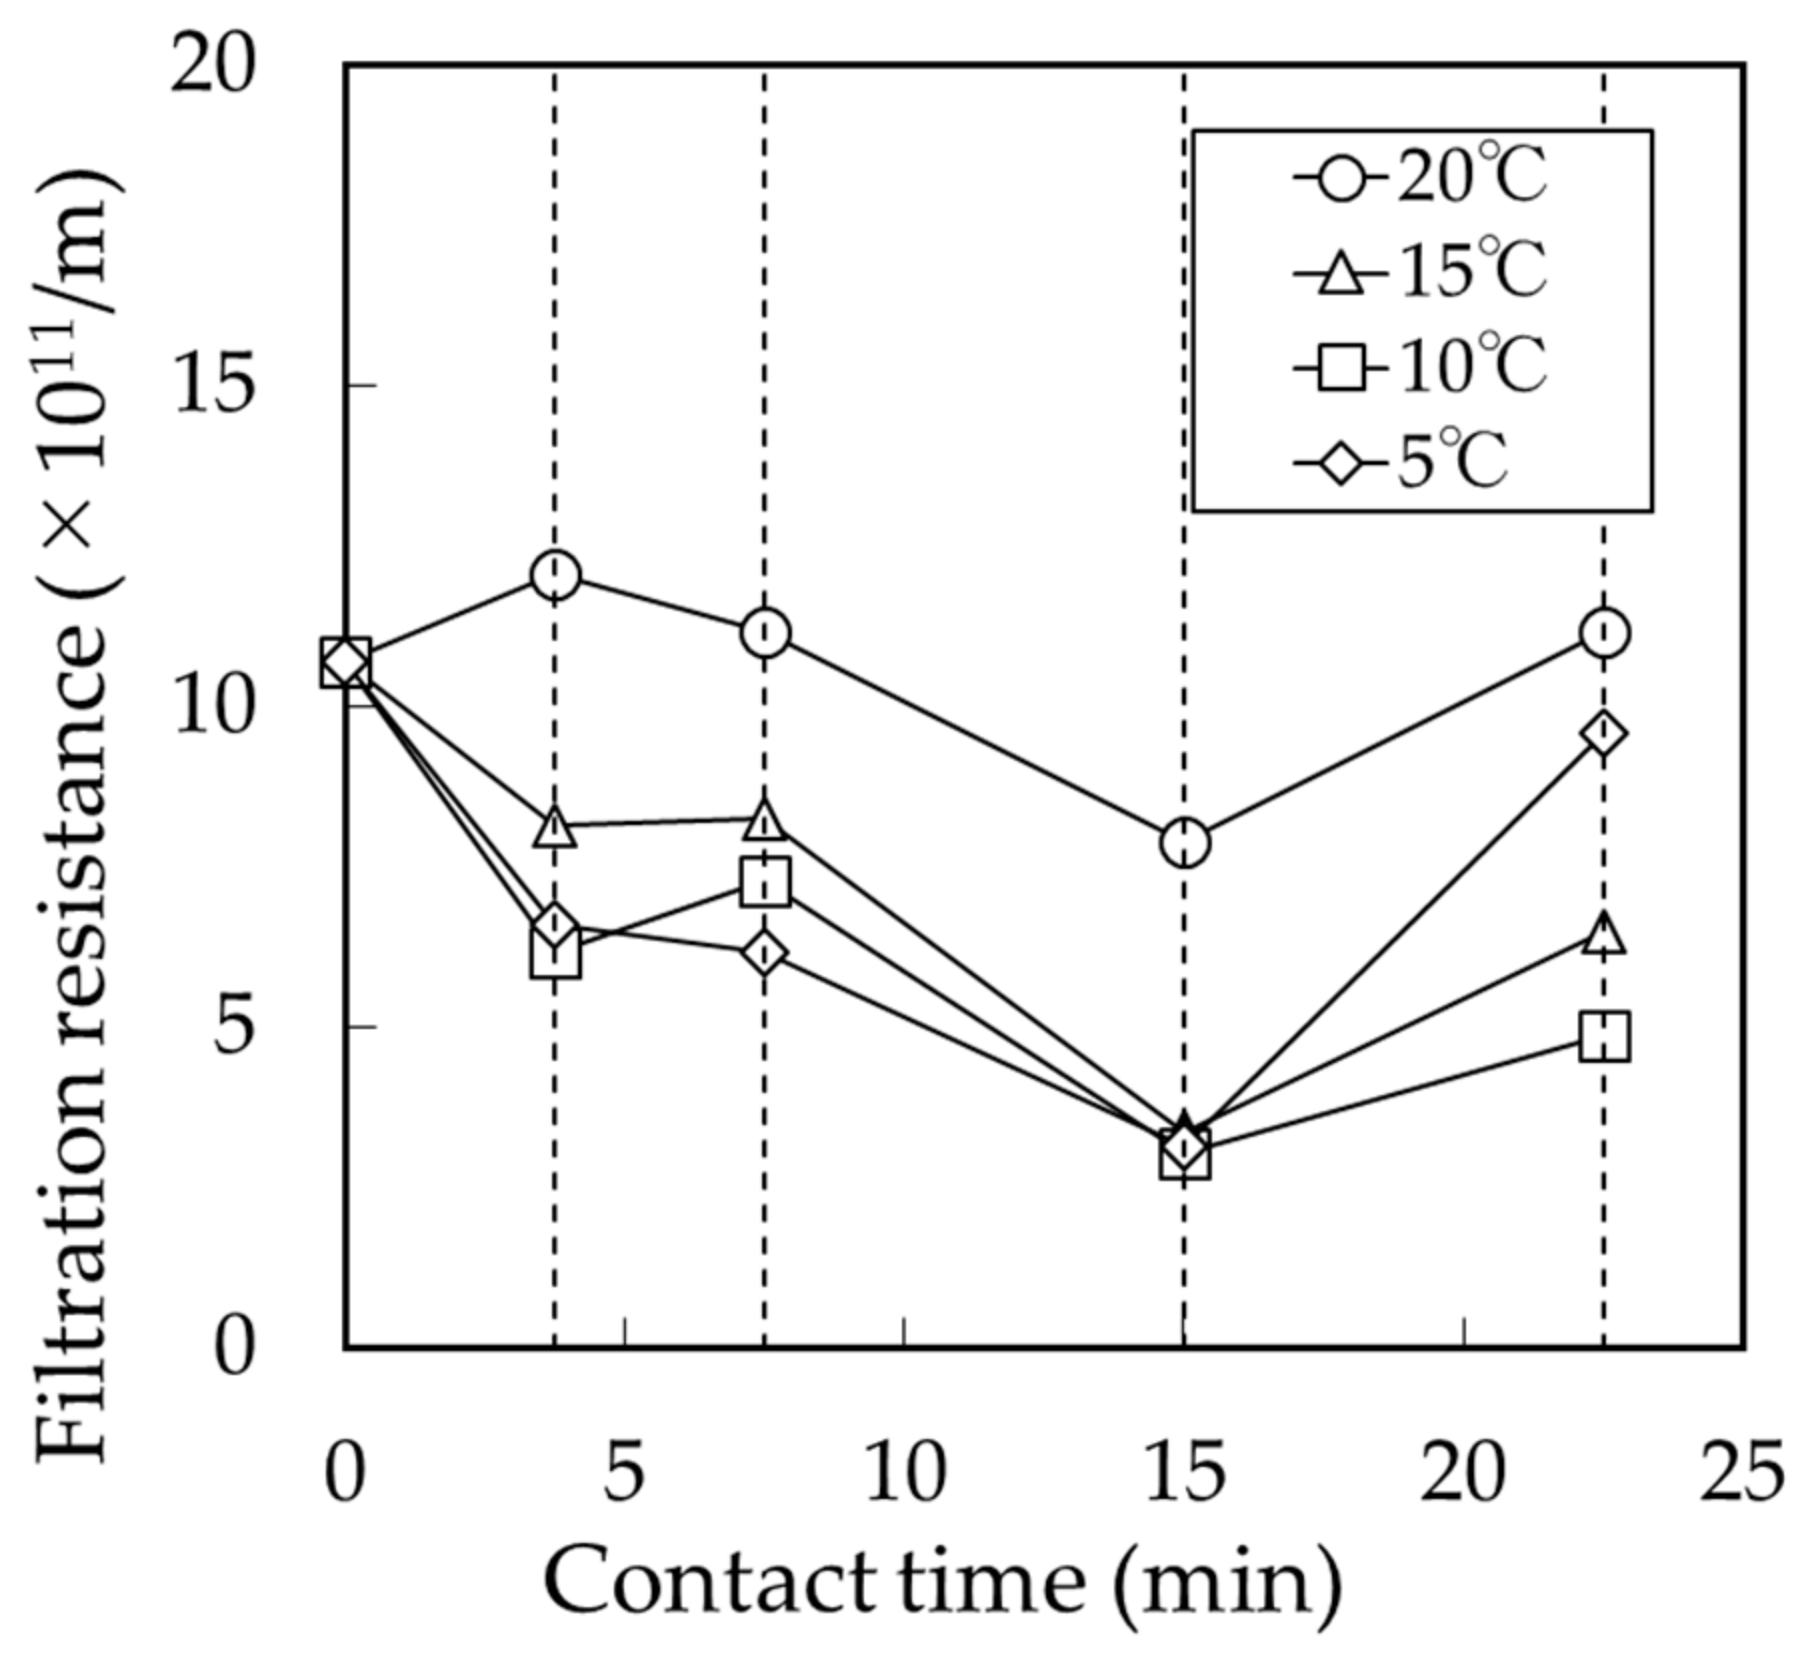
The filtration resistance (Equation (1)) of each water sample taken from the BCF column test was calculated using the 20 h filtration data to evaluate their fouling potential. Figure 5 shows the change of filtration resistance of the membrane as a function of contact time at each operation temperature. As seen, the change of filtration resistance is similar to the change of biopolymer concentration. This result suggests that the biopolymer is the most important component related to membrane fouling in this drinking water treatment system. It is clear from Figure 4b and Figure 5 that the BCF is an effective pretreatment method for reducing membrane fouling.
It is found from Figure 4b and Figure 5 that the biopolymer concentration and filtration resistance increase at contact times longer than 15 min. In the mini BCF column, biopolymers may be decomposed by microorganisms, and meanwhile produced as metabolites. Thus, the biopolymer concentration in the mini BCF effluent is determined by the competition of two opposite phenomena, decomposing and producing biopolymer. The concentration of biopolymer produced by microorganisms probably exceeded the concentration of biopolymer decomposed by microorganisms at contact times longer than 15 min. Then, the biopolymer concentration increased and the filtration resistance increased at contact times longer than 15 min. Previous studies have reported that longer contact times in BCFs lead to superior biopolymer removal [9,10]. However, the results presented herein suggest that optimizing the contact time is crucial.
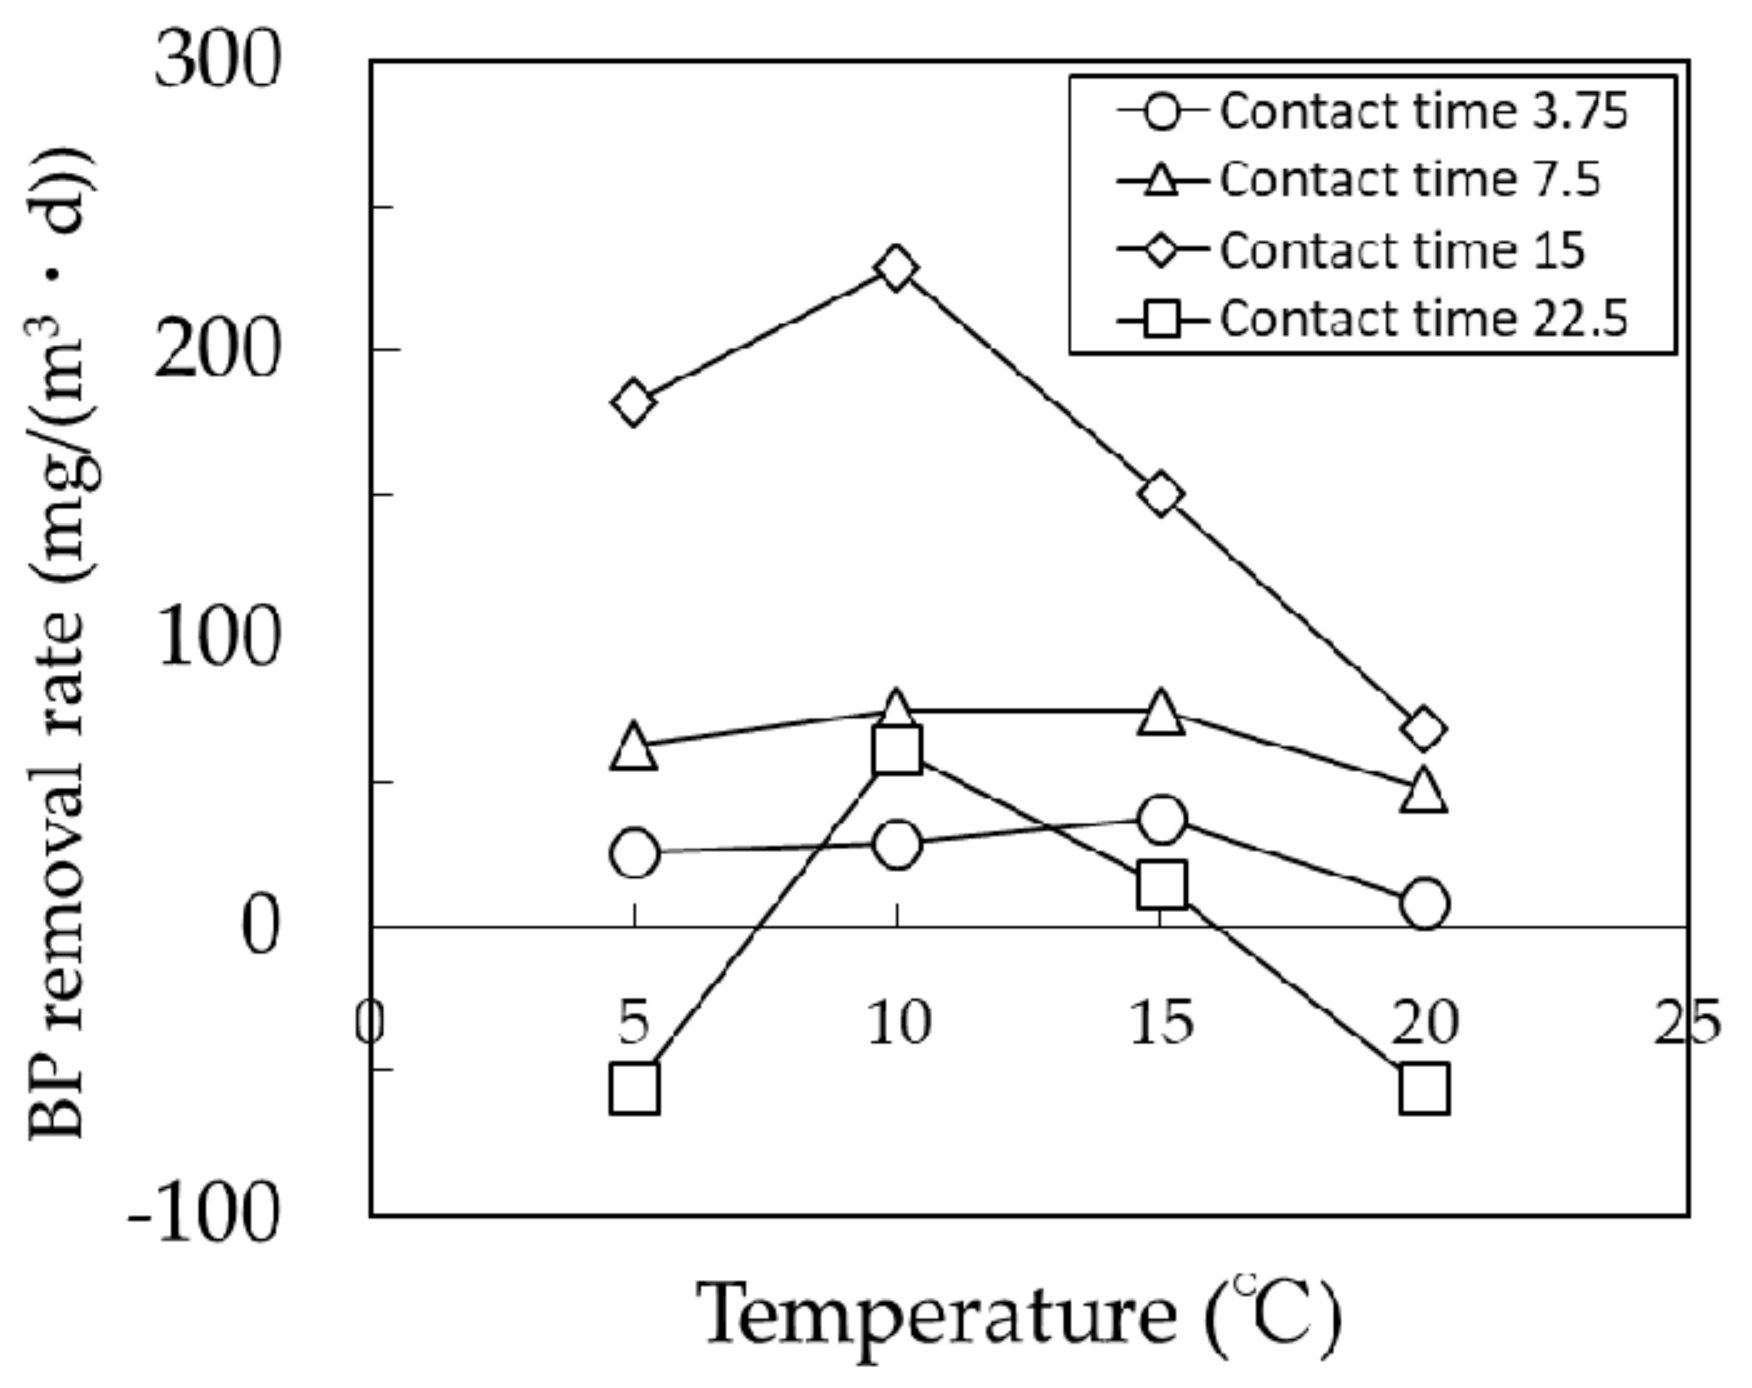
Figure 6 shows the relationship between temperature and biopolymer removal rate, rb (mg/(m3·day)) in each contact time of BCF calculated with Equation (2).
rb = Q × (CiCt)/Vt
where Q is flow rate (m3/day), Ci and Ct are the biopolymer concentration (mg/m3) of influent and effluent at contact time, t (day) respectively. Vt is the reactor volume (m3) for contact time, t. It is clear from Figure 6 that the optimum temperature of microorganisms assimilated at low temperature of 5 °C is around 10 °C, and at 20 °C, the activity of microorganisms to remove biopolymer decreased remarkably. It means that the temperature changes as large as 15 °C (from 5 to 20 °C) caused a decrease of the biopolymer removal and negatively affected the filtration resistance. In general, however, the daily temperature change of raw water is assumed to be within 10 °C. Thus, the daily temperature change of raw water is unlikely to affect the performance of BCFs as a pretreatment strategy.
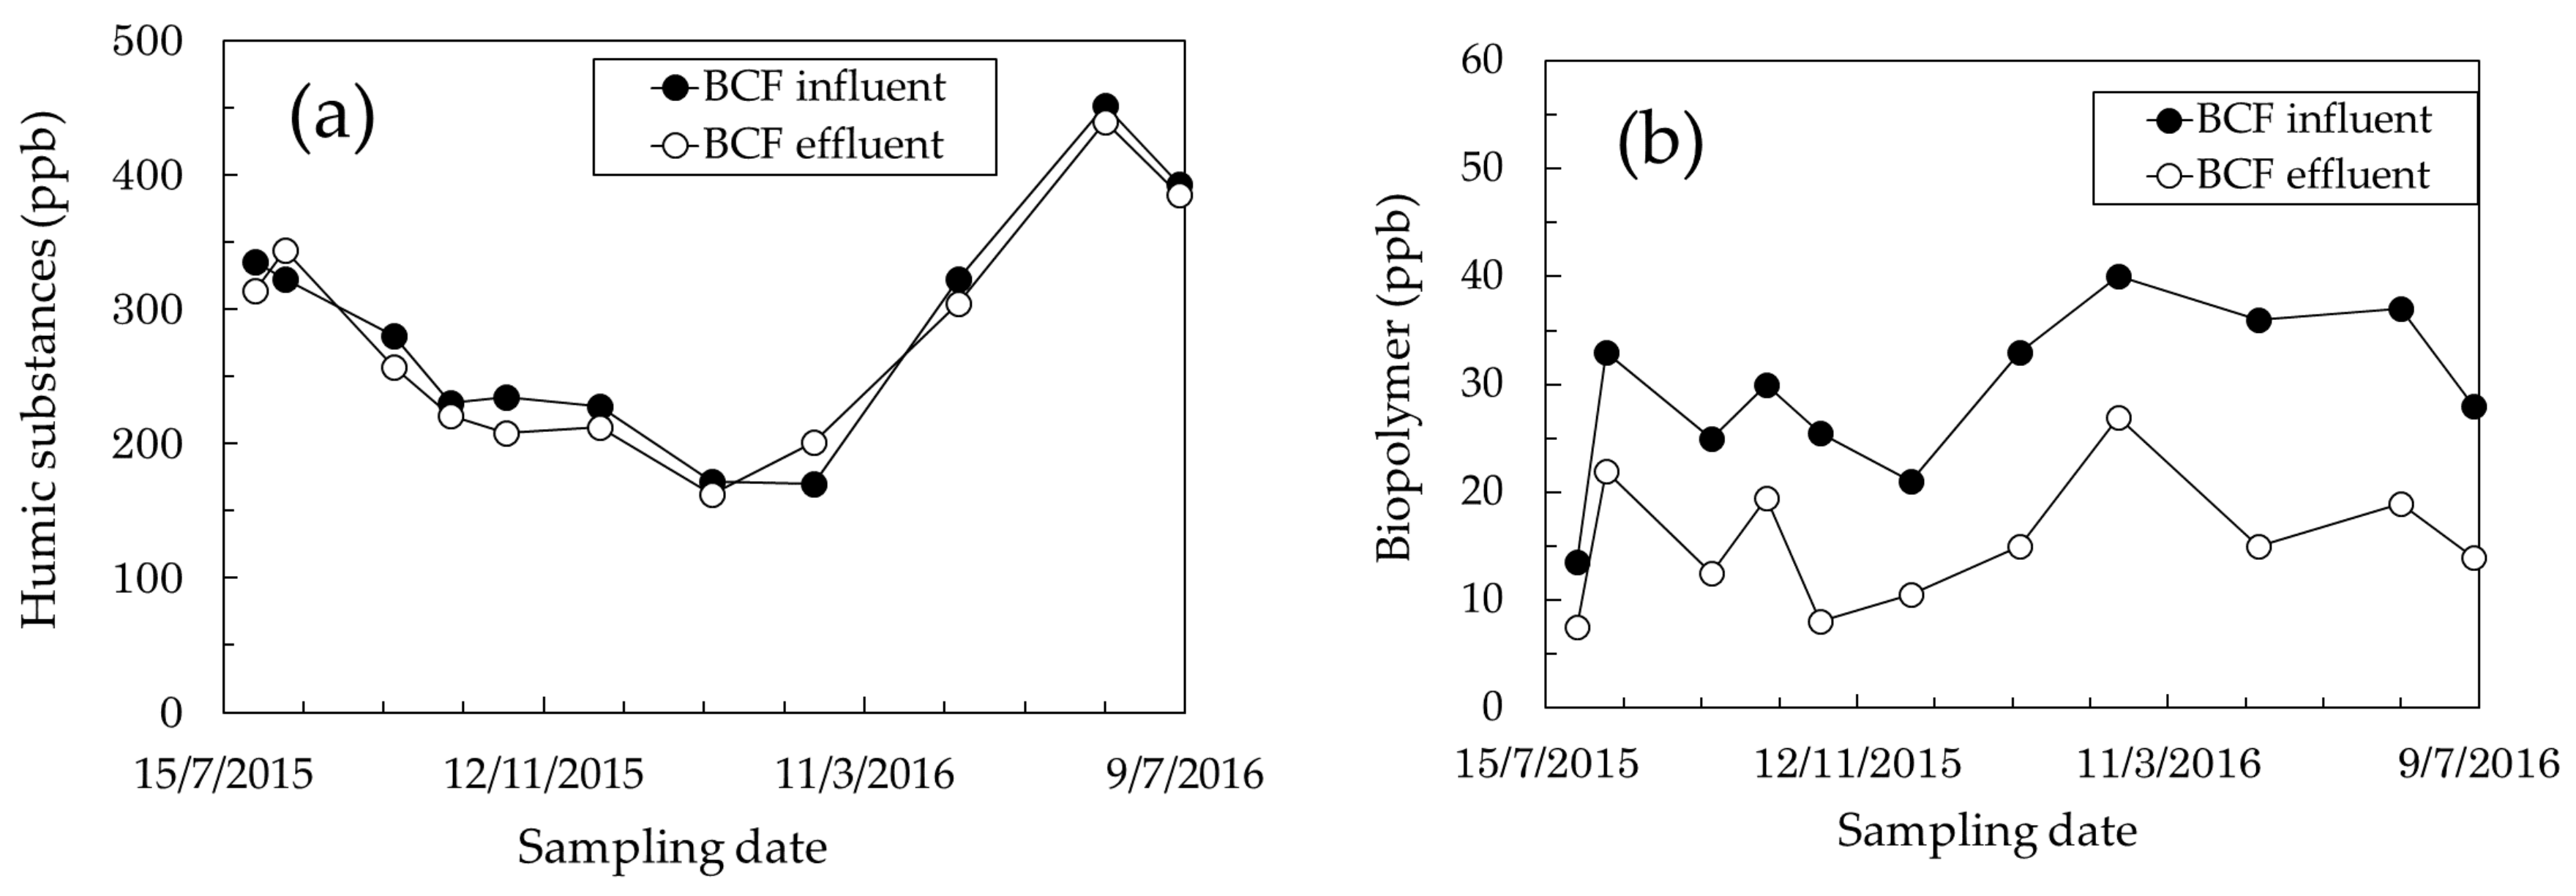
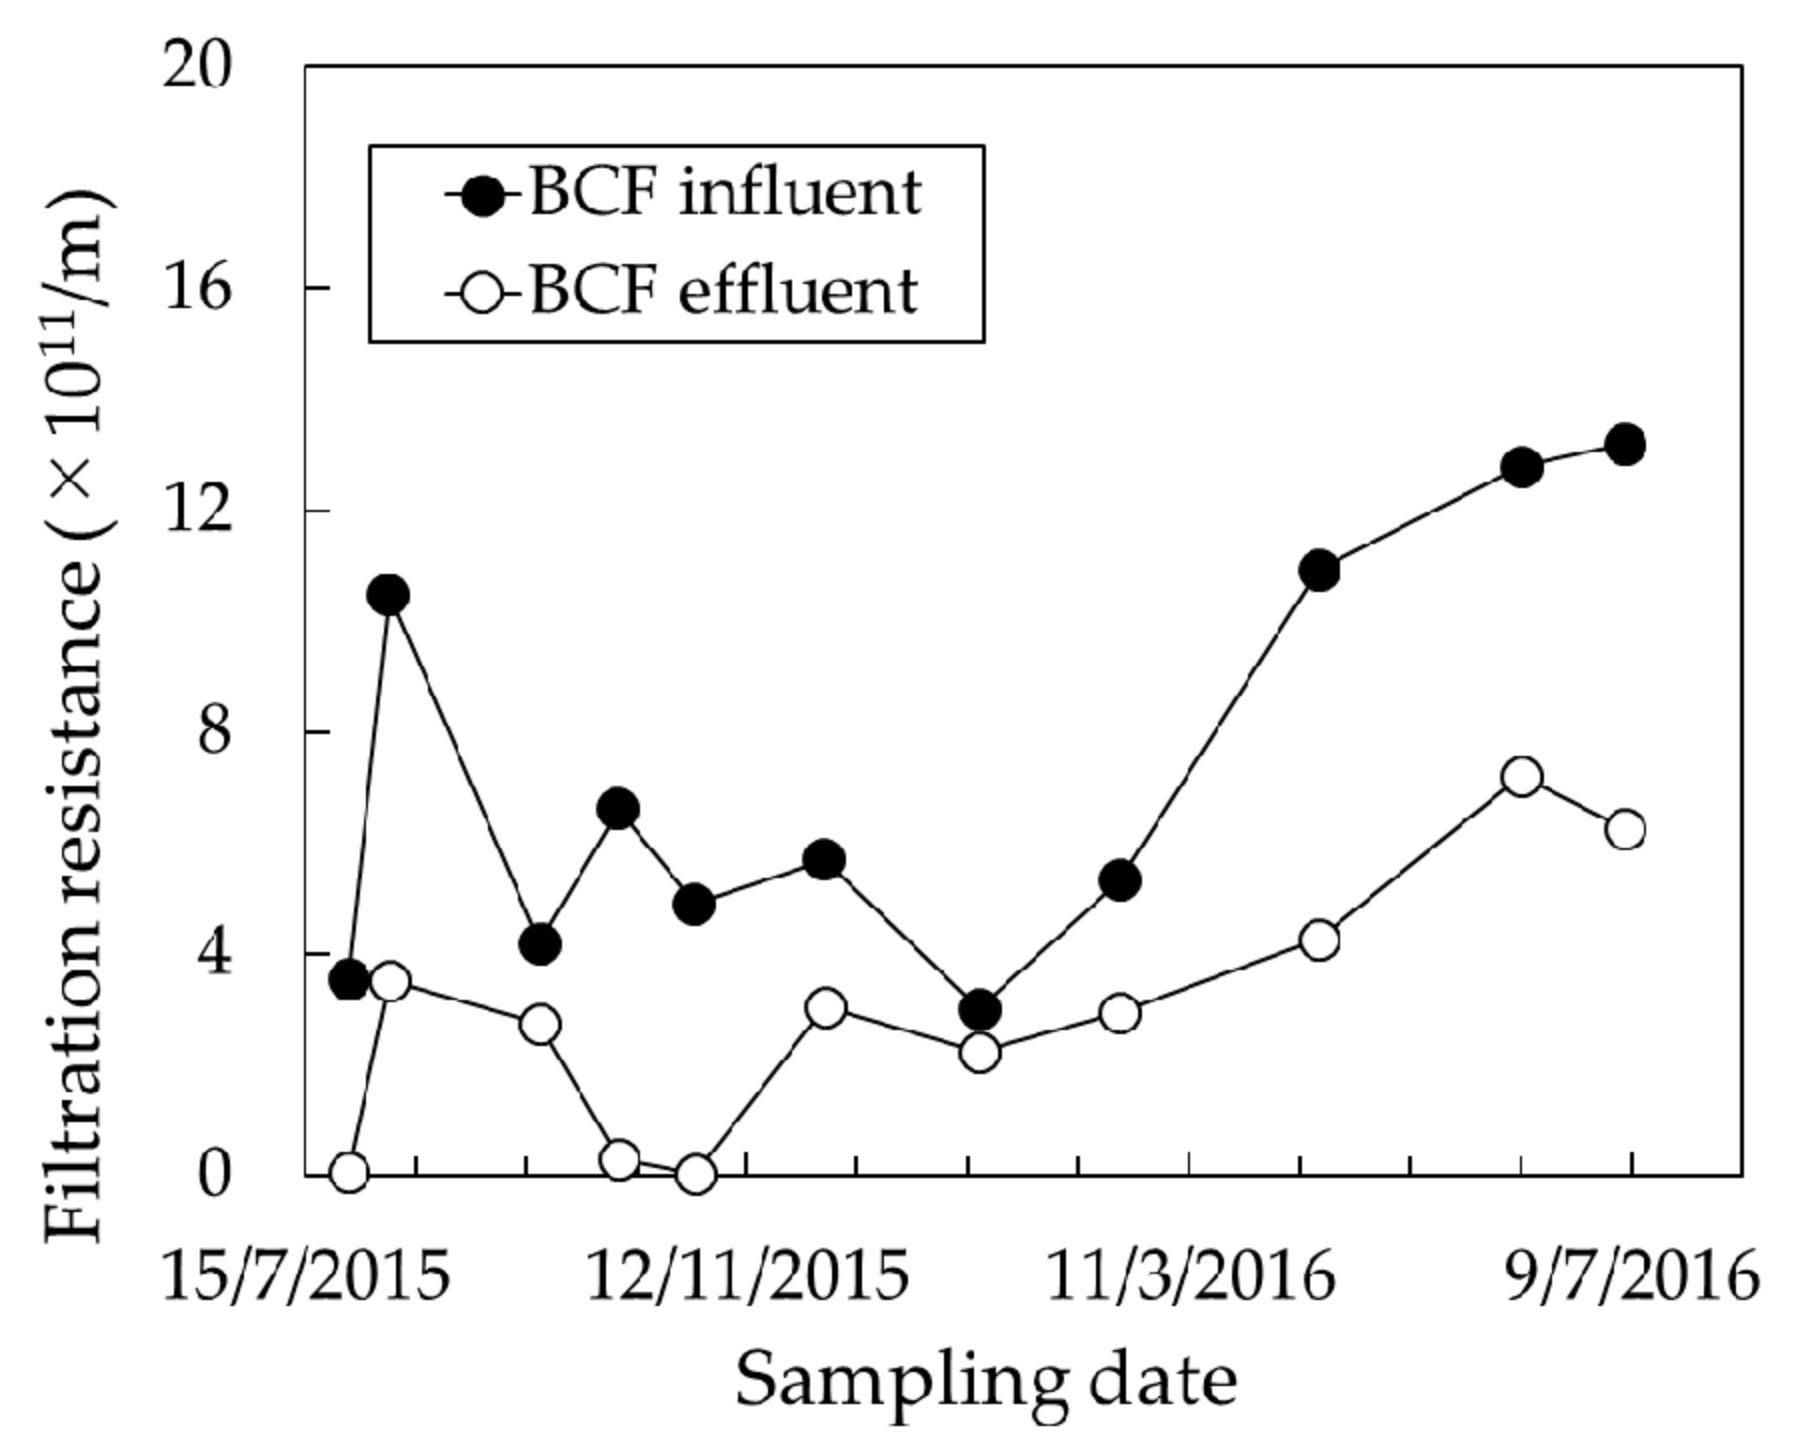
The effect of the BCF treatment on the concentration of humic substances and biopolymers and the filtration resistance was monitored in the Motoyama drinking water treatment plant (Kobe, Japan) to confirm the validity of the laboratory-scale experimental results discussed above. Figure 7 shows the seasonal change of the biopolymer and humic substances in the BCF influent and effluent from this treatment plant, which was operated at the optimum contact time of 15 min. Figure 8 shows the seasonal change of the filtration resistance. Filtration resistance was calculated by Equation (1) using the 20 h filtration data obtained from the mini MF module test under the conditions listed in Table 1. The experimental data were collected over one year from July 2015 to July 2016.
Although previous studies have reported humic substances to be a major foulant [11,12], Figure 7 shows that they were not removed by the BCF throughout the year; in contrast, ~50% of the biopolymer was removed. Thus, it is clear that the decrease of filtration resistance by BCF treatment was due to the decrease of biopolymer concentration. This result indicates that the biopolymer is the primary influence on membrane fouling in the actual drinking water treatment plant with raw river water. This result is consistent with the report of Kimura et al. [13], who showed an excellent correlation between membrane fouling and biopolymer content in five river waters.
On the other hand, it is found from Figure 7a and Figure 8 that the seasonal change of the filtration resistance, especially the filtration resistance for BCF influent, is correlated with the seasonal change of humic substances. Probably, this result indicates that humic substances affect the membrane fouling to a certain degree, even though they are not the main foulant.
In this experiment, the biopolymer was removed up to 50%. However, it will be difficult to increase the removal rate of biopolymer further. Because, the decomposition of biopolymer may be increased by increasing the quantity of microorganisms in BCF column and/or by increasing the contact time. However, at the same time, the increase of quantity of microorganisms and the increase of contact time increase the biopolymer produced by microorganisms.

4. Conclusions

This study examined the effects of a biological contact filter (BCF) as a pretreatment on reducing membrane fouling in a drinking water treatment system employing a microfiltration (MF) membrane. Specifically, the effect of the BCF on the fouling of the MF membrane was first evaluated using mini module test equipment. On the basis of LC-OCD measurements, it was established that the main membrane foulant was a biopolymer. It was then confirmed that BCF pretreatment reduced the biopolymer concentration, resulting in a reduction of membrane fouling. Notably, the BCF treatment could remove the biopolymers even at 5 °C, a typical winter season temperature. The effect of the BCF treatment was also verified in an actual drinking water treatment plant. The biopolymer concentration in the BCF column effluent first decreased with a contact time, but then increased; a contact time of 15 min was found to be optimum in this study. The increase of the biopolymer concentration was attributed to its production by microorganisms. Thus, optimizing the contact time of raw water with BCFs is crucial in drinking water treatment systems.

Author Contributions

Susumu Hasegawa, Takuya Iwamoto, Taro Miyoshi, Sosuke Onoda, and Kazushi Morita conceived and designed the experiments; Susumu Hasegawa, Takuya Iwamoto, and Taro Miyoshi performed the experiments; Susumu Hasegawa, Takuya Iwamoto, Taro Miyoshi, and Ryosuke Takagi analyzed the data; Susumu Hasegawa, Ryosuke Takagi and Hideto Matsuyama contributed to the writing manuscript.

Conflicts of Interest

The authors declare no conflicts of interest.

References

  1. Yang, H.; Li, D.; Zhang, J.; Hao, R.; Li, B. Design of biological filter for iron and manganese removal from water. J. Environ. Sci. Health. 2004, 39, 1447–1454. [Google Scholar] [CrossRef]
  2. Gao, W.; Liang, H.; Ma, J.; Han, M.; Chen, Z.; Han, Z.; Li, G. Membrane fouling control in ultrafiltration technology for drinking water production: A review. Desalination 2011, 272, 1–8. [Google Scholar] [CrossRef]
  3. Bouwer, E.J.; Crowe, P.B. Biological processes in drinking water treatment. J. Am. Water Works Assoc. 1988, 80, 82–93. [Google Scholar]
  4. Katsoyiannis, I.A.; Zouboulis, A.I. Biological treatment of Mn (II) and Fe (II) containing groundwater: Kinetic consideration and product characterization. Water Res. 2004, 38, 1922–1932. [Google Scholar] [CrossRef] [PubMed]
  5. Tian, J.; Ernst, M.; Cui, F.; Fekel, M. Correlations of relevant membrane foulants with UF membrane fouling in different waters. Water Res. 2013, 47, 1218–1228. [Google Scholar] [CrossRef] [PubMed]
  6. Haberkamp, J.; Ernst, M.; Bockelmann, U.; Szewzyk, U.; Jekel, M. Complexity of ultrafiltration membrane fouling caused by macromolecular dissolved organic compounds in secondary effluents. Water Res. 2008, 42, 3153–3161. [Google Scholar] [CrossRef] [PubMed]
  7. Miyoshi, T.; Aizawa, T.; Kimura, K.; Watanabe, Y. Identification of proteins involved in membrane fouling in membrane bioreactors (MBRs) treating municipal wastewater. Int. Biodeterior. Biodegrad. 2012, 75, 15–22. [Google Scholar] [CrossRef]
  8. Chen, W.; Westerhoff, P.; Leenheer, J.A.; Booksh, K. Fluorescence excitation-emission matrix regional integration to quantify spectra for dissolved organic matter. Environ. Sci. Technol. 2003, 37, 5701–5710. [Google Scholar] [CrossRef] [PubMed]
  9. Halle, C.; Huck, P.M.; Peldszus, S.; Haberkamp, J.; Jekel, M. Assessing the performance of biological filtration as pretreatment to low pressure membranes for drinking water. Environ. Sci. Technol. 2009, 43, 3878–3884. [Google Scholar] [PubMed]
  10. Peldszus, S.; Halle, C.; Peiris, R.H.; Hamouda, M.; Jin, X.; Legge, R.L.; Budman, H.; Moresoli, C.; Huck, P.M. Reversible and irreversible low-pressure membrane foulants in drinking water treatment: Identification by principal component analysis of fluorescence EEM and mitigation by biofiltration pretreatment. Water Res. 2011, 45, 5161–5170. [Google Scholar] [CrossRef] [PubMed]
  11. Fan, L.; Harris, J.L.; Roddick, F.A.; Booker, N.A. Influence of the characteristics of natural organic matter on the fouling of microfiltration membranes. Water Res. 2001, 35, 4455–4463. [Google Scholar] [CrossRef]
  12. Peiris, R.H.; Jaklewicz, M.; Budman, H.; Legge, R.L.; Moresoli, C. Assessing the role of feed water constituents in irreversible membrane fouling of pilot-scale ultrafiltration drinking water treatment systems. Water Res. 2011, 47, 3364–3374. [Google Scholar] [CrossRef] [PubMed]
  13. Kimura, K.; Tanaka, K.; Watanabe, Y. Microfiltration of different surface waters with/without coagulation: Clear correlations between membrane fouling and hydrophilic biopolymers. Water Res. 2014, 49, 434–443. [Google Scholar] [CrossRef] [PubMed]
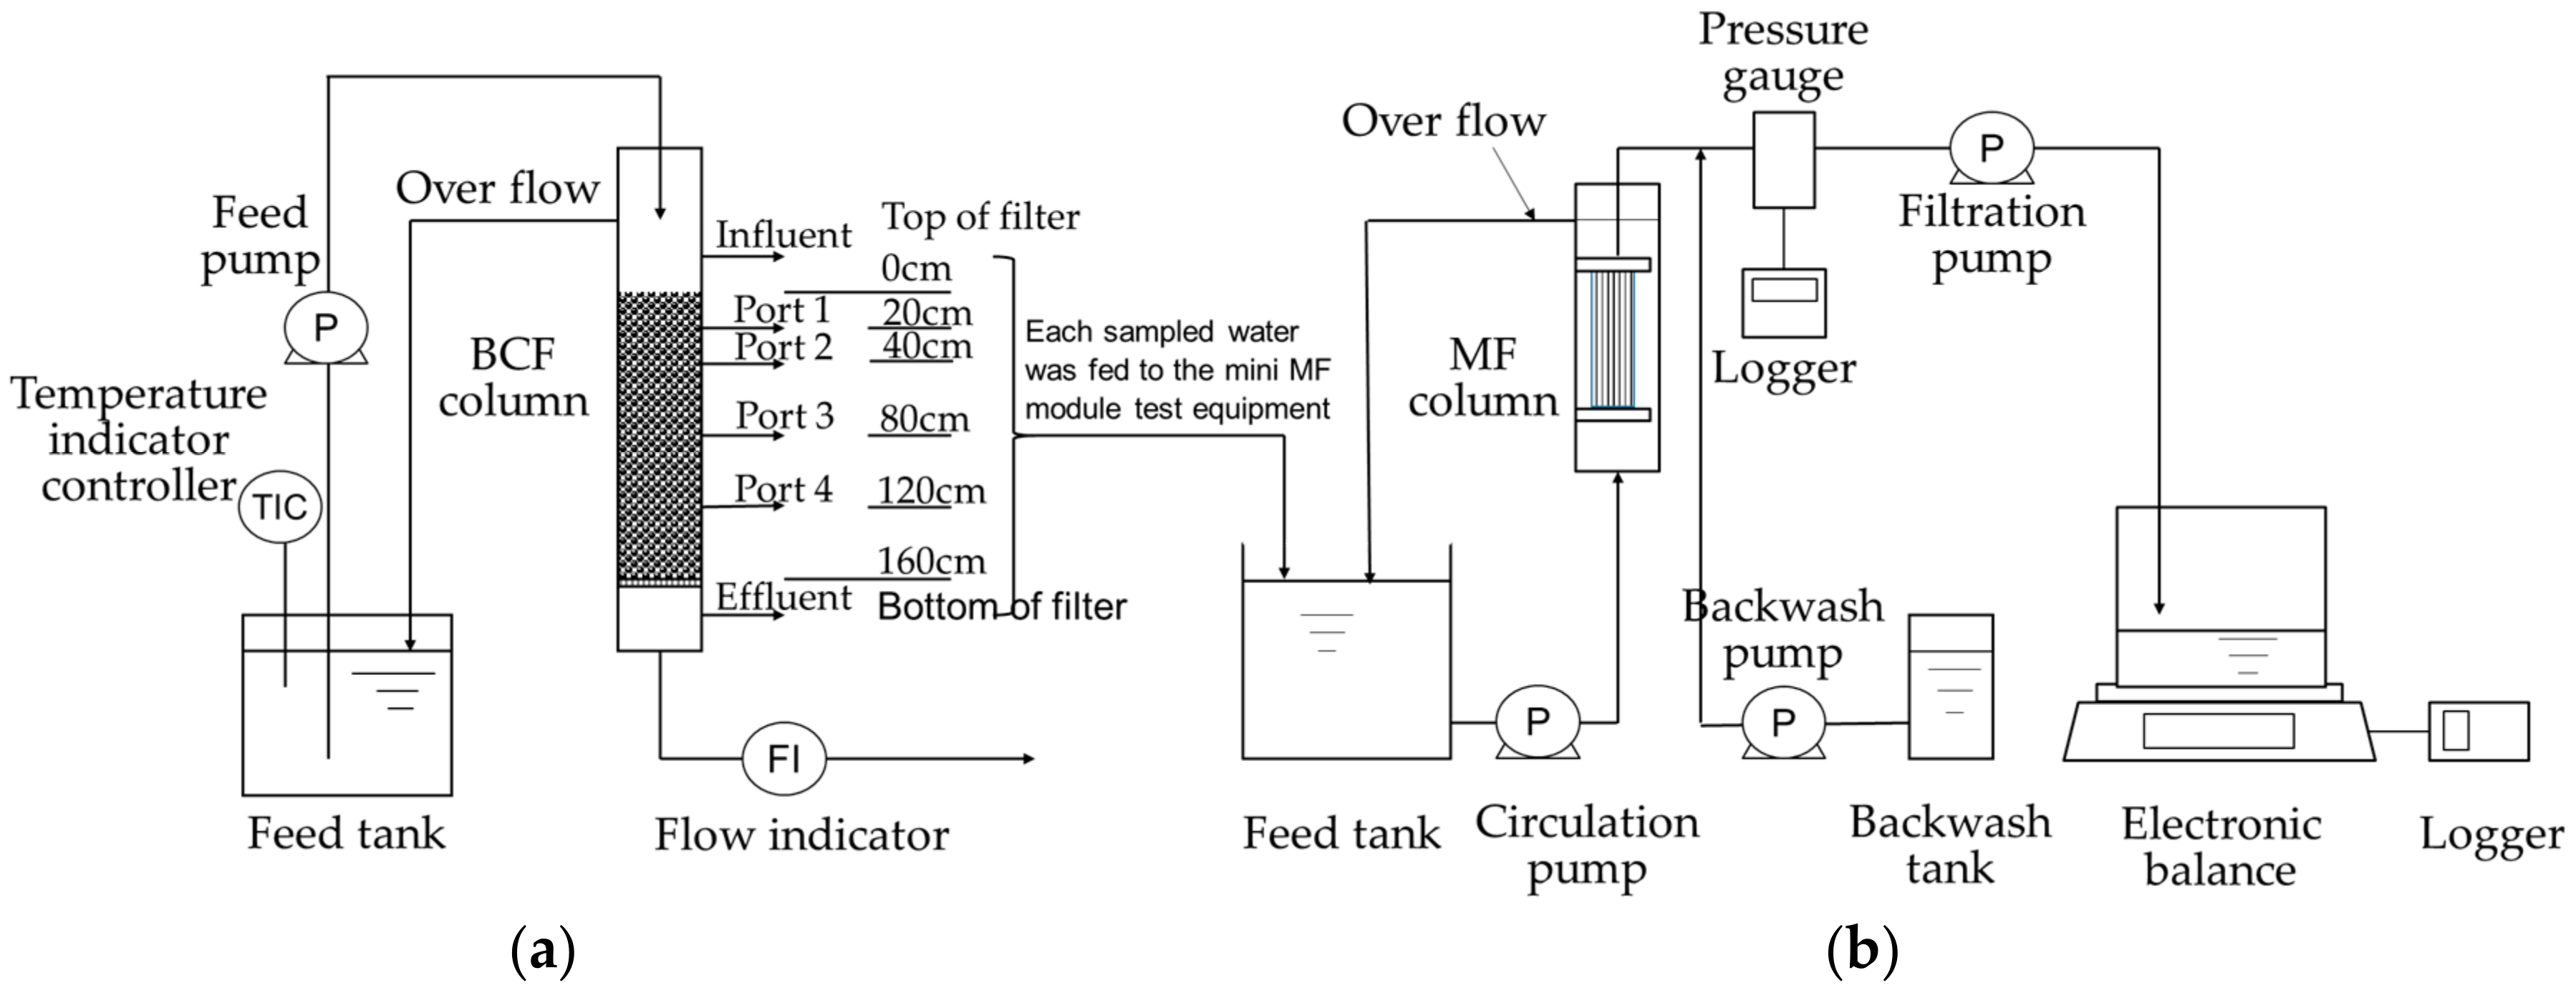
Figure 1. Schematic drawing of the test equipment employed in this study. (a) Mini biological contact filter (BCF) column; (b) Mini Microfiltration (MF) module.
Water 09 00981 g001
Figure 2. Excitation and emission matrix of (a) biological contact filter (BCF) influent and (b) fouling material extracted with NaOH. I: Aromatic Protein I; II: Aromatic Protein II; III: Fulvic acid-like; IV: Soluble microbial by-products; V: Humic acid-like.
Water 09 00981 g002
Figure 3. Chromatograph of (a) BCF influent and (b) fouling material measured by liquid chromatograph-organic carbon detector (LC-OCD). Ⓐ Biopolymer; Ⓑ Humic substances; Ⓒ Building blocks; and Ⓓ Acids.
Water 09 00981 g003
Figure 4. Effect of contact time and operating temperature on the removal of (a) humic substances and (b) biopolymer by the BCF.
Water 09 00981 g004
Figure 5. Effect of BCF pretreatment on membrane fouling.
Water 09 00981 g005
Figure 6. Effect of temperature on biopolymer (BP) removal rate in BCF.
Water 09 00981 g006
Figure 7. Seasonal change of (a) humic substances and (b) biopolymer in the influent (closed circles) and effluent (open circles) of BCF.
Water 09 00981 g007
Figure 8. Seasonal change of the filtration resistance of the BCF influent (closed circles) and effluent (open circles).
Water 09 00981 g008
Table 1. Specification of the MF mini module and operating conditions.
Specifications of Membrane
Materialpolyvinylidene fluoride (PVDF)
Pore size0.08 μm
Effective area15 cm2
Operating Conditions
Filtration flux1.5 m3/(m2·day)
Backwash flux2.25 m3/(m2·day)
Backwash waterpermeate water with 5 ppm NaClO
Backwash repetition1 min every 30 min
Wiping with spongeonce/week and at test end