
Restoration of Eutrophic Lakes with Fluctuating Water Levels: A 20-Year Monitoring Study of Two Inter-Connected Lakes

 , and
, and 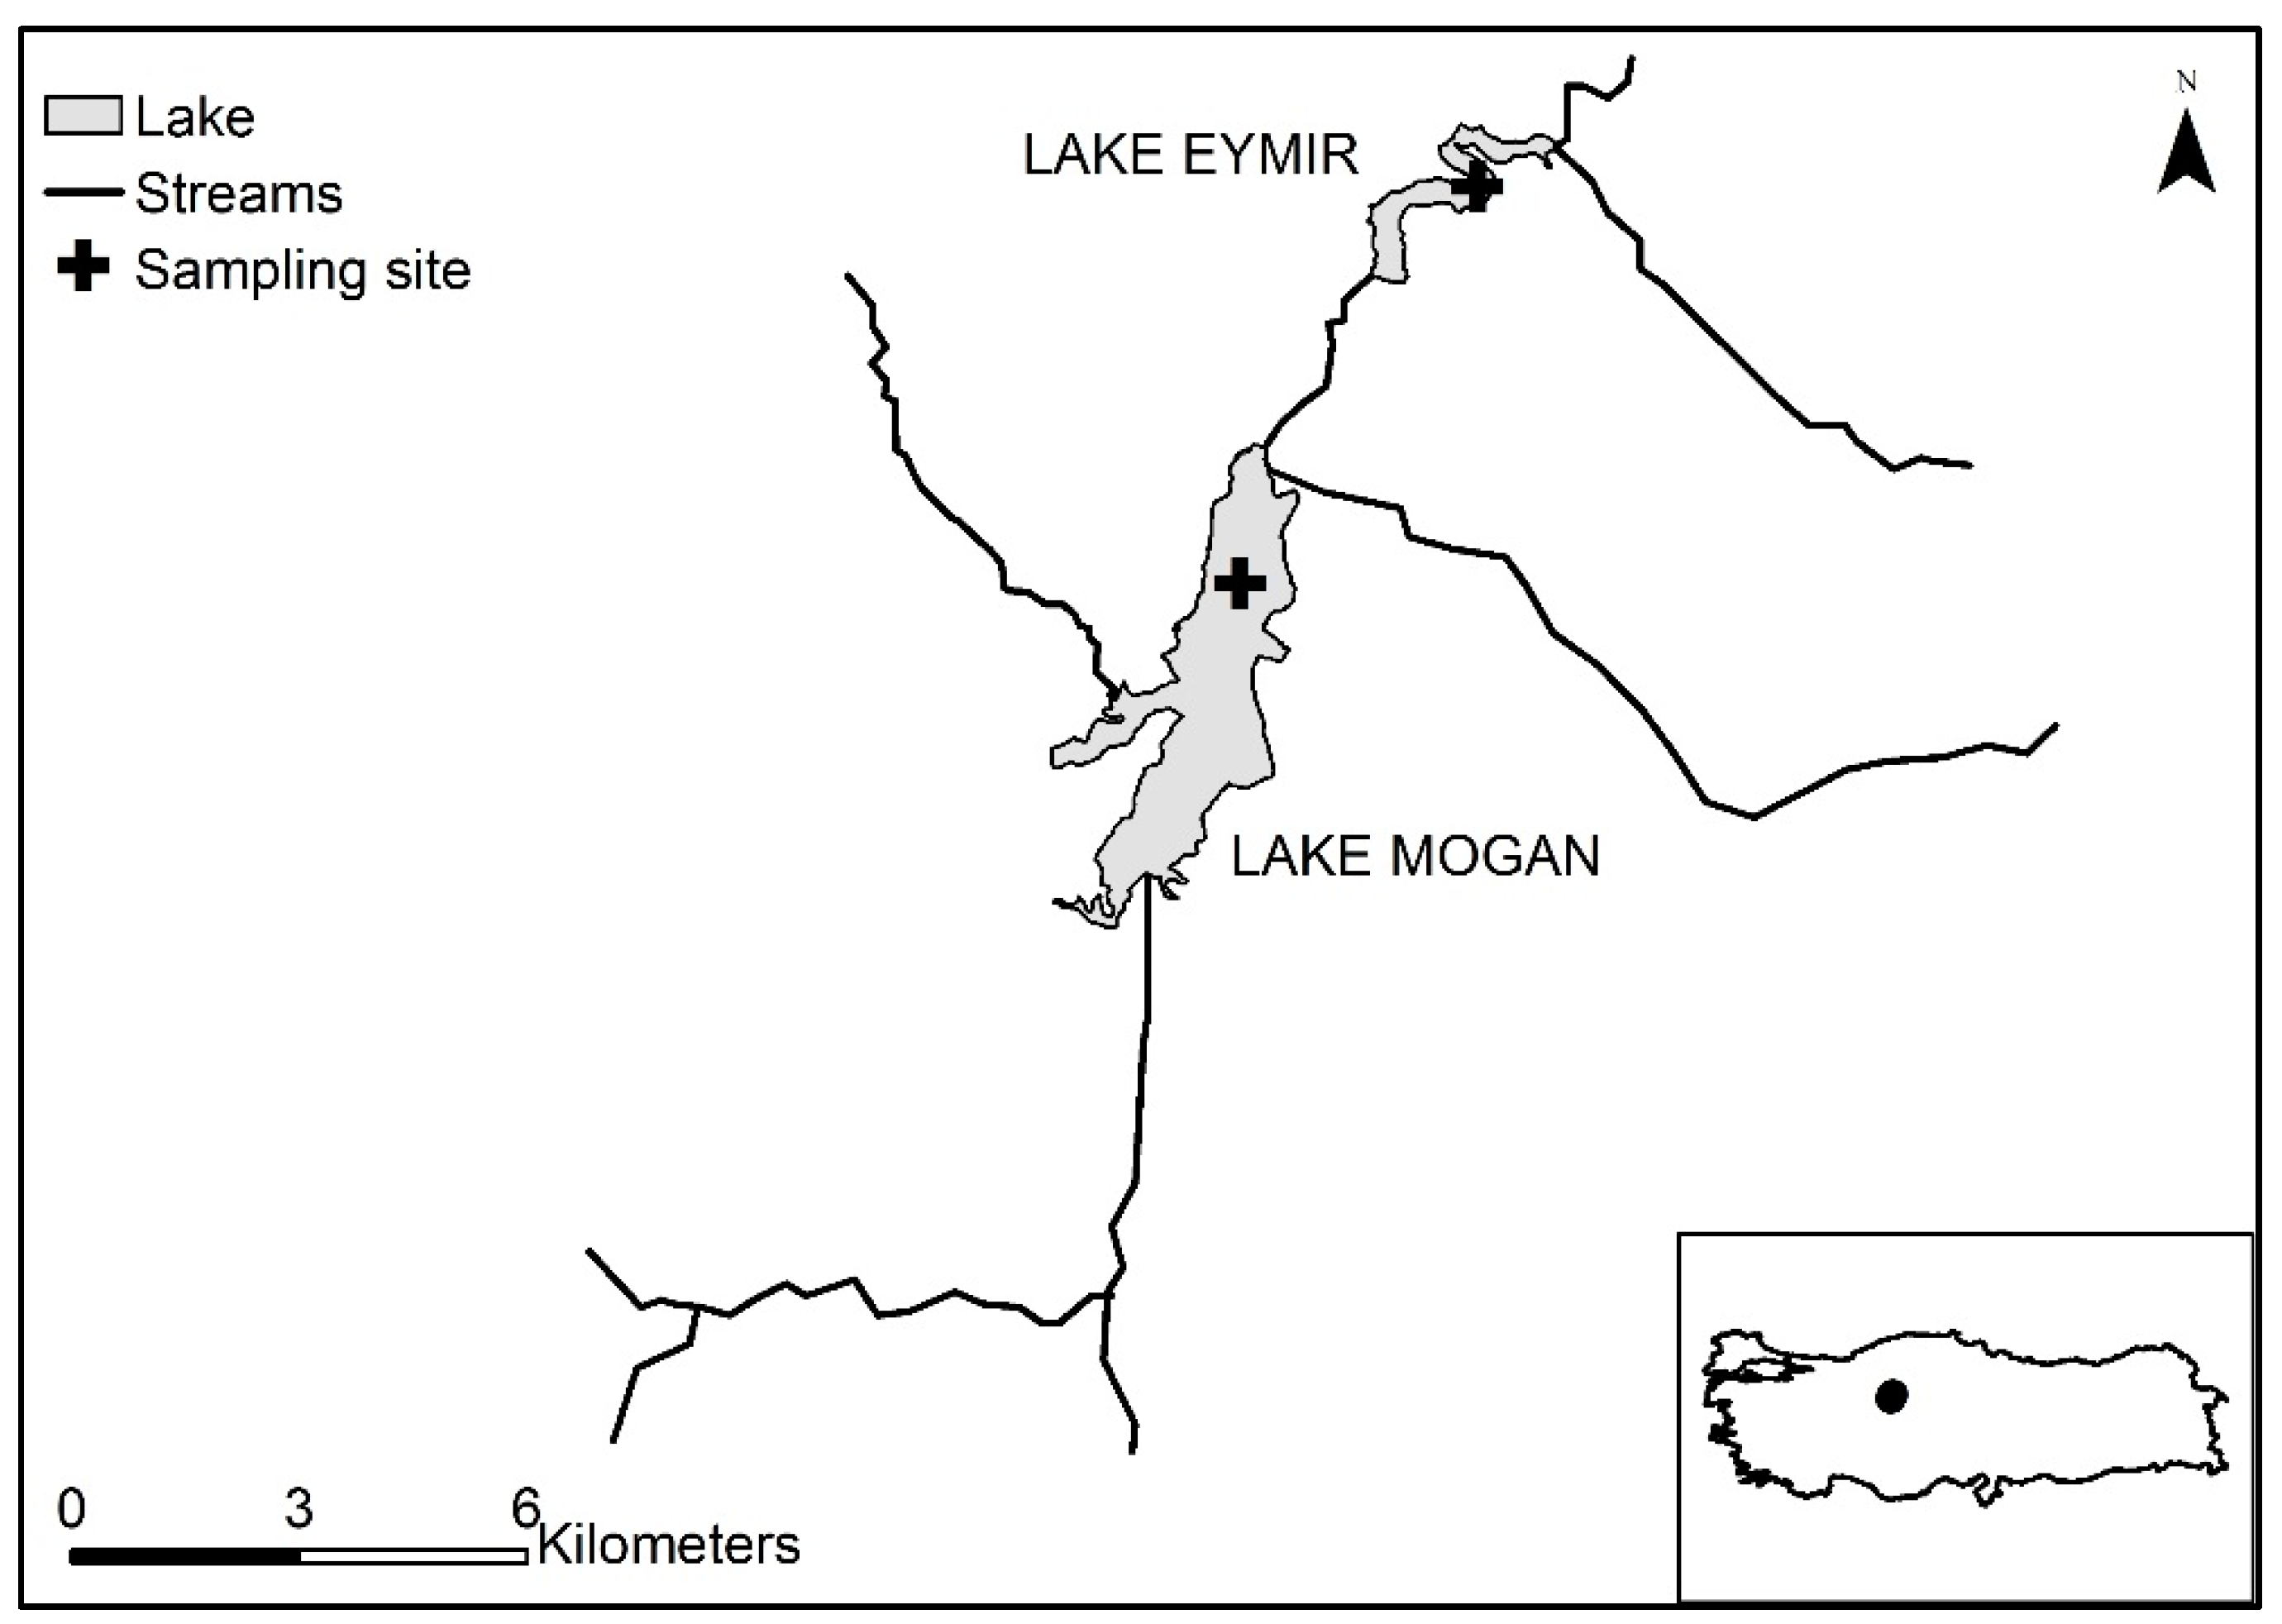
Abstract
:1. Introduction
2. Materials and Methods
2.1. Study Sites
2.2. Fish Samplings and Biomanipulation
2.3. Water Sampling
2.4. Macrophyte Sampling
2.5. Laboratory Analyses
2.6. Statistical Analysis
3. Results
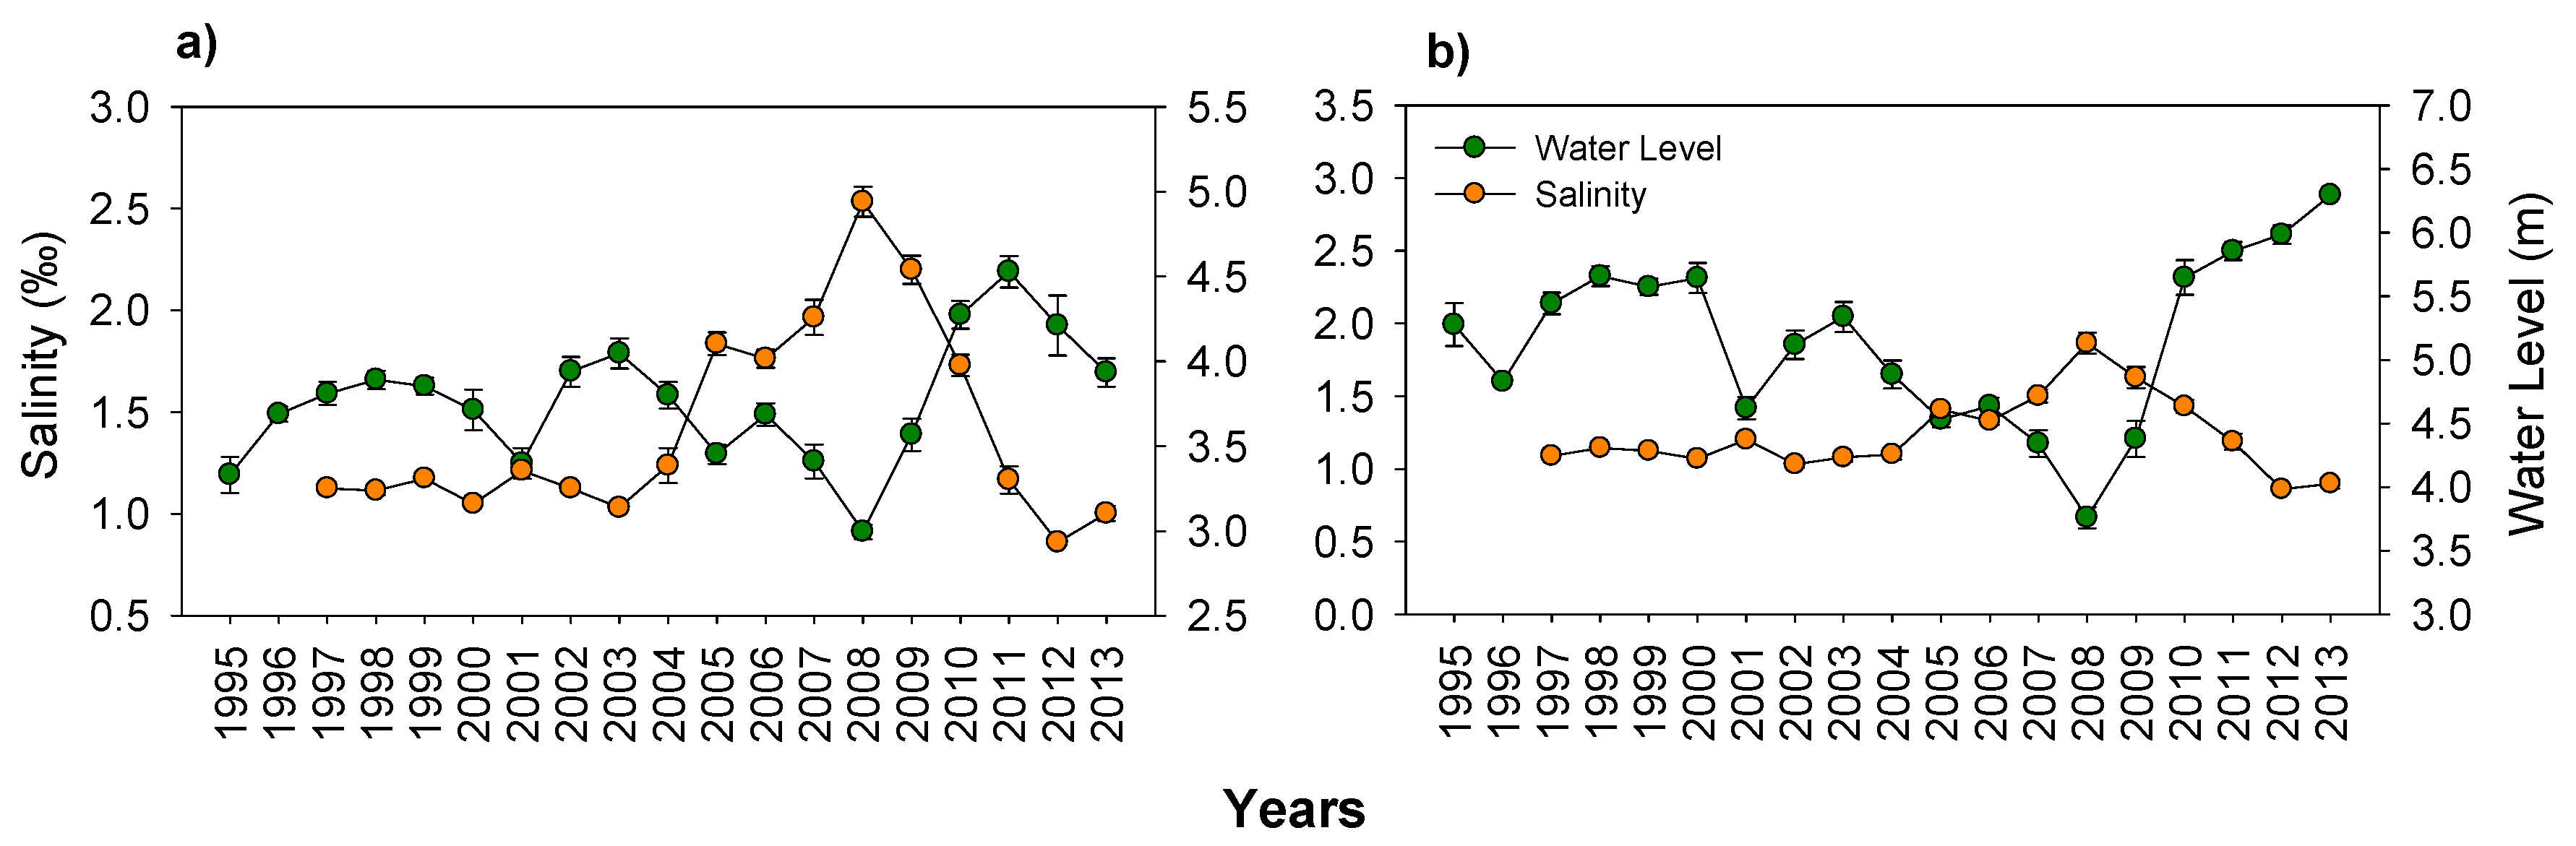
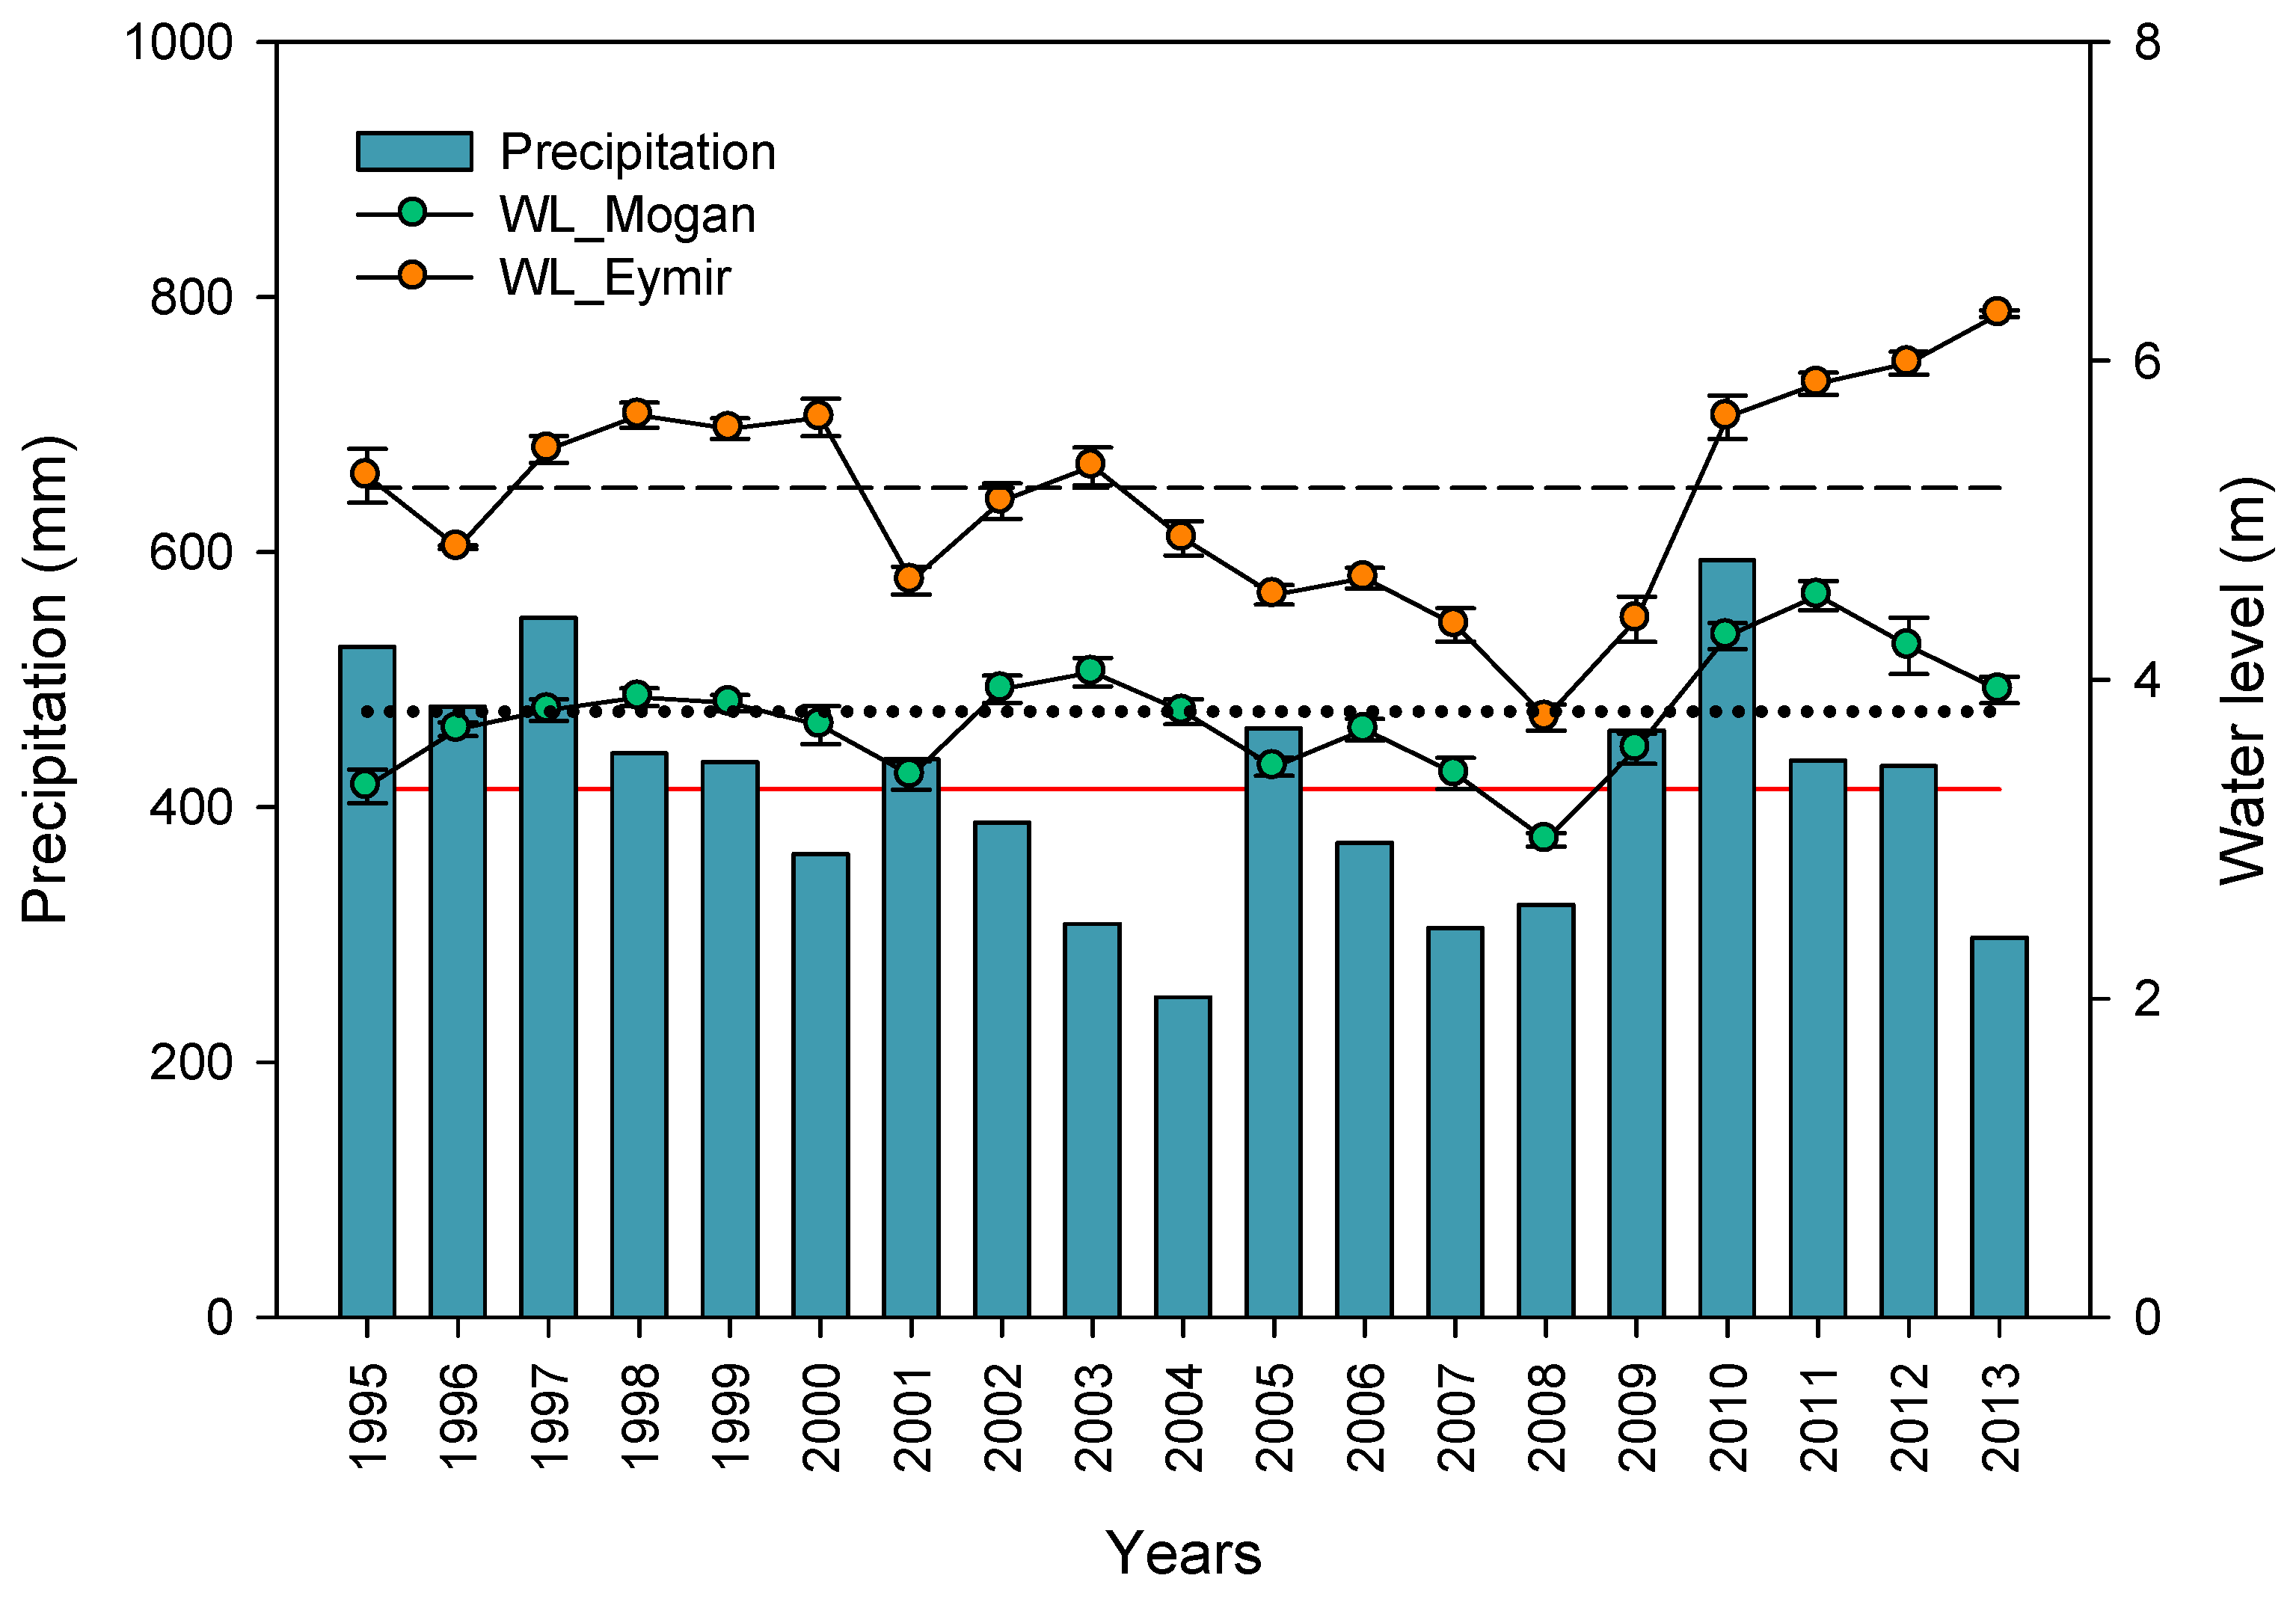
3.1. Hydrology and Salinity
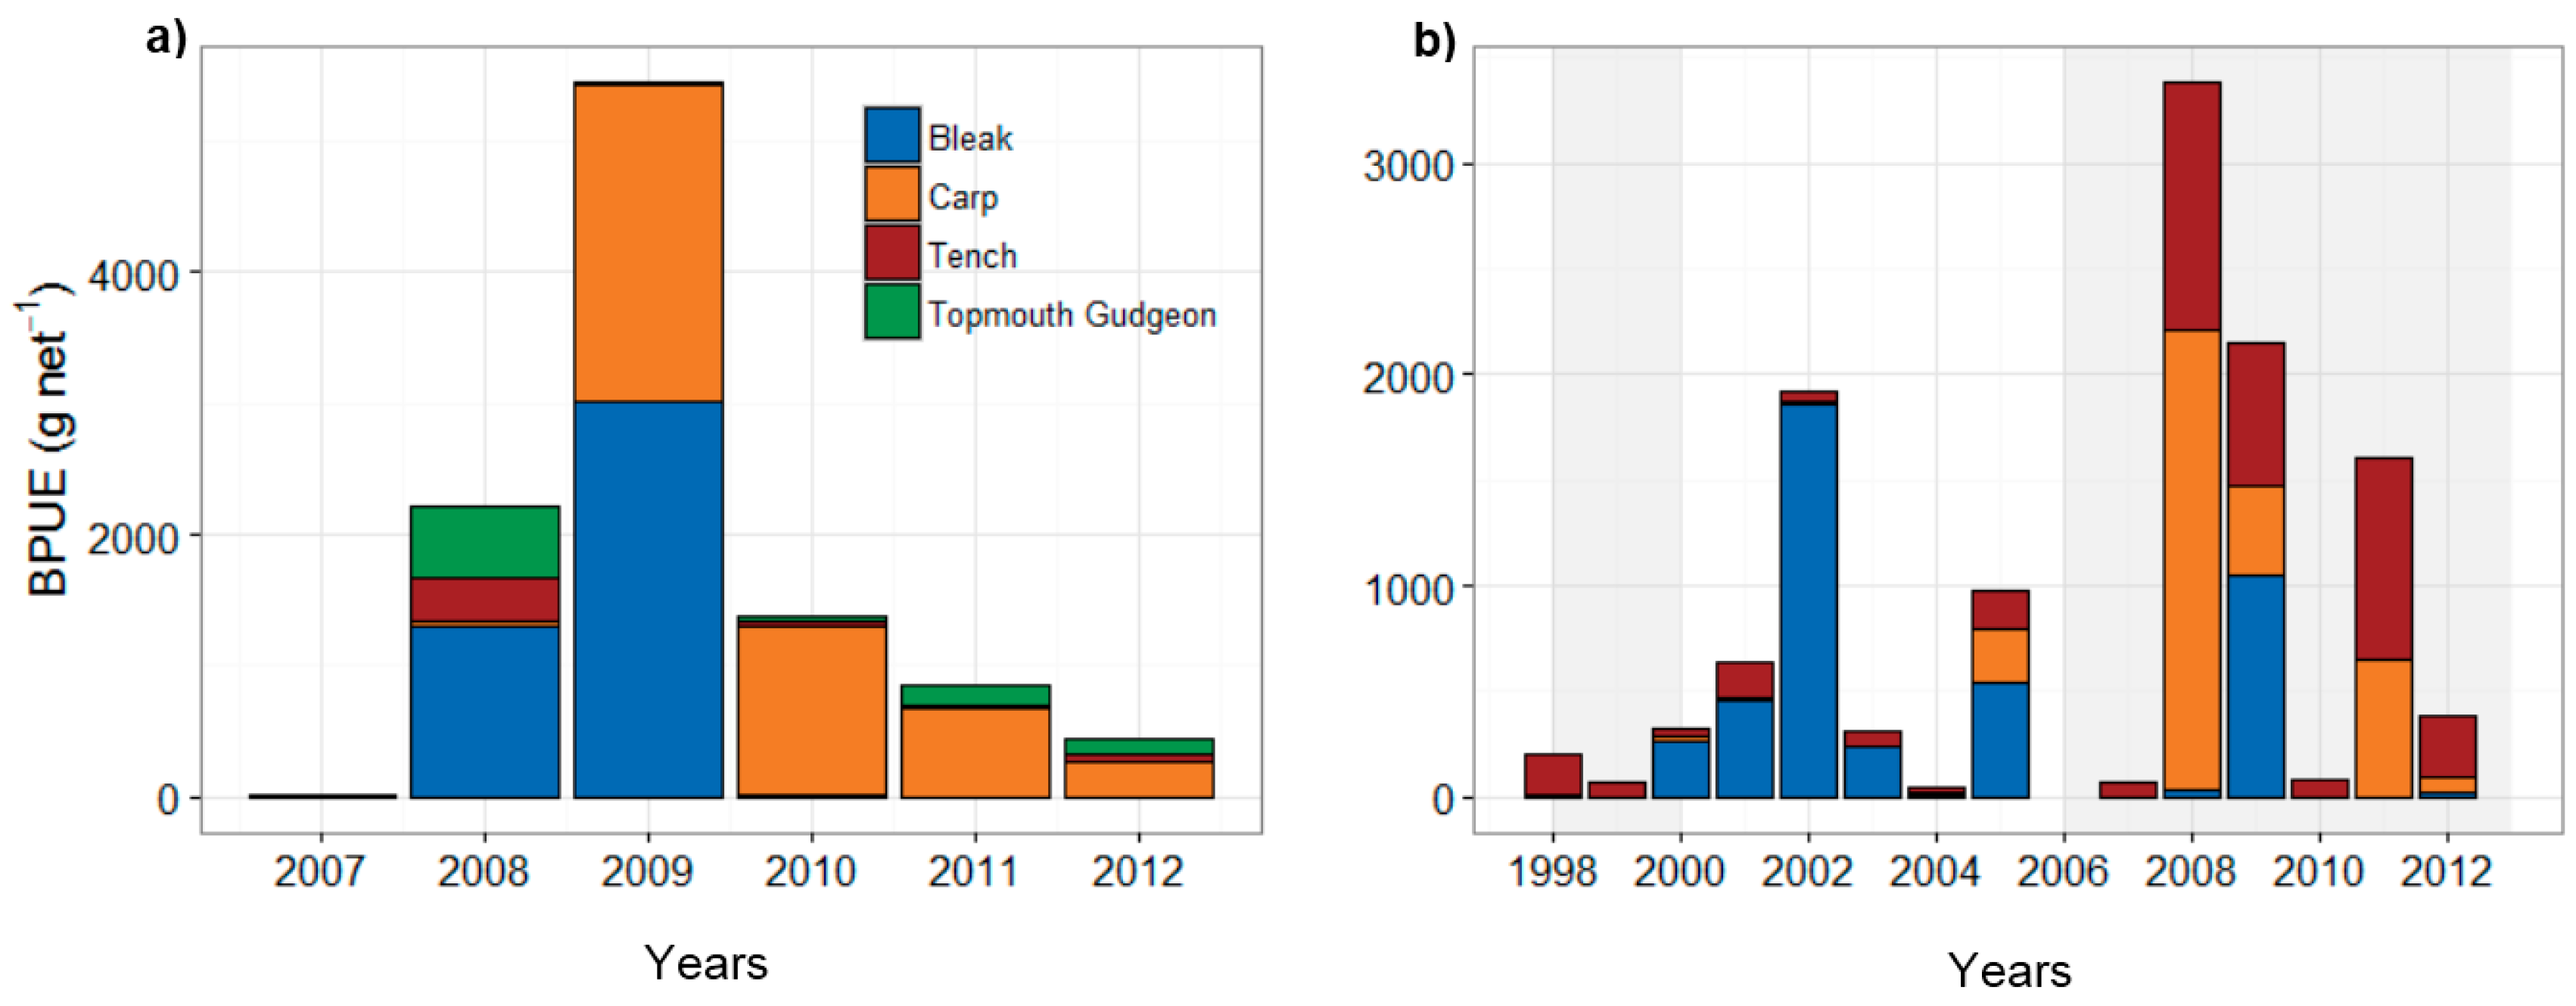
3.2. Fish Community and Biomanipulation
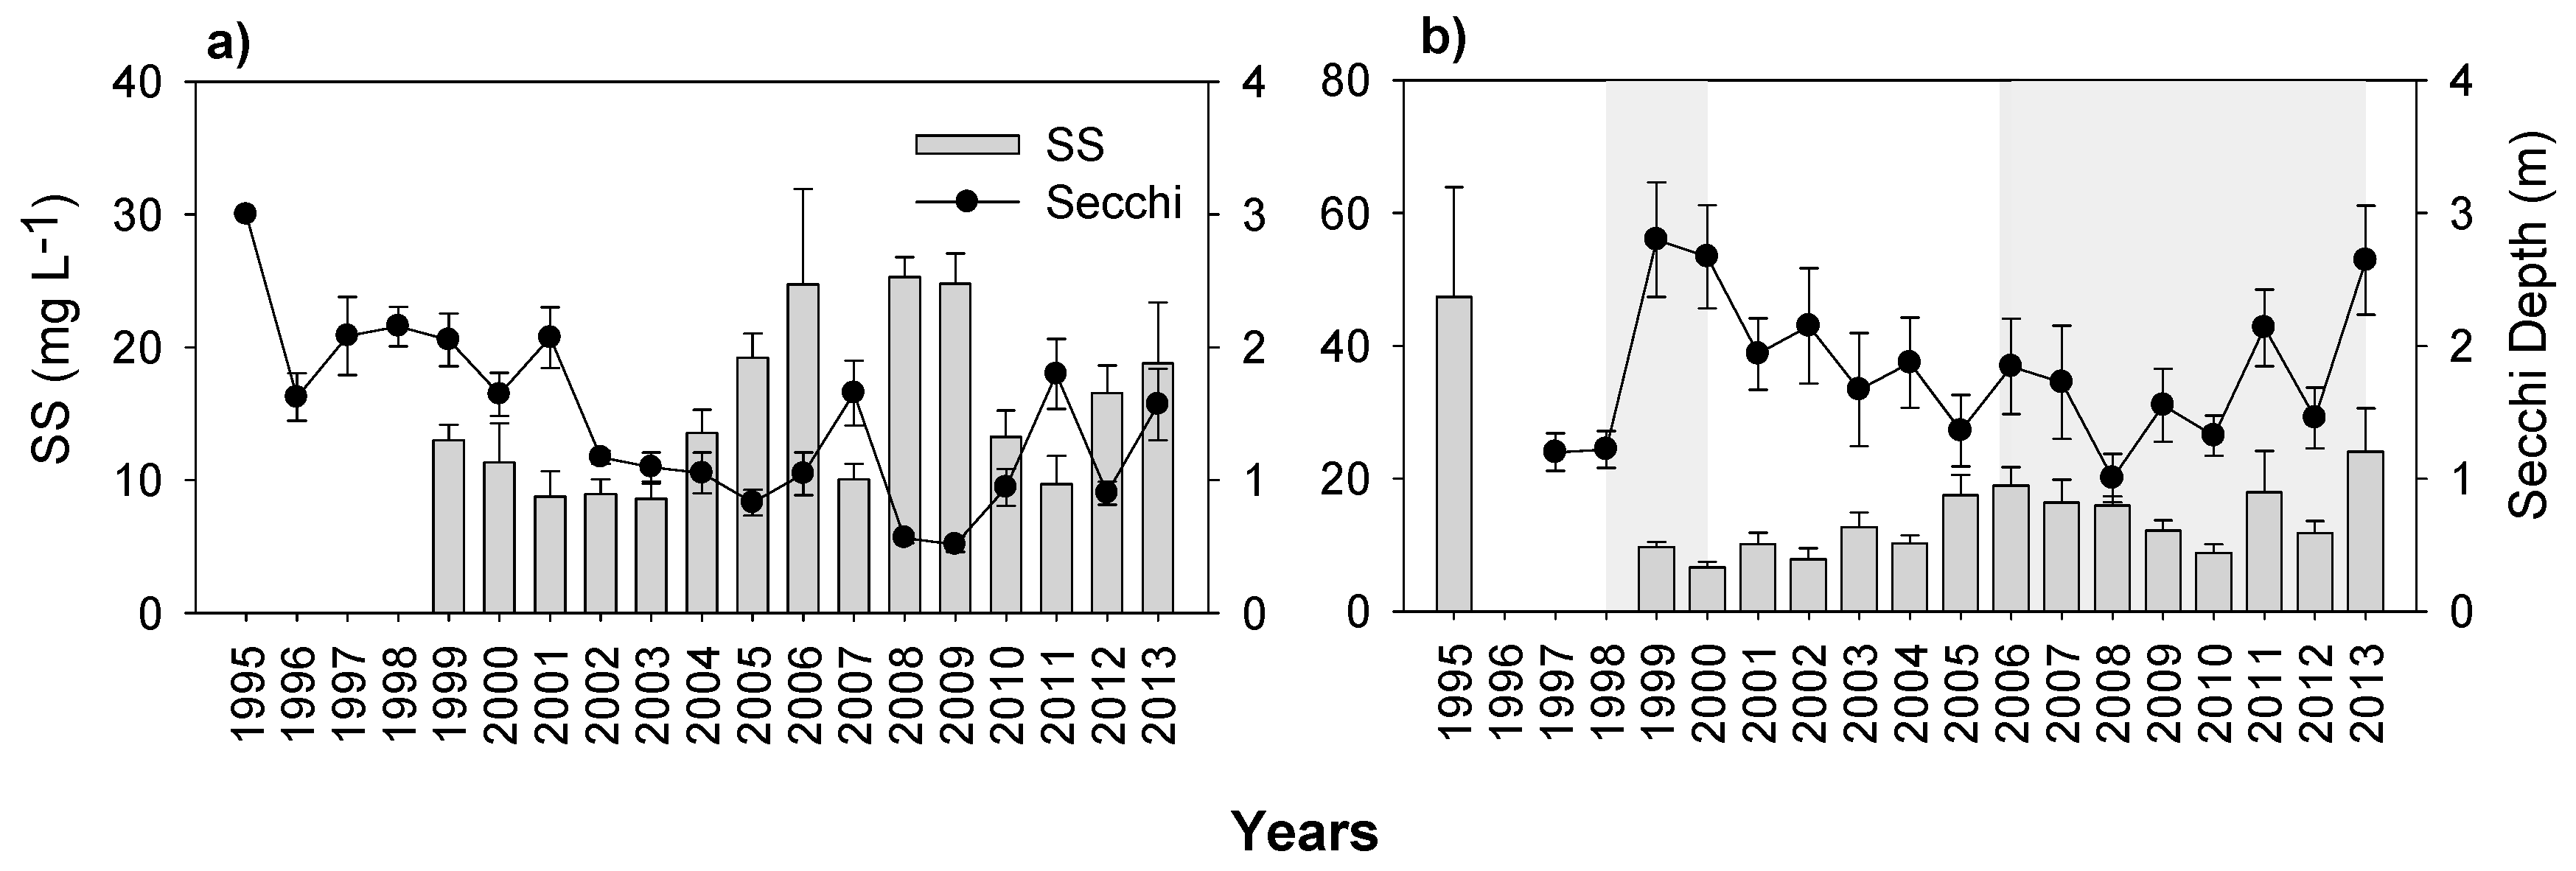
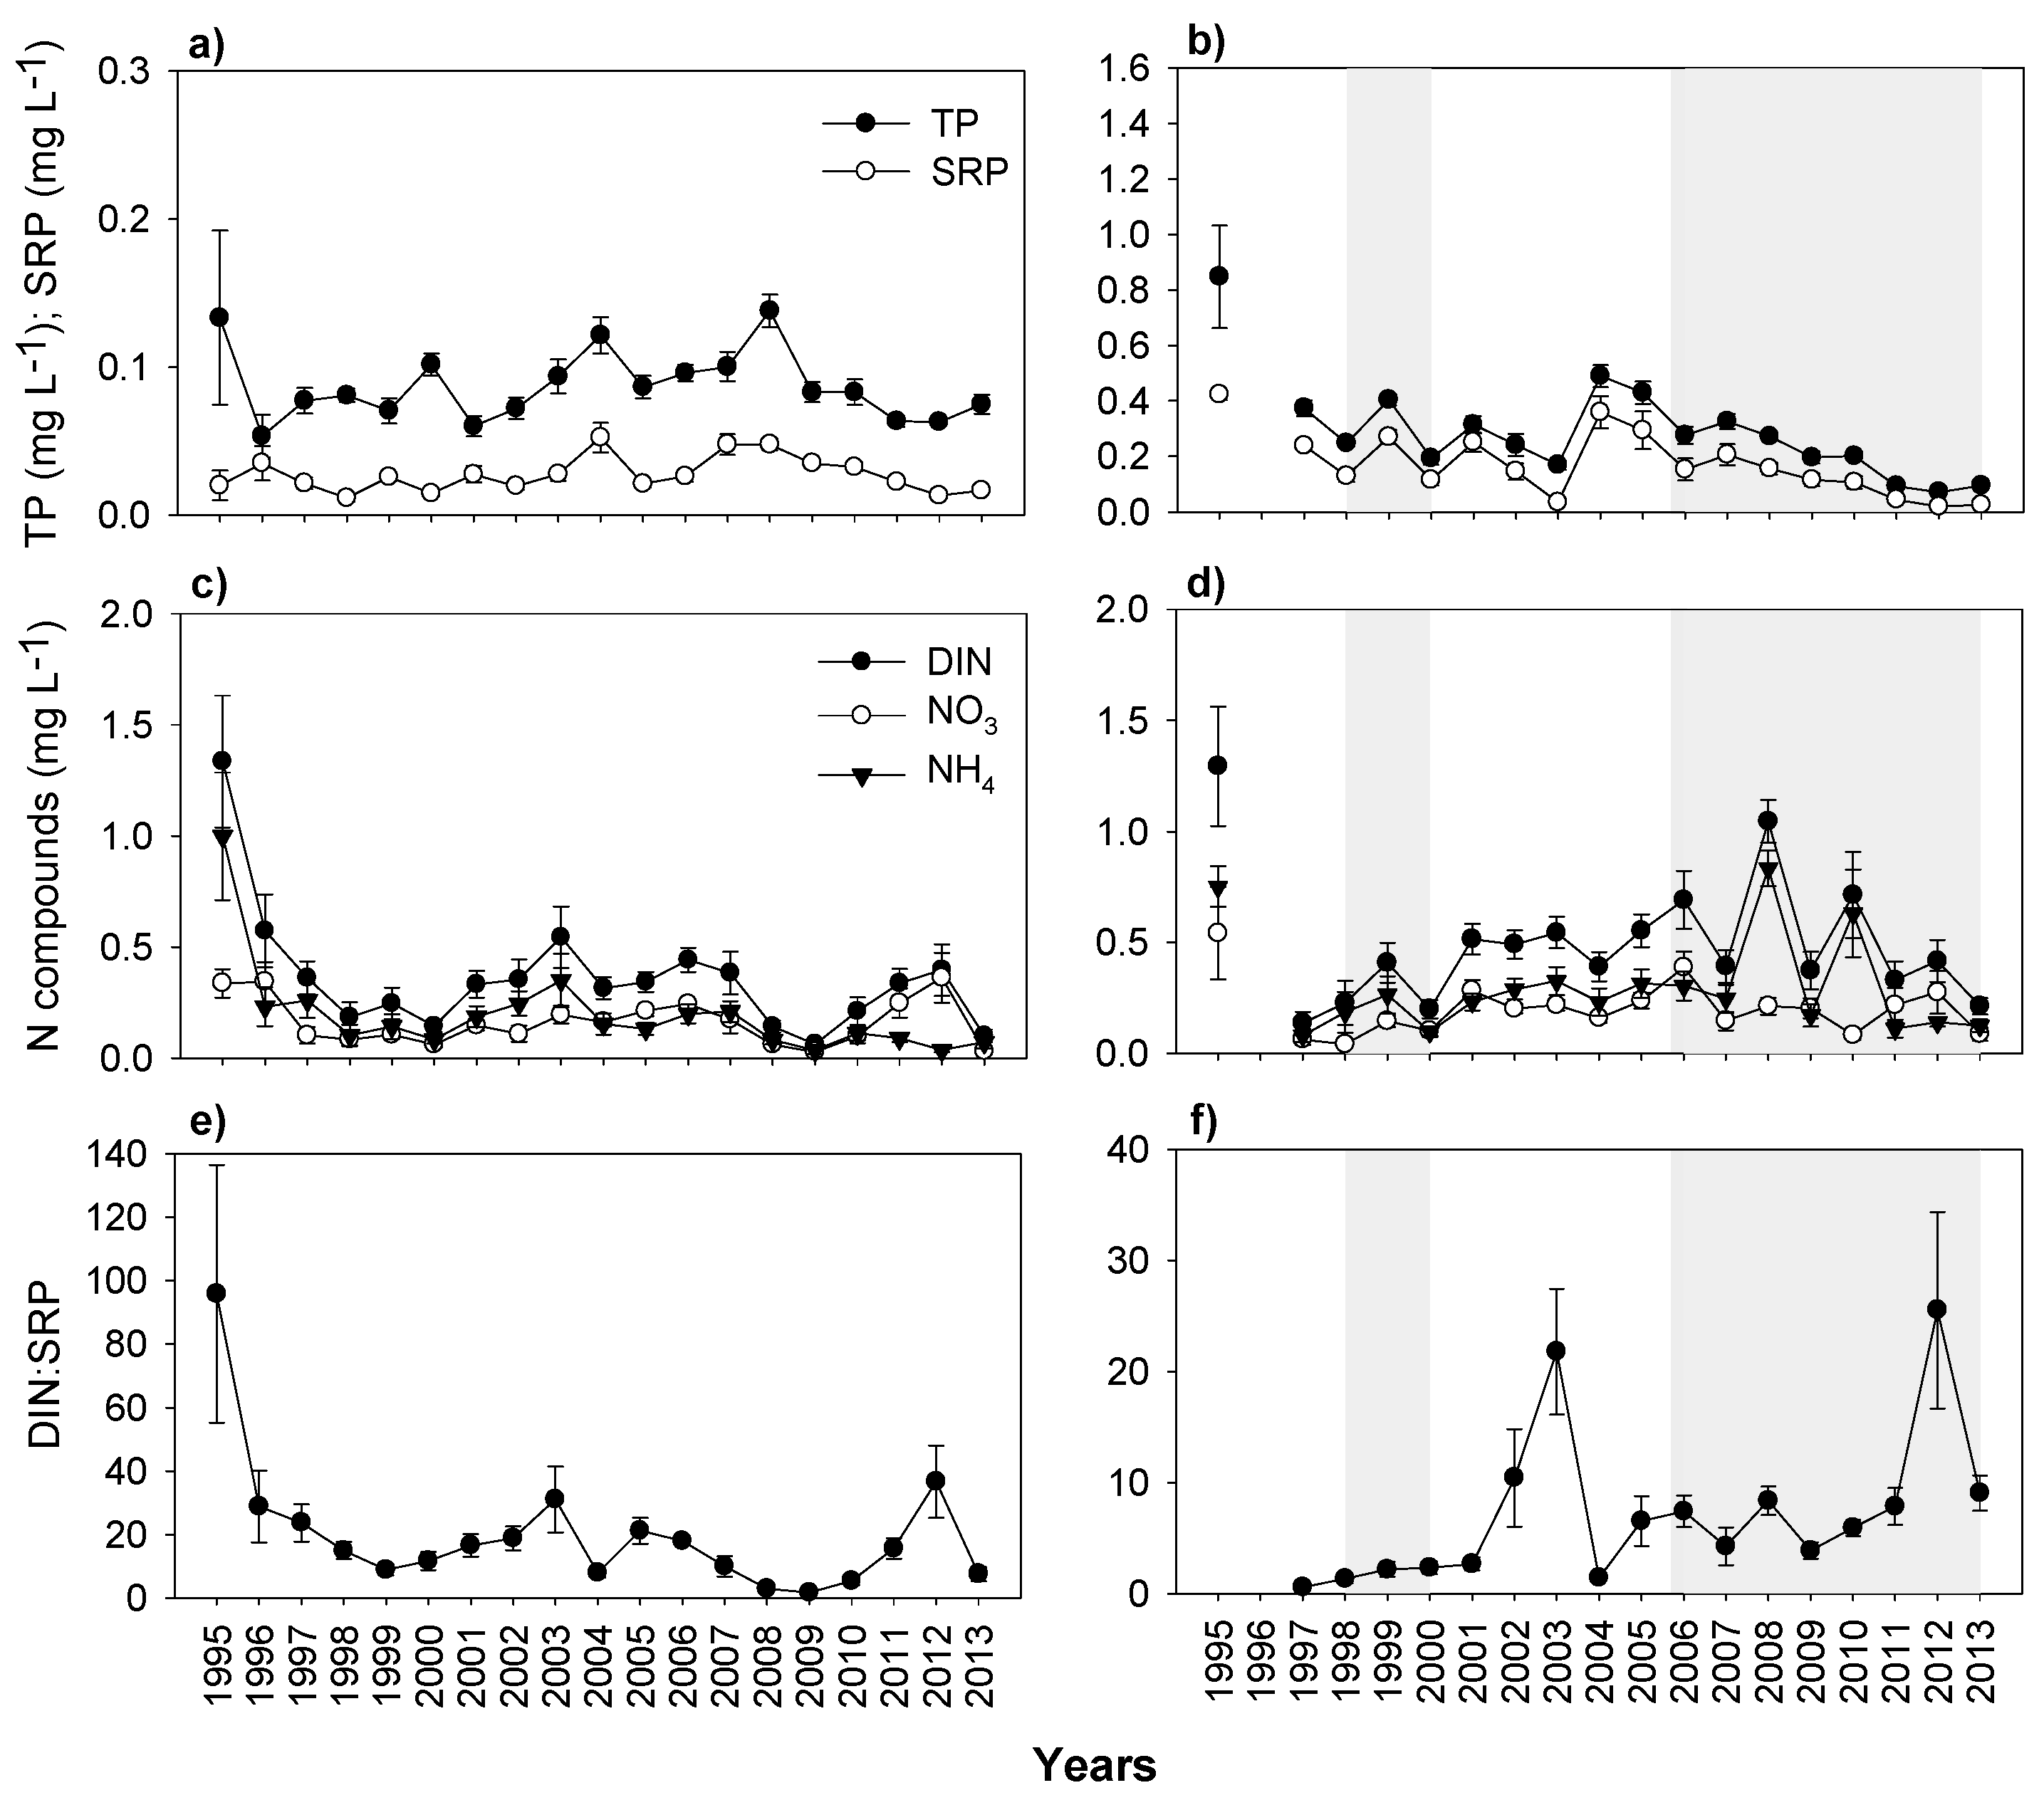
3.3. Nutrients and Water Transparency
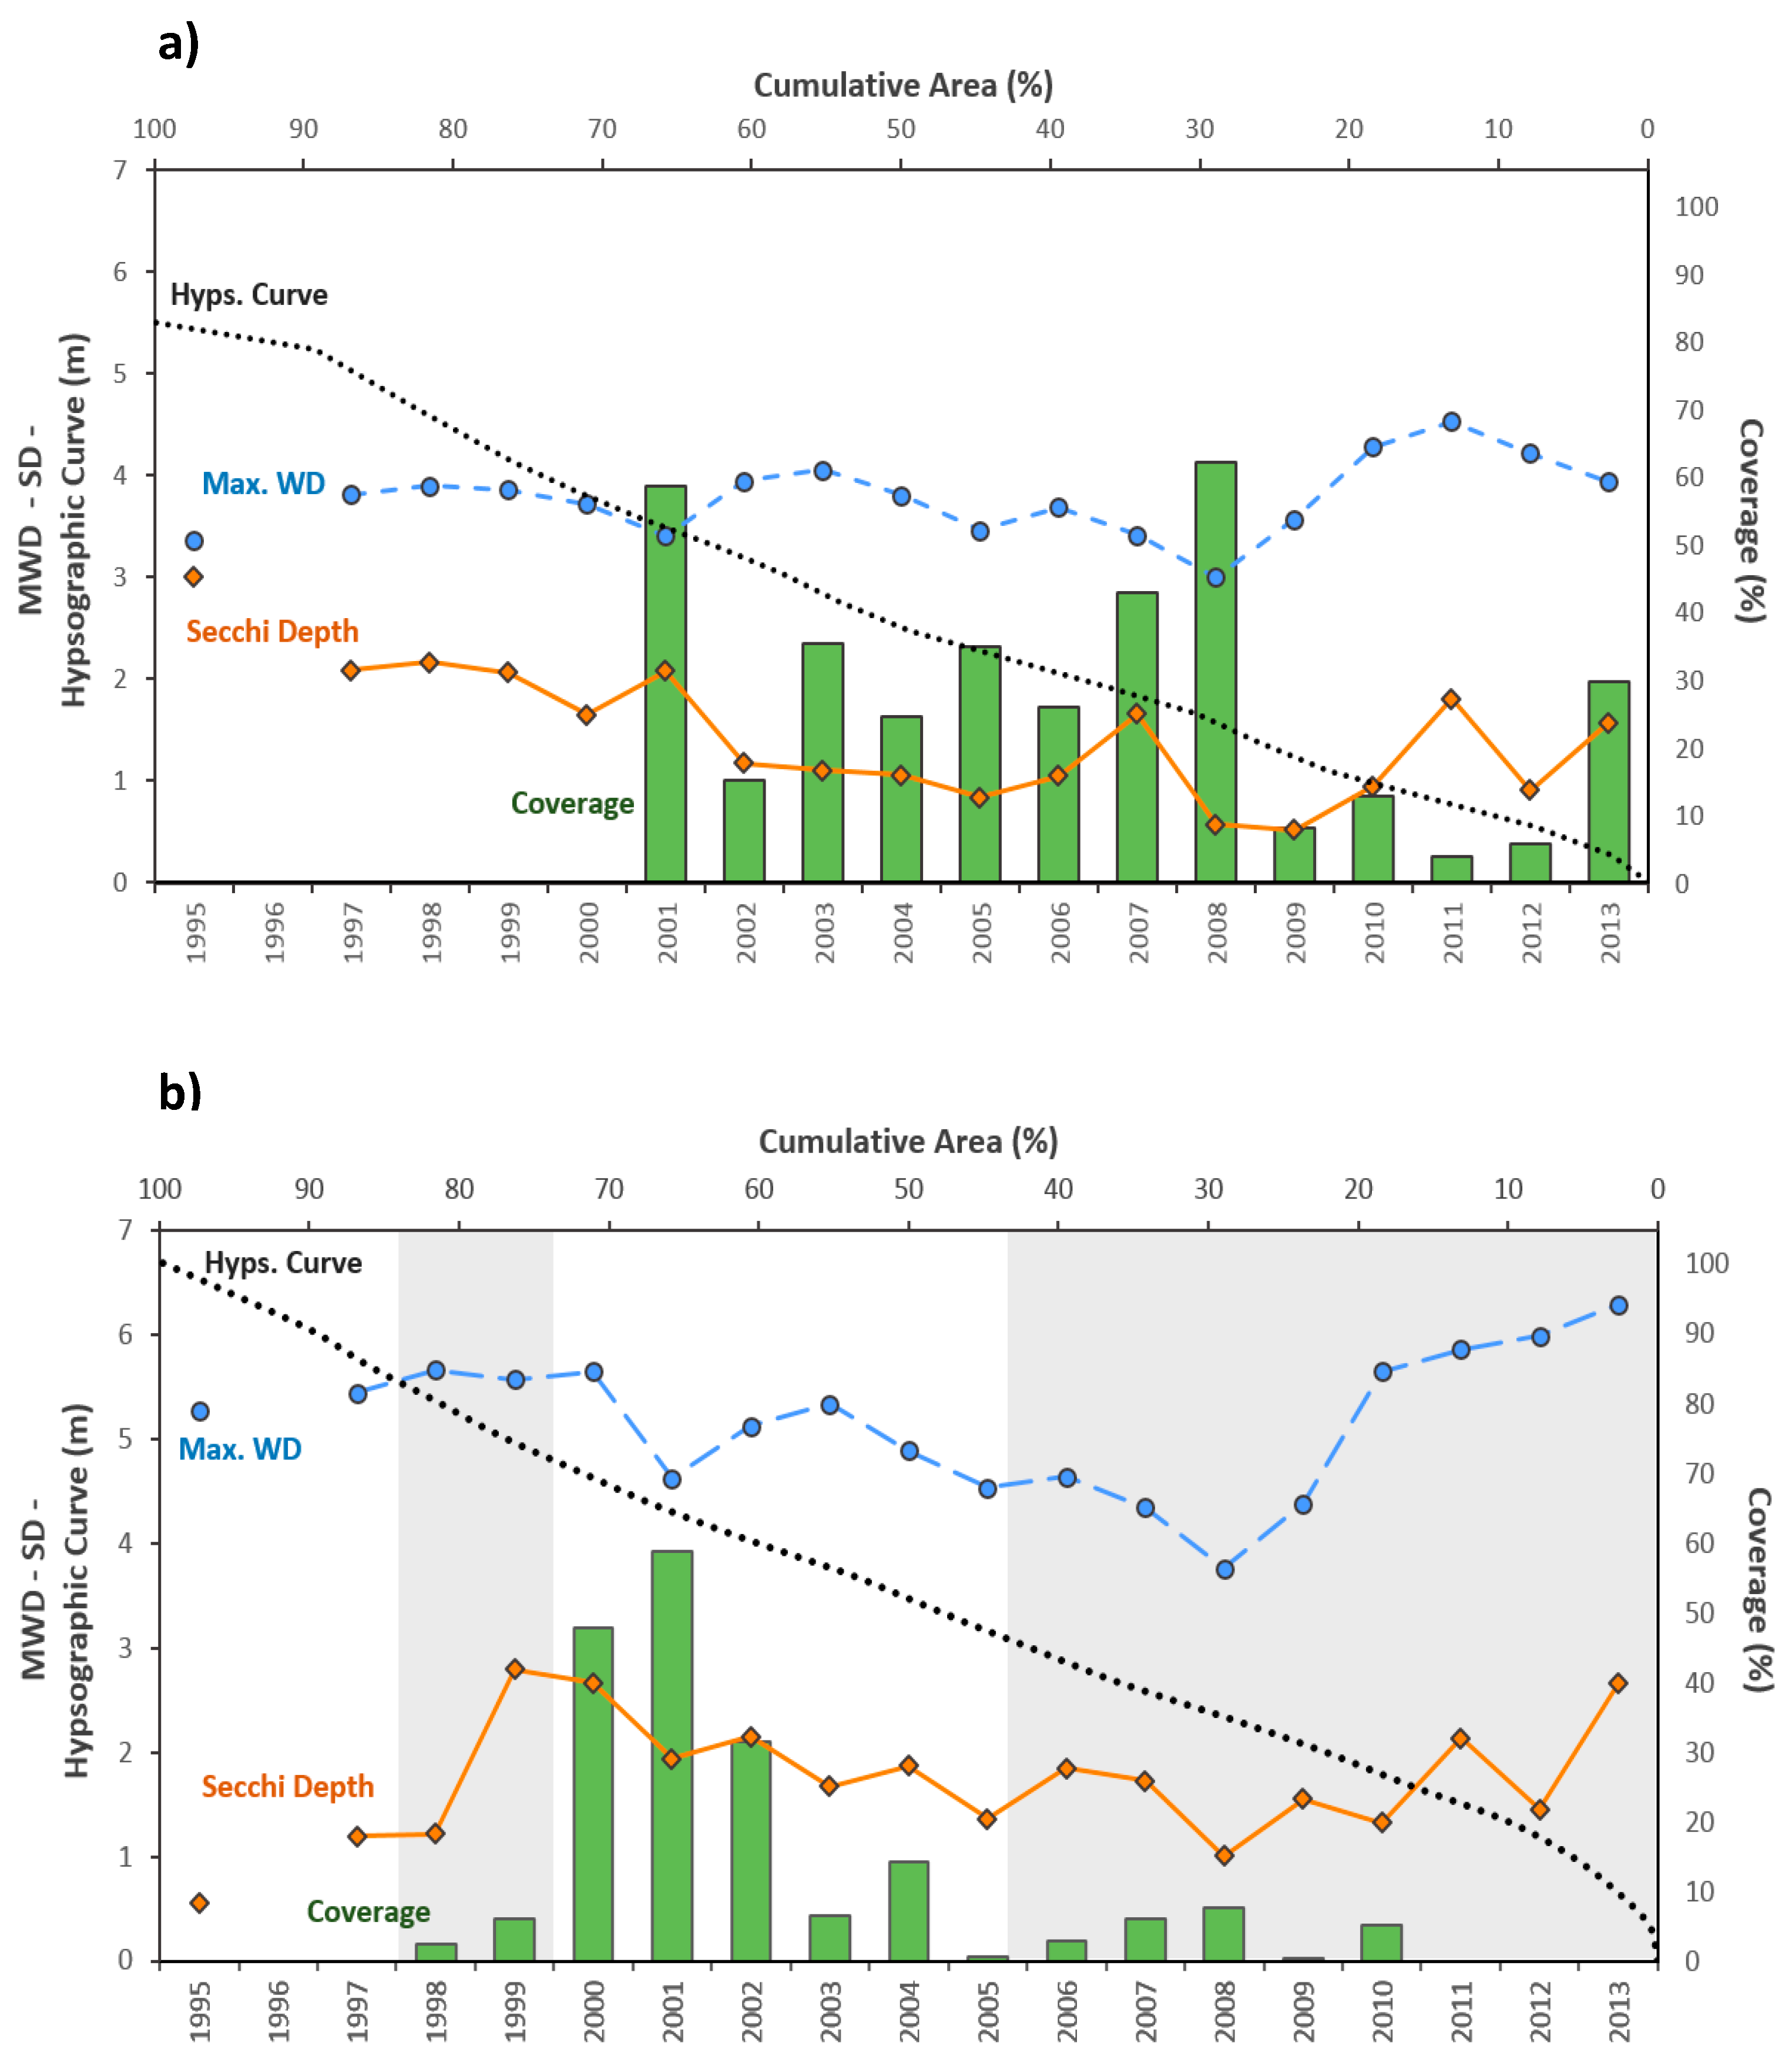
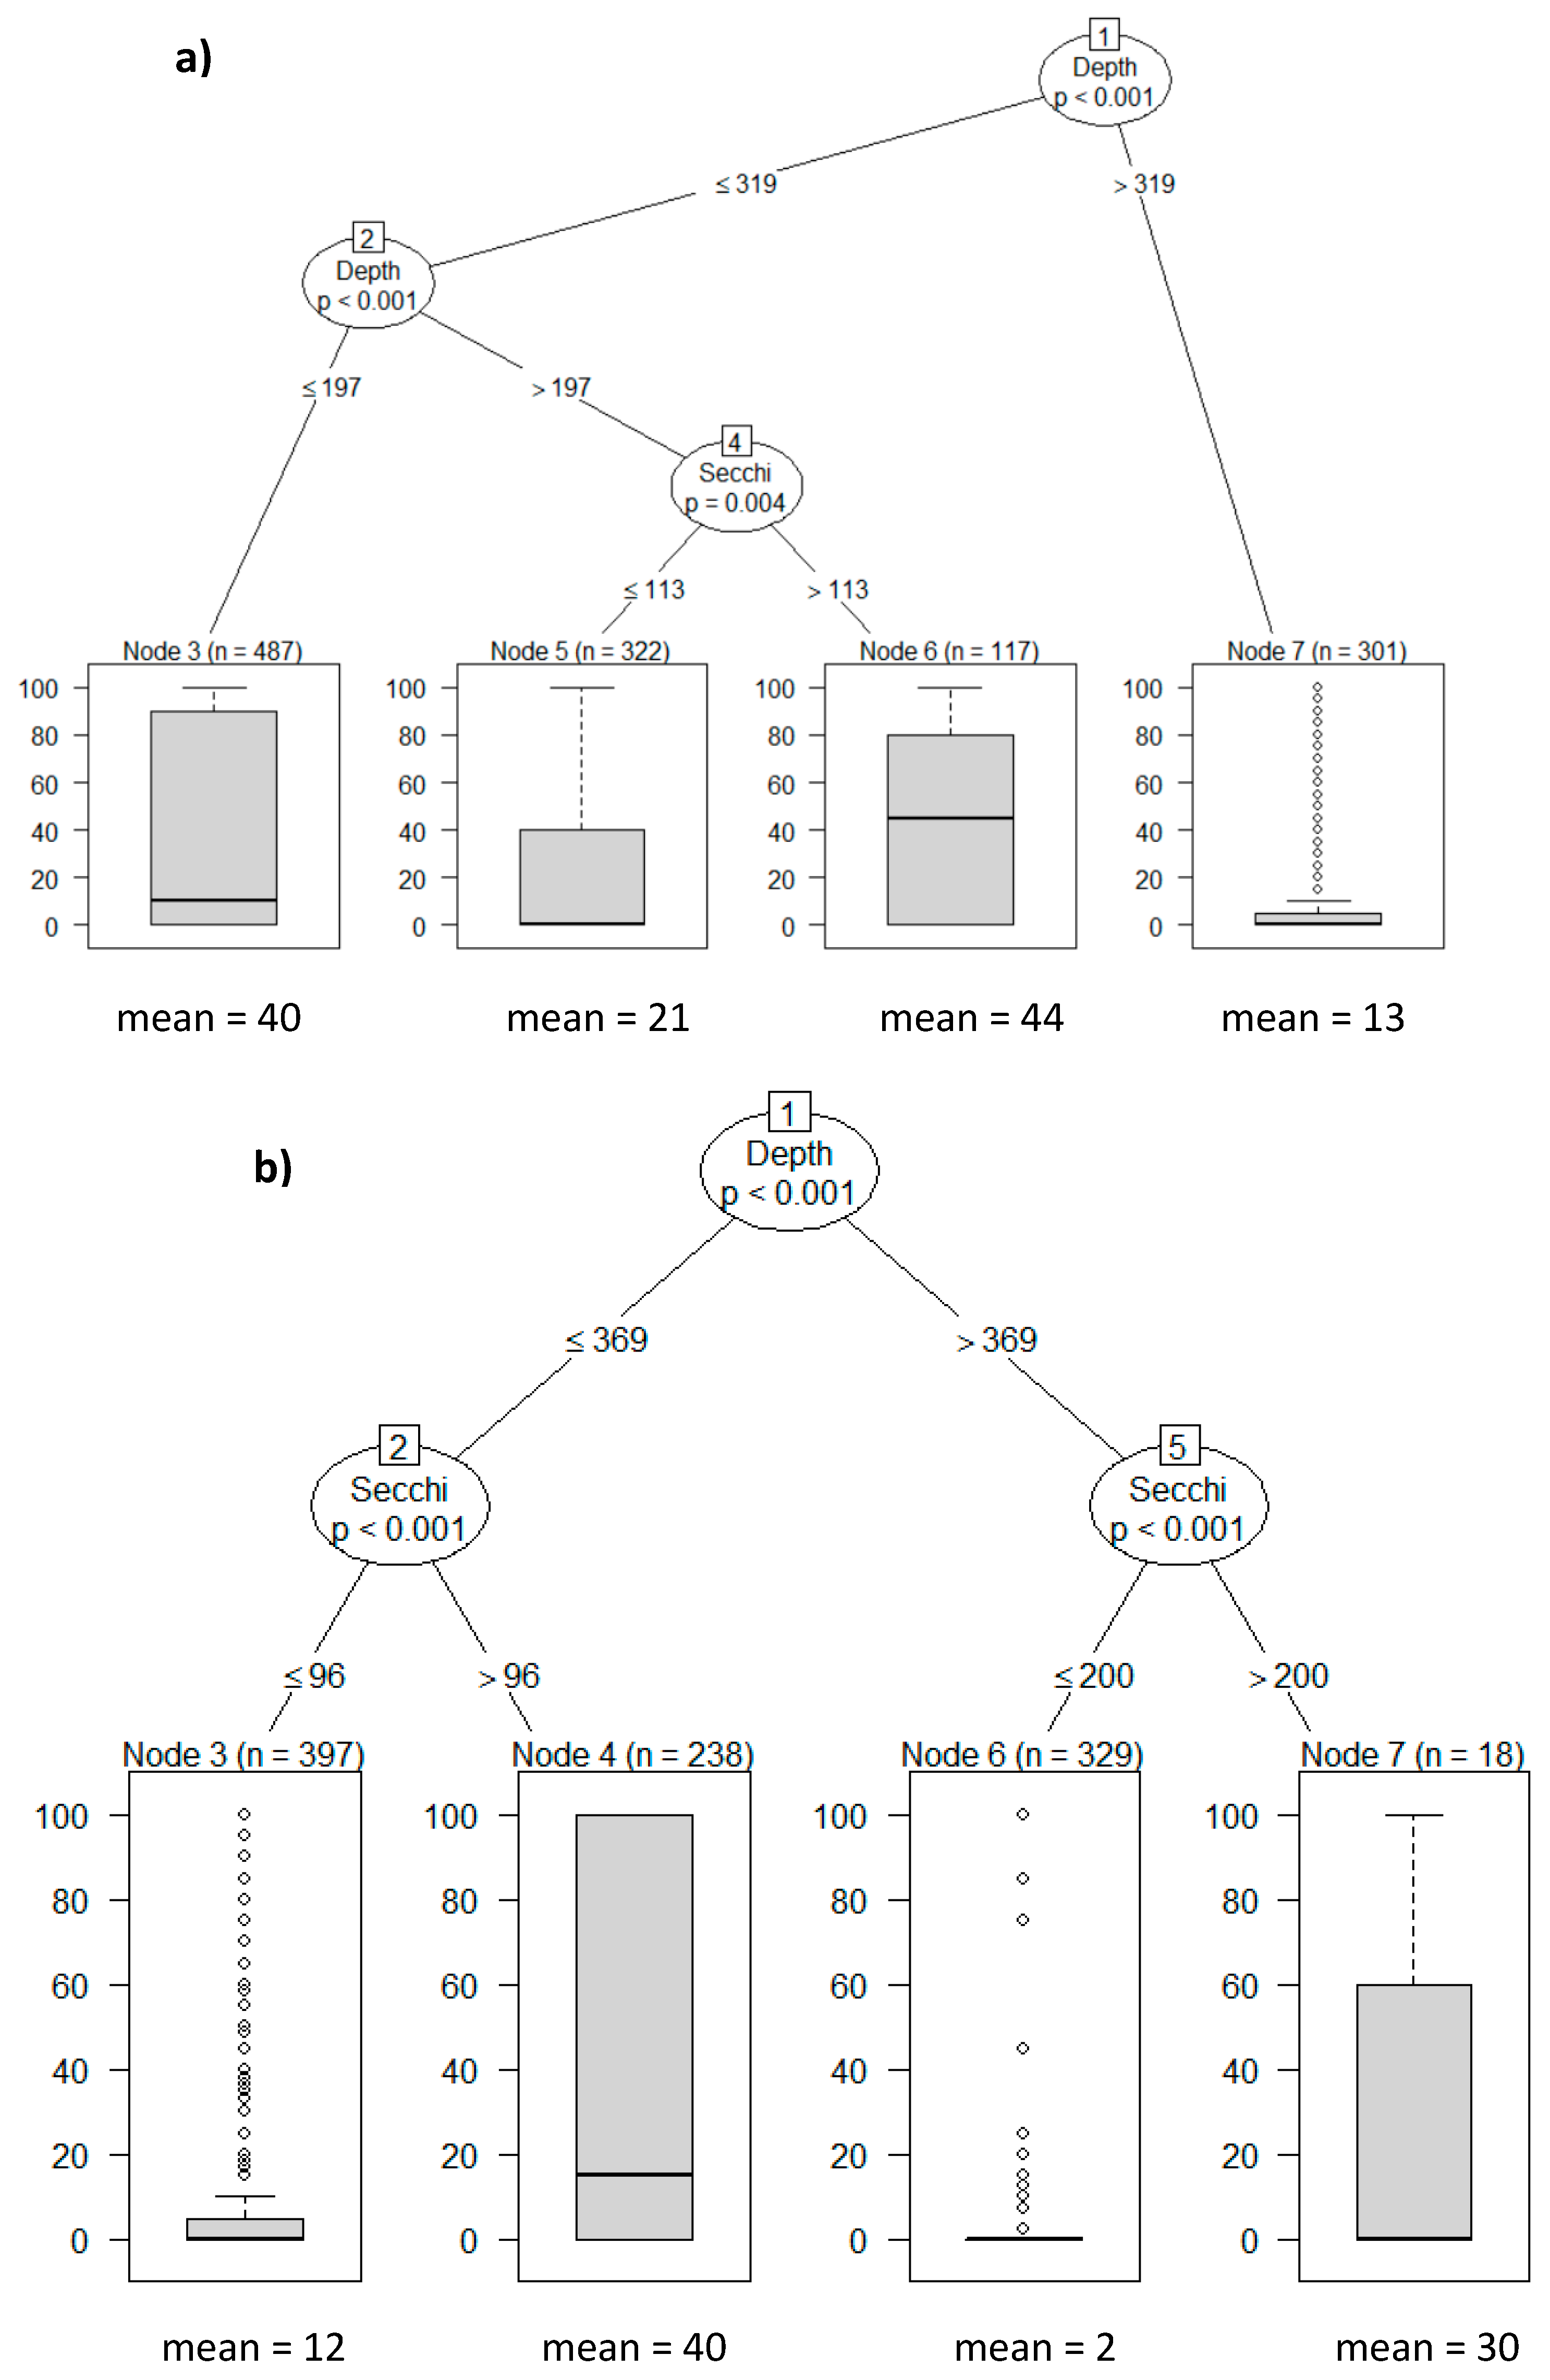
3.4. Macrophytes
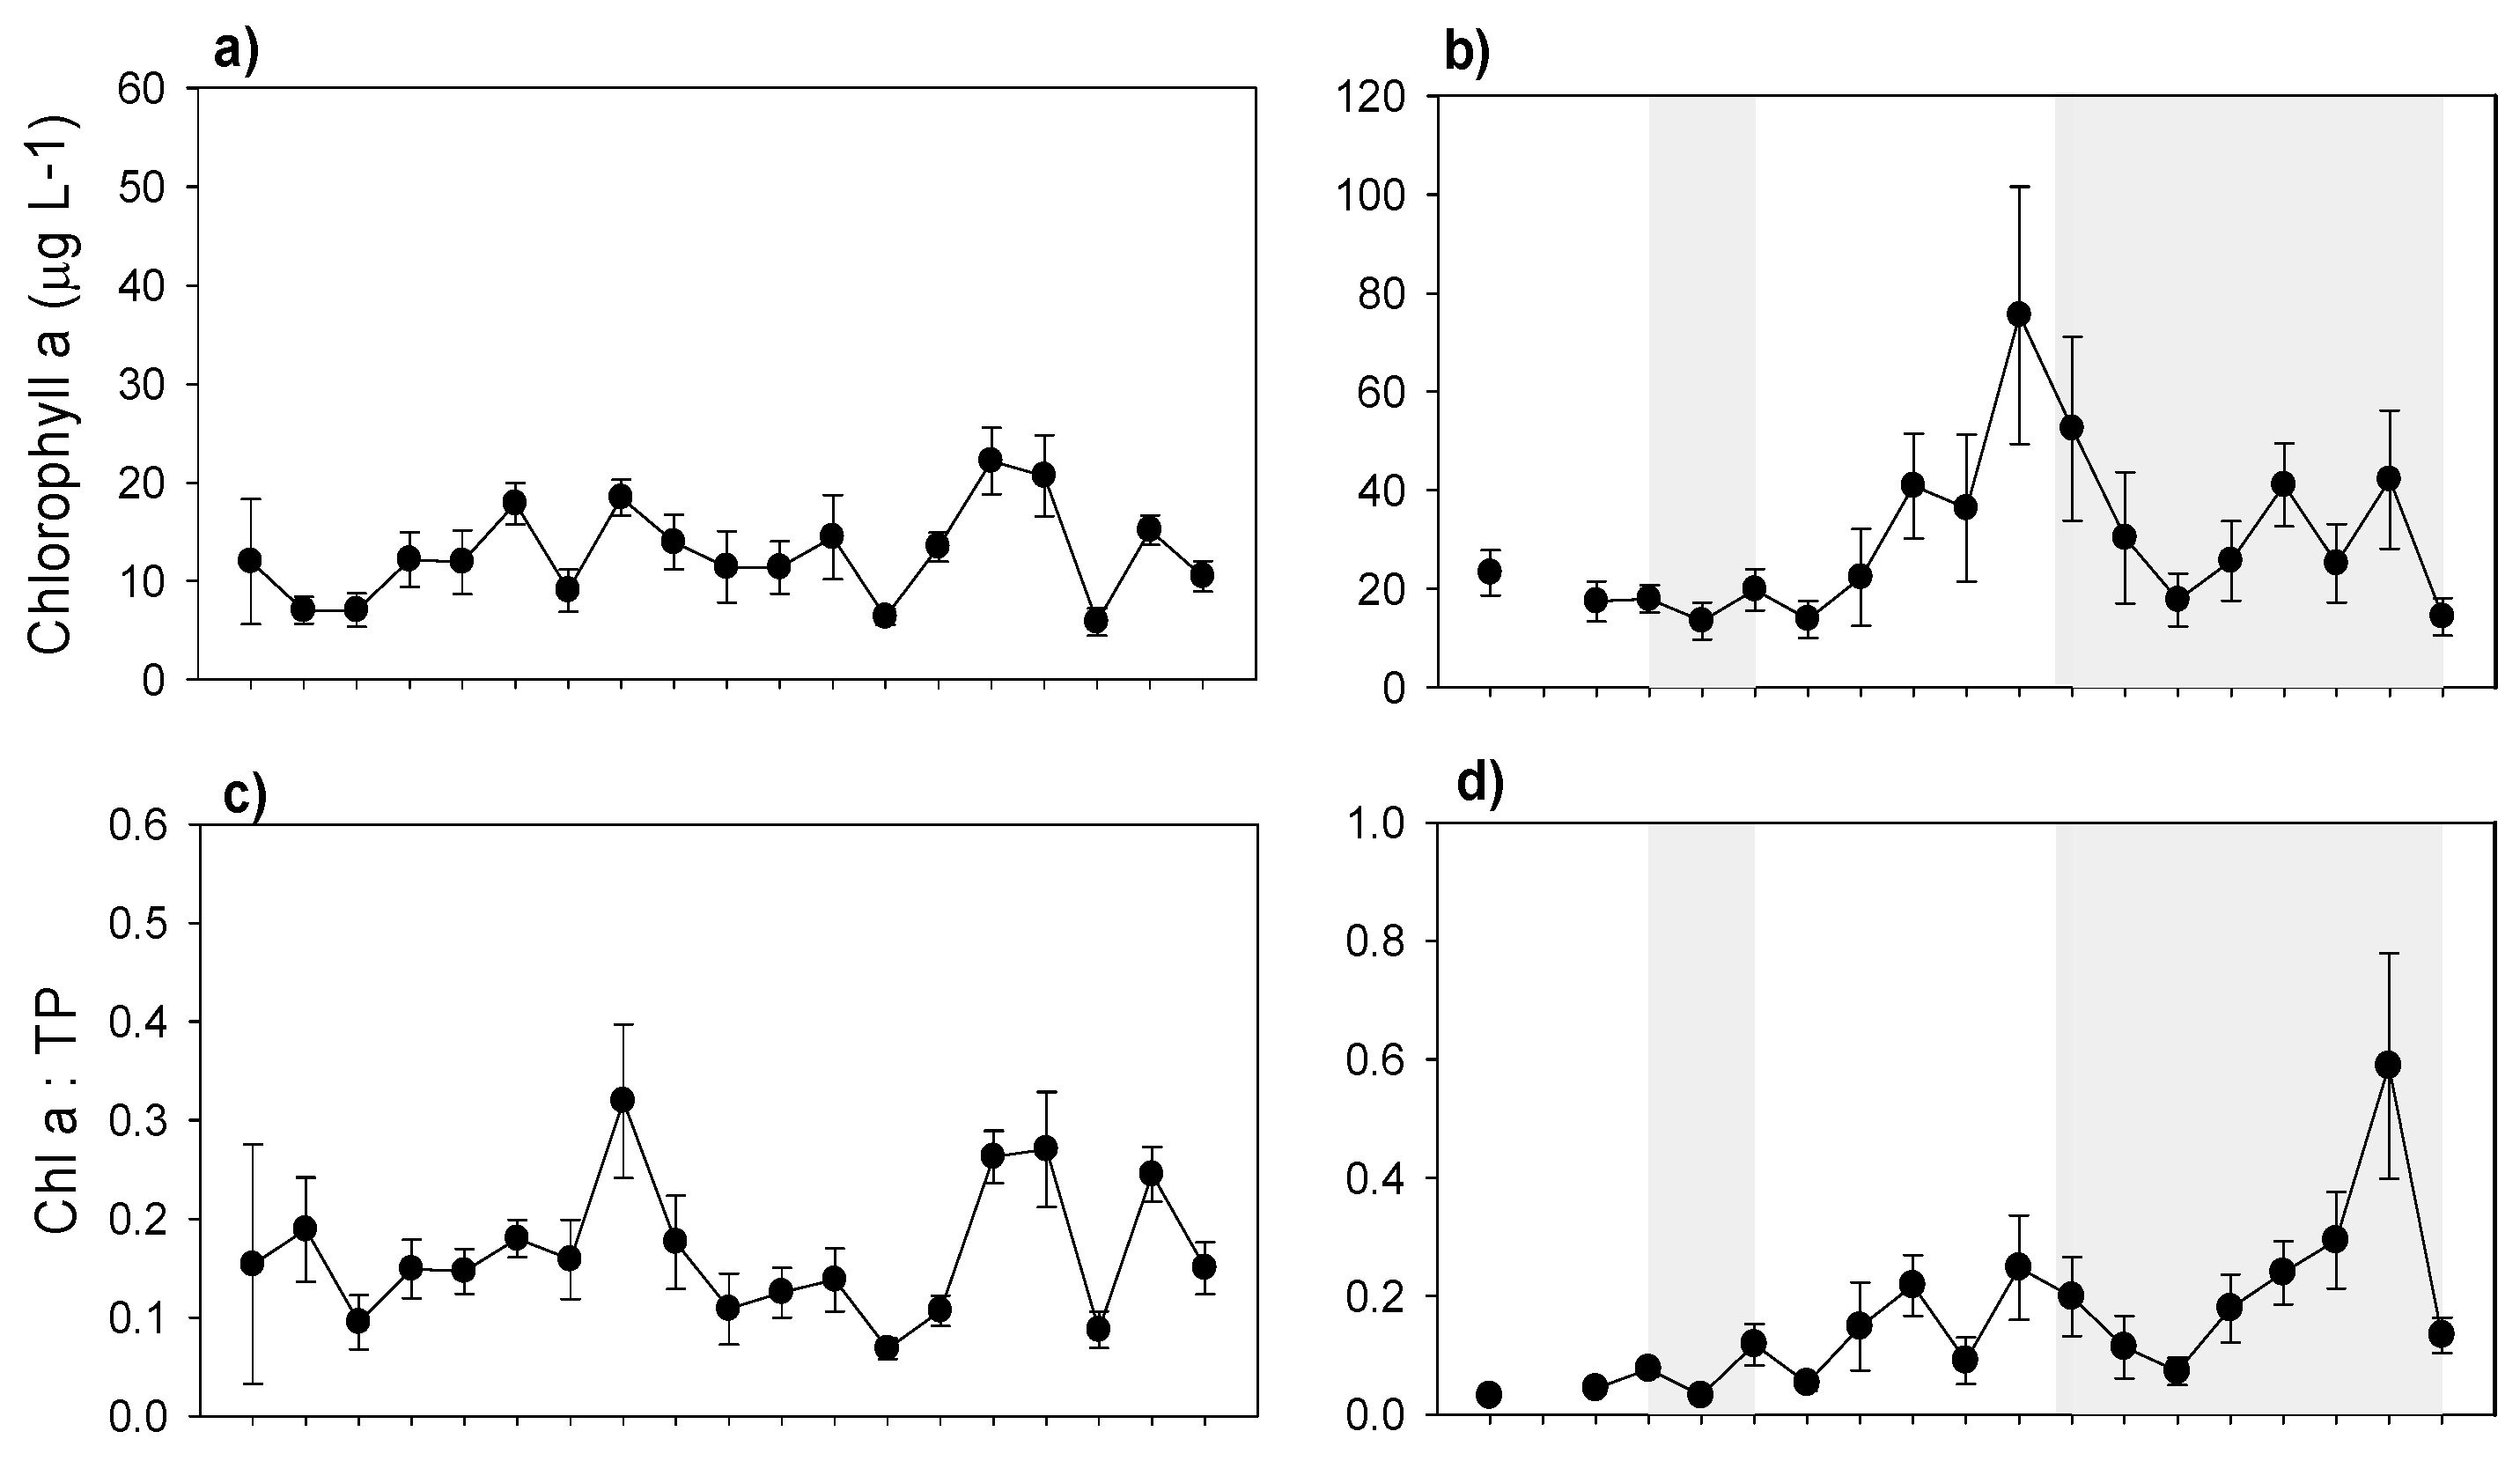
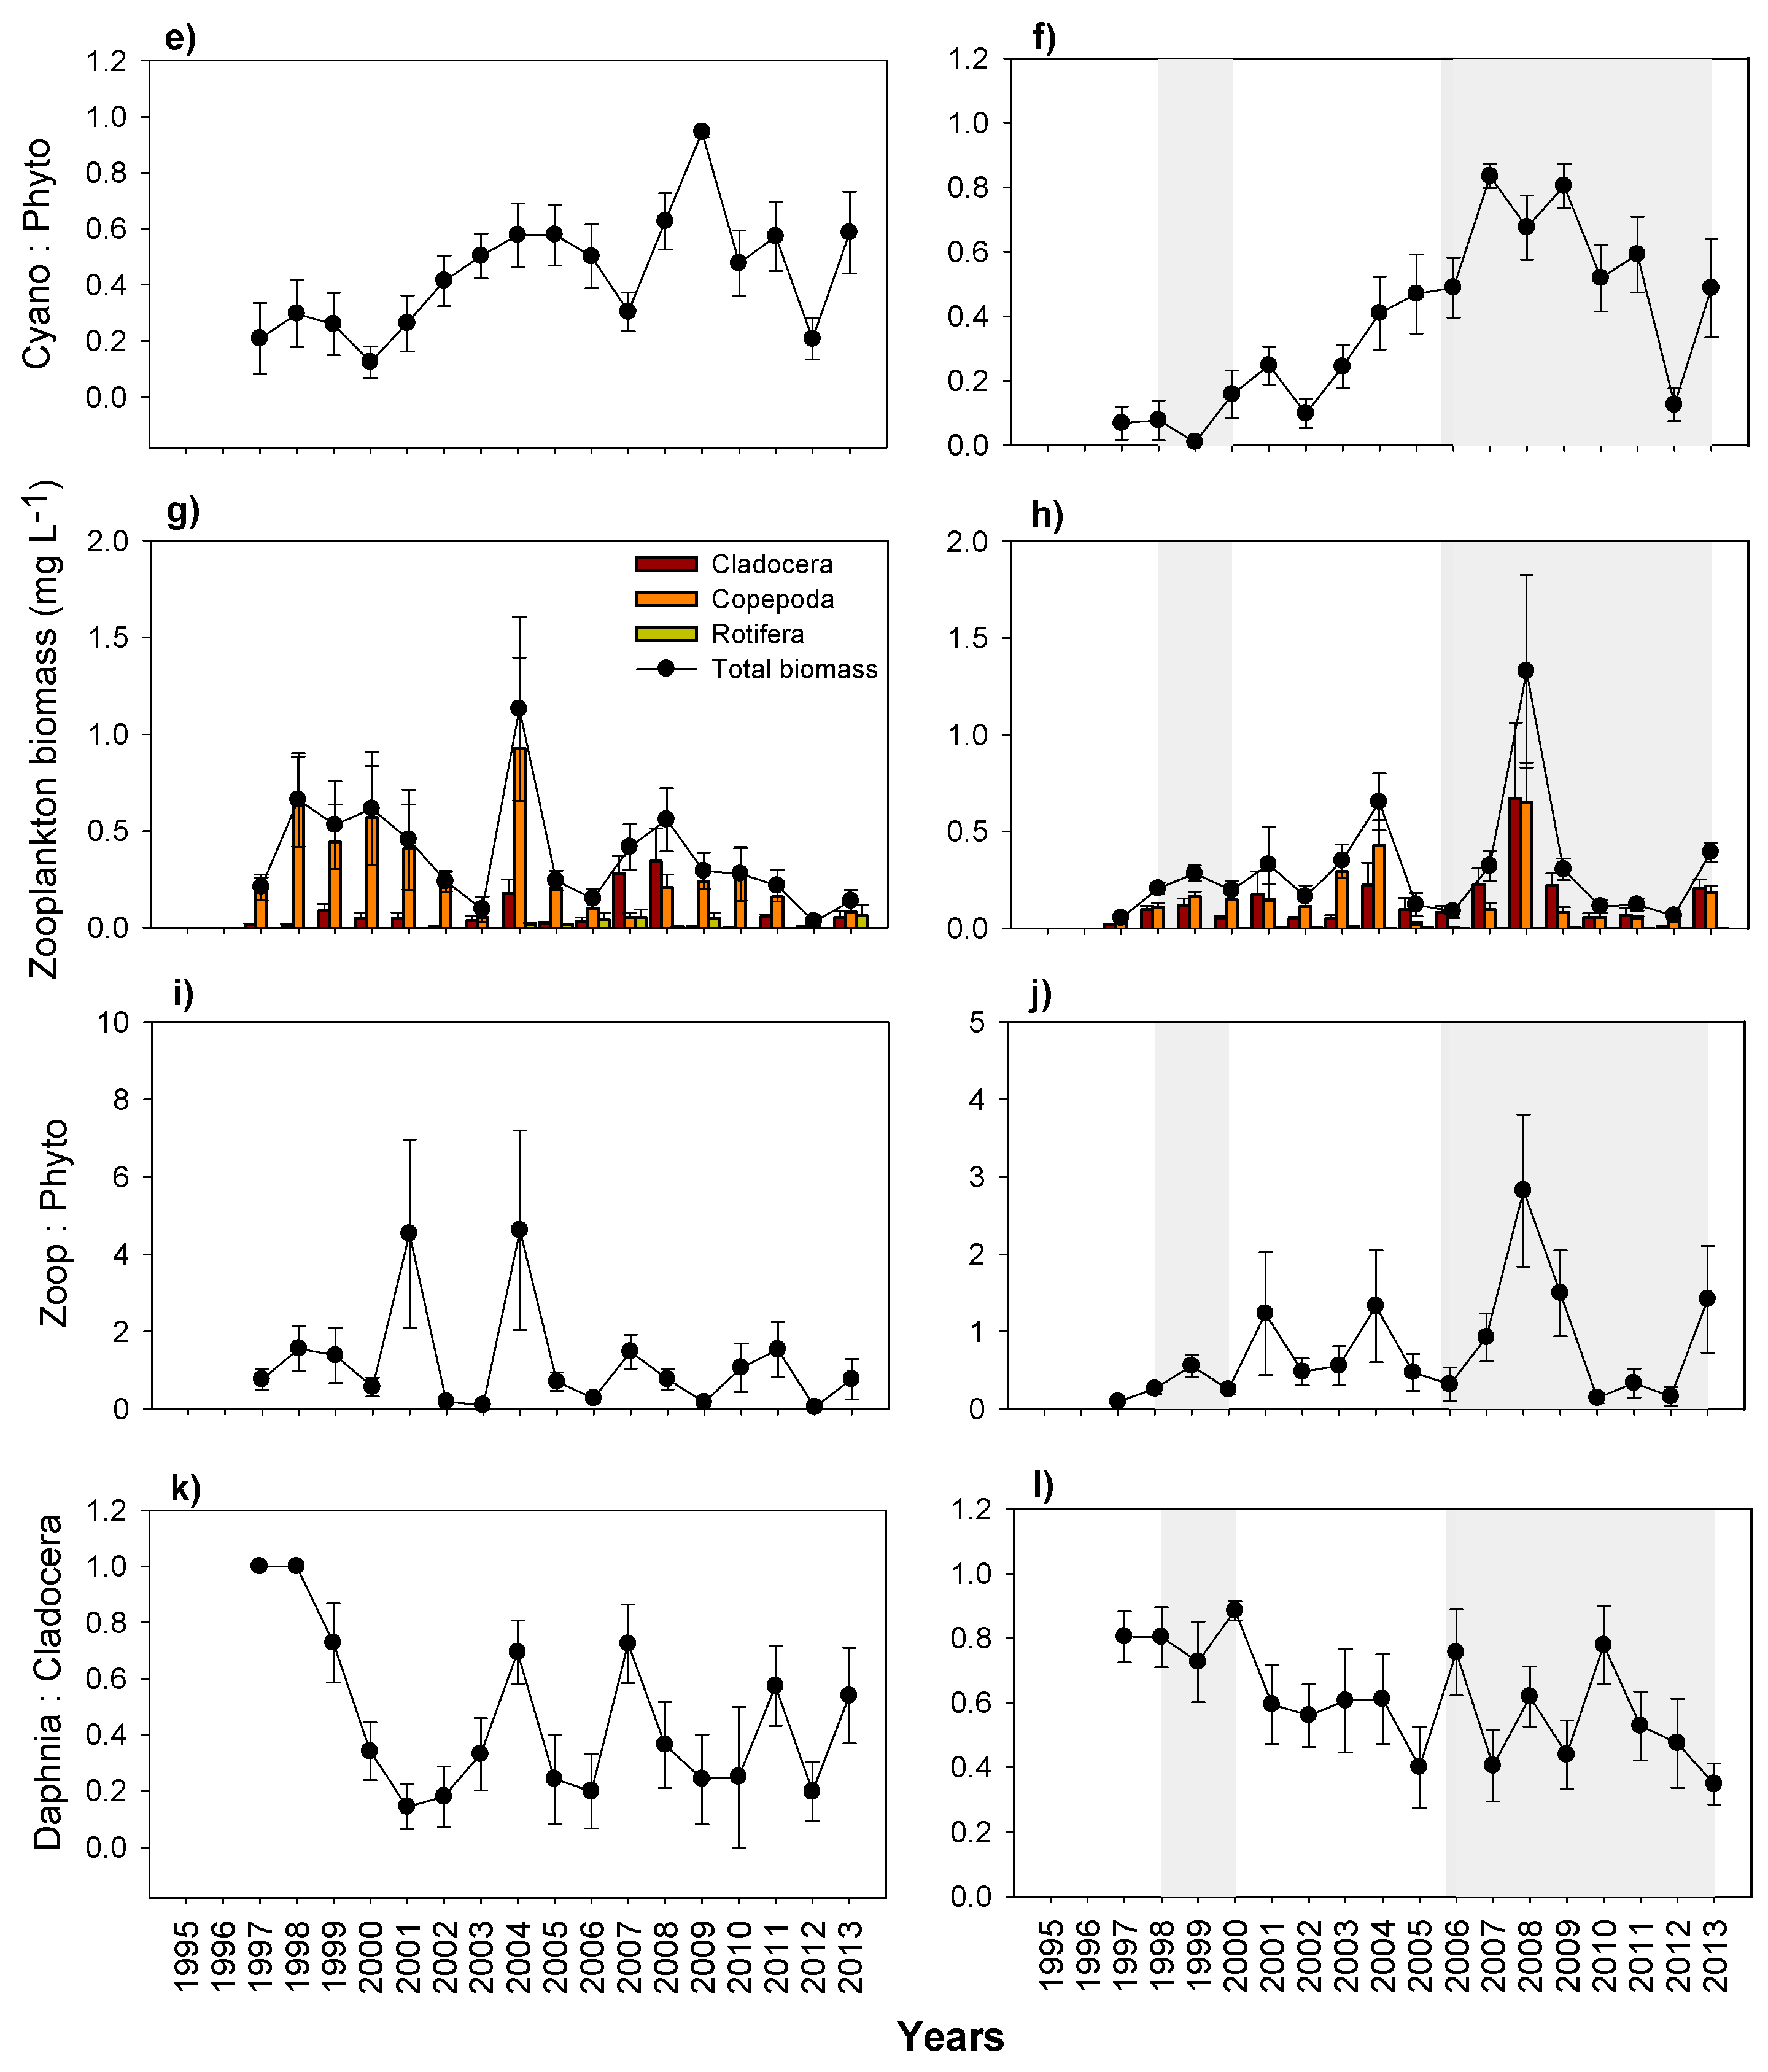
3.5. Plankton
4. Discussion
Acknowledgments
Dedication
Author Contributions
Conflicts of Interest
References
- Costanza, R.; Graumlich, L.; Steffen, W.; Crumley, C.; Dearing, J.; Hibbard, K.; Leemans, R.; Redman, C.; Schimel, D. Sustainability or collapse: What can we learn from integrating the history of humans and the rest of nature? Ambio 2007, 36, 522–527. [Google Scholar] [CrossRef]
- Howden, S.M.; Soussana, J.F.; Tubiello, F.N.; Chetri, N.; Dunlop, M.; Meinke, H. Adapting agriculture to climate change. Proc. Natl. Acad. Sci. USA 2007, 104, 19691–19696. [Google Scholar] [CrossRef] [PubMed]
- Jeppesen, E.; Kronvang, B.; Meerhoff, M.; Søndergaard, M.; Hansen, K.M.; Andersen, H.E.; Lauridsen, T.L.; Liboriussen, L.; Beklioğlu, M.; Özen, A.; et al. Climate change effects on runoff, catchment phosphorus loading and lake ecological state, and potential adaptations. J. Environ. Qual. 2009, 38, 1930–1941. [Google Scholar] [CrossRef] [PubMed]
- Jeppesen, E.; Kronvang, B.; Olesen, J.E.; Audet, J.; Søndergaard, M.; Hoffmann, C.C.; Andersen, H.E.; Lauridsen, T.L.; Liboriussen, L.; Larsen, S.E.; et al. Climate change effects on nitrogen loading from cultivated catchments in Europe: Implications for nitrogen retention, ecological state of lakes and adaptation. Hydrobiologia 2011, 663, 1–21. [Google Scholar] [CrossRef]
- Özen, A.; Karapınar, B.; Kucuk, I.; Jeppesen, E.; Beklioglu, M. Drought-induced changes in nutrient concentrations and retention in two shallow Mediterranean lakes subjected to different degrees of management. Hydrobiologia 2010, 646, 61–72. [Google Scholar] [CrossRef]
- Romo, S.; Soria, J.; Fernández, F.; Ouahid, Y.; Baró-Solá, A. Water residence time and the dynamics of toxic cyanobacteria. Freshw. Biol. 2012, 58, 513–522. [Google Scholar] [CrossRef]
- Beklioğlu, M.; Meerfhoff, M.; Søndergaard, M.; Jeppesen, E. Eutrophication and Restoration of Shallow Lakes from a Cold Temperate to a Warm Mediterranean and a (sub) Tropical Climate. In Eutrophication: Causes, Consequences and Control; Ansari, A.A., Gill, S.S., Lanza, G.R., Rast, W., Eds.; Springer: Dordrecht, The Netherlands, 2011; pp. 91–108. [Google Scholar]
- Jeppesen, E.; Brucet, S.; Naselli-Flores, L.; Papastergiadou, E.; Stefanidis, K.; Nõges, T.; Nõges, P.; Attayde, J.L.; Zohary, T.; Coppens, J.; et al. Ecological impacts of global warming and water abstraction on lakes and reservoirs due to changes in water level and related changes in salinity. Hydrobiologia 2015, 750, 201–227. [Google Scholar] [CrossRef]
- Cai, J.B.; Ding, X.F.; Peng, H.Y.; Chang, H.Q.; Yang, X.E. Effects of environmental factors and submerged aquatic plants on phosphorus release from the sediment. J. Soil Water Conserv. 2007, 21, 151–154. [Google Scholar]
- Yang, X.; Wu, X.; Hao, H.; He, Z. Mechanisms and assessment of water eutrophication. J. Zhejiang Univ. Sci. B 2008, 9, 197–209. [Google Scholar] [CrossRef] [PubMed]
- Yvon-Durocher, G.; Montoya, J.M.; Trimmer, M.; Woodward, G. Warming alters the size spectrum and shifts the distribution of biomass in freshwater ecosystems. Glob. Chang. Biol. 2010, 17, 1681–1694. [Google Scholar] [CrossRef]
- Dossena, M.; Yvon-Durocher, G.; Grey, J.; Montoya, J.M.; Perkins, D.M.; Trimmer, M.; Woodward, G. Warming alters community size structure and ecosystem functioning. Proc. R. Soc. B 2012, 37–49. [Google Scholar] [CrossRef] [PubMed]
- Wrona, F.J.; Prowse, T.D.; Reist, J.D.; Hobbie, J.E.; Levesque, L.M.J.; Vincent, W.F. Climate change effects on aquatic biota, ecosystem structure and function. Ambio 2006, 35, 359–369. [Google Scholar] [CrossRef]
- Trenberth, K.E.; Dai, A.; van der Schrier, G.; Jones, P.D.; Barichivich, J.; Briffa, K.R.; Sheffield, J. Global warming and changes in drought. Nat. Clim. Chang. 2014, 4, 17–22. [Google Scholar] [CrossRef]
- Wantzen, K.M.; Rothhaupt, K.-O.; Mörtl, M.; Cantonati, M.; Tóth, L.G.; Fischer, P. Ecological effects of water-level fluctuations in lakes: An urgent issue. Hydrobiologia 2008, 613, 1–4. [Google Scholar] [CrossRef] [Green Version]
- Christensen, J.H.; Kanikicharla, K.K.; Marshall, G.; Turner, J. Climate phenomena and their relevance for future regional climate change. In Climate Change 2013: The Physical Science Basis. Contribution of Working Group I to the Fifth Assessment Report of the Intergovernmental Panel on Climate Change; Stocker, T.F., Qin, D., Plattner, G.-K., Tignor, M.M.B., Allen, S.K., Boschung, J., Nauels, A., Xia, Y., Bex, V., Midgley, P.M., Eds.; Cambridge University Press: Cambridge, UK; New York, NY, USA, 2013; pp. 1217–1308. [Google Scholar]
- Erol, A.; Randhir, T.O. Climatic change impacts on the ecohydrology of Mediterranean watersheds. Clim. Chang. 2012, 114, 319–341. [Google Scholar] [CrossRef]
- Leblanc, M.J.; Tregoning, P.; Ramillien, G.; Tweed, S.O.; Fakes, A. Basin-scale, integrated observations of the early 21st century multiyear drought in southeast Australia. Water Resour. Res. 2009, 45. [Google Scholar] [CrossRef]
- Coppens, J.; Özen, A.; Tavşanoğlu, Ü.N.; Erdoğan, Ş.; Levi, E.E.; Yozgatlıgil, C.; Jeppesen, E.; Beklioğlu, M. Impact of alternating wet and dry periods on long-term seasonal phosphorus and nitrogen budgets of two shallow Mediterranean lakes. Sci. Total Environ. 2016, 563–564, 456–467. [Google Scholar] [CrossRef] [PubMed]
- Beklioğlu, M.; Tan, C.O. Restoration of a Shallow Mediterranean Lake by biomanipulation complicated by drought. Fundam. Appl. Limnol. 2008, 171, 105–118. [Google Scholar] [CrossRef]
- Søndergaard, M.; Jensen, J.P.; Jeppesen, E. Role of sediment and internal loading of phosphorus in shallow lakes. Hydrobiologia 2003, 506/509, 135–145. [Google Scholar] [CrossRef]
- Breukelaar, A.W.; Lammens, E.H.R.R.; Breteler, J.G.P.K.; Tatrai, I. Effects of benthivorous bream (Abramis brama) and carp (Cyprinus carpio) on sediment resuspension and concentrations of nutrients and chlorophyll-a. Freshw. Biol. 1994, 32, 113–121. [Google Scholar] [CrossRef]
- Vanni, M.J.; Layne, C.D.; Arnott, S.E. “Top-down” trophic interactions in lakes: Effects of fish on nutrient dynamics. Ecology 1997, 78, 1–20. [Google Scholar]
- Vanni, M.J. Nutrient cycling by animals in freshwater ecosystems. Annu. Rev. Ecol. Syst. 2002, 33, 341–370. [Google Scholar] [CrossRef]
- Cooke, G.D.; Welch, E.B.; Peterson, S.A.; Nichols, S.A. Restoration and Management of Lakes and Reservoirs, 3rd ed.; Taylor & Francis: London, UK; New York, NY, USA, 2005. [Google Scholar]
- Jeppesen, E.; Meerhoff, M.; Davidson, T.A.; Trolle, D.; Søndergaard, M.; Lauridsen, T.L.; Beklioğlu, M.; Brucet, S.; Volta, P.; Gonzalez-Bergonzoni, I.; et al. Climate change impacts on lakes: An integrated ecological perspective based on a multi-faceted approach, with special focus on shallow lakes. J. Limnol. 2014, 73, 88–111. [Google Scholar] [CrossRef] [Green Version]
- Moss, B.; Madgewick, J.; Phillips, G. A Guide to the Restoration of Nutrient-Enriched Shallow Lakes; Broads Authority and Environment Agency: Norwich, UK, 1996; p. 180. [Google Scholar]
- Søndergaard, M.; Jeppesen, E.; Lauridsen, T.L.; Skov, C.; Van Nes, E.H.; Roijackers, R.; Lammens, E.; Portielje, R.O.B. Lake restoration: Successes, failures and long-term effects. J. Appl. Ecol. 2007, 44, 1095–1105. [Google Scholar] [CrossRef]
- Meijer, M.L.; Jeppesen, E.; van Donk, E.; Moss, B.; Scheffer, M.; Lammens, E.; van Nes, E.; van Berkum, J.A.; de Jong, G.J.; Faafeng, B.A.; et al. Longterm responses to fish-stock reduction in small shallow lakes: Interpretation of five-year results of four biomanipulation cases in The Netherlands and Denmark. Hydrobiologia 1994, 275, 457–466. [Google Scholar] [CrossRef]
- Jeppesen, E.; Sammalkorpi, I. Lakes. In Handbook of Ecological Restoration; Perrow, M.R., Davy, A.J., Eds.; Cambridge University Press: Cambridge, UK, 2002; Volume 2, pp. 297–324. [Google Scholar]
- Sas, H. Lake Restoration by Reduction of Nutrient Loading: Expectations, Experiences and Extrapolations; Academia Verlag Richarz: St Augustin, Germany, 1989; p. 497. [Google Scholar]
- Søndergaard, M.; Liboriussen, L.; Pedersen, A.R.; Jeppesen, E. Lake restoration by fish removal: Short-and long-term effects in 36 Danish lakes. Ecosystems 2008, 11, 1291–1305. [Google Scholar] [CrossRef]
- Jeppesen, E.; Søndergaard, M.; Mazzeo, N.; Meerhoff, M.; Branco, C.; Huszar, V.; Scasso, F. Lake Restoration and Biomanipulation in Temperate Lakes. In Tropical Eutrophic Lakes: Their Restoration and Management, 3rd ed.; Reddy, M.V., Ed.; Taylor & Francis Group: Boca Raton, FL, USA, 2005; pp. 331–359. [Google Scholar]
- Lazzaro, X. Do the trophic cascade hypothesis and classical biomanipulation approaches apply to tropical lakes and reservoirs? Verh. Int. Verein. Limnol. 1997, 26, 719–730. [Google Scholar]
- González-Bergonzoni, I.; Meerhoff, M.; Davidson, T.A.; Teixeira-de Mello, F.; Baattrup-Pedersen, A.; Jeppesen, E. Meta-analysis shows a consistent and strong latitudinal pattern in fish omnivory across ecosystems. Ecosystems 2012, 15, 492–503. [Google Scholar] [CrossRef]
- Blanck, A.; Lamouroux, N. Large-scale intraspecific variation in life-history traits of 44 European freshwater fish. J. Biogeogr. 2007, 34, 862–875. [Google Scholar] [CrossRef]
- Lappalainen, J.; Tarkan, A.S. Latitudinal gradients in onset date, onset temperature and duration of spawning of roach. J. Fish Biol. 2007, 70, 441–450. [Google Scholar] [CrossRef]
- Welch, E.B. The Dilution/Flushing technique in Lake Restoration. J. Am. Water Resour. Assoc. 1981, 17, 558–564. [Google Scholar] [CrossRef]
- Beklioğlu, M.; Altınayar, G.; Tan, C.O. Water level control over submerged macrophyte development in five shallow lakes of Mediterranean Turkey. Fundam. Appl. Limnol. 2006, 166, 535–556. [Google Scholar] [CrossRef]
- Özkan, K.; Jeppesen, E.; Johansson, L.S.; Beklioğlu, M. The response of periphyton and submerged macrophytes to nitrogen and phosphorus loading in shallow warm lakes: A mesocosm experiment. Freshw. Biol. 2010, 55, 463–475. [Google Scholar] [CrossRef]
- Bucak, T.; Saraoğlu, E.; Levi, E.E.; Tavşanoğlu, Ü.N.; Çakıroğlu, A.İ.; Jeppesen, E.; Beklioğlu, M. The influence of water level on macrophyte growth and trophic interactions in eutrophic Mediterranean shallow lakes: A mesocosm experiment with and without fish. Freshw. Biol. 2012, 57, 1631–1642. [Google Scholar] [CrossRef]
- Engelhardt, K.A.M.; Ritchie, M.E. Effects of macrophyte species richness on wetland ecosystem functioning and services. Nature 2001, 411, 687–689. [Google Scholar] [CrossRef] [PubMed]
- Jeppesen, E.; Søndergaard, M.; Søndergaard, M.; Christoffersen, K. The Structuring Role of Submerged Macrophytes in Lakes; Springer: New York, NY, USA, 1998. [Google Scholar]
- Bachmann, R.W.; Horsburgh, C.A.; Hoyer, M.V.; Mataraza, L.K.; Canfield, D.E., Jr. Relations between trophic state indicators and plant biomass in Florida lakes. Hydrobiologia 2002, 470, 219–234. [Google Scholar] [CrossRef]
- Meerhoff, M.; Iglesias, C.; de Mello, F.T.; Clemente, J.M.; Jensen, E.; Lauridsen, T.L.; Jeppesen, E. Effects of habitat complexity on community structure and predator avoidance behaviour of littoral zooplankton in temperate versus subtropical shallow lakes. Freshw. Biol. 2007, 52, 1009–1021. [Google Scholar] [CrossRef]
- Tavşanoğlu, Ü.N.; Çakıroğlu, A.İ.; Erdoğan, Ş.; Meerhoff, M.; Jeppesen, E.; Beklioğlu, M. Sediments, not plants, offer the preferred refuge for Daphnia against fish predation in Mediterranean shallow lakes: An experimental demonstration. Freshw. Biol. 2012, 57, 795–802. [Google Scholar] [CrossRef]
- Jeppesen, E.; Moss, B.; Bennion, H.; Carvalho, L.; de Meester, L.; Feuchtmayr, H.; Friberg, N.; Gessner, M.O.; Hefting, M.; Lauridsen, T.L.; et al. Interaction of climate change and eutrophication. In Climate Change Impacts on Freshwater Ecosystems; Blackwell Publishing: Oxford, UK, 2010; pp. 119–151. [Google Scholar]
- Jeppesen, E.; Meerhoff, M.; Holmgren, K.; González-Bergonzoni, I.; Teixeira-de Mello, F.; Declerck, S.A.; de Meester, L.; Søndergaard, M.; Lauridsen, T.L.; Bjerring, R.; et al. Impacts of climate warming on lake fish community structure and potential effects on ecosystem function. Hydrobiologia 2010, 646, 73–90. [Google Scholar] [CrossRef]
- Destouni, G.; Jaramillo, F.; Prieto, C. Hydroclimatic shifts driven by human water use for food and energy production. Nat. Clim. Chang. 2013, 3, 213–217. [Google Scholar] [CrossRef]
- Peel, M.C.; Finlayson, B.L.; McMahon, T.A. Updated world map of the Köppen-Geiger climate classification. Hydrol. Earth Syst. Sci. 2007, 11, 1633–1644. [Google Scholar] [CrossRef]
- Turkish State Meteorological Service. Available online: http://www.meteoroloji.gov.tr/index.aspx (accessed on 10 March 2014).
- Coops, H.; Beklioğlu, M.; Crisman, T.L. The role of water-level fluctuations in shallow lake ecosystems—Workshop conclusions. Hydrobiologia 2003, 506, 23–27. [Google Scholar] [CrossRef]
- Özesmi, U. Ecology and Politics of Rehabilitation: Mogan Lake Wetland System, Ankara, Turkey. In An International Perspective on Wetland Rehabilitation; Streever, W., Ed.; Kluwer Academic Publishers: Dordrecht, The Netherlands, 1999; pp. 181–187. [Google Scholar]
- BirdLife International, Important Bird and Biodiversity Area Factsheet: Mogan Lake. Available online: http://www.birdlife.org (accessed on 14 May 2016).
- Burnak, S.L.; Beklioğlu, M. Macrophyte-dominated clearwater state of Lake Mogan. Turk. J. Zool. 2000, 24, 305–314. [Google Scholar]
- Beklioğlu, M.; Ince, O.; Tüzün, I. Restoration of the eutrophic lake Eymir, Turkey, by biomanipulation after a major external nutrient control. Hydrobiologia 2003, 490, 93–105. [Google Scholar] [CrossRef]
- Altınbilek, D.; Usul, N.; Yazıcıoğlu, H.; Kutoğlu, Y.; Merzi, N.; Göğüs, M.; Doyuran, V.; Günyaktı, A. Gölbaşı Mogan-Eymir Gölleri için su Kaynakları ve Çevre Yönetim Planı Projesi; Technical Report No: 93-03-03-04-01; Middle East Technical University: Ankara, Turkey, 1995. (In Turkish) [Google Scholar]
- Balık, S.; Geldiay, R. Türkiye Tatlısu Balıkları; Ege Üniversitesi Su Ürünleri Fakültesi Yayınları: Bornova, Turkey, 2002; p. 46. [Google Scholar]
- Kuru, M. Türkiye İçsu Balıklarının Son Sistematik Durumu. GÜ Gazi Eğitim Fak. Derg. 2004, 24, 1–21. [Google Scholar]
- Alas, A.; Solak, K. The reproductive biology of the tench (Tinca tinca L., 1758) in Kayaboğazı (Kütahya, Turkey) Dam Lake. Turk. J. Vet. Anim. Sci. 2005, 28, 879–885. [Google Scholar]
- Levi, E.E.; Çakıroğlu, A.İ.; Bucak, T.; Odgaard, B.V.; Davidson, T.A.; Jeppesen, E.; Beklioğlu, M. Similarity between contemporary vegetation and plant remains in the surface sediment in Mediterranean lakes. Freshw. Biol. 2014, 59, 724–736. [Google Scholar] [CrossRef]
- Davis, P.H. Flora of Turkey and the East Aegean Islands; Edinburgh University Press: Edinburgh, UK, 1984; Volume 8. [Google Scholar]
- Seçmen, Ö.; Leblebici, E. Türkiye'nin Sulak alan Bitkileri ve Bitki Örtüsü; Ege Üniversitesi Fen Fakültesi Yayınları: İzmir, Turkey, 1997; p. 870. [Google Scholar]
- Mackereth, F.J.H.; Heron, J.; Talling, J.F. Water Analysis: Some Revised Methods for Limnologists; Freshwater Biological Association: Ambleside, UK, 1978; p. 120. [Google Scholar]
- Jespersen, A.M.; Christoffersen, K. Measurements of chlorophyll-a from phytoplankton using ethanol as extraction solvent. Fundam. Appl. Limnol. 1987, 109, 445–454. [Google Scholar]
- Reynolds, C.S. The Ecology of Freshwater Phytoplankton; Cambridge University Press: Cambridge, UK, 1984; p. 387. [Google Scholar]
- Hillebrand, H.; Dürselen, C.D.; Kirschtel, D.; Pollingher, U.; Zohary, T. Biovolume calculation forpelagic and bentic microalgae. J. Phycol. 1999, 35, 403–424. [Google Scholar] [CrossRef]
- Wetzel, R.G.; Likens, G.E. Limnological Analyses, 2nd ed.; Springer: New York, NY, USA, 1991; p. 429. [Google Scholar]
- John, D.M.; Whitton, B.A.; Brook, A.J. The Freshwater Algal Flora of the British Isles; Cambridge University Press: Cambridge, UK, 2002. [Google Scholar]
- Prescott, G.W. Algea of the Western Great Lakes Area (with on Illustrated Ket to the Genera of Desmids and Freshwater Diatoms); Wm. C. Brown Company Publishers: Dubuque, IA, USA, 1973. [Google Scholar]
- Scourfield, D.J.; Harding, J.P. A Key to the British Freshwater Cladocera with Notes on Their Ecology, 3rd ed.; Freshwater Biological Association: Ambleside, UK, 1966. [Google Scholar]
- Ruttner-Kolisko, A. Plankton Rotifers: Biology and Taxonomy; English Translation of Die Binnengewisser; Lubrecht & Cramer: Stuttgart, Germany, 1974; Volume XXVI. [Google Scholar]
- Pontin, R.M. A Key to the British Freshwater Planktonic Rotifera; Freshwater Biological Association No. 38; Scientific Publication: Cumbria, UK, 1978; p. 178. [Google Scholar]
- Einsle, U. Süßwasserfauna von Mitteleuropa; Gustav Fisher Verlag: Stuttgart/Jena, Germany; New York, NY, USA, 1993; Volume 1, p. 208. [Google Scholar]
- Segers, H. Rotifera. Vol. 2: The Lecanidae (Monogononta). In Guides to the Identification of the Microinvertebrates of the Continental Waters of the World 6; Dumont, H.J., Nograty, T., Eds.; SPB Academic Publishing: The Hague, The Netherlands, 1995; p. 226. [Google Scholar]
- Smirnov, N.N. Cladocera: The Chydorinae and Sayciinae (Chydoridae) of the world. In Guides to the Identification of the Microinvertebrates of the Continental Waters of the World 11; Dumont, H.J., Ed.; SPB Academic Publishing: The Hague, The Netherlands, 1996; p. 197. [Google Scholar]
- Flöβner, D. Die Haplopoda und Cladocera (ohne Bosminidae) Mitteleuropas; Backhuys Publishers: Leiden, The Netherlands, 2000; p. 428. [Google Scholar]
- Smith, D.G. Pennak’s Freshwater Invertebrates of the United States: Porifera to Crustacea, 4th ed.; John Wiley and Sons: New York, NY, USA, 2001. [Google Scholar]
- Dumont, H.; de Velde, I.V.; Dumont, S. The dry weight estimate of biomass in a selection of Cladocera, Copepoda and Rotifera from the plankton, periphyton and benthos of continental waters. Oecologia 1975, 19, 75–97. [Google Scholar] [CrossRef]
- Bottrell, H.H.; Duncan, A.; Gliwicz, Z.M.; Grygierek, E.; Herzig, A.; Hillbricht-Ilkowska, A.; Kurusawa, H.; Larsson, P.; Weglenska, T. A review of some problems in zooplankton production studies. Norw. J. Zool. 1976, 24, 419–456. [Google Scholar]
- McCauley, E. The Estimation of the Abundance and Biomass of Zooplankton in Samples. In A Manual on Methods for the Assessment of Secondary Productivity in Freshwaters, 2nd ed.; Downing, J.A., Rigler, F.H., Eds.; Blackwell Scientific Publication: New York, NY, USA, 1984; pp. 228–265. [Google Scholar]
- Malley, D.F.; Lawrence, S.G.; Maclever, M.A.; Finlay, W.J. Range and variation in estimates of dry weight for planktonic Crustacea and Rotifera from temperate North American Lakes. Can. Tech. Rep. Fish. Aquat. Sci. 1989, 1666, 1–49. [Google Scholar]
- Michaloudi, E. Dry weights of zooplankton of Lake Mikri Prespa (Macedonia, Greece). Belg. J. Zool. 2005, 135, 223–227. [Google Scholar]
- R Core Team. R: A Language and Environment for Statistical Computing; R Foundation for Statistical Computing: Vienna, Austria, 2016. [Google Scholar]
- Environmental Systems Research Institute. ArcGIS Desktop: Release 10; Environmental Systems Research Institute: Redlands, CA, USA, 2012. [Google Scholar]
- Prasad, A.M.; Iverson, L.R.; Liaw, A. Newer Classification and Regression Tree Techniques: Bagging and Random Forests for Ecological Prediction. Ecosystems 2006, 9, 181–199. [Google Scholar] [CrossRef]
- Hothorn, T.; Hornik, K.; Zeileis, A. Unbiased Recursive Partitioning: A Conditional Inference Framework. J. Comp. Graph. Stat. 2006, 15, 651–674. [Google Scholar] [CrossRef]
- Hothorn, T.; Everitt, B.S. A Handbook of Statistical Analyses Using R; CRC Press: Boca Raton, FL, USA; Taylor and Francis Group: Oxfordshire, UK, 2014. [Google Scholar]
- Benndorf, J. Possibilities and limits for controlling eutrophication by biomanipulation. Int. Rev. Gesamten Hydrobiol. 1995, 80, 519–534. [Google Scholar] [CrossRef]
- Hansson, L.A.; Annadotter, H.; Bergman, E.; Hamrin, S.F.; Jeppesen, E.; Kairesalo, T.; Luokkanen, E.; Nilsson, P.Å.; Søndergaard, M.; Strand, J. Biomanipulation as an application of food-chain theory: Constraints, synthesis, and recommendations for temperate lakes. Ecosystems 1998, 1, 558–574. [Google Scholar] [CrossRef]
- Jeppesen, E.; Søndergaard, M.; Lauridsen, T.L.; Davidson, T.A.; Liu, Z.; Mazzeo, N.; Trochine, C.; Özkan, K.; Jensen, H.S.; Trolle, D.; et al. Biomanipulation as a restoration tool to combat eutrophication: Recent advances and future challenges. Adv. Ecol. Res. 2012, 47, 411–487. [Google Scholar]
- Nowlin, W.H.; Evarts, J.L.; Vanni, M.J. Release rates and potential fates of nitrogen and phosphorus from sediments in a eutrophic reservoir. Freshw. Biol. 2005, 50, 301–322. [Google Scholar] [CrossRef]
- Jeppesen, E.; Søndergaard, M.; Kanstrup, E.; Petersen, B.; Eriksen, R.B.; Hammershøj, M.; Mortensen, E.; Jensen, J.P.; Have, A. Does the Impact of Nutrients on the Biological Structure and Function of Brackish and Freshwater Lakes Differ? In Nutrient Dynamics and Biological Structure in Shallow Freshwater and Brackish Lakes; Springer: Dordrecht, The Netherlands, 1994; pp. 15–30. [Google Scholar]
- Gyllström, M.; Hansson, L.A.; Jeppesen, E.; Garcia-Criado, F.; Gross, E.; Irvine, K.; Kairesalo, T.; Kornijow, R.; Miracle, M.R.; Nykanen, M.; et al. The role of climate in shaping zooplankton communities of shallow lakes. Limnol. Oceanogr. 2005, 50, 2008–2021. [Google Scholar] [CrossRef]
- Van Donk, E.; van de Bund, W.I. Impact of submerged macrophytes including charophytes on phyto- and zooplankton communities: Allelopathy versus other mechanisms. Ecol. Charophytes 2002, 72, 261–274. [Google Scholar] [CrossRef]
- Jeppesen, E.; Søndergaard, M.; Jensen, J.P. Climate warming and regime shifts in lake food webs—Some comments. Limnol. Oceanogr. 2003, 48, 1346–1349. [Google Scholar] [CrossRef]
- Morris, D.P.; Lewis, W.M., Jr. Phytoplankton nutrient limitation in Colorado mountain lakes. Freshw. Biol. 1988, 20, 315–327. [Google Scholar] [CrossRef]
- Chow-Fraser, P.; Trew, D.O.; Findlay, D.; Stainton, M. A test of the hypothesis to explain the sigmoid relationships between total phosphorus and chlorophyll concentrations in Canadian lakes. Can. J. Fish. Aquat. Sci. 1994, 51, 2052–2065. [Google Scholar] [CrossRef]
- May, L.; Spears, B.M.; Dudley, B.J.; Hatton-Ellis, T.W. The importance of nitrogen limitation in the restoration of Llangorse Lake, Wales, UK. J. Environ. Monit. 2010, 12, 338–346. [Google Scholar] [CrossRef] [PubMed]
- Fogg, G.E. The Leeuwenhoek Lecture, 1968: The physiology of an algal nuisance. Proc. R. Soc. Lond. B Biol. Sci. 1969, 173, 175–189. [Google Scholar] [CrossRef]
- Intergovernmental Panel on Climate Change. Summary for Policymakers. In Climate Change 2014: Impacts, Adaptation, and Vulnerability. Part A: Global and Sectoral Aspects. Contribution of Working Group II to the Fifth Assessment Report of the Intergovernmental Panel on Climate Change; Field, C.B., Barros, V.R., Dokken, D.J., Mach, K.J., Mastrandrea, M.D., Bilir, T.E., Chatterjee, M., Ebi, K.L., Estrada, Y.O., Genova, R.C., Eds.; Cambridge University Press: Cambridge, UK; New York, NY, USA, 2014; pp. 1–32. [Google Scholar]
- Wetzel, R.G. Limnology, 2nd ed.; Saunders College Publishing: New York, NY, USA, 1983; p. 767. [Google Scholar]
- Talling, J.F. Environmental controls on the functioning of shallow tropical lakes. Hydrobiologia 2001, 458, 1–8. [Google Scholar] [CrossRef]


© 2017 by the authors. Licensee MDPI, Basel, Switzerland. This article is an open access article distributed under the terms and conditions of the Creative Commons Attribution (CC BY) license ( http://creativecommons.org/licenses/by/4.0/).
Share and Cite
Beklioğlu, M.; Bucak, T.; Coppens, J.; Bezirci, G.; Tavşanoğlu, Ü.N.; Çakıroğlu, A.İ.; Levi, E.E.; Erdoğan, Ş.; Filiz, N.; Özkan, K.; et al. Restoration of Eutrophic Lakes with Fluctuating Water Levels: A 20-Year Monitoring Study of Two Inter-Connected Lakes. Water 2017, 9, 127. https://doi.org/10.3390/w9020127
Beklioğlu M, Bucak T, Coppens J, Bezirci G, Tavşanoğlu ÜN, Çakıroğlu Aİ, Levi EE, Erdoğan Ş, Filiz N, Özkan K, et al. Restoration of Eutrophic Lakes with Fluctuating Water Levels: A 20-Year Monitoring Study of Two Inter-Connected Lakes. Water. 2017; 9(2):127. https://doi.org/10.3390/w9020127
Chicago/Turabian StyleBeklioğlu, Meryem, Tuba Bucak, Jan Coppens, Gizem Bezirci, Ü. Nihan Tavşanoğlu, A. İdil Çakıroğlu, Eti E. Levi, Şeyda Erdoğan, Nur Filiz, Korhan Özkan, and et al. 2017. "Restoration of Eutrophic Lakes with Fluctuating Water Levels: A 20-Year Monitoring Study of Two Inter-Connected Lakes" Water 9, no. 2: 127. https://doi.org/10.3390/w9020127