Article

Relating Watershed Characteristics to Elevated Stream Escherichia coli Levels in Agriculturally Dominated Landscapes: An Iowa Case Study

Department of Agricultural & Biosystems Engineering, Iowa State University; Ames, IA 50010, USA
*
Author to whom correspondence should be addressed.
Water 2017, 9(3), 154; https://doi.org/10.3390/w9030154
Submission received: 3 January 2017 / Revised: 19 February 2017 / Accepted: 20 February 2017 / Published: 23 February 2017

Abstract

:
Fecal Indicator Bacteria (FIB) such as Escherichia coli (E. coli) are a leading cause of surface water impairments in the United States. However, the relative impacts of different watershed characteristics on microbial water quality in agriculturally dominated watersheds are unclear. Spatial and statistical analyses were utilized to examine relationships between watershed characteristics and FIB and a multiple regression model was created. Geometric mean E. coli concentration data were obtained for 395 ambient water quality monitoring locations in Iowa. Watersheds were delineated for thirty randomly selected monitoring locations and drainage areas ranged from 93 to 1.1 million hectares. Watershed characteristics examined include area, presence of animal units (open feed lots and confinements), percent of watershed area receiving manure application, presence of point-source discharges, and land cover. The results from the analyses reveal that the presence of animal feeding operations and agriculture, wetland, and woody vegetation land covers are the most influential watershed characteristics regarding E. coli concentration. A significant positive correlation was identified between E. coli concentration and agriculture while significant negative correlations were identified with animal feeding operations and wetland and woody vegetation. Establishing relationships between watershed characteristics and presence of E. coli is needed to identify dominant watershed characteristics contributing to pathogen water impairments and to prioritize remediation efforts.

1. Introduction

It is well documented that waste from agricultural livestock operations contributes to contamination of waters by Fecal Indicator Bacteria (FIB) and microbial pathogens. For example, Animal waste can enter water bodies from leaking or overflowing waste lagoons or through runoff from fields amended with animal manure [1,2,3,4]. In many watersheds, wildlife such as geese and deer are a significant source of E. coli [5,6,7]. E. coli is also associated with point-source discharges of human wastes such as those which occur at wastewater treatment plants [8]. The concentration of fecal coliforms in treatment plant effluent depends on flow, treatment type, and the target bacterial population [9,10]. In addition, some strains of E. coli that possess the virulence characteristics of uropathogenic strains can survive the wastewater treatment process [11,12]. In areas without wastewater treatment plants, leaking septic systems may release FIB [6,13].
In the United States, waters are assessed as impaired if they do not support one or more of their designated uses. The leading cause of water quality impairment in U.S. rivers is elevated FIB levels [14]. Similarly, FIB is the leading cause of water quality impairments in Iowa rivers and streams and accounts for 378 of the 703 impaired river/stream segments identified in Iowa’s 2014 303(d) list of impaired waters [15]. The presence of pathogens in waters is typically confirmed through the presence of FIB such as E. coli or enterococci [14]. In 2012, the United States Environmental Protection Agency (U.S. EPA) revised recreational water quality criteria to better protect recreators from exposure to microorganism originating from fecal sources. The U.S. EPA recommended geometric mean (GM) criteria is 126 colony forming units (CFU)/100 mL for E. coli, which relates to an estimated illness rate of 36 per 1000 [16].
After a waterbody is classified as impaired in the United States, a water quality improvement plan or Total Maximum Daily Load (TMDL) must be set to identify the load reductions necessary to meet water quality standards. Watershed scale water quality models are often used to model pollutant loads and determine the necessary load reductions to meet the TMDL target. However, many of the common models are limited in their ability to predict bacterial loads to surface waters. Specifically, current watershed scale models ignore subsurface transport of microorganisms and the complex sediment and microorganism interactions are overly simplified in the model processes that simulate microbial transport in surface runoff [17,18].
Therefore, Geographic Information System (GIS) tools are increasingly being used to address FIB impairments. For example, Crowther, Kay and Wyer [1] identified strong positive correlations (p < 0.01) between presumptive coliform, presumptive E. coli, and presumptive streptococci concentrations with the land use and farming practices associated with intensive livestock farming in two agricultural UK watersheds. They concluded that generic statistical models, based on land use and farm management data, may be able to predict microbial water quality due to the significant relationships between high-flow FIB concentration and land use/farming practices. A study conducted by Sliva and Williams [19] identified seasonal correlations between fecal coliform concentrations and catchment and river buffer land cover in three southern Ontario watersheds. In addition, they concluded that urban land use is the most essential watershed characteristic in predicting water quality variability. In Ohio, Tong and Chen [20] found strong positive correlations between fecal coliform concentrations and commercial, residential, and agricultural land uses. Finally, Pandey, et al. [21] assessed the impacts of land cover on in-stream E. coli concentrations. Their results show that in-stream E. coli concentration is significantly (p < 0.01) influenced by areas receiving manure, wetlands, drained land, and cropped land. These studies have demonstrated the effectiveness of GIS as a tool to examine many water quality parameters at a wide range of catchment scales.
Although previous studies have identified positive correlations between watershed characteristics and FIB, these works are limited in data obtained through convenience samples, low numbers of watersheds studied, omission of certain watershed characteristics, or a study design focused on water quality parameters other than FIB. These factors often do not allow for random sampling, which raises concerns regarding violation of inherent assumption of independence of errors [22]. To achieve independence, watersheds are randomly selected from a larger dataset. Furthermore, as the number of watersheds in the study increases, the power of the statistical analyses also increases [23]. Previously, land cover analysis has been limited to general categories such as agriculture, forest, and urban. However, analysis of detailed land cover categories, including water and types of wetlands, forests, grasslands, crops, and urban areas, provides more useful data for modeling and placement of conservation practices. Previous works also have not investigated the influence of other watershed characteristics such as number of point-source dischargers, presence of animal feeding operations (AFOs), or extent of manure application. Point source-dischargers, such as wastewater treatment plants, typically use chlorination, UV irradiation, or ozonation to disinfect their effluent. However, increases in bacterial abundance have been observed downstream of wastewater treatment plants [24,25]. Animal Feeding Operations are a significant risk of FIB impairment through three primary sources: accumulated manure in open and unpaved feedlots; manure stored in holding ponds, lagoons, and uncovered stockpiles; and from excess manure and wastewater applied to land [26]. FIB can enter the environment from leaks or overflows in manure storage structures [4]. It is also well known that FIB can be transported from manure-applied agricultural fields during precipitation events [2,3]. In addition, manure is often applied to fields in excess of agronomic rates due to a surplus of manure, especially in areas with high animal concentrations [26]. These factors make AFOs and manure application high risk sources of FIB impairment and ones that must be analyzed in greater detail in GIS based studies.
This study aims to provide a thorough analysis of the correlations between FIB concentration and watershed characteristics in agriculturally dominated landscapes. Specifically, this study expands upon the work of previous studies by focusing exclusively on FIB, analyzing a larger sample size, performing a detailed land cover analysis, and including a more extensive suite of watershed characteristics. Here, we correlate the presence of E. coli in streams with the respective watershed characteristics. Specific watershed characteristics considered included watershed area, land cover, watershed area receiving manure application, presence of point-source dischargers, and number of animal units (open feed lots and confinements). Establishing a correlation between watershed characteristics and E. coli concentration is needed to identify dominant watershed characteristics contributing to bacterial water impairments and to prioritize remediation efforts.

2. Materials and Methods

The study was conducted in watersheds in Iowa, U.S.A., an agriculturally intensive state; over 90% of Iowa’s land is used for agriculture and the state ranks 1st in the U.S. for corn production and 2nd in the U.S. for soybean production. Iowa is also the nation’s leader in egg production and ranks second in the nation in red meat production. In addition, Iowa is the nation’s leader in hog production with an estimated 20.9 million hogs in the state totaling about 32% of the nation’s hogs. Other animals produced in Iowa include sheep, chickens, and turkeys [27].
E. coli concentration data were provided by Iowa Department of Natural Resources (IDNR) for 395 Iowa stream and river sites in the U.S. EPA Storage and Retrieval (STORET) environmental data system. Data were collected from 2010 to 2012 with an average of 21 grab samples per location. The grab samples were collected as part of various water quality monitoring programs including the IDNR’s ambient water quality monitoring program, ambient monitoring networks from the United States Geological Survey and United States Army Corps of Engineers, drinking water utilities such as the Des Moines Water Works, and local watershed monitoring projects such as the Turkey River Watershed Project. A three-year average E. coli GM concentration was calculated for each site and the data are presented as a bar chart in Figure 1. Each bar on the x-axis represents one of the 395 sites; sites were ranked in order of ascending E. coli GM concentration to aid in the selection of sites for detailed analysis.
To explore relationships in watershed characteristics and water quality data, thirty of the STORET monitoring sites were selected for spatial analysis. The 395 STORET sites were ranked in order of ascending E. coli GM concentration and three subsets of 10 randomly selected STORET sites were selected using the subset tool in the JMP software package (SAS); 10 sites were selected from the lowest 10% of GM E. coli (8–105 CFU/100 mL), 10 from the middle 10% (415–561 CFU/100 mL), and 10 from the highest 10% (1,536–31,311 CFU/100 mL). The E. coli GM concentrations were spatially joined to the Iowa STORET monitoring sites and the 30 randomly selected monitoring sites are shown in Figure 2.

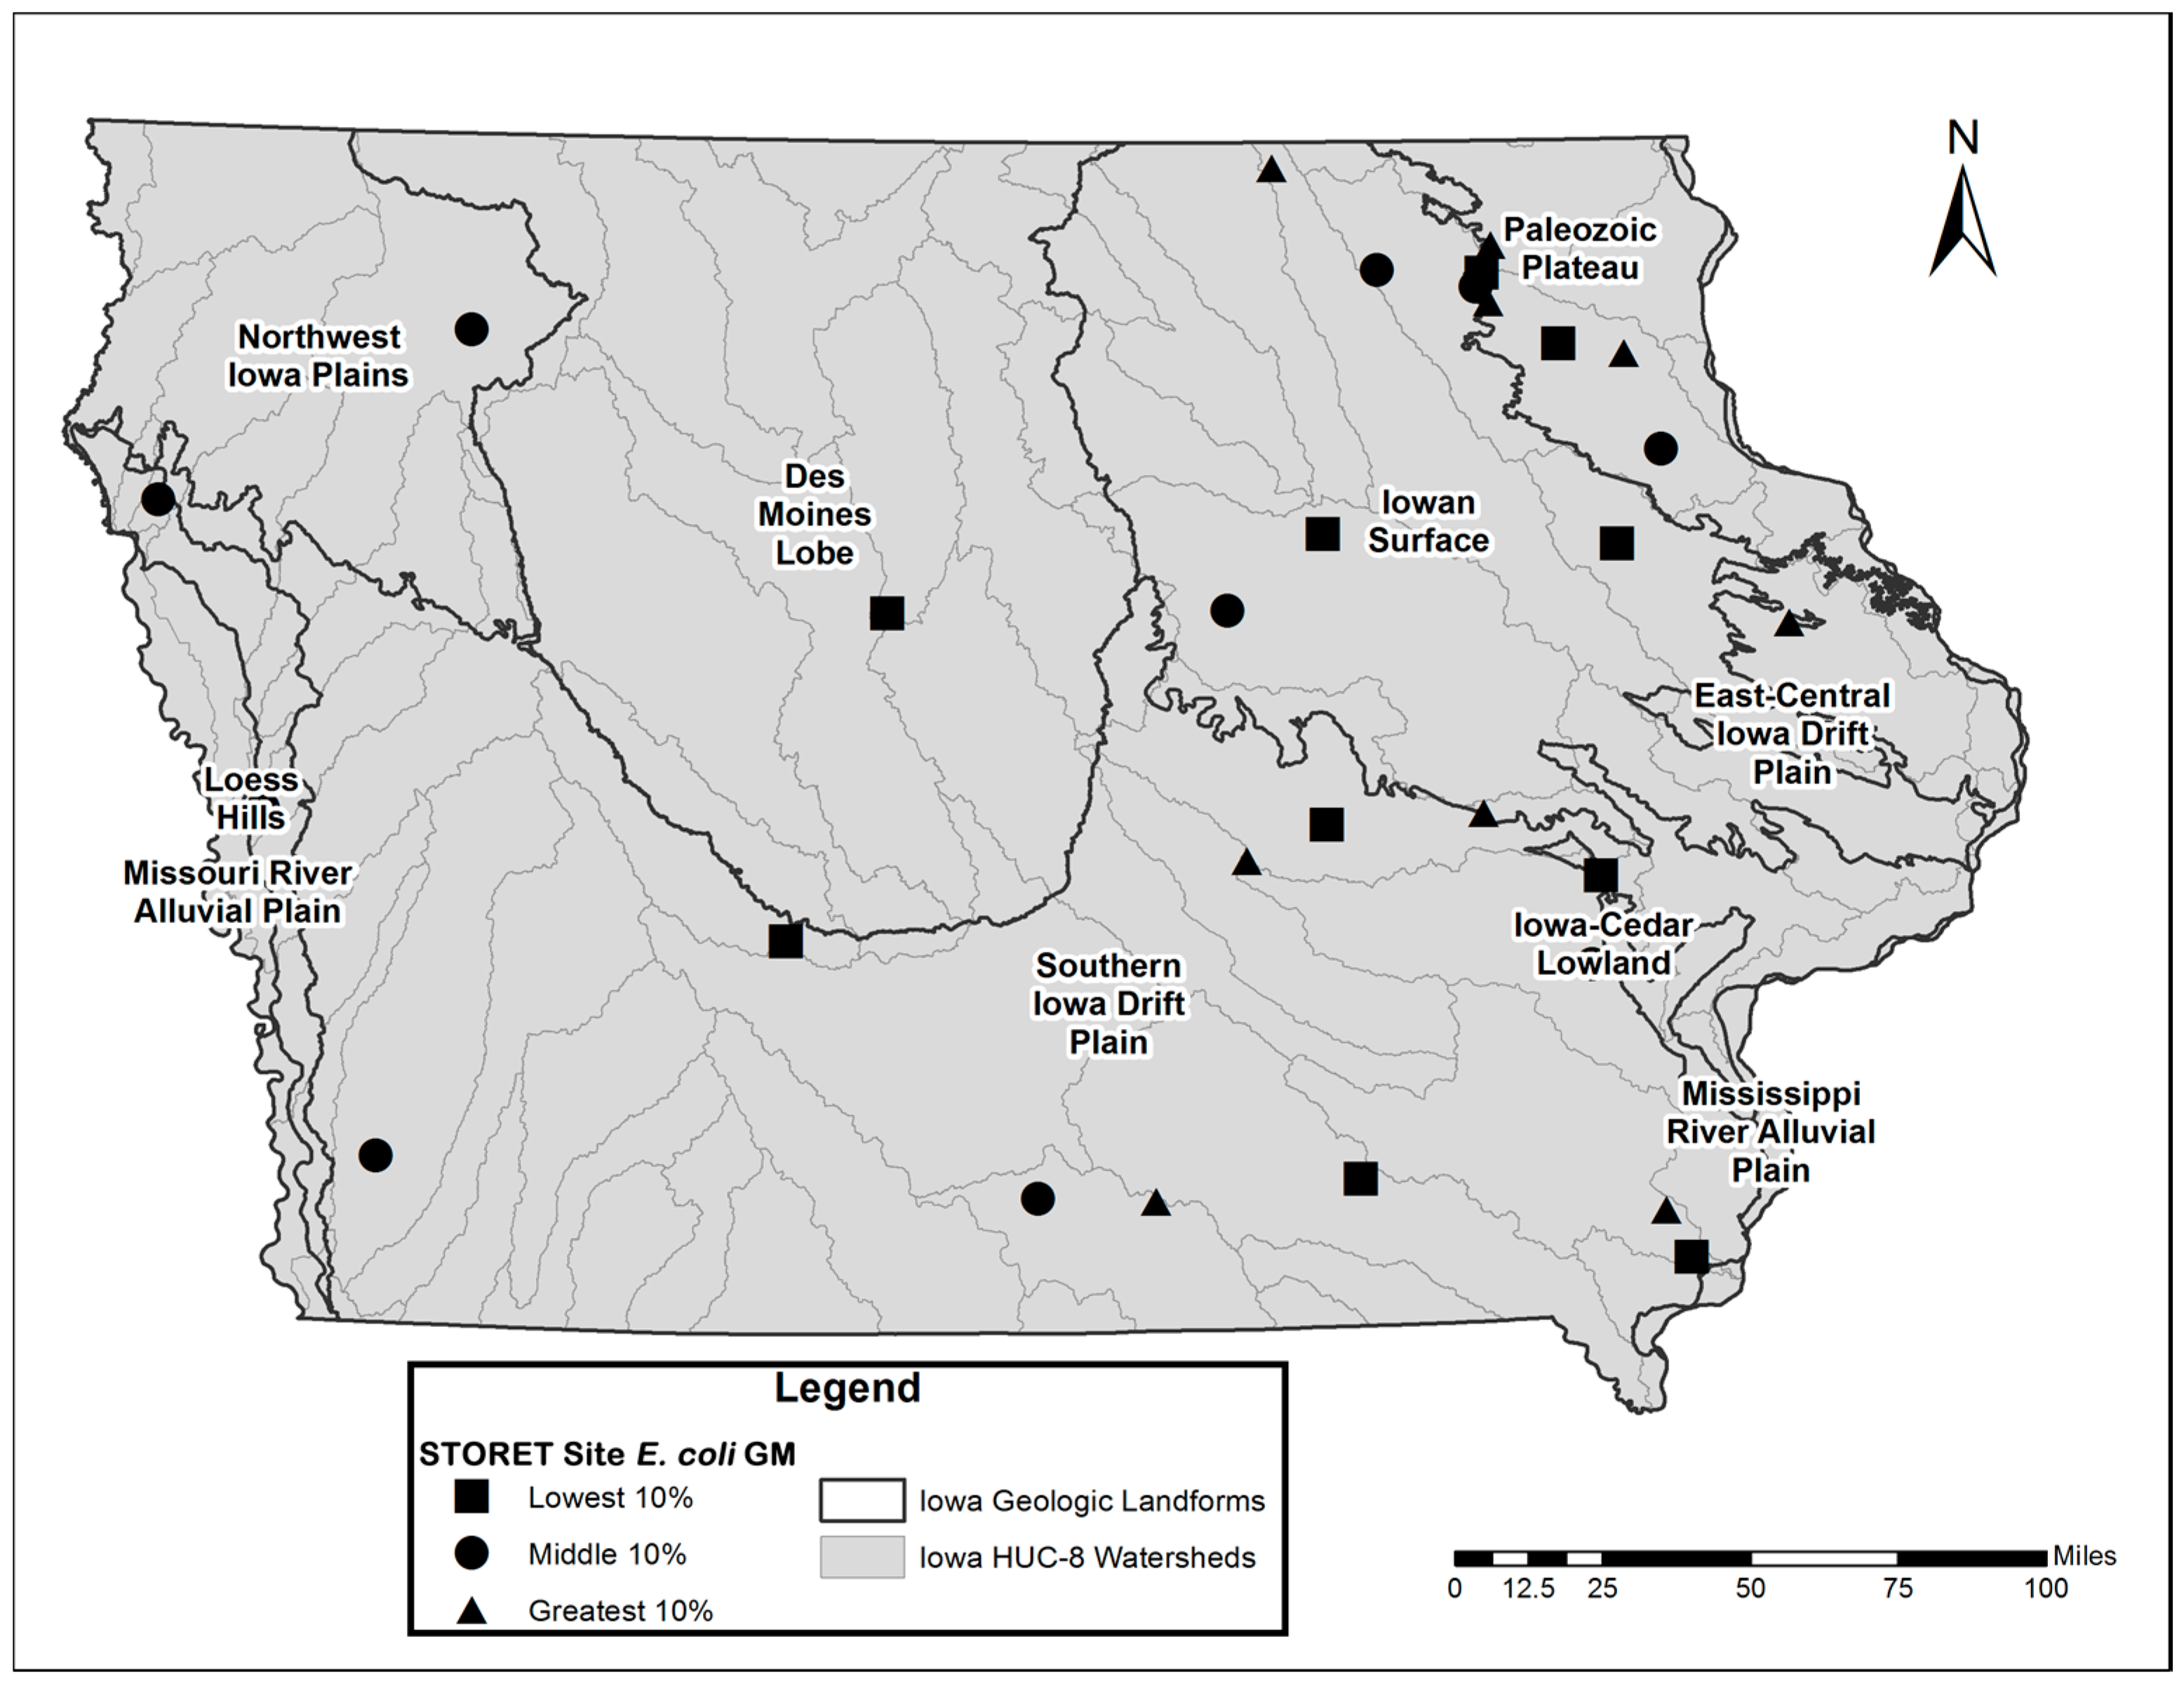
2.1. Watershed Delineation

A single, 30-m raster grid Digital Elevation Model (DEM) for all of the Iowa watersheds was created for use in watershed delineations. The National Elevation Datasets (NEDs) for Illinois, Iowa, Minnesota, Missouri, South Dakota, and Wisconsin were combined in ArcGIS (Redlands, CA, USA) so any overlapping NEDs would be horizontally weighted to produce the output cells [28].
To determine the watershed area of each monitoring location, watershed delineations were performed for each of the 30 sites using the automatic watershed delineation tool in ArcSWAT (Temple, TX, USA) [29]. The National Hydrography Dataset (NHD) Flowlines layer was burned into the DEM so SWAT would produce more accurate stream reaches for the DEM based delineation. After the watershed delineation was completed for each of the 30 monitoring sites, the Animal Feeding Operation (AFO) Confinements, AFO Feedlots, National Pollution Discharge Elimination System (NPDES) Facilities, Manure Application Areas, and Land Cover layers were added to the maps for each of the respective monitoring sites and clipped to the watershed boundaries. A summary of data layer sources is provided in Table 1 and an example delineated watershed with GIS layers is included online as Figure S1.

2.2. GIS Data

The Iowa STORET monitoring locations coverage was created by the IDNR from multiple sources including Universal Transverse Mercator (UTM) coordinate data from the University of Iowa Hygienic Lab, United States Geologic Survey (USGS) National Water Information System (NWIS) data, topographic maps, aerial photographs, and GPS data. The 2013 edition of the STORET locations coverage was used in this analysis because it was the most current version available. Both the National Elevation Dataset (NED) and National Hydrology Dataset (NHD) coverages were developed by the USGS.
The 2010 edition of Iowa NPDES Facilities coverage was the most recent edition available for the E. coli sampling period. This coverage was developed by the IDNR and includes all municipal, industrial, and semi-public wastewater treatment facilities in Iowa in the NPDES program. According to this coverage, there are 1918 facilities in Iowa with a NPDES permit. The total number of point-source discharges was summed as the number of NPDES Facilities for each watershed. In addition, the density of NPDES Facilities in facilities per 1000 hectares was calculated.
Two land cover coverages were used in this analysis: the 2002 Iowa Land Cover layer developed by the IDNR and the 2012 Iowa Cropland Data coverage developed by the USDA. The two land cover coverages each provide unique benefits to the spatial analysis. The IDNR coverage provides a greater ground resolution of 15-m over the USDA coverage’s 30-m resolution. However, the USDA coverage provides a greater number of land cover categories and includes data from the E. coli sampling period. Furthermore, the two coverages have different sub-divisions for the grassland, forest, wetland, and urban land covers. The IDNR layer was developed using data from satellite imagery collected between May 2002 and May 2003. Several editions of this coverage have been released and the 2011 edition was used in this analysis because it was the most current version available. Land cover categories included in this coverage are: Unclassified, Water, Wetland, Bottomland Forest, Coniferous Forest, Deciduous Forest, Ungrazed Grassland, Grazed Grassland, Planted Grassland, Alfalfa/Hay, Corn, Soybeans, Other Rowcrop, Roads, Commercial/Industrial, Residential, Barren, and Clouds/Shadow/No Data. The USDA coverage was created using satellite imagery during the 2012 growing season. Land cover categories included in this coverage are: Corn, Sorghum, Soybeans, Sweet Corn, Pop or Orn Corn, Barley, Spring Wheat, Winter Wheat, Double Crop Winter Wheat/Soybeans, Rye, Oats, Millet, Alfalfa, Other Hay/Non Alfalfa, Camelina, Potatoes, Other Crops, Peas, Herbs, Clover/Wildflowers, Sod/Grass Seed, Switchgrass, Fallow/Idle Cropland, Apples, Open Water, Developed/Open Space, Developed/Low Intensity, Developed/Medium Intensity, Developed/High Intensity, Barren, Deciduous Forest, Evergreen Forest, Mixed Forest, Shrubland, Grass/Pasture, Woody Wetlands, Herbaceous Wetlands, Triticale, Double Crop Winter Wheat/Corn, Double Crop Winter Wheat/Sorghum, Double Crop Soybeans/Oats, and Double Crop Corn/Soybeans. To compare the results of this study to those of previous studies, the IDNR land cover classes for Ungrazed Grassland, Grazed Grassland, Planted Grassland, Alfalfa/Hay, Corn, Soybeans, and Other Row Crop were also combined into a Total Agriculture land cover group. Similarly, the IDNR land cover classes for Bottomland Forest, Coniferous Forest, and Deciduous Forest were combined into a Total Forest land cover group. Finally, the IDNR land cover classes for Roads, Commercial/Industrial, and Residential were combined into a Total Urban/Developed land cover group. Land cover groups were also created from the land cover classes of the USDA coverage. According to the USDA land cover class categorization codes, a Total Crops land cover group was created by combining the Corn, Sorghum, Soybeans, Sweet Corn, Pop or Orn Corn, Potatoes, Other Crops, Peas, Herbs, Clover/Wildflowers, Sod/Grass Seed, Switchgrass, Apples, Triticale, Double Crop Winter Wheat/Corn, Double Crop Winter Wheat/Sorghum, Double Crop Soybeans/Oats, and Double Crop Corn/Soybeans land cover classes. A similar Total Grains/Hay/Seeds land cover group was created by combining the Barley, Spring Wheat, Winter Wheat, Double Crop Winter Wheat/Soybeans, Rye, Oats, Millet, Alfalfa, Other Hay/Non Alfalfa, and Camelina land cover classes. The Total Crops and Total Grains/Hay/Seeds land cover groups were combined, along with the Fallow/Idle Cropland and Grass/Pasture land cover classes, into a Total Agriculture land cover group for the USDA coverage. A USDA Total Forest land cover group was created by combining the Deciduous Forest, Evergreen Forest, and Mixed Forest land cover classes. Finally, a Total Urban/Developed land cover group was created for the USDA coverage by combining the Developed/Open Space, Developed/Low Intensity, Developed/Medium Intensity, and Developed/High Intensity land cover classes.
The 2013 edition of the Iowa AFO Confinements and the 2012 edition of the Iowa AFO Feedlots coverages were the most current versions available for the E. coli sampling period. The IDNR developed the AFO confinements and AFO feedlots coverages using data collected by Iowa Animal Feeding Operations Program. The facilities included in this program are large operations requiring a permit or manure management plan, operations that volunteered to provide information to the IDNR, or operations with a compliance issue [30]. Animals are confined (kept and fed for 45 or more days per year) in both confinements and open feedlots and both types of AFOs include manure storage structures [31]. The IDNR differentiates confinements and feedlots based upon their roofs; confinements are totally roofed and open feedlots are partially or totally unroofed. The regulations affecting an operation are based on the size, type, and age of the facility. In Iowa, confinement feeding operations must retain all manure; however, in Iowa, open feedlots with a NPDES permit may discharge to surface waters during certain conditions stated in their permit such as during storm events larger than a 25-year, 24-h storm [31]. Using the AFO Open Feedlot and AFO Confinement coverages, there are 2627 open feedlots and 8317 confinements in the state. The total number of confinements, feedlots, and animal units were summed from the AFO Confinements and AFO Feedlots attribute tables. In addition, the density of confinements, feedlots, and total AFOs in number per 1000 hectares was calculated.
The only available version of the Iowa Manure Application Areas coverage was developed by the IDNR in 2006. This coverage represents the land area needed to utilize the amount of nitrogen in the manure generated by the number of animals in the 2006 version of the AFO coverage at an application rate of 160 pounds of nitrogen per acre. When land applying manure, farmers must follow IDNR regulations; these regulations are based on the size, type of operation, and type of manure storage. Using the Manure Application Areas coverage, an estimated 1900 square kilometers of land in Iowa received manure application in 2006, representing 1.3% of the total area of Iowa.

2.3. Analysis

By comparing stream E. coli GM concentrations in watersheds with a variety of watershed characteristics, the relative impacts of watershed characteristics on water quality could be determined. The watersheds delineated in this study ranged from 93 to 1,115,956 ha. Spearman’s rank correlation coefficients (rs) were calculated for all 30 randomly selected watersheds using JMP (Cary, NC, USA) to examine relationships between E. coli GM concentrations and watershed area, number of AFO confinements, number of AFO feedlots, AFO confinement density, AFO feedlot density, total AFO density, total number of animal units, animal unit density, percent of land area receiving manure application, total number of point-source discharges, density of point-source dischargers, and percent of land area by land cover category [32]. An rs value is equal to the Pearson correlation between the ranks of two variables. An rs value of 1 represents a perfect positive correlation of ranks, a value of −1 represents a perfect negative correlation of ranks, and a value of 0 represents no correlation between ranks. The p-values were calculated for each analysis using JMP, and p-values less than 0.1 were considered significant. A stepwise least squares multiple regression model was created in JMP using backward elimination with E. coli concentration as the dependent variable to assess the relative impacts of different watershed characteristics. A final model was selected when all model variables had p-values less than 0.1. Variance Inflation Factors (VIF) were calculated for each of the model variables to test for collinearity. A VIF value of 1 indicates no correlation between the variable and the remaining predictor variables and VIF values less than 10 were considered acceptable [33,34,35,36]. In order to evaluate the model, a coefficient of determination (R2) was calculated and an analysis of variance was performed using JMP.

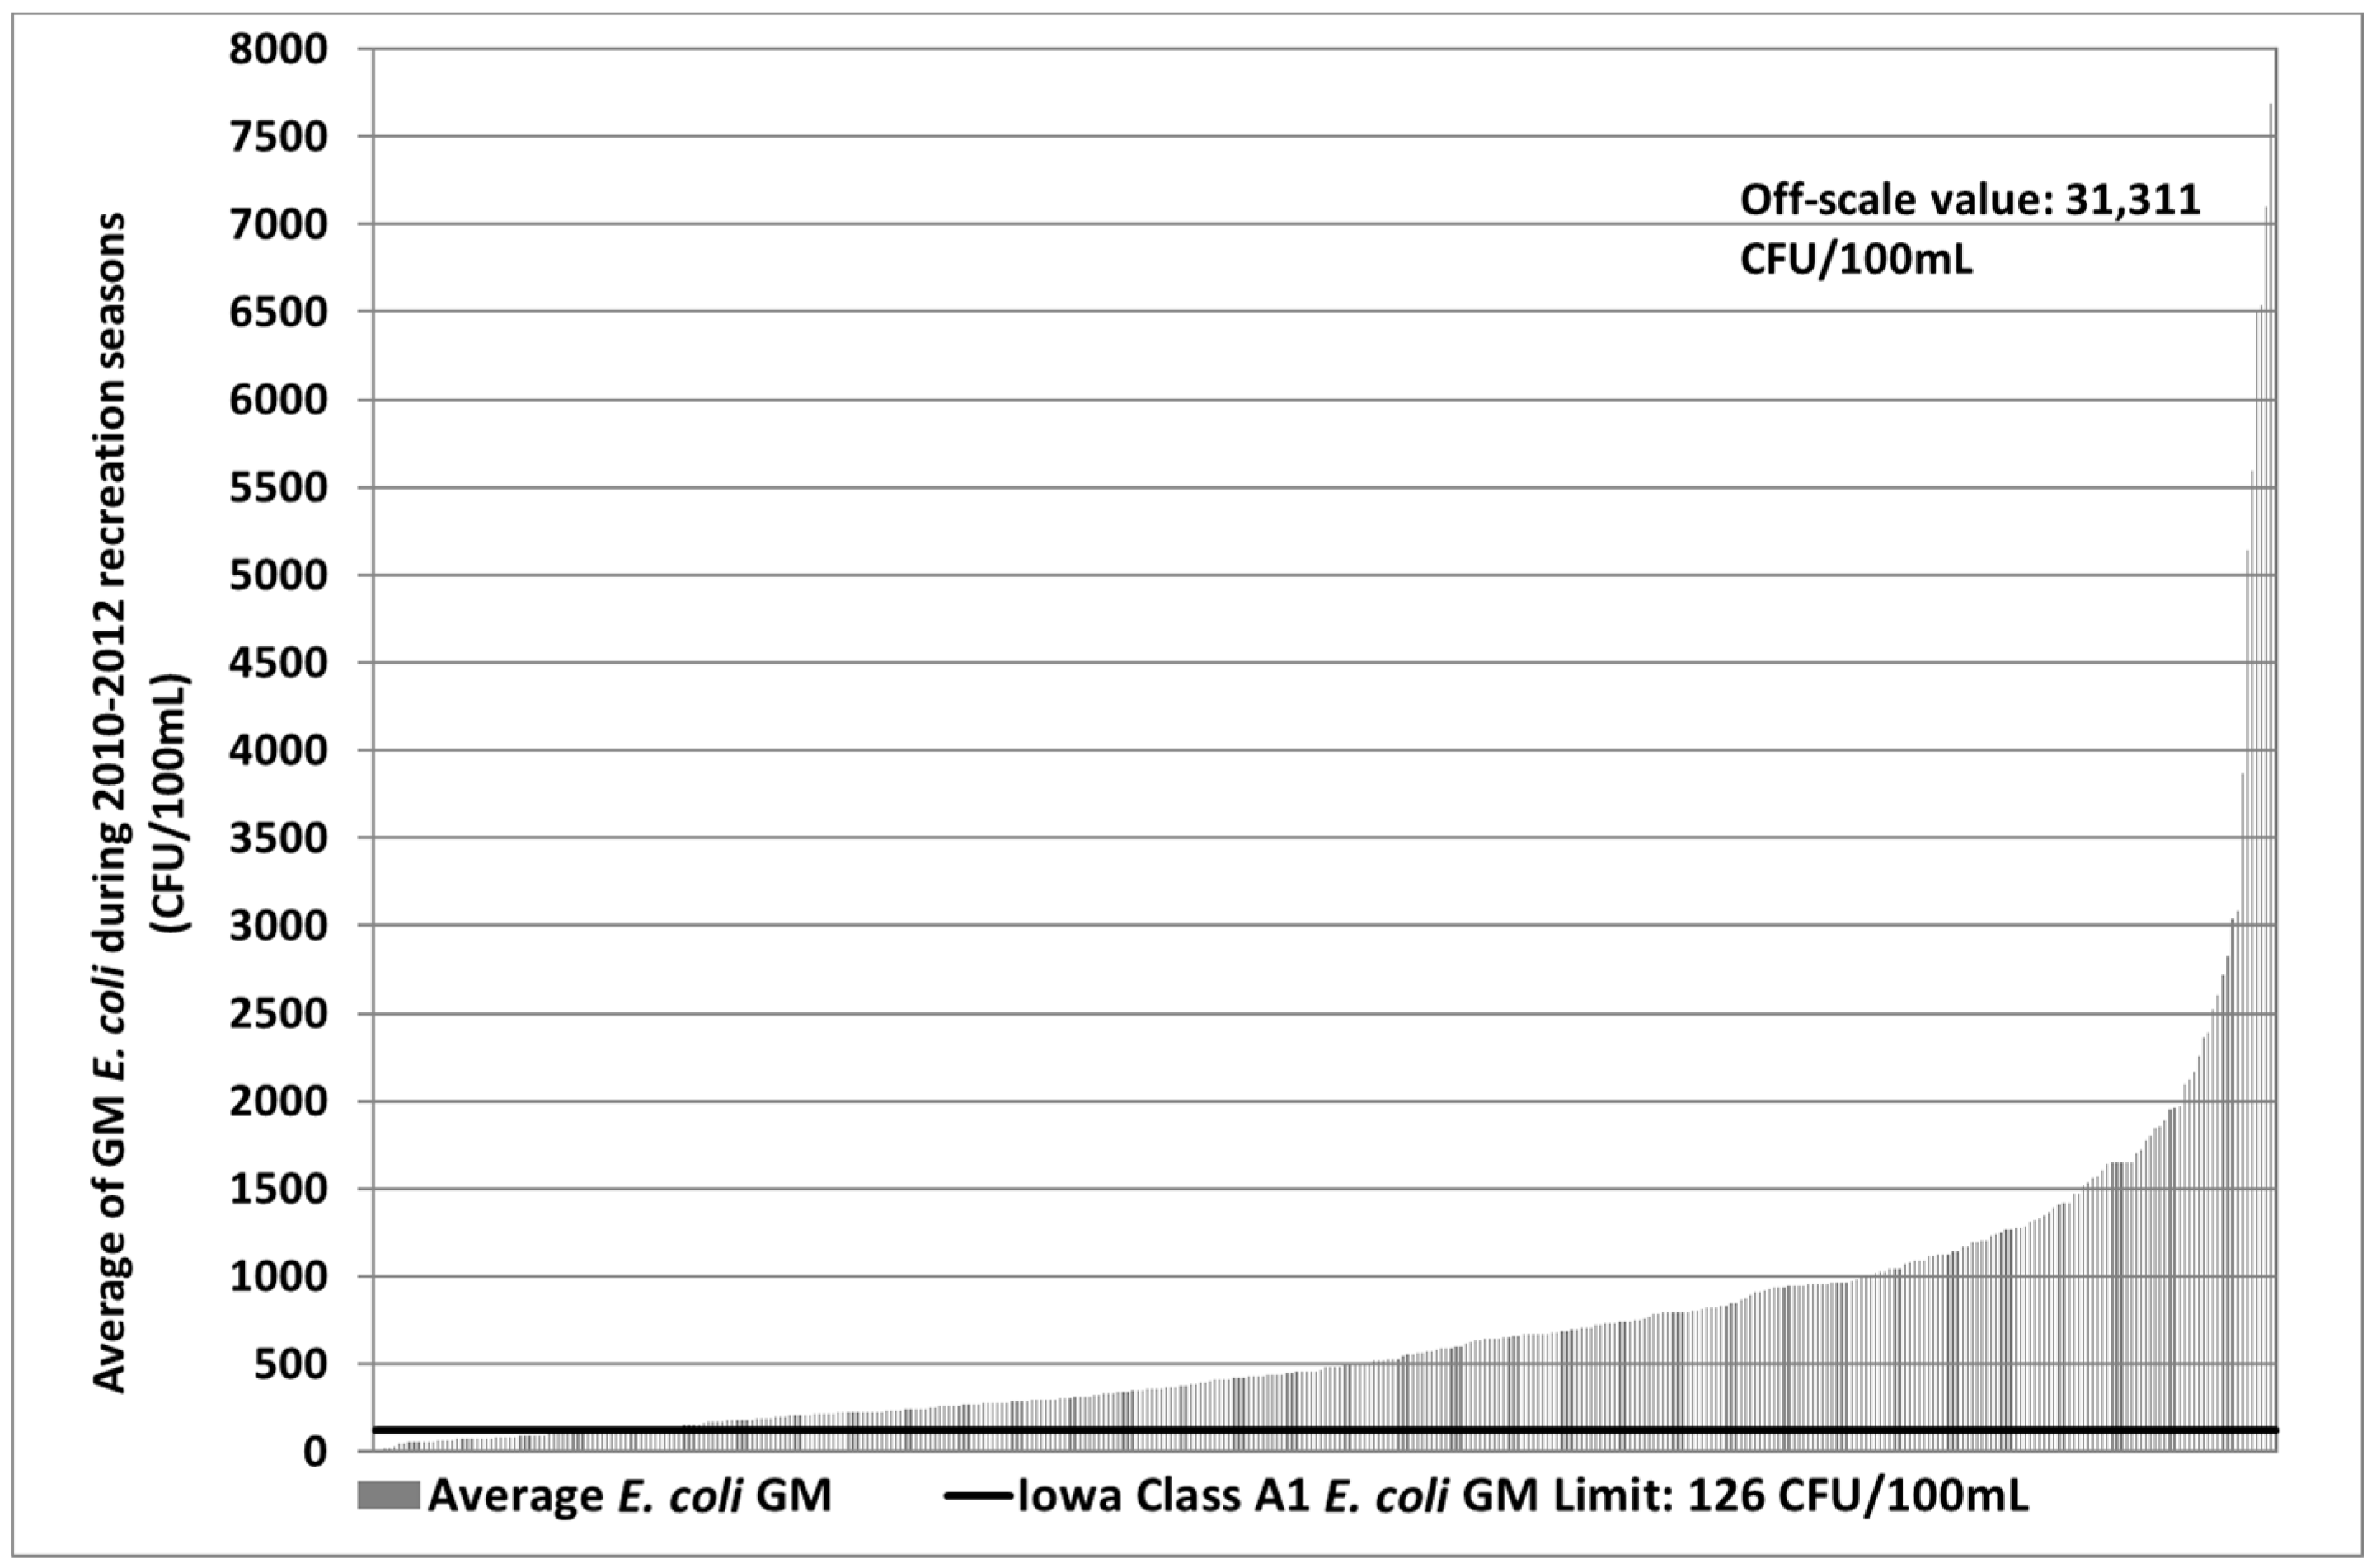
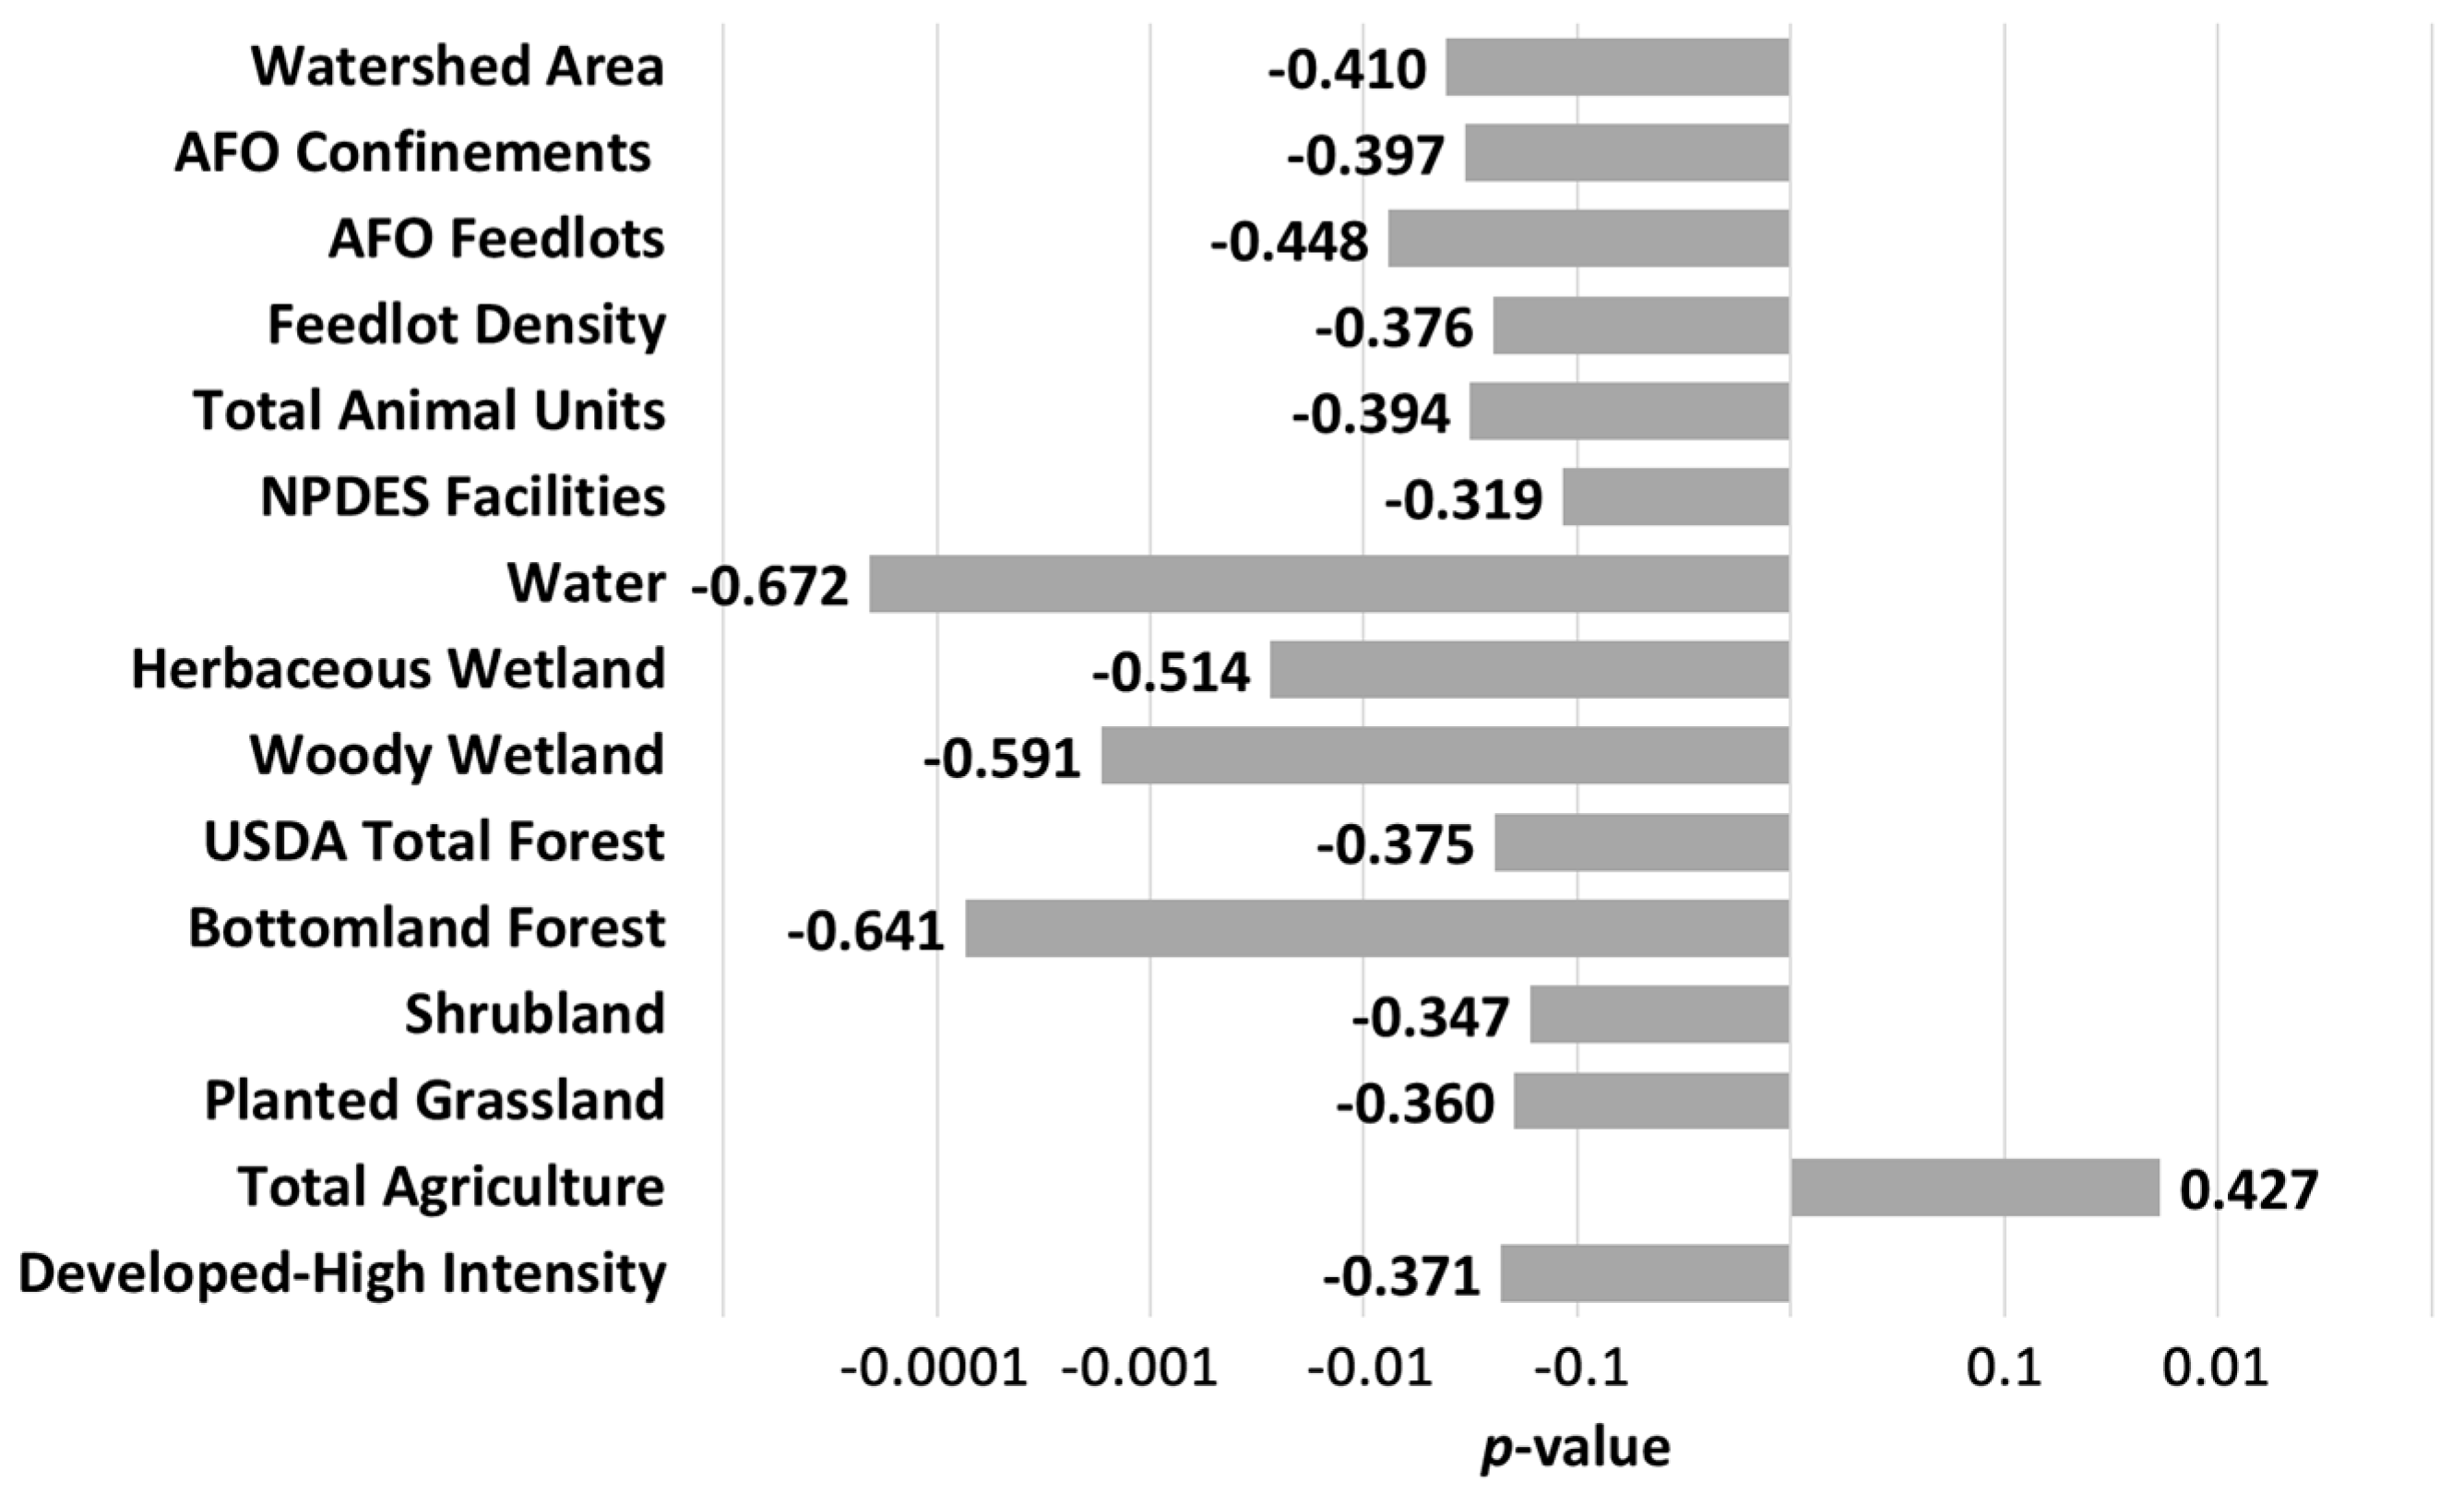
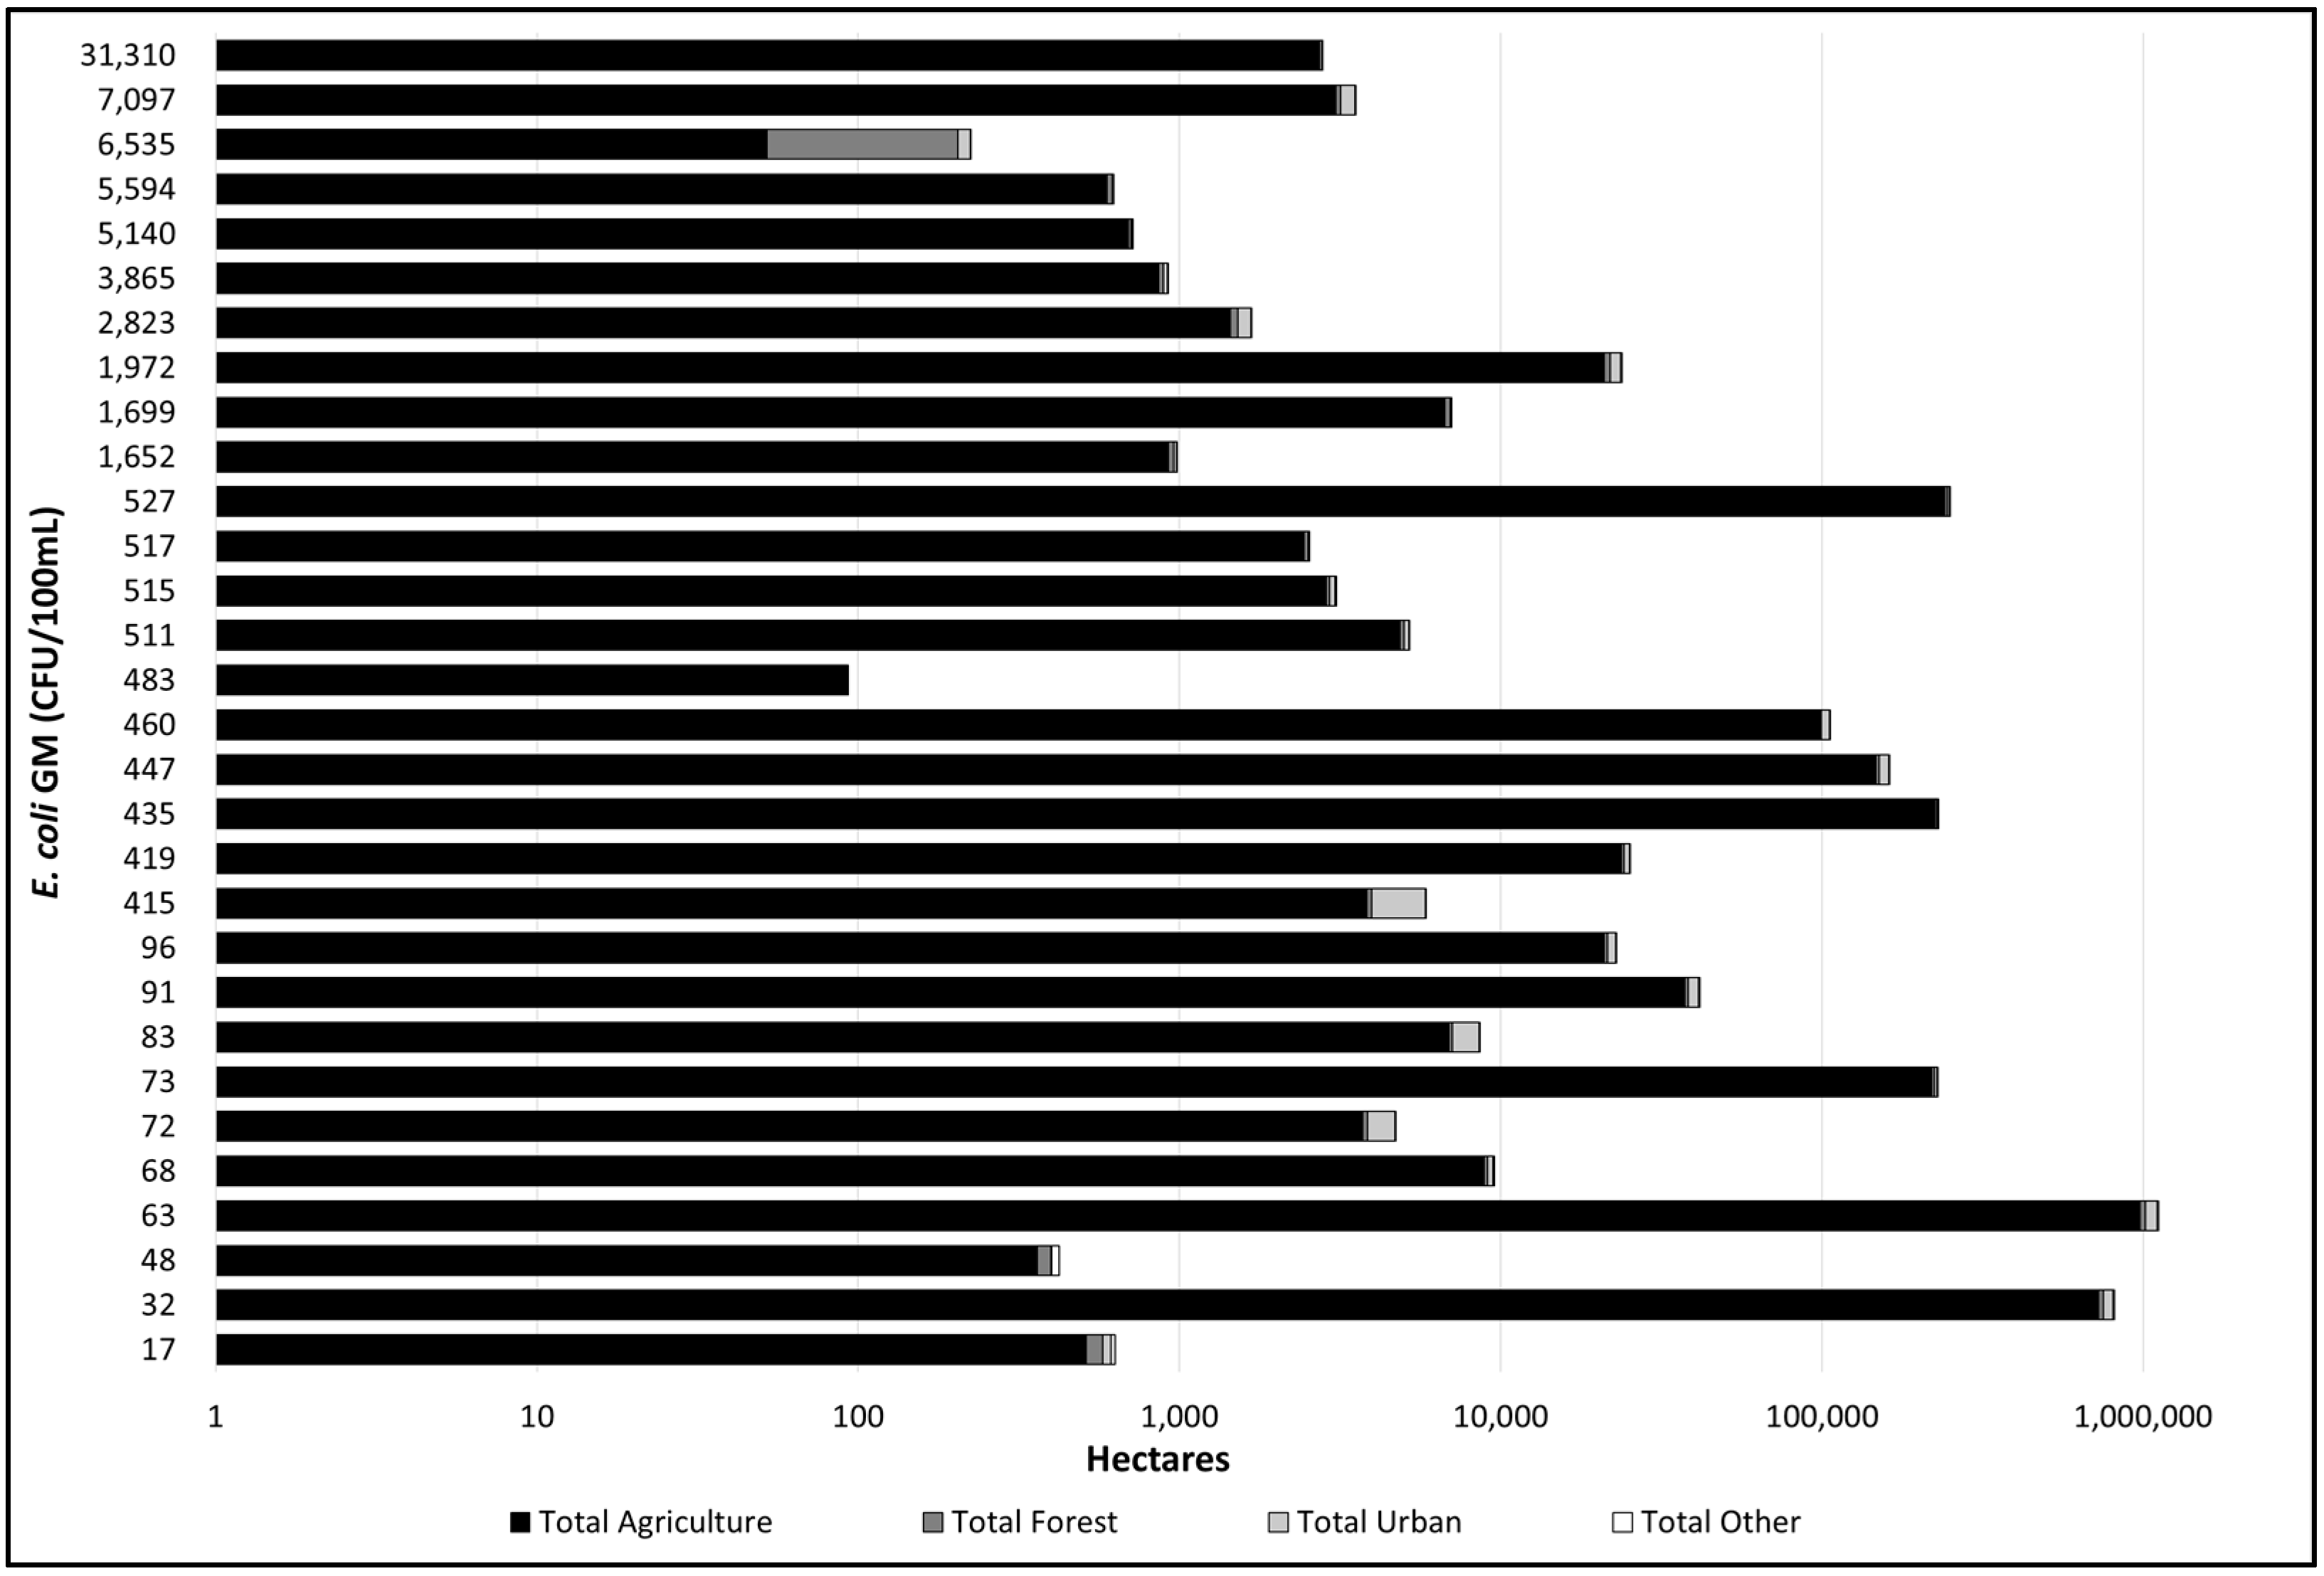
3. Results and Discussion

A Spearman’s rank correlation analysis was performed on the E. coli GM at each site versus the watershed area, total number of animal units, presence of AFO confinements and feedlots, presence of point-source discharges, percent of land area receiving manure application, and percent of land area by land cover category. The results of the Spearman’s rank analysis of the 30 randomly selected watersheds are summarized in Figure 3; the bars represent the magnitude of the p-values and positive and negative directions of ordinates depicts positive and negative Spearman’s rank correlations between E. coli and the corresponding watershed characteristics. The data labels for each bar represent the rs values for the respective watershed characteristic. Any p-values of < 0.0001 were displayed as 0.0001. A detailed discussion of the watershed characteristics follows below.

3.1. Watershed Area

A statistically significant negative correlation (rs = −0.4104, p = 0.0242) was calculated between watershed area and E. coli concentrations in streams for the 30 randomly selected watersheds. This important finding, also reported by Harmel, et al. [37], should be incorporated into bacterial modeling and decision-making. As watershed size increases, so does the distance between land applied FIB sources and water monitoring points. This increased travel distance increases the opportunities for FIB losses due to sedimentation and entrapment of particle associated FIB, infiltration of runoff, and FIB decay [38,39,40,41]. A study conducted by Tian, et al. [42] found that the delivery ratio of FIB to a stream increases as the distance decreases between the FIB source and the stream. Furthermore, once FIB reach surface waters, in larger watersheds there is greater travel time along stream/river reaches which provides more time for losses such as settling and decay. Another explanation for the negative correlation between watershed area and E. coli GM is that as watershed area increases, the duration of the direct runoff hydrograph increases and the peak rate of runoff as a percentage of the total runoff decreases [43]. A longer runoff duration and lesser runoff rate allows more time for infiltration and other losses to occur. A negative relationship between watershed area and FIB concentration was anticipated by Crowther, Kay and Wyer [1] due to increased opportunity for die-off and sedimentation along the longer stream reaches of larger watersheds; however, a statistically significant correlation was not reported. The study focused on two lowland pastoral catchments of 42.8 and 118.9 km2 with 15 and 28 respective monitoring locations. In contrast, the thirty Iowa watersheds used in this study ranged from 2.2 to 13,697 km2. The greater range of catchment watershed areas could explain the significant results of this study while the results of Crowther, Kay and Wyer [1] were inconclusive.

3.2. AFOs and Manure Application

The Spearman’s rank correlation analysis of the number confinements and feedlots within each of the 30 watersheds both produced significant negative correlations, rs = −0.3971 (p = 0.0298) and rs = −0.4481 (p = 0.0130) respectively. When the number of feedlots was normalized to the watershed area, a significant negative correlation (rs = −0.3764, p = 0.0404) was also observed. Similarly, the Spearman’s analysis of the total number of animal units in confinements and feedlots located in each of the 30 watersheds identified a significant negative correlation (rs = −0.3935, p = 0.0314). The number of animal units was also normalized to the watershed area for each watershed, but the Spearman’s rank correlation analysis produced a non-significant rs value of −0.0460 (p = 0.8092). Most Iowa manure systems are zero discharge, so it is expected that the presence of AFOs would not be positively correlated to E. coli concentrations. There are significant positive correlations (p < 0.0001) between watershed area and the number of confinements, number of feedlots, and total number of animal units in each watershed. Therefore, the negative correlations identified might be reflective of the impact of watershed area on E. coli concentration rather than the impacts of AFOs. As previously stated, larger watersheds allow more opportunities for FIB losses.
While significant negative relationships were noted between AFOs and E. coli GM, an insignificant correlation (rs = −0.1147, p = 0.5462) was observed for the percent of each watershed receiving manure application. This finding is contrary to previous studies. In the UK, Crowther, Kay and Wyer [1] found significant positive correlations (p < 0.01 and p < 0.001) between FIB GM and the percent of land area receiving animal waste applications during high flow conditions in two lowland pastoral catchments. Both catchments are highly agricultural with only 1.8% and 2.6% urban land cover. Similarly, the 26 Iowa watersheds used in this study that received manure application had urban land cover ranging from 0.9% to 9.9% of the total watershed area. Of these 26 watersheds, the percent of the watershed areas receiving manure application ranged from 0.38% to 55.1%. Impairments identified during high flow conditions often indicate pollutant loads associated with runoff events [44]. Further, support for relationships between manure amended land and runoff has been reported at a smaller scale including two plot scale studies. A study by Soupir, Mostaghimi, Yagow, Hagedorn and Vaughan [3] showed that runoff from land receiving liquid dairy manure contained E. coli concentrations up to 3.13 × 10⁴ CFU/100 mL during one simulated storm event. A comparison by Mishra, et al. [45] found that fecal coliform concentrations ranged from 8.0 × 10² to 1.0 × 10⁶ CFU/100 mL in runoff from plots receiving dairy manure and poultry litter treatments during two simulated storm events. Likewise, Hruby, et al. [46] also reported high concentrations of FIB after precipitation in tile drainage from plots amended with poultry manure. This study only evaluated the multi-year GM E. coli concentration and did not consider the impact of transport pathway and precipitation timing or intensity; these differences could explain the lack of a significant correlation in this study.

3.3. Point-Sources

Using the 2010 Iowa DNR coverage, there are 1918 National Pollution Discharge Elimination System (NPDES) Facilities discharging into Iowa waters. These facilities include municipal, industrial, and semi-public treatment plants. The Iowa DNR monitoring sites are intended to be ambient sites with the goal of measuring background water quality conditions, so only 13 of the 30 watersheds contained NPDES facilities. Despite this, a significant negative correlation was identified between the number of NPDES facilities and E. coli concentration (rs = −0.3193, p = 0.0854). There is a strong positive correlation between watershed area and number of NPDES facilities (p < 0.0001), so the number of point-source dischargers was also normalized to the watershed area for each of the 30 watersheds. When the Spearman’s rank correlation analysis was performed on the point-source discharger density, it produced a non-significant rs value of −0.2112 (p = 0.2625).
Of the 394 NPDES facilities located in the watersheds studied, approximately 46% were municipal, 16% were industrial, 16% were semi-public facilities, and 10% were agricultural. Approximately 95% of the facilities did not utilize pre-treatment. Primary treatment data were available for 76% of the facilities located in the watersheds studied. Of those facilities, primary treatment consisted primarily of treatment lagoons (59% of facilities), but also included activated sludge (9%) and no treatment (9%). In order to obtain an Iowa NPDES permit, a permit writer must derive technology-based effluent limits and water quality-based effluent limits. Then, the technology and water quality limits are compared and the more stringent limits are applied in the permit [47]. Reductions in FIB impairment have been documented after wastewater treatment plant upgrades. In the City of Lethbridge in southern Alberta, continuous high levels of FIB were measured downstream of their wastewater treatment plant until treatment plant upgrades were installed in 1999; 78% of samples with fecal coliform concentrations greater than 200 CFU/100 mL occurred before the treatment plant upgrades [48].
Since there is a strong positive correlation between watershed area and number of NPDES facilities and the IDNR monitoring locations are intended to measure background water quality conditions, the significant negative correlation between point source dischargers and E. coli concentrations in Iowa is possibly reflective of the relationship between watershed area and E. coli concentration rather than the influence of point-source dischargers on FIB concentration.

3.4. Land Cover

Spearman’s Rank Correlation Coefficients were calculated for each of the individual land cover categories of the 2002 Iowa DNR land cover coverage and the 2012 Iowa Cropland Data coverage. A summary of the land cover distributions for each of the 30 watersheds is displayed in Figure 4.

3.4.1. Water/Wetland

Significant negative correlations were identified between percent water land cover and E. coli concentration for both the analysis of the 30 watersheds using the IDNR coverage (rs = −0.6718, p < 0.0001) and the USDA coverage (rs = −0.6624, p < 0.0001). Likewise, significant negative correlations were identified between percent wetland land cover and E. coli concentration; the USDA coverage subdivides wetlands into woody wetlands (rs = −0.5906, p = 0.0006) and herbaceous wetlands (rs = −0.5144, p = 0.0036) whereas the IDNR coverage contains only one total wetland class (rs = −0.5524, p = 0.0015). A negative correlation between percent water land cover and E. coli concentration was expected because percent water land cover has a strong positive correlation to watershed area (p < 0.05); as previously stated, larger watersheds provide more time for FIB losses during transport in runoff as well as in surface water flow. The ability of wetlands to remove FIB is well documented and they have been used to treat wastewater [21,49,50]. Decamp and Warren [51] studied the removal rates of E. coli in subsurface flow wetlands used for wastewater treatment and observed removal rates of 96.6%–98.9% in four pilot-scale systems.

3.4.2. Forest

Significant negative correlations were observed between percent forest land cover and E. coli concentration; using the USDA coverage, percent deciduous forest has an rs value of −0.3677 (p = 0.0456), percent evergreen forest has an rs value of −0.4687 (p = 0.0090), and percent mixed forest has an rs value of −0.3990 (p = 0.0289). When the three forest types were combined into the percent USDA Total Forest land cover group the analysis produced an rs value of −0.3753 (p = 0.0410). Of the three types of forest, deciduous forest is dominant; for the 30 watersheds, deciduous forest land cover ranged from 0.15% to 34.7% of the watershed area while evergreen forest and mixed forest ranged from 0.0% to 0.05% and 0.0%–0.22%, respectively. Overall, total forest ranged from 0.0% to 35% of the watershed area. The IDNR coverage includes a bottomland forest category which represents the deciduous forest found in lowland floodplains along rivers and lakes. The Spearman’s rank analysis for the percent bottomland forest landcover also produced a significant negative correlation with an rs value of −0.6409 (p = 0.0001).
In Ohio, Tong and Chen [20] also found a significant negative correlation (p < 0.0001) between forest land cover and fecal coliform concentration. However, other studies have been unable to find relationships. A study conducted by Sliva and Williams [19] compared fecal coliform concentrations with percent forest land cover for a 100-m buffer zone along rivers as well as for entire catchments. Their study area had a greater percent forest land cover than the Iowa watersheds in this study; the 12 catchments in their study had forest land cover ranging approximately 10%–50% of the watershed area and the 12 buffer zones had forest land cover ranging approximately 20%–50% of the buffer zone. The authors found no correlation between percent forest land cover and fecal coliform concentration during the spring, summer, or fall seasons for both the 100 m buffer zones and the entire catchments. There appears to be less variation in the percent forest land cover in Sliva and Williams [19] than in this study, which could explain the difference in findings. Crowther, Kay and Wyer [1] performed a similar analysis on two lowland pastoral watersheds in the UK. In the first watershed, woodland land cover was 10.2% of the total catchment area and they did not perform an analysis because greater than 25% of the sub-catchments had 0% woodland land cover. In the second watershed, woodland land cover was 6.8% of the total catchment area and they found no correlation between presumptive coliforms, presumptive E. coli, or presumptive streptococci among the sub-catchments. The contradictory findings between studies are likely due to the multifunctional benefits of forested landscapes. Forested areas located along streams benefit water quality by providing nutrient retention and promoting the settling of sediment [52]. However, the improved habitat for wildlife can add to the FIB load to surface waters. Here the negative correlation indicates that the presence of forest in a primarily agricultural landscape has a positive impact on microbial water quality.

3.4.3. Shrubland

The Spearman’s rank analysis on the percent of the watershed corresponding to the USDA Shrubland land cover class produced a significant negative correlation of rs = –0.3474 (p = 0.0600). This land cover is defined as areas with natural or semi-natural woody vegetation, generally less than 6-m tall and non-interlocking. The positive impacts of riparian shrubs on water quality are well documented [53,54].

3.4.4. Grassland

While insignificant correlations were observed between E. coli concentration and the percent of each watershed corresponding to the IDNR ungrazed grassland (rs = −0.1457, p = 0.4423) and grazed grassland (rs = −0.2779, p = 0.1371) land cover categories, a significant negative correlation was observed between E. coli and percent planted grassland land cover (rs = −0.3602, p = 0.0506). The Iowa DNR defines planted grasslands as areas of unmanaged grasses in heavy stands. Both areas of native grasses and alien grasses, such as brome grass, are included in this class. Grasses are often used to create buffer strips near streams because of their ability to intercept pollutants in surface runoff. Therefore, the significant negative correlation between planted grasslands is potentially because they are strategically placed and acting as filters for surface runoff. A study conducted by Sliva and Williams [19] identified a significant negative correlation between fecal coliform concentration and percent field land cover of 100-m buffers surrounding rivers during the summer season. However, depending on the type of grassland, positive correlations have also been observed between grassland land cover and FIB concentrations [1].

3.4.5. Crops

When the Spearman’s rank analysis was performed on the crop classes from the USDA coverage, strong negative correlations were identified for the percent of each watershed corresponding to the Sweet Corn, Spring Wheat, Winter Wheat, Double Crop Winter Wheat/Soybeans, Sod/Grass Seed, and Double Crop Winter Wheat/Sorghum classes. However, in each of these cases, only four or fewer of the watersheds contained the crop class. Insignificant correlations were identified for both the percent of each watershed corresponding to the Corn (rs = 0.0002, p = 0.9991) and Soybeans (rs = 0.0216, p = 0.9099) crop classes.

3.4.6. Barren

No significant correlations were identified between percent Barren land cover and E. coli concentration; the Spearman’s Rank Correlation analysis using the IDNR coverage had an rs value of −0.1672 (p = 0.3773) and the analysis using the USDA coverage had an rs value of −0.2276 (p = 0.2263). The barren land cover classes are defined as areas largely covered with exposed rock or sand with little or no green vegetation. The lack of correlation between barren land cover and FIB could be because the barren areas are not conducive to growth of bacteria and likely does not receive manure application. A comparison made by Tong and Chen [20] found that barren land cover had the lowest fecal coliform concentrations out of the agriculture, pervious urban, forest, impervious urban, and barren land cover groups.

3.4.7. Total Agriculture

A Spearman’s Rank Correlation analysis was performed between E. coli GM and percent of each watershed corresponding to the individual land cover classes within the created IDNR and USDA Total Agriculture land cover groups. However, no significant correlations were identified for any land cover class besides those already discussed in Section 3.4.4 and Section 3.4.5. Likewise, no significant correlations were found between E. coli concentration and the percent Crops (rs = 0.1502, p = 0.4283) and percent Grains/Hay/Seeds (rs = −0.0131, p = 0.9451) land cover groups. When the individual land cover classes were aggregated into the total land cover groups, significant positive correlations were observed between E. coli concentration and the percent of each watershed corresponding to both the groups based on the IDNR (rs = 0.3348, p = 0.0705) and USDA (rs = 0.4269, p = 0.0186) coverages. Agriculture provides many possible sources of FIB including manure application and grazing animals, so a positive correlation is expected. Because Iowa is dominated by agricultural land cover, the effects of agriculture on FIB impairment can mask the effects of other watershed characteristics. A comparison made by Tong and Chen [20] found a significant positive correlation between agriculture land cover and fecal coliform concentration (p < 0.0001) and that concentrations were five times those of pervious urban areas, seven times those of forest areas, more than 16 times those of impervious land, and 46 times those of barren land. Likewise, Crowther, Kay and Wyer [1] found significant positive correlations between arable land cover and presumptive coliforms (p < 0.001), presumptive E. coli (p < 0.001), and presumptive streptococci (p < 0.01) in one of their two study catchments.

3.4.8. Total Urban/Developed

No significant correlation was observed between percent Total Urban/Developed land cover and E. coli concentrations; the Spearman’s Rank Correlation analysis for the IDNR coverage produced an rs value of 0.0607 (p = 0.7499) and the analysis for the USDA coverage produced an rs value of 0.0091 (p = 0.9618). The lack of correlation between percent Total Urban/Developed land cover and E. coli concentration for the IDNR coverage is explained by a lack of significant correlations between E. coli and the percent of each watershed corresponding to the roads (p = 0.4297), commercial/industrial (p = 7146), and residential (p = 0.2638) land cover categories. Likewise, the lack of correlation using the USDA coverage is because no significant correlations were observed between E. coli and the percent of each watershed corresponding to the Developed/Open Space (p = 0.4339), Developed/Low Intensity (p = 4651), and Developed/Medium Intensity (p = 0.5592) land cover classes. However, a significant negative correlation (rs = −0.3705, p = 0.0439) was identified between percent Developed/High Intensity land cover and E. coli concentration. Although other studies have found positive correlations between urban areas and FIB, the effects of urban land cover on FIB impairment in Iowa could be masked by the effects of the dominant agricultural land cover. In fact, agriculture is so dominant in Iowa that 27 of the 30 watersheds studied have less than 10% total urban area. In the UK, Crowther, Kay and Wyer [1] had similar conclusions and observed that FIB inputs from wastewater treatment plants were masked by the dominance of FIB from agricultural sources.
In areas where agricultural land cover is not as prevalent, urban areas can be the primary source of FIB impairment. Fecal coliform concentrations have been found to be significantly higher (p < 0.0001) in urbanized estuaries than undeveloped estuaries [13]. In a comparison by Mallin, et al. [55] of fecal coliform concentrations among five estuarine watersheds, concentrations were significantly correlated with population (p = 0.026), percentage development (p = 0.015), and percent imperviousness (p = 0.005). Significant positive correlations between fecal coliform concentrations and urban land cover have also been reported for the spring, summer, and fall seasons at the catchment and stream buffer scales [19]. Furthermore, direct relationships have been found between fecal coliform concentrations and housing density, population, percent imperviousness, pet density, and commercial and residential land covers [20,56]. A study by Mallin, Williams, Esham and Lowe [55] concluded that the most important anthropogenic factor influencing fecal coliform concentration is percent imperviousness; impervious surfaces such as driveways, parking lots, roads, roofs, and sidewalks concentrate and transport storm runoff pollutants to receiving waters. Other potential anthropogenic sources of FIB contamination include leaks in sewers, septic tanks, or pump stations and spills or overflows of untreated sewage [6,13].

3.5. Multiple Regression Model

While the Spearman’s rank correlation analysis provides useful information about the correlations between E. coli GM and watershed characteristics, it is difficult to interpret the interrelationships between the watershed characteristics and their combined effect on E. coli concentration. Therefore, a multiple regression model was developed; the regression coefficients of a multiple regression model represent the independent contributions of each variable to the estimation of the dependent variable.
The backwards elimination process of the multiple regression model resulted in a final model which includes ten watershed characteristics: Feedlot Density (#/1000 hectare), Number of AFO Confinements, Number of AFO Feedlots, and the percent of each watershed corresponding to the Bottomland Forest, Shrubland, Total Agriculture (USDA coverage), Deciduous Forest, Herbaceous Wetlands, Total Wetland (IDNR coverage), and Evergreen Forest land covers. The multiple regression equation of the final model is provided as Equation (1) and the model variables are defined in Table 2. To test for collinearity between the model variables, VIF values were calculated for each variable. VIF values for the model variables ranged from 1.32 to 9.23 (Table 2). Variables which were not normalized to watershed area, number of AFO Confinements and AFO Feedlots, had the greatest VIF values of 7.91 and 9.23, respectively. However, all VIF values were less than 10, the maximum acceptable value, and indicate inconsequential collinearity [33,34,35,36]. The model has a coefficient of determination (R2) value of 0.67517 with an adjusted R2 value of 0.504207. Coefficients of determination above 0.5 are generally considered acceptable [57]. The ANOVA test produces a p-value of 0.0049 which enables the rejection of the null-hypothesis and indicates that the model provides a better fit than an intercept-only model.
The multiple regression model eliminated variables with high collinearity, as defined by VIF values. Therefore, the variables included in the model indicate the watershed characteristics with the most important independent contributions to E. coli concentration. The estimates for the model variable coefficients were ranked from highest to lowest and are shown in Table 2. Each estimate represents the estimated increase in E. coli GM CFU/100 mL corresponding to an increase in one unit of the respective watershed characteristic after allowing for simultaneous change in the other variables. For five of the variables—Feedlot Density, percent Bottomland Forest land cover, percent Shrubland land cover, number of AFO Confinements, and percent Total Agriculture land cover—the sign (positive/negative) of the coefficient estimates is the opposite of the sign of the correlation identified in the Spearman’s rank analysis. However, this is not unusual because the parameter estimates and their sign in a multiple regression model are dependent upon which variables are included in the model. Consequently, this multiple regression model should not be used to quantitatively estimate the E. coli concentration given input watershed data. Instead, this model should be used qualitatively, and in conjunction with the Spearman’s rank correlation analysis, to analyze the importance of watershed characteristics on E. coli concentration.
The ten variables included in the model show that animal feeding operations, agriculture, wetlands, and woody vegetation are important watershed characteristics influencing E. coli concentration. This is corroborated by the results of the Spearman’s rank correlation analysis which showed high correlations (p = 0.0600 to p = 0.0001) between each watershed characteristic and E. coli GM. The relative importance of the different watershed characteristics can be ascertained by comparing the magnitude of the coefficient estimates. Percent Evergreen Forest land cover has the greatest magnitude with an estimate of −166,041.7. Following that, Feedlot Density and the percent of each watershed corresponding to the Bottomland Forest, Shrubland, Herbaceous Wetlands, and Total Wetland land covers each have estimates with orders of magnitude greater than the remaining variables, indicating that these watershed characteristics have a greater influence on the model’s estimated E. coli concentration for the tested agriculturally-dominated watersheds. Since the multiple regression model estimates are dependent upon the variables included in the model, the direction of the correlation between each watershed characteristic and E. coli concentration must be taken from the Spearman’s rank analysis. Therefore, percent agricultural land cover is positively correlated to E. coli concentration, whereas the presence of animal feeding operations and the percent wetland and woody vegetation land covers are negatively correlated.
E .   c o l i   GM   ( CFU 100   mL ) = β 0 + β 1 x 1 + β 2 x 2 + β 3 x 3 + β 4 x 4 + β 5 x 5 + β 6 x 6 + β 7 x 7 + β 8 x 8 + β 9 x 9 + β 10 x 10

4. Conclusions

This study expanded upon the work of preceding studies by concentrating exclusively on FIB, analyzing a greater number of watersheds, performing a detailed land cover analysis, and including a more extensive suite of watershed characteristics. The results of the Spearman’s rank correlation analysis and the multiple regression model shows clear relationships between watershed characteristics and water E. coli concentrations. In Iowa watersheds, the percent total agricultural land cover is positively correlated to E. coli concentration while the presence of animal feeding operations and the percent wetland and woody vegetation (forests and shrubland) land covers are negatively correlated. The strong negative correlations between E. coli and the percent bottomland forest land cover highlight the positive impacts of riparian vegetation in agriculturally dominated watersheds. Bottomland forest land cover is only found in lowland floodplains along rivers and lakes and the watershed characteristic was significant in both the Spearman’s rank analysis and the multiple regression model. Likewise, the percent shrubland, deciduous forest, and evergreen forest land covers were also significant in both analyses. However, a more advanced spatial analysis would provide greater insight into the effects of proximity of woody vegetation to streams on E. coli concentration. The results of this study will be especially helpful in identifying priority locations for watershed remediation efforts and watershed variables for future bacteria modeling.
The increasing availability of GIS datasets allows researchers to expand the variety and quantity of the data in which they are able to study. However, this study exposes the challenges in performing statistical analyses on a wide range of interrelated datasets. The Spearman’s rank correlation analysis is helpful in determining the correlations between E. coli concentration and the various watershed characteristics but it lacks the ability to identify their combined effects. Alternatively, the multiple regression model is helpful in identifying the watershed characteristics with the greatest independent contributions to E. coli concentration and their combined effects. Despite this, the model parameter estimates are equivocal and, consequently, the model should not be used quantitatively. Combined, the two analyses enable conclusions to be made about the relationships between watershed characteristics and E. coli concentration and their relative importance.
Future studies can build upon this study and past work in several ways. This study was limited by the scope of available data. Data on E. coli concentration and manure application areas were only available for Iowa, an agriculturally dominated state. While this study provides useful information on the relationships between E. coli concentration and watershed characteristics in large agricultural areas, these relationships in small urban areas are more equivocal. Including both ambient and urban monitoring locations would facilitate better analysis of watershed characteristics such as urban land use and point-source dischargers. Furthermore, GIS datasets, such as land cover and AFOs, are not always standardized and individual states include different fields in their coverages. As a result, acquiring data for analysis of large watersheds can be problematic. More accurate, current, complete, and higher resolution GIS datasets can benefit all GIS-based work. In addition, stronger correlations between FIB and watershed characteristics may be identified by taking into account the spatial distribution of the characteristics within the watershed. Since bacteria transport farther between FIB sources and monitoring sites in large watersheds, the stream distance between FIB sources and the monitoring location could be an important variable to include in a model. This study also did not include precipitation as a variable data due to the large number and scale of the watersheds. However, the correlation between precipitation and FIB transport is well documented and precipitation would be a useful variable to include in a small catchment model. Finally, small catchment models could also investigate the influence of the catchment’s geomorphology on in-stream FIB concentrations. Factors such as slope and soil type influence FIB transport.

Supplementary Materials

The following are available online at www.mdpi.com/2073-4441/9/3/154/s1, Figure S1: Example Watershed Delineation with GIS Layers.

Acknowledgments

The authors would like to thank John Olson and Charles Ikenberry with the Iowa Department of Natural Resources for providing E. coli data. This work was supported by the Iowa State University Pak Liu Fung Scholarship.

Author Contributions

Conrad Brendel and Michelle L. Soupir conceived and designed the study; Conrad Brendel performed the analysis and wrote the paper; and Michelle L. Soupir assisted with paper writing and finalized the paper for submission.

References

  1. Crowther, J.; Kay, D.; Wyer, M.D. Faecal-indicator concentrations in waters draining lowland pastoral catchments in the UK: Relationships with land use and farming practices. Water Res. 2002, 36, 1725–1734. [Google Scholar] [CrossRef]
  2. Thurston-Enriquez, J.A.; Gilley, J.E.; Eghball, B. Microbial quality of runoff following land application of cattle manure and swine slurry. J. Water Health 2005, 3, 157–171. [Google Scholar] [PubMed]
  3. Soupir, M.; Mostaghimi, S.; Yagow, E.; Hagedorn, C.; Vaughan, D. Transport of fecal bacteria from poultry litter and cattle manures applied to pastureland. Water Air Soil Pollut. 2006, 169, 125–136. [Google Scholar] [CrossRef]
  4. Burkholder, J.; Libra, B.; Weyer, P.; Heathcote, S.; Kolpin, D.; Thome, P.S.; Wichman, M. Impacts of waste from concentrated animal feeding operations on water quality. Environ. Health Perspect. 2007, 115, 308–312. [Google Scholar] [CrossRef] [PubMed]
  5. Graves, A.K.; Hagedorn, C.; Teetor, A.; Mahal, M.; Booth, A.M.; Reneau, R.B. Antibiotic resistance profiles to determine sources of fecal contamination in a rural Virginia watershed. J. Environ. Qual. 2002, 31, 1300–1308. [Google Scholar] [CrossRef] [PubMed]
  6. Whitlock, J.E.; Jones, D.T.; Harwood, V.J. Identification of the sources of fecal coliforms in an urban watershed using antibiotic resistance analysis. Water Res. 2002, 36, 4273–4282. [Google Scholar] [CrossRef]
  7. Somarelli, J.; Makarewicz, J.; Sia, R.; Simon, R. Wildlife identified as major source of Escherichia coli in agriculturally dominated watersheds by BOX A1R-derived genetic fingerprints. J. Environ. Manag. 2007, 82, 60–65. [Google Scholar] [CrossRef] [PubMed]
  8. Fujioka, R.; Sian-Denton, C.; Borja, M.; Castro, J.; Morphew, K. Soil: The environmental source of Escherichia coli and enterococci in Guam’s streams. J. Appl. Microbiol. 1998, 85, 83S–89S. [Google Scholar] [CrossRef] [PubMed]
  9. Guardabassi, L.; Wong, D.M.L.F.; Dalsgaard, A. The effects of tertiary wastewater treatment on the prevalence of antimicrobial resistant bacteria. Water Res. 2002, 36, 1955–1964. [Google Scholar] [CrossRef]
  10. Kay, D.; Crowther, J.; Stapleton, C.M.; Wyer, M.D.; Fewtrell, L.; Edwards, A.; Francis, C.; McDonald, A.T.; Watkins, J.; Wilkinson, J. Faecal indicator organism concentrations in sewage and treated effluents. Water Res. 2008, 42, 442–454. [Google Scholar] [CrossRef] [PubMed]
  11. Anastasi, E.; Matthews, B.; Gundogdu, A.; Vollmerhausen, T.; Ramos, N.; Stratton, H.; Ahmed, W.; Katouli, M. Prevalence and persistence of Escherichia coli strains with uropathogenic virulence characteristics in sewage treatment plants. Appl. Environ. Microbiol. 2010, 76, 5882–5886. [Google Scholar] [CrossRef] [PubMed]
  12. Anastasi, E.; Matthews, B.; Stratton, H.M.; Katouli, M. Pathogenic Escherichia coli found in sewage treatment plants and environmental waters. Appl. Environ. Microbiol. 2012, 78, 5536–5541. [Google Scholar] [CrossRef] [PubMed]
  13. Webster, L.F.; Thompson, B.C.; Fulton, M.H.; Chestnut, D.E.; Van Dolah, R.F.; Leight, A.K.; Scott, G.I. Identification of sources of Escherichia coli in South Carolina estuaries using antibiotic resistance analysis. J. Exp. Mar. Biol. Ecol. 2004, 298, 179–195. [Google Scholar] [CrossRef]
  14. United States Environmental Protection Agency (US EPA). National Water Quality Inventory: Report to Congress; Technical Report; US EPA: Washington, DC, USA, 2009.
  15. Iowa Department of Natural Resources (IDNR). Understanding Iowa’s Impaired Waters. Available online: http://www.iowadnr.gov/Portals/idnr/uploads/water/watershed/files/impairedwaters2015.pdf (accessed on 10 September 2016).
  16. United States Environmental Protection Agency (US EPA). 2012 Recreational Water Quality Criteria. 2012. Available online: https://www.epa.gov/sites/production/files/2015-10/documents/rwqc2012.pdf (accessed on 18 February 2016). [Google Scholar]
  17. Jamieson, R.; Gordon, R.; Joy, D.; Lee, H. Assessing microbial pollution of rural surface waters: A review of current watershed scale modeling approaches. Agric. Water Manag. 2004, 70, 1–17. [Google Scholar] [CrossRef]
  18. Baffaut, C.; Sadeghi, A. Bacteria modeling with SWAT for assessment and remediation studies: A review. Trans. ASABE 2010, 53, 1585–1594. [Google Scholar] [CrossRef]
  19. Sliva, L.; Williams, D.D. Buffer zone versus whole catchment approaches to studying land use impact on river water quality. Water Res. 2001, 35, 3462–3472. [Google Scholar] [CrossRef]
  20. Tong, S.T.; Chen, W. Modeling the relationship between land use and surface water quality. J. Environ. Manag. 2002, 66, 377–393. [Google Scholar] [CrossRef]
  21. Pandey, P.K.; Soupir, M.L.; Haddad, M.; Rothwell, J.J. Assessing the impacts of watershed indexes and precipitation on spatial in-stream E. coli concentrations. Ecol. Indic. 2012, 23, 641–652. [Google Scholar] [CrossRef]
  22. Green, R.H. Sampling Design and Statistical Methods for Environmental Biologists; John Wiley & Sons: New York, NY, USA, 1979. [Google Scholar]
  23. MacCallum, R.C.; Browne, M.W.; Sugawara, H.M. Power analysis and determination of sample size for covariance structure modeling. Psychol. Method. 1996, 1, 130. [Google Scholar] [CrossRef]
  24. Garnier, J.; Servais, P.; Billen, G. Bacterioplankton in the Seine River (France): Impact of the Parisian urban effluent. Can. J. Microbiol. Rev. Can. Microbiol. 1992, 38, 56–64. [Google Scholar] [CrossRef]
  25. Hoch, B.; Berger, B.; Kavka, G.; Herndl, G.J. Influence of wastewater treatment on the microbial ecology of a large, temperate river system—The Danube River. Hydrobiologia 1996, 321, 205–218. [Google Scholar] [CrossRef]
  26. Gollehon, N.; Caswell, M.; Ribaudo, M.; Kellogg, R.; Lander, C.; Letson, D. Confined Animal Production and Manure Nutrients. Agriculture Information Bulletin No. 771, Resources Economics Division. 2001. Available online: http://www.ers.usda.gov/publications/aib771/aib771.pdf (accessed on 21 February 2017).
  27. Iowa Agriculture Literacy Foundation (IALF). A Look at Iowa Agriculture. Available online: http://www.agclassroom.org/teacher/stats/iowa.pdf (accessed on 20 December 2015).
  28. ArcGIS Desktop, Version 10.2.2; Environmental Systems Research Institute (ESRI): Redlands, CA, USA, 2014.
  29. ArcSWAT, Version 2012.10.18; United States Department of Agriculture-Agricultural Research Service (USDA-ARS): Temple, TX, USA, 2012.
  30. Iowa Department of Natural Resources (IDNR). Iowa DNR Animal Feeding Operatoin. Available online: https://programs.iowadnr.gov/animalfeedingoperations/ (accessed on 30 September 2016).
  31. Iowa Department of Natural Resources (IDNR). Animal Feeding Operations. Available online: http://www.iowadnr.gov/Environmental-Protection/Land-Quality/Animal-Feeding-Operations (accessed on 30 September 2016).
  32. JMP Pro, Version 12.1.0; SAS Institute: Cary, NC, USA, 2015.
  33. Hair, J.F.; Anderson, R.E.; Babin, B.J.; Black, W.C. Multivariate Data Analysis: A Global Perspective; Pearson: Upper Saddle River, NJ, USA, 2010; Volume 7. [Google Scholar]
  34. Kennedy, P. A Guide to Econometrics; The MIT Press: Cambridge, MA, USA, 1992. [Google Scholar]
  35. Marquaridt, D.W. Generalized inverses, ridge regression, biased linear estimation, and nonlinear estimation. Technometrics 1970, 12, 591–612. [Google Scholar] [CrossRef]
  36. Neter, J.; Wasserman, W.; Kutner, M.H. Applied Linear Regression Models; Richard D. Irwin Inc.: Homewood, IL, USA, 1983. [Google Scholar]
  37. Harmel, R.; Karthikeyan, R.; Gentry, T.; Srinivasan, R. Effects of agricultural management, land use, and watershed scale on E. coli concentrations in runoff and streamflow. Trans. ASABE 2010, 53, 1833–1841. [Google Scholar] [CrossRef]
  38. Butler, R.; Orlob, G.; McGauhey, P. Underground movement of bacterial and chemical pollutants. J. Am. Water Works Assoc. 1954, 46, 97–111. [Google Scholar]
  39. Bai, S.; Lung, W.-S. Modeling sediment impact on the transport of fecal bacteria. Water Res. 2005, 39, 5232–5240. [Google Scholar] [CrossRef] [PubMed]
  40. Oliver, D.M.; Clegg, C.D.; Heathwaite, A.L.; Haygarth, P.M. Preferential attachment of Escherichia coli to different particle size fractions of an agricultural grassland soil. Water Air Soil Pollut. 2007, 185, 369–375. [Google Scholar] [CrossRef] [Green Version]
  41. Schultz-Fademrecht, C.; Wichern, M.; Horn, H. The impact of sunlight on inactivation of indicator microorganisms both in river water and benthic biofilms. Water Res. 2008, 42, 4771–4779. [Google Scholar] [CrossRef] [PubMed]
  42. Tian, Y.Q.; Gong, P.; Radke, J.D.; Scarborough, J. Spatial and temporal modeling of microbial contaminants on grazing farmlands. J. Environ. Qual. 2002, 31, 860–869. [Google Scholar] [CrossRef] [PubMed]
  43. Brater, E.F. The unit hydrograph principle applied to small watersheds. Am. Soc. Civ. Eng. 1940, 195, 1154–1178. [Google Scholar]
  44. Cleland, B.R. TMDL Development from the “bottom up”—Part III: Duration Curves and wet-weather assessments. Proc. Water Environ. Fed. 2003, 2003, 1740–1766. [Google Scholar] [CrossRef]
  45. Mishra, A.; Benham, B.L.; Mostaghimi, S. Bacterial transport from agricultural lands fertilized with animal manure. Water Air Soil Pollut. 2008, 189, 127–134. [Google Scholar] [CrossRef]
  46. Hruby, C.; Soupir, M.; Moorman, T.; Shelley, M.; Kanwar, R. Effects of tillage and poultry manure application rates on Salmonella and fecal indicator bacteria concentrations in tiles draining Des Moines Lobe soils. J. Environ. Manag. 2016, 171, 60–69. [Google Scholar] [CrossRef] [PubMed]
  47. Iowa Department of Natural Resources (IDNR). NPDES Wastewater Permitting. Available online: http://www.iowadnr.gov/Environmental-Protection/Water-Quality/NPDES-Wastewater-Permitting (accessed on 17 March 2016).
  48. Hyland, R.; Byrne, J.; Selinger, B.; Graham, T.; Thomas, J.; Townshend, I.; Gannon, V. Spatial and temporal distribution of fecal indicator bacteria within the Oldman River basin of southern Alberta, Canada. Water Qual. Res. J. Can. 2003, 38, 15–32. [Google Scholar]
  49. Neralla, S.; Weaver, R.W.; Lesikar, B.J.; Persyn, R.A. Improvement of domestic wastewater quality by subsurface flow constructed wetlands. Bioresour. Technol. 2000, 75, 19–25. [Google Scholar] [CrossRef]
  50. Ibekwe, A.M.; Grieve, C.M.; Lyon, S.R. Characterization of microbial communities and composition in constructed dairy wetland wastewater effluent. Appl. Environ. Microbiol. 2003, 69, 5060–5069. [Google Scholar] [CrossRef] [PubMed]
  51. Decamp, O.; Warren, A. Investigation of Escherichia coli removal in various designs of subsurface flow wetlands used for wastewater treatment. Ecol. Eng. 2000, 14, 293–299. [Google Scholar] [CrossRef]
  52. Anbumozhi, V.; Radhakrishnan, J.; Yamaji, E. Impact of riparian buffer zones on water quality and associated management considerations. Ecol. Eng. 2005, 24, 517–523. [Google Scholar] [CrossRef]
  53. Gardi, C. Land use, agronomic management and water quality in a small Northern Italian watershed. Agric. Ecosyst. Environ. 2001, 87, 1–12. [Google Scholar] [CrossRef]
  54. Li, S.; Gu, S.; Tan, X.; Zhang, Q. Water quality in the upper Han River basin, China: The impacts of land use/land cover in riparian buffer zone. J. Hazard. Mater. 2009, 165, 317–324. [Google Scholar] [CrossRef] [PubMed]
  55. Mallin, M.A.; Williams, K.E.; Esham, E.C.; Lowe, R.P. Effect of human development on bacteriological water quality in coastal watersheds. Ecol. Appl. 2000, 10, 1047–1056. [Google Scholar] [CrossRef]
  56. Young, K.D.; Thackston, E.L. Housing density and bacterial loading in urban streams. J. Environ. Eng. 1999, 125, 1177–1180. [Google Scholar] [CrossRef]
  57. Moriasi, D.; Arnold, J.; Van Liew, M.; Bingner, R.; Harmel, R.; Veith, T. Model evaluation guidelines for systematic quantification of accuracy in watershed simulations. Trans. Asabe 2007, 50, 885–900. [Google Scholar] [CrossRef]
Figure 1. Summary of average recreation season geometric means (GM) of E. coli at Iowa warmwater stream/river monitoring stations for 2010–2012 (N = 395). Bars on the x-axis represent individual sites.
Water 09 00154 g001
Figure 2. Spatial distribution of Iowa Storage and Retrieval (STORET) sites analyzed in this study.
Water 09 00154 g002
Figure 3. The p-value and Spearman’s rank correlation coefficients (data labels) by watershed characteristic (n = 30); positive and negative directions of ordinates depict positive and negative correlations between E. coli and the corresponding watershed characteristics.
Water 09 00154 g003
Figure 4. Watershed Area and Land Cover Distribution.
Water 09 00154 g004
Table 1. GIS layers used for watershed delineation and statistical analysis.
LayerSourceMaintenance/Update FrequencyVersion
2006 Iowa Manure Application AreasIowa NRGIS LibraryIrregular2008 Edition, Downloaded in 2014
Iowa AFO ConfinementsIowa NRGIS LibraryMonthly2013 Edition, Downloaded in 2016
Iowa AFO FeedlotsIowa NRGIS LibraryAs Needed2012 Edition, Downloaded in 2016
Iowa National Hydrology Dataset (NHD) FlowlinesIowa NRGIS LibraryIrregularDownloaded in 2014
Iowa NPDES FacilitiesIowa NRGIS LibraryMonthly2010 Edition, Downloaded in 2016
Iowa STORET monitoring locationsIowa NRGIS LibraryIrregular2013 Edition, Downloaded in 2014
2012 Iowa Cropland DataUSDA National Agricultural Statistics ServiceNone Planned2012 Edition, Downloaded in 2016
National Elevation Dataset (NED) 30-m cellsUSDA NRCS Geospatial Data GatewayNone PlannedDownloaded in 2014
2006 Iowa Manure Application AreasIowa NRGIS LibraryIrregular2008 Edition, Downloaded in 2014
Table 2. Model Parameter Estimates.
iTerm, xiEstimate, βiStd Errort RatioProb > |t|VIF
0Intercept24,149.0225519.9224.370.0003-
1Feedlot Density (#/1000 hectare)21,288.7864058.4825.25<0.00016.11
2% Bottomland Forest18,079.0577279.1382.480.02251.98
3% Shrubland11,126.5193246.0593.430.00282.15
4# AFO Confinements41.70523611.4203.650.00177.91
5Total Ag. (USDA Coverage)−173.286657.820−3.000.00741.51
6# AFO Feedlots−224.318556.548−3.970.00089.23
7% Deciduous Forest−364.5643123.289−2.960.00811.32
8% Herbaceous Wetlands−4671.4172444.317−1.910.07121.55
9% Total Wetland (IDNR Coverage)−34,966.166484.586−5.39<0.00017.52
10% Evergreen Forest−166,041.781,362.020−2.040.05541.35

