
Vulnerability of Maize Yields to Droughts in Uganda


Abstract
:1. Introduction
2. Materials and Methods
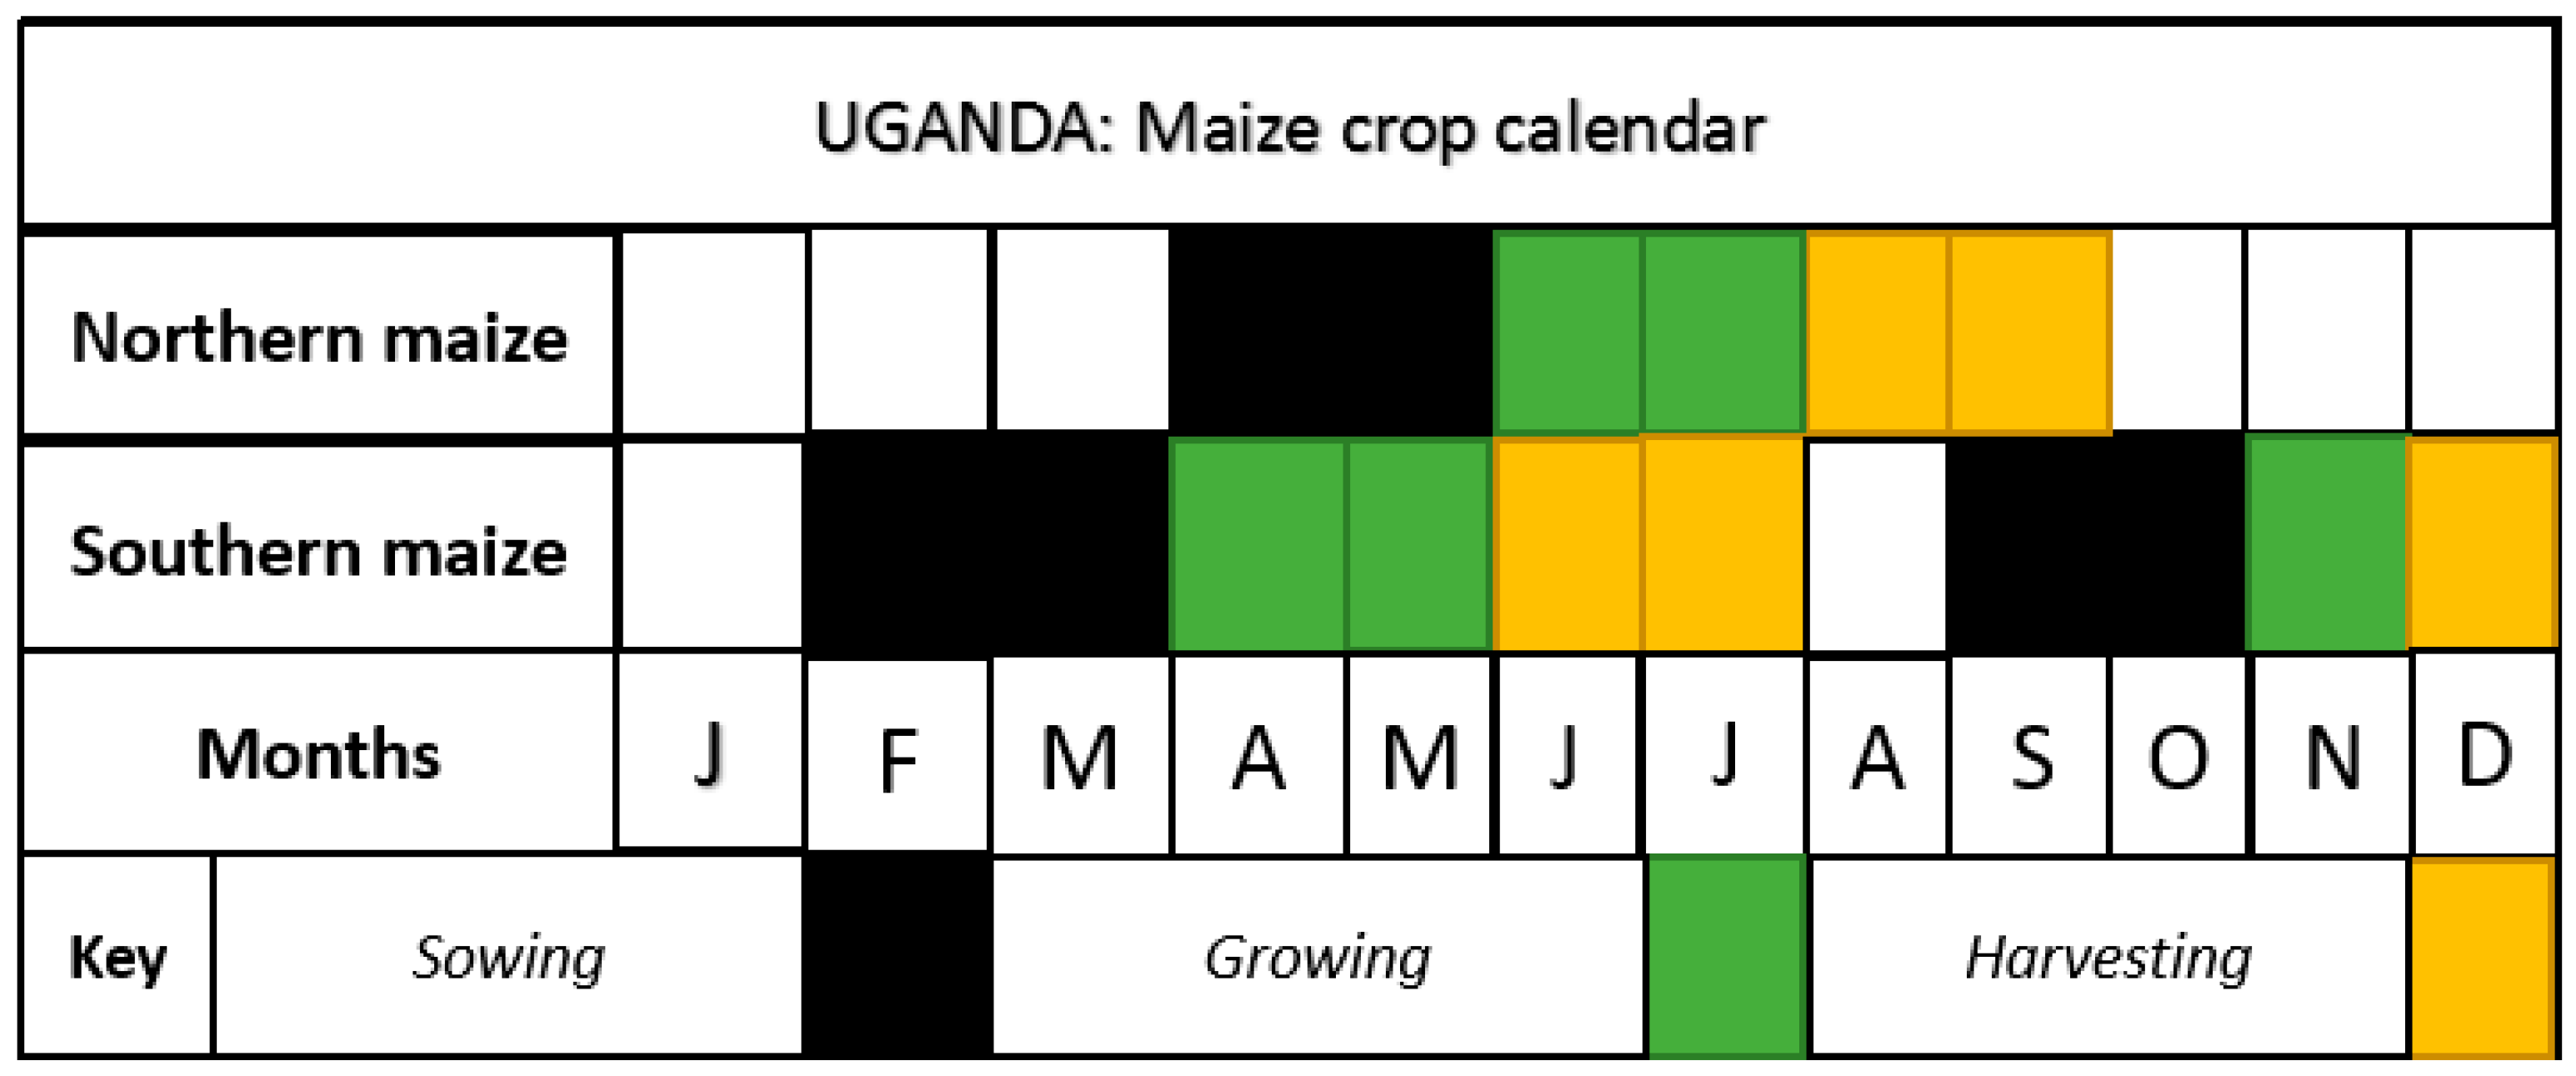
2.1. Study Area
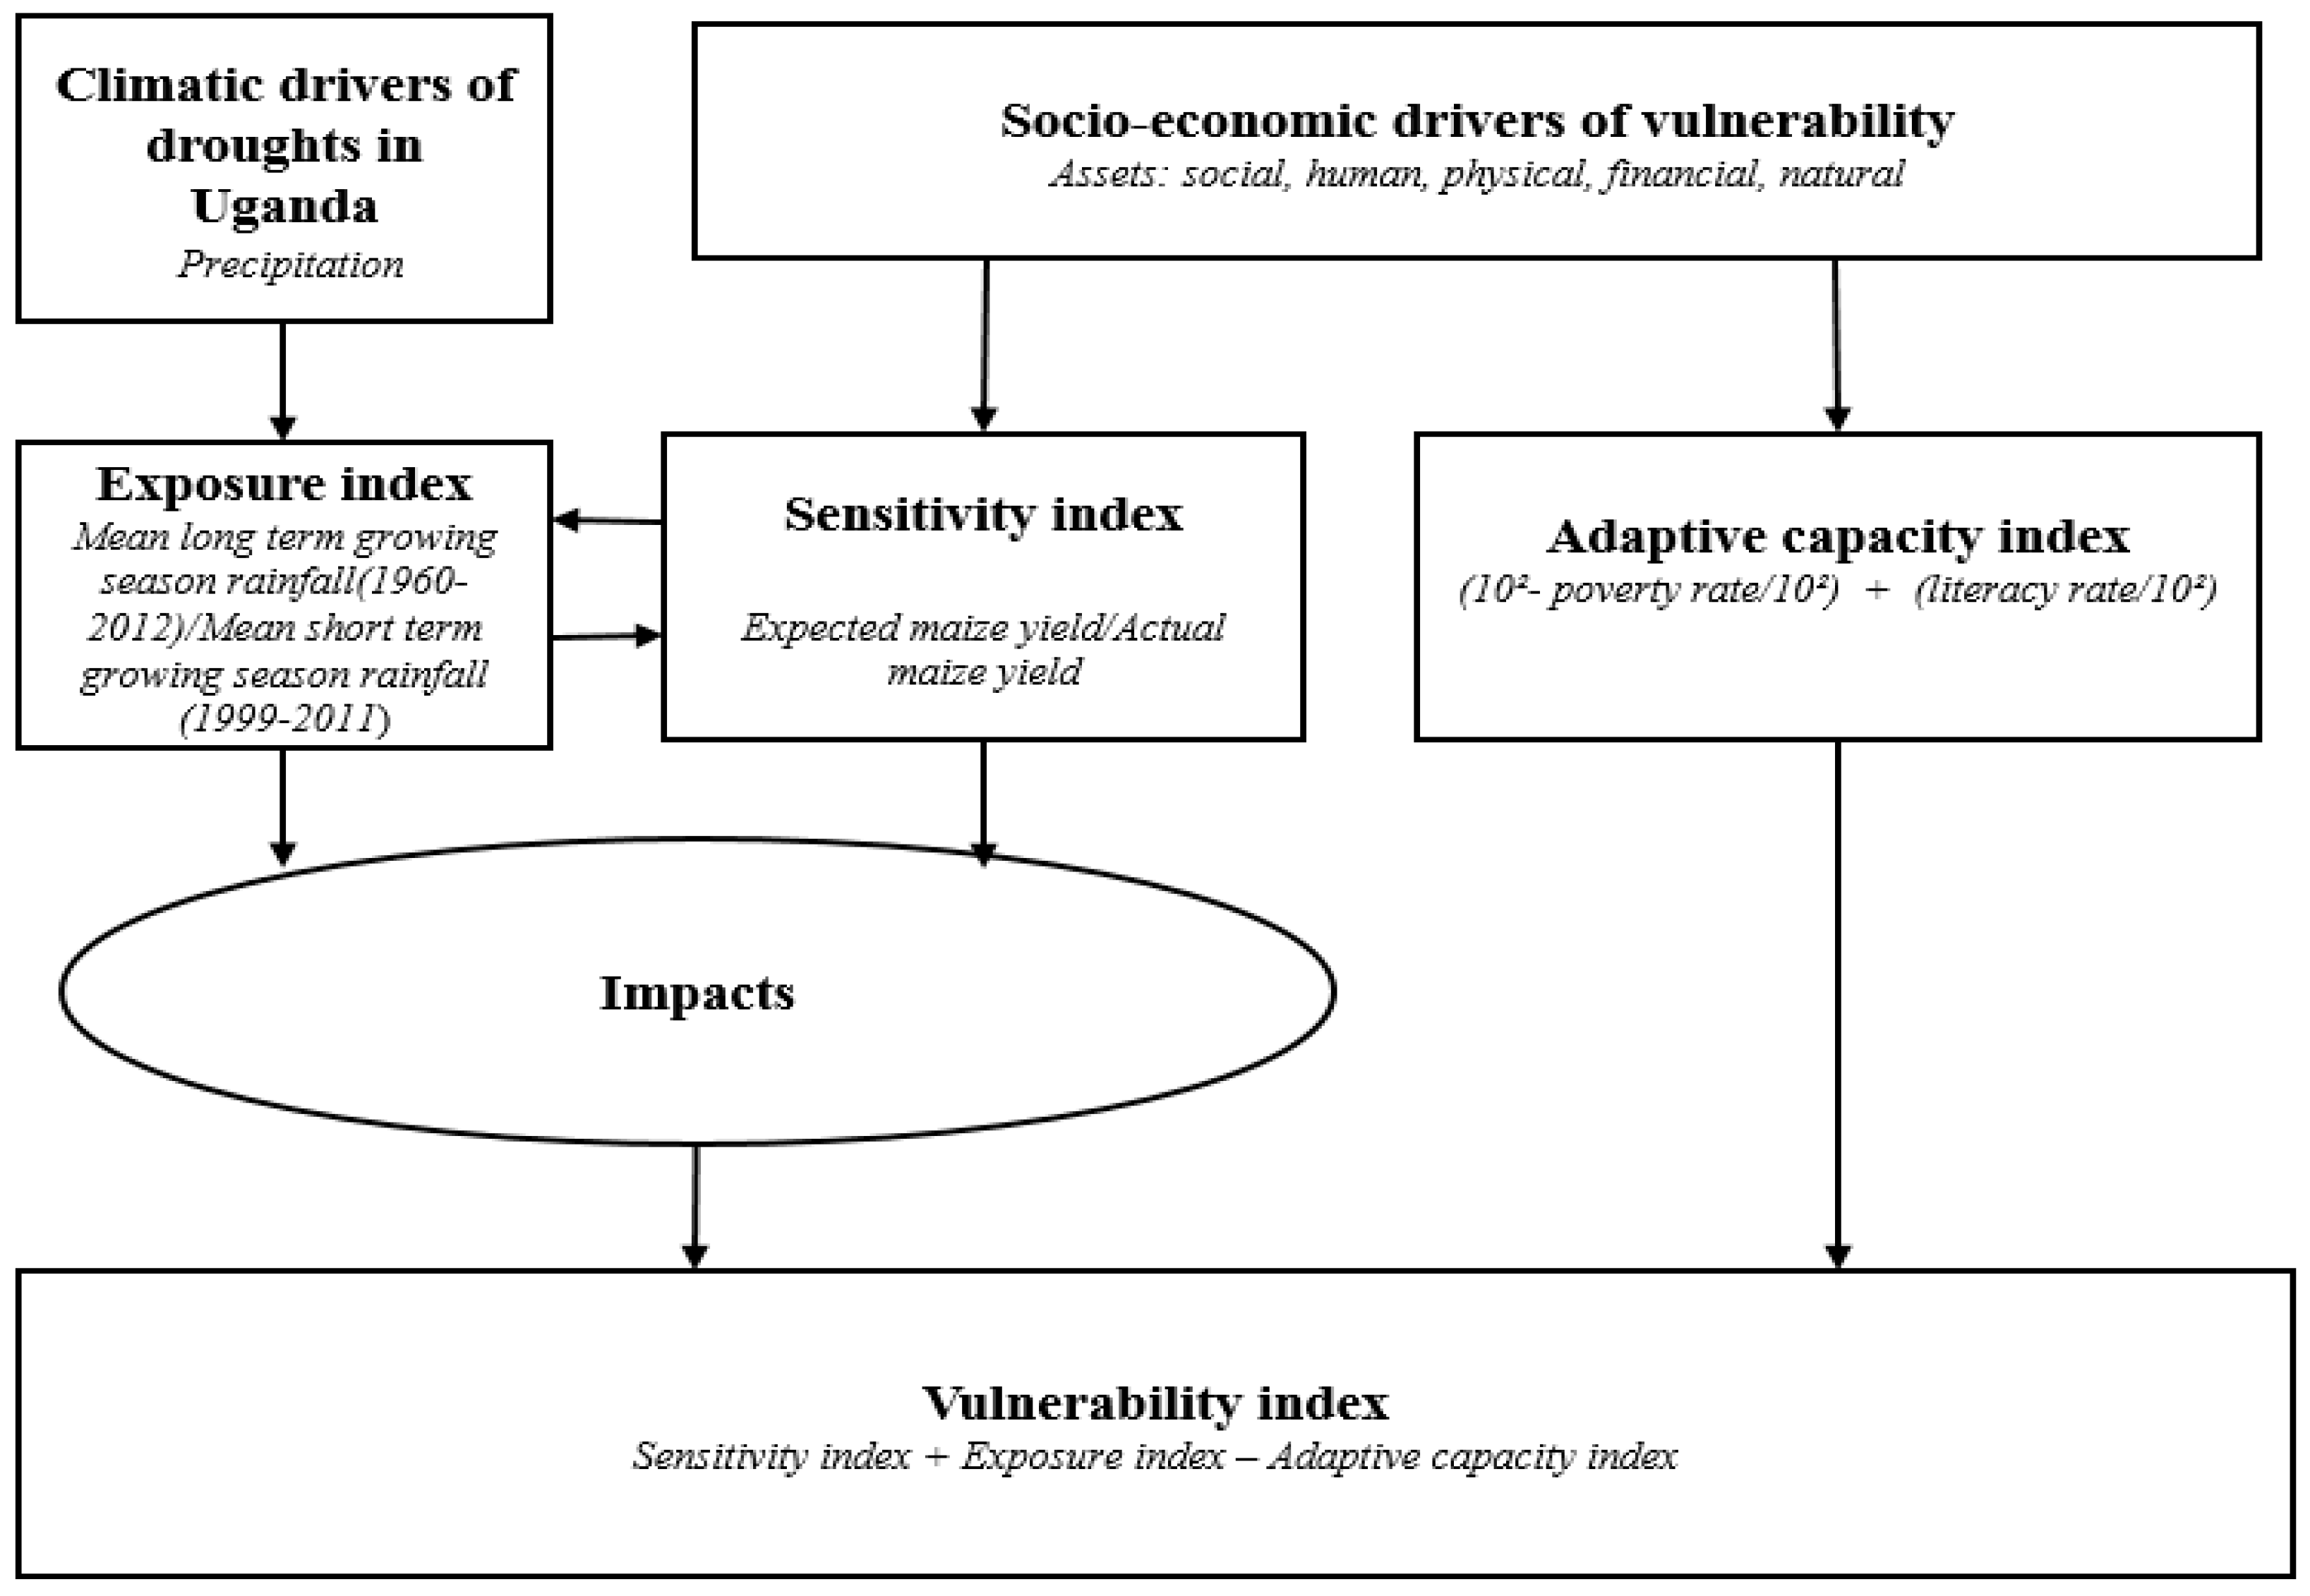
2.2. Methodology
2.3. Sensitivity Index
2.4. Exposure Index
2.5. Adaptive Capacity Index
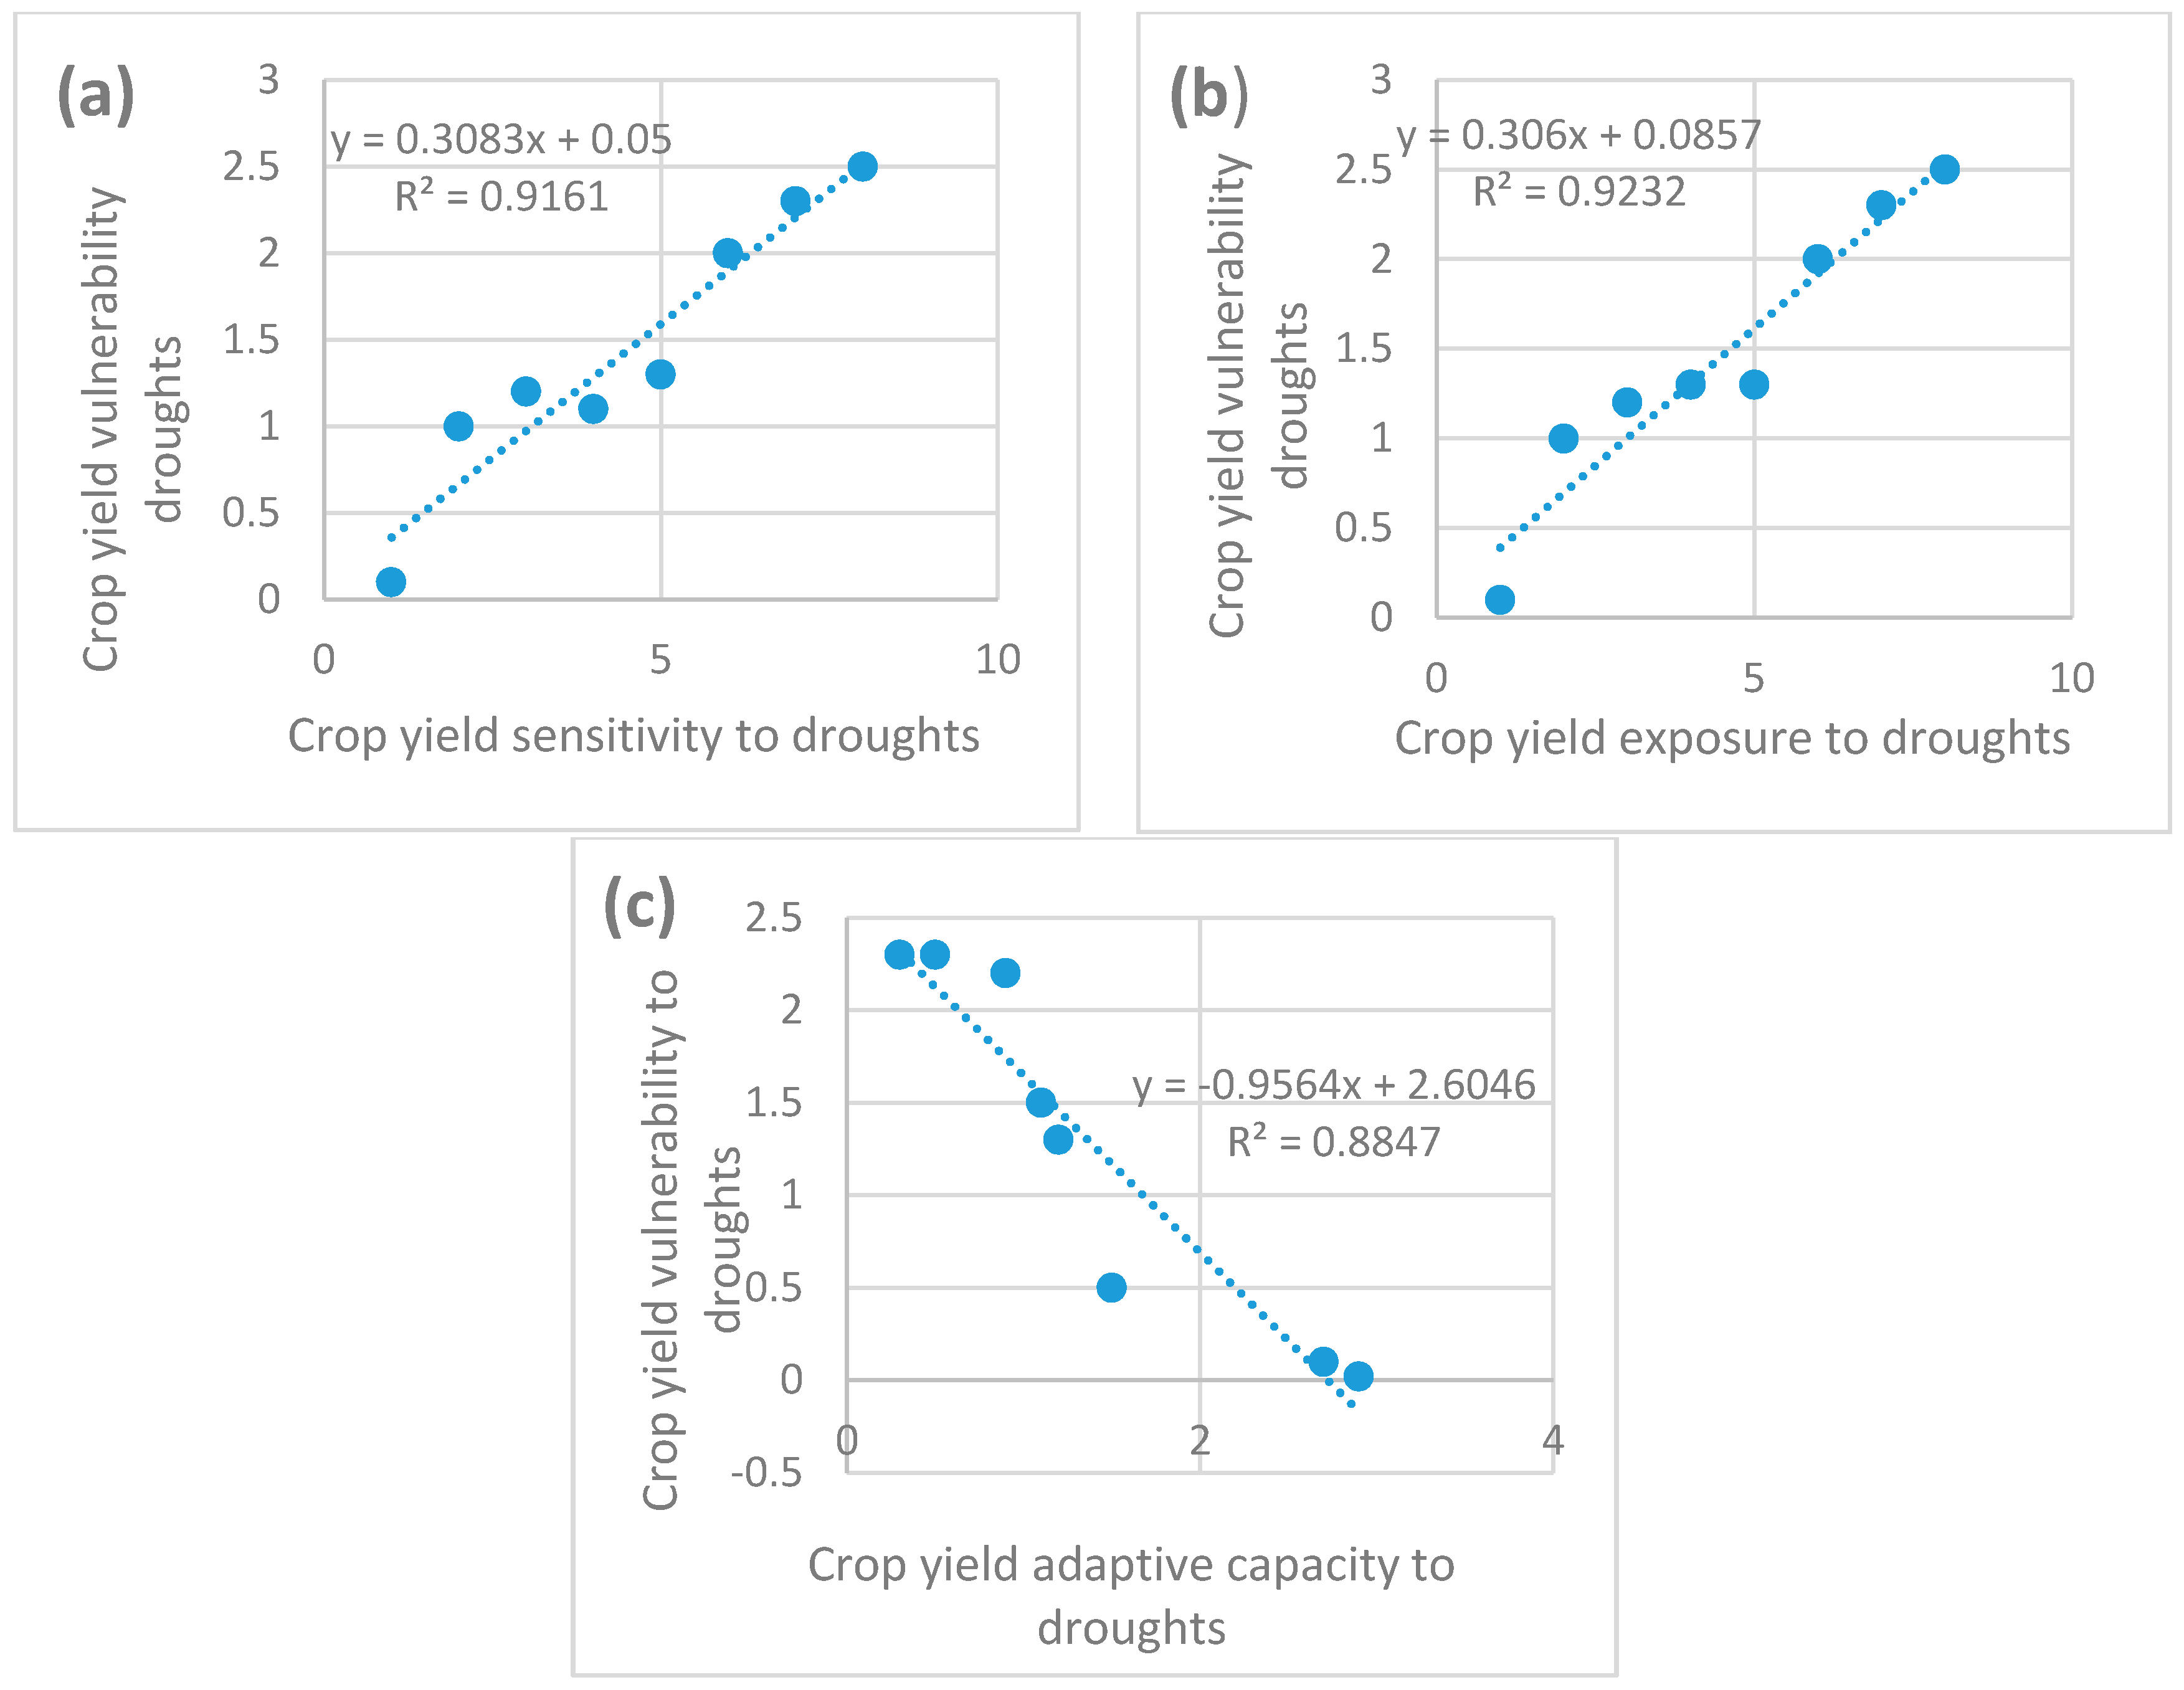
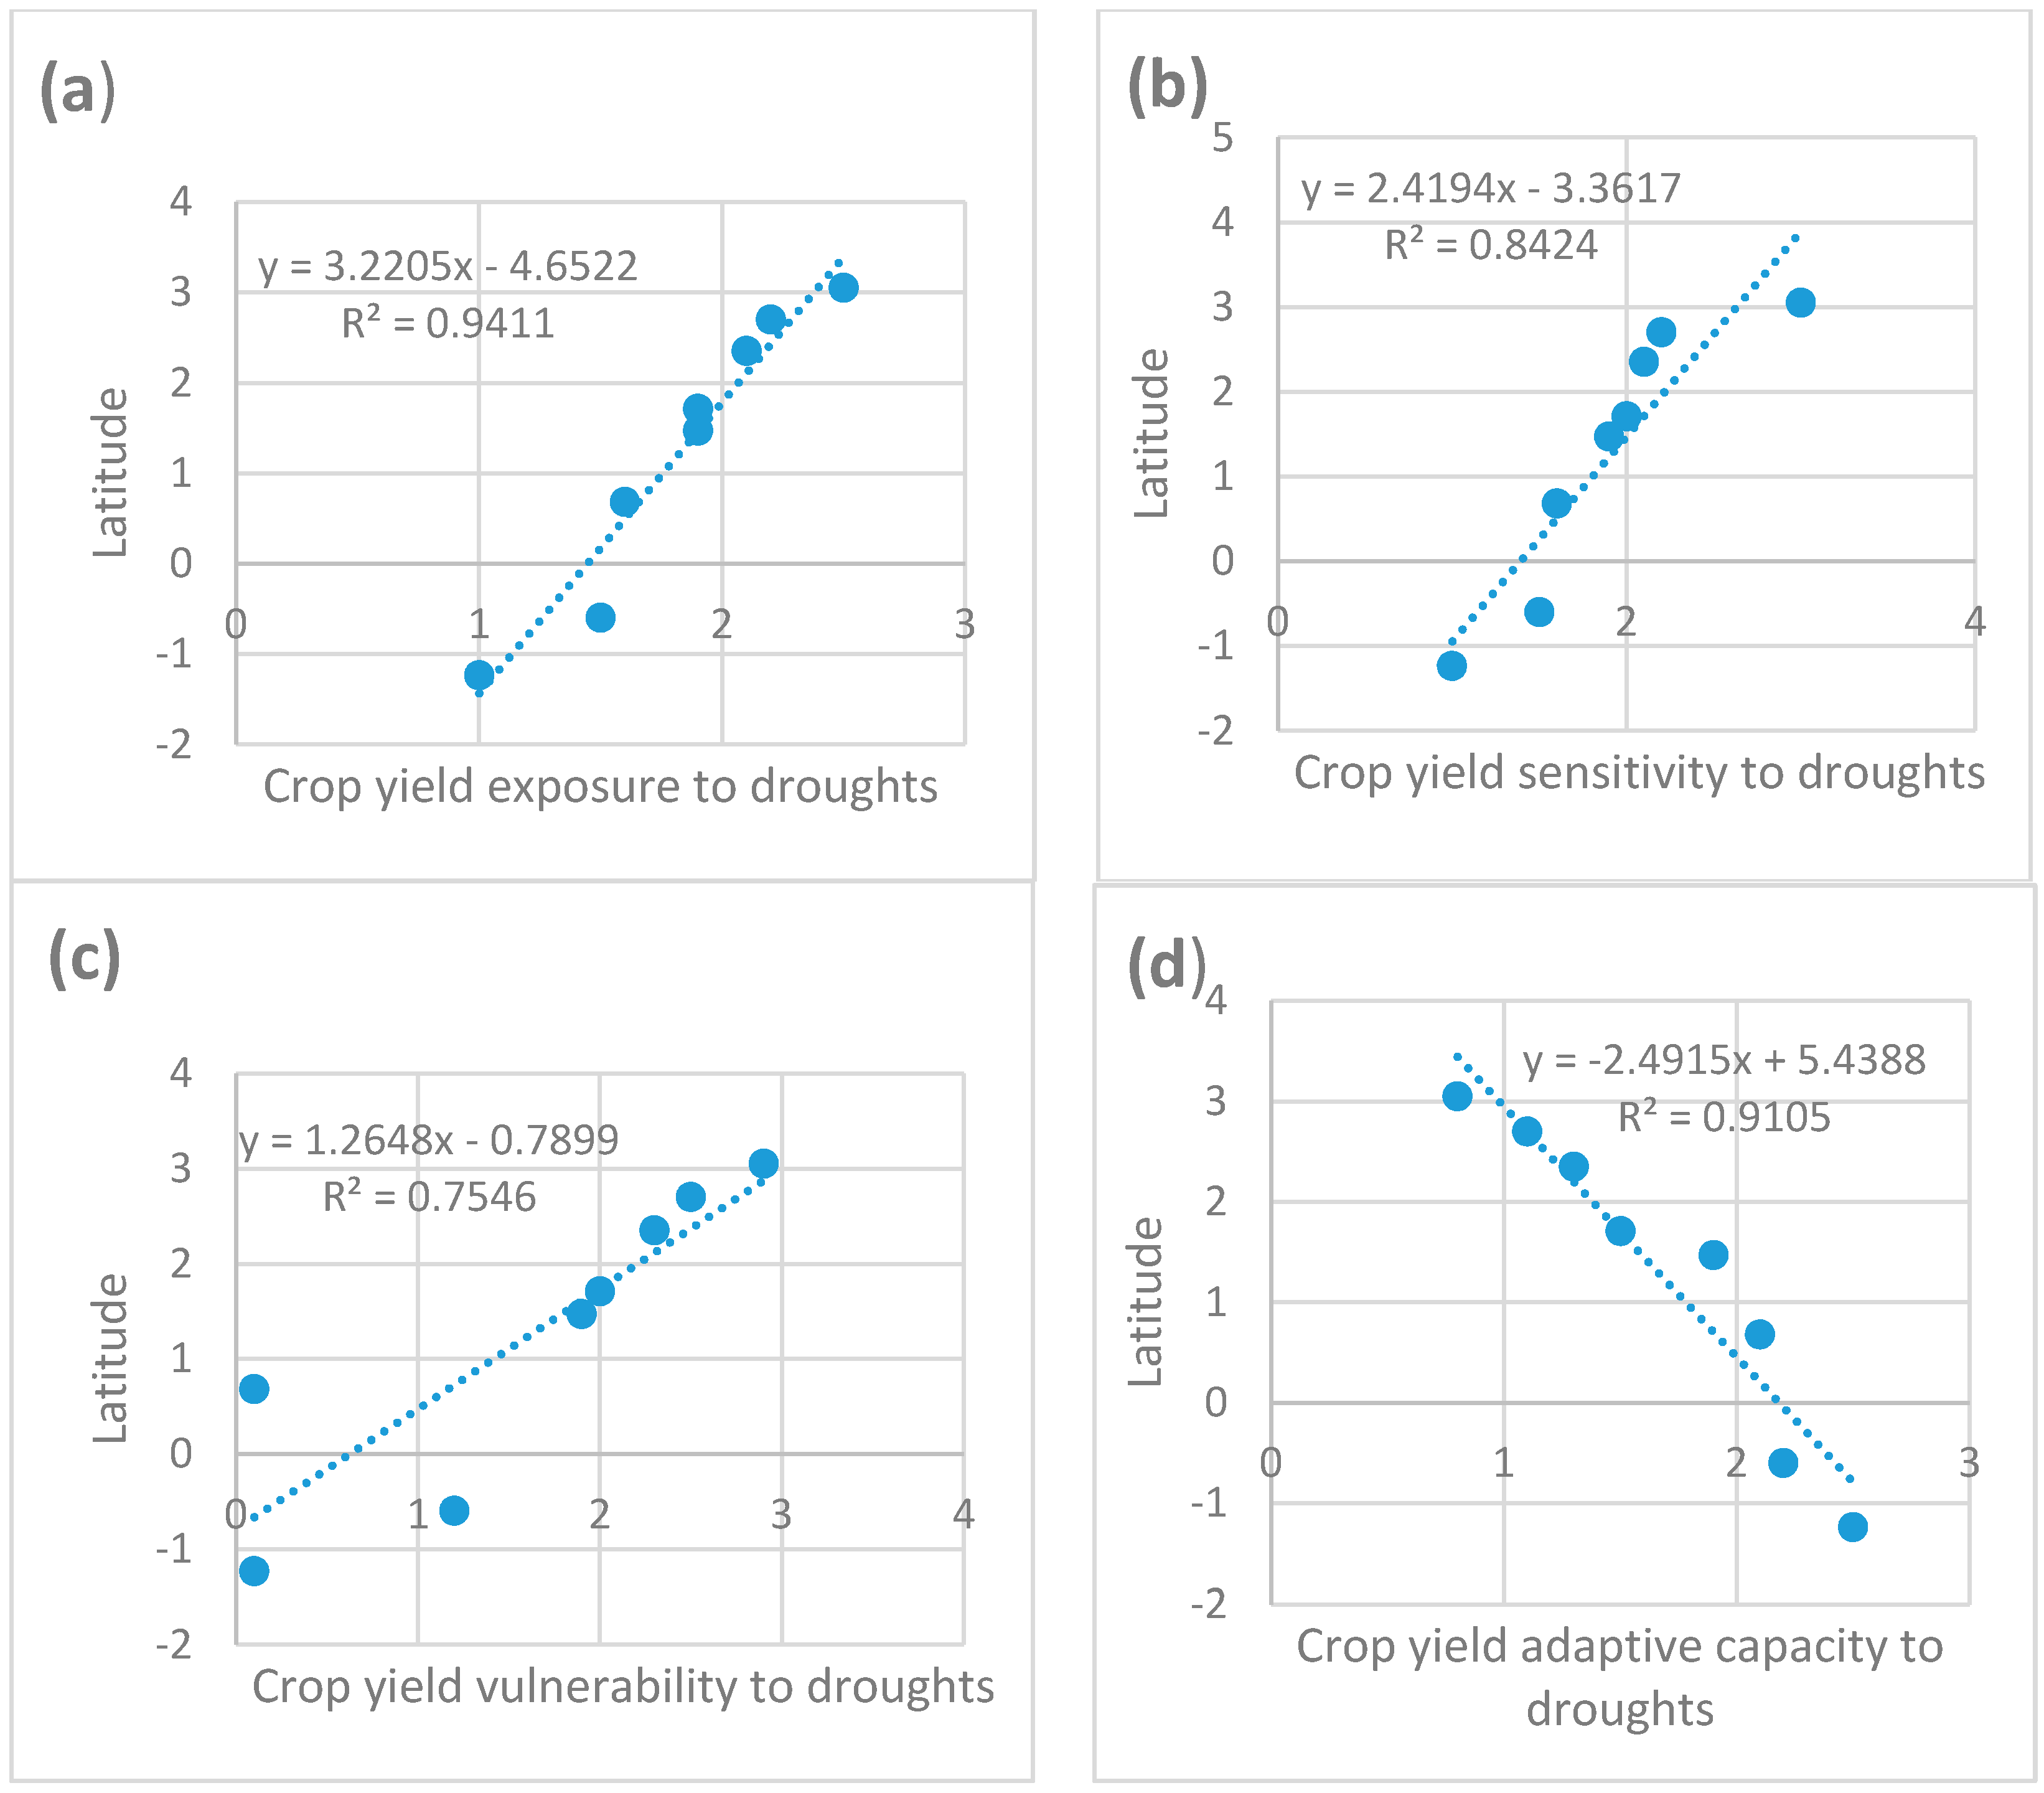
3. Results
4. Discussion
5. Conclusions
Acknowledgments
Author Contributions
Conflicts of Interest
References
- Intergovernmental Panel on Climate Change (IPCC). Climate Change 2007: Impacts, Adaptations and Vulnerability; Contributions of the Working Group 2 to the Fourth Assessment Report of the IPCC; Cambridge University Press: Cambridge, UK, 2007; p. 976. [Google Scholar]
- Parry, M.L.; Rosenzweig, C.; Iglesias, A.; Livermore, M.; Fischer, G. Effects of climate change on global food production under SRES emissions and socio-economic scenarios. Glob. Environ. Chang. 2004, 14, 53–67. [Google Scholar] [CrossRef]
- Challinor, A.; Wheeler, T.; Garforth, C.; Kassam, A. Assessing the vulnerability of food crop systems in Africa to climate change. Clim. Chang. 2007, 83, 382–399. [Google Scholar] [CrossRef]
- Schlenker, W.; Lobell, D.B. Robust negative impacts of climate change African agriculture. Environ. Res. Lett. 2010, 5, 014010. [Google Scholar] [CrossRef]
- Ford, J.D.; Gough, W.A.; Laidler, G.J.; MacDonald, J.; Irngaut, C.; Qrunnut, K. Sea ice, climate change, and community vulnerability in northern Foxe Basin, Canada. Clim. Res. 2009, 38, 137–154. [Google Scholar] [CrossRef]
- Ford, J.D. Vulnerability of Inuit food systems to food insecurity as a consequence of climate change: A case study from Igloolik, Nunavut. Reg. Environ. Chang. 2009, 9, 83–100. [Google Scholar] [CrossRef]
- Thomson, H.; Berrang-Ford, L.; Ford, J.D. Climate Change and Food Security in Sub-Saharan Africa: A Systematic Literature Review. Sustainability 2010, 2, 2719–2733. [Google Scholar] [CrossRef]
- Ford, J.D.; McDowell, G.; Shirley, J.; Pitre, M.; Siewierski, R.; Gough, W.; Statham, S. The dynamic multi-scale nature of climate change vulnerability: An Inuit harvesting example. Ann. Assoc. Am. Geogr. 2013, 103, 1193–1211. [Google Scholar] [CrossRef]
- Barros, V.R.; Field, C.B.; Dokken, D.J.; Mastrandrea, M.D.; Mach, K.J.; Bilir, T.E.; Chatterjee, M.; Ebi, K.L.; Estrada, Y.O.; Genova, R.C. (Eds.) Climate Change 2014: Impacts, Adaptation, and Vulnerability. Contribution of Working Group II to the Fifth Assessment Report of the Intergovernmental Panel on Climate Change; Cambridge University Press: Cambridge, UK; New York, NY, USA, 2014.
- Challinor, A.; Simelton, E.S.; Fraser, E.D.; Hemming, D. Increased crop failure due to climate change. Assessing adaptation options using models and socio-economic data for wheat in China. Environ. Res. Lett. 2010, 5, 034012. [Google Scholar] [CrossRef]
- Müller, C.; Cramer, W.; Hare, W.L.; Lotze-Campen, H. Climate change risks for African agriculture. Proc. Natl. Acad. Sci. 2011, 108, 4313–4315. [Google Scholar] [CrossRef] [PubMed]
- Cooper, P.; Dimes, J.; Rao, K.; Shapiro, B.; Shiferaw, B.; Twomlow, S. Coping better with current climatic variability in the rain-fed farming systems of sub-Saharan Africa: An essential first step in adapting to future climate change? Agric. Ecosyst. Environ. 2008, 126, 24–35. [Google Scholar] [CrossRef] [Green Version]
- Shi, W.; Tao, F. Vulnerability of maize yield to climate change and variability during 1961–2010. Food Secur. 2014, 6, 471–481. [Google Scholar] [CrossRef]
- Simelton, E.; Fraser, E.D.G.; Termansen, M.; Foster, P.M.; Dougill, A.J. Typologies of crop-drought vulnerability: An empirical analysis of the socioeconomic factors that influence the sensitivity and resilience to drought of three major food crops in China (1961–2001). Environ. Sci. Policy 2009, 12, 438–452. [Google Scholar] [CrossRef]
- Kaizzi, K. Application of the GYGA Approach to Uganda. 2014. Available online: http://www.yieldgap.org/gygamaps/excel/GygaUganda.xlsx (accessed on 3 May 2016).
- International Fund for Agricultural Development (IFAD). Enabling Poor Rural People to Overcome Poverty in Uganda: Rural Poverty in Uganda; IFAD: Rome, Italy, 2012. [Google Scholar]
- Comenetz, J.; Caviedes, C. Climate variability, political crises, and historical population displacements in Ethiopia. Glob. Environ. Chang. Part B Environ. Hazards 2002, 4, 113–127. [Google Scholar] [CrossRef]
- Green, R. The political economy of drought in Southern Africa 1991–1993. Health Policy Plan. 1993, 8, 256–266. [Google Scholar] [CrossRef]
- Kaizzi, K. Global Yield Gap Atlas: Uganda. 2016. Available online: http://www.yieldgap.org/gygamaps/excel/GygaUganda.xlsx (accessed on 3 May 2016).
- Poate, C.D. A Review of Methods for Measuring Crop Production from Small-holder Producers. Exp. Agric. 1988, 24, 1–14. [Google Scholar] [CrossRef]
- Fraser, E.D.G. Travelling in antique lands: using past famine to develop an adaptability/resilience framework to identify food systems vulnerability to climate change. Clim. Chang. 2007, 83, 495–514. [Google Scholar] [CrossRef]
- Department of Disaster Management; Office of the Prime Minister. The 2010–2011 Integrated Rainfall Variability Impacts, Needs Assessment and Drought Risk Management Strategy; Office of Prime Minster of Uganda: Kampala, Uganda, 2012.
- Houghton, J.T.; Ding, Y.; Grigg, D.J.; Noguer, M.; Van der Linden, P.J.; Dai, X.; Maskell, K.; Johnson, C.A. Climate Change 2001: The Scientific Basis; Contribution of Working Group I to the Third Assessment Report of the Intergovernmental Panel on Climate Change; Cambridge University Press: Cambridge, UK, 2001; p. 881. [Google Scholar]
- Robock, A.; Turco, R.; Harwell, M.A. Use of general circulation model output in the creation of climate change scenarios for impact analysis. Clim. Chang. 1993, 23, 293–335. [Google Scholar]
- Ward, P.; Lasage, R. Downscaled Climate Change Data from the HADCM3 and ECHAM5 Models on Precipitation and Temperature for Ethiopia and Kenya; Report W-09/05; Vrije Universiteit: Amsterdam, The Netherlands, 2009. [Google Scholar]
- McSweeney, C.; Lizcano, G.; New, M.; Lu, X. The UNDP Climate Change Country Profiles: Improving the accessibility of observed and projected climate information for studies of climate change in developing countries. Bull. Am. Meteorol. Soc. 2010, 91, 157–166. [Google Scholar] [CrossRef]
- Lobell, D.B.; Field, C. Global scale climate-crop yield relationships and the impacts of recent warming. Environ. Res. Lett. 2007, 2, 014002. [Google Scholar] [CrossRef]
- Epule, T.E.; Bryant, C.R. Maize production responsiveness to land use change and climate trends in Cameroon. Sustainability 2015, 7, 384–397. [Google Scholar] [CrossRef]
- Mutai, C.C.; Ward, M.N. East African rainfall and the tropical circulation/convection on intra-seasonal to inter-annual timescales. Am. Meteorol. Soc. 2010, 3, 3915–3939. [Google Scholar]
- Moss, R.H.; Edmonds, J.A.; Hibbard, K.A.; Manning, M.R.; Rose, S.K.; van Vuuren, D.P.; Carter, T.R.; Emori, S.; Kainum, M.; Kram, T.; et al. The next generation of scenarios for climate change research and assessment. Nature 2010, 463, 747–756. [Google Scholar] [CrossRef] [PubMed]
- Challinor, A. Towards the development of adaptation options using climate and crop yield forecasting at seasonal to multi-decadal timescales. Environ. Sci. Policy 2009, 12, 453–465. [Google Scholar] [CrossRef]
- Epule, T.E.; Bryant, C.R.; Akkari, C.; Daouda, O. Can organic fertilizers set the pace for a greener arable agricultural revolution in Africa? Analysis, synthesis and way forward. Land Use Policy 2015, 47, 179–187. [Google Scholar] [CrossRef]
- Duvick, D.N.; Cassman, K.G. Post-green revolution trends in yield potential of temperate maize in North-Central United States. Crop Sci. 1999, 39, 1622–1630. [Google Scholar] [CrossRef]
- Kulcharik, C.J.; Serbin, S. Impacts of recent climate change on Wisconsin corn and soyabean yield trends. Environ. Res. Lett. 2008, 3, 034003. [Google Scholar] [CrossRef]
- Mishra, A.K.; Singh, V. A review of drought concepts. J. Hydrol. 2010, 391, 202–216. [Google Scholar] [CrossRef]
- Mishra, A.K.; Singh, V. Drought modeling—A review. J. Hydrol. 2011, 403, 157–175. [Google Scholar] [CrossRef]
- Epule, T.E.; Peng, C.; Lepage, L.; Chen, Z. The causes, effects and challenges of Sahelian droughts: A critical review. Reg. Environ. Chang. 2014, 14, 145–156. [Google Scholar] [CrossRef]
- Tarhule, A. Damaging rainfall and flooding: The other Sahel hazard. Clim. Chang. 2005, 72, 355–377. [Google Scholar] [CrossRef]
- Faure, H.; Gac, J. Will the Sahelian droughts end in 1985? Nature 1981, 291, 475–478. [Google Scholar] [CrossRef]
- Zeng, N. Droughts in the Sahel. Science 2003, 302, 999–1000. [Google Scholar] [CrossRef] [PubMed]
- Farley, C.; Farmer, A. Uganda Climate Change Vulnerability Report. USAID, 2013. Available online: https://www.climatelinks.org/sites/default/files/asset/document/ARCC-Uganda%2520VA-Report.pdf (accessed on 25 May 2016).
- Government of Uganda, Ministry of Water and Environment. Inception Report: Climate Change Vulnerability Assessment, Adaptation Strategy and Action Plan for the Water Resources Sector in Uganda; One World Sustainable Investments, Directorate of Water Resource Management: Kampala, Uganda, 2008.
- Mubiru, J.; Banda, E.J.K.B. Monthly average daily global irradiation map for Uganda: A location in the equatorial region. Ren. Energy 2012, 412–415. [Google Scholar] [CrossRef]
- Sherman, M.; Ford, J.D.; Lianos-Cuentas, A.; Valdivia, M.J.; IHACC Research Group. Food system vulnerability amidst the extreme 2010–2011 flooding in the Peruvian Amazon: A case study from the Ucayali region. Food Secur. 2016, 8, 551–570. [Google Scholar] [CrossRef]
- McCarthy, J.J.; Canziani, O.F.; Leary, N.A.; Dokken, D.J.; White, K.S. (Eds.) Climate Change 2001: Impacts, Adaptation and Vulnerability; Cambridge University Press: Cambridge, UK, 2001.
- O’Brien, K.; Eriksen, S.; Nygaard, L.P.; Schjolden, A. Why different interpretations of vulnerability matter in climate change discourses. Clim. Policy 2007, 7, 73–88. [Google Scholar] [CrossRef]
- Füssel, H.M. Development and Climate Change. Background Note: Review and Quantitative Analysis of Indices of Climate Change Exposure, Adaptive Capacity and Sensitivity and Impacts; World Development Report; Potsdam Institute of Climate Impact Research: Potsdam, Germany, 2009. [Google Scholar]
- Sherman, M.; Ford, J.D. Market engagement and food insecurity after a climatic hazard. Glob. Food Secur. 2013, 2, 144–155. [Google Scholar] [CrossRef]
- Ford, J.D.; Keskitalo, E.C.H.; Smith, T.; Pearce, T.; Berrang-Ford, L.; Duerden, F.; Smit, B. Case study and analogue methodologies in climate change vulnerability research. Wiley Interdiscip. Rev. Clim. Chang. 2010, 1, 374–392. [Google Scholar] [CrossRef]
- Ford, J.D.; Smit, B. A framework for assessing the vulnerability of communities in the Canadian Arctic to risks associated with climate change. Arctic 2004, 57, 389–400. [Google Scholar] [CrossRef]
- Ford, J.D.; Smit, B.; Wandel, J.; MacDonald, J. Vulnerability to climate change in Igloolik, Nunavut: What we can learn from the past and present. Polar Rec. 2006, 42, 127–138. [Google Scholar] [CrossRef]
- Smit, B.; Wandel, J. Adaptation, adaptive capacity and vulnerability. Glob. Environ. Chang. 2006, 16, 282–292. [Google Scholar] [CrossRef]
- Easterling, W.E.; Aggarwal, P.K.; Batima, P.; Brander, K.M.; Erda, L.; Howden, S.M.; Kirilenko, A.; Morton, J.; Soussan, J.F.; Schmidhuber, J.; et al. Food, fibre and forest products. In Climate Change 2007: Impacts, Adaptation and Vulnerability. Contribution of Working Group II to the Fourth Assessment Report of the Intergovernmental Panel on Climate Change; Parry, M.L., Canziani, O.F., Palutikof, J.P., van der Linden, P., Hanson, C., Eds.; Cambridge University Press: Cambridge, UK, 2007; pp. 273–313. [Google Scholar]
- Nelson, D.R.; Adger, N.; Brown, K. Adaptation to environmental change: Contributions of a resilience framework. Ann. Rev. Environ. Res. 2007, 32, 395–419. [Google Scholar] [CrossRef]
- Chen, C.; Noble, I.; Hellmann, J.; Coffee, J.; Murillo, M.; Chawla, N. University of Notre Dame Global Adaptation Index Country Index Technical Report. 2015. Available online: http://index.nd-gain.org:8080/documents/nd-gain_technical_document_2015.pdf (accessed on 9 June 2016).
- Sullivan, C. Calculating a water poverty index. World Dev. 2002, 30, 1195–1210. [Google Scholar] [CrossRef]
- Adger, W.N.; Brooks, N.; Bentham, G.; Agnew, M.; Eriksen, S. New Indicators of Vulnerability and Adaptive Capacity in Technical Report, 7; Tyndall Centre for Climate Research: Norwich, UK, 2004. [Google Scholar]
- Eriksen, S.H.; Kelly, P.M. Developing credible vulnerability indicators for climate change adaptation policy assessment. Mitig. Adapt. Strateg. Glob. Chang. 2007, 12, 495–524. [Google Scholar] [CrossRef]
- IPCC. IPCC Expert Meeting on the Science of Alternative Matrices. 2009. Available online: http://citeseerx.ist.psu.edu/viewdoc/download?doi=10.1.1.171.674&rep=rep1&type=pdf (accessed on 23 January 2017).
- Fermont, A.; Benson, T. Estimating Yield of Food Crops Grown by Smallholder Farmers: A Review in the Uganda Context. IFPRI Discussion Paper No. 01097. Available online: http://www.ifpri.org/publication/estimating-yield-food-crops-grown-smallholder-farmers (accessed on 10 May 2016).
- Food and Agricultural Organization of the United Nations Statistics Division, FAO. FAOSTAT. 2016a. Available online: http://faostat3.fao.org/download/Q/QC/E (accessed on 5 May 2016).
- Sacks, W.J.; Deryng, D.; Foley, J.A.; Ramankutty, N. Crop planting dates: an analysis of global patterns. Glob. Ecol. Biogeogr. 2010, 19, 607–620. [Google Scholar]
- Global Yield Gap Atlas, GYGA. FAO Crop Calendars for Maize, Sorghum, Millet, Rice and Barley. 2013. Available online: http://www.yieldgap.org/gygamaps/pdf/Details%20on%20crop%20information%20to%20calibrate%20crop%20models%20for%20Uganda.pdf (accessed on 1 May 2016).
- Food and Agricultural Organization of the United Nations, FAO. Uganda Crop Calendar (Major Crops). 2016b. Available online: http://www.fao.org/giews/countrybrief/country.jsp?code=UGA (accessed on 4 May 2016).
- World Bank Group. Climate Change Knowledge Portal for Development Practitioners and Policy Makers. 2016. Available online: http://sdwebx.worldbank.org/climateportal/index.cfm?page=country_historical_climate&ThisRegion=Africa&ThisCCode=UGA (accessed on 2 May 2016).
- Redsteer, M.; Kelley, K.; Francis, H.; Block, D. Global Assessment Report on Disaster Risk Reduction: Chapter 3: Drought Risk. 2011. Available online: http://www.preventionweb.net/english/hyogo/gar/2011/en/bgdocs/Redsteer_Kelley_Francis_&_Block_2010.pdf (accessed on 23 January 2017).
- Brocks, N.; Adger, W.N.; Kelly, P.M. The determinants of vulnerability and adaptive capacity at the national level and the implications for adaptation. Glob. Environ. Chang. 2005, 15, 151–162. [Google Scholar] [CrossRef]
- Sivakumar, M.V.K.; Das, H.P.; Brunini, O. Impacts of present and future climate variability and change on agriculture and forestry in the arid and semi-arid tropics. Clim. Chang. 2005, 70, 31–72. [Google Scholar] [CrossRef]
- Hentschel, J.; Lanjouw, J.O.; Lanjouw, P.; Poggi, J. Combining census and survey data to trace the spatial dimensions of poverty: A case study of Ecuador. World Bank Econ. Rev. 2000, 14, 147–165. [Google Scholar] [CrossRef]
- Alderman, H.; Babita, M.; Demombynes, G.; Makhatha, N.; Özler, B. How low can you go? Combining census and survey data for mapping poverty in South Africa. J. Afr. Econ. 2002, 11, 169–200. [Google Scholar] [CrossRef]
- Smit, B.; Pilifosova, O. From adaptation to adaptive capacity and vulnerability reduction. In Climate Change, Adaptive Capacity and Development; Smith, J.B., Klein, R.J.T., Huq, S., Eds.; Imperial College Press: London, UK, 2003. [Google Scholar]
- Bangladesh Bureau of Statistics and United Nations World Food Programme. Local Estimation of Poverty and Malnutrition in Bangladesh; Bangladesh Bureau of Statistics: Dhaka, Bangladesh, 2004.
- Benson, T.; Chamberlin, J.; Rhinehart, I. An investigation of the spatial determinants of the local prevalence of poverty in rural Malawi. Food Policy 2005, 30, 532–550. [Google Scholar] [CrossRef]
- Minot, N.B.; Baulch, H.; Epprecht, M. Poverty and Inequality in Vietnam: Spatial Patterns and Geographic Determinants; Research Report No. 148; International Food Policy Research Institute: Washington, DC, USA, 2006. [Google Scholar]
- Alkire, S.; Santos, M.E. Acute Multidimensional Poverty: A New Index for Developing Countries; OPHI Working Paper No. 38; Oxford Poverty and Human Development Initiative: Oxford, UK, 2010. [Google Scholar]
- Daniels, L. Measuring Poverty Trends in Uganda with Non-Monetary Indicators. 2011. Available online: http://www.fao.org/fileadmin/templates/ess/pages/rural/wye_city_group/2011/documents/session3/Daniels_-_Paper.pdf (accessed on 9 May 2016).
- Uganda Bureau of Statistics, UBOS. 2002 Uganda Population and Household Census Analytical Report: Education and Literacy. 2006. Available online: http://www.ubos.org/onlinefiles/uploads/ubos/pdf%20documents/2002%20CensusEducAnalyticalReport.pdf (accessed on 9 May 2016).
- Lobell, D.B.; Schlenker, W.; Costa-Roberts, J. Climate trends and global crop production since 1980. Science 2011, 333, 616–620. [Google Scholar] [CrossRef] [PubMed]
- Nicholson, S.E.; Trucker, C.J.; Ba, M.B. Desertification, drought and surface vegetation: An example from the West African Sahel. Bull. Am. Meteorol. Soc. 1998, 79, 815–829. [Google Scholar] [CrossRef]
- Wang, B.; Ding, Q.; Fu, X.; Jin, K.; Shukla, J.; Doblas-Reyes, F. Fundamental challenge in simulation and prediction of summer monsoon rainfall. Geophy. Res. Lett. 2005, 32, 15711. [Google Scholar] [CrossRef]
- Peng, C.; Ma, Z.; Lei, X.; Zhu, Q.; Chen, Q.; Wang, W.; Liu, S.; Li, W.; Fang, X.; Zhou, X. A drought-induced pervasive increase in tree mortality across Canada’s boreal forests. Nat. Clim. Chang. 2011, 1, 467–471. [Google Scholar] [CrossRef]
- Thornton, P.; Jones, P.G.; Alagarswamy, G.; Anderson, J.; Herrero, M. Adapting to climate change: Agricultural systems and household impacts in East Africa. Agric. Syst. 2010, 103, 73–82. [Google Scholar] [CrossRef]
- Sen, A.K. Poverty and famines: An essay on entitlement and deprivation. Clarendon Press: Oxford, UK, 1981. [Google Scholar]
- Moser, C.O.N. The asset vulnerability framework: Reassessing urban poverty reduction strategies. World Dev. 1998, 26, 1–19. [Google Scholar] [CrossRef]
- Minot, N.; Epprecht, M.; Anh, T.T.T.; Trung, L.Q. Income Diversification and Poverty in the Northern Uplands of Vietnam; Research Report No. 145; International Food Policy Research Institute: Washington, DC, USA, 2006. [Google Scholar]
- Gbetibouo, G.; Ringler, C.; Hassan, R. Vulnerability of the South African farming sector to climate change and variability: An indicator approach. Nat. Res. Forum 2010, 34, 175–187. [Google Scholar] [CrossRef]
- Defiesta, G.; Rapera, C. Measuring adaptive capacity of farmers to climate change and variability: Application of a composite index to an agricultural community in the Philippines. J. Environ. Sci. Manag. 2014, 17, 48–62. [Google Scholar]
- Pretty, J. Social capital and the collective management of resources. Science 2003, 302, 1912–1914. [Google Scholar] [CrossRef] [PubMed]
- Scoones, I. Sustainable Rural Livelihoods: A Framework for Analysis in Working Paper, 72; Institute of Development Studies: Sussex, UK, 1998. [Google Scholar]
- Rakodi, C.A. Capital assets framework for analyzing household livelihood strategies: Implications for policy. Dev. Policy Rev. 1999, 17, 315–342. [Google Scholar] [CrossRef]
- Niang, I.; Ruppel, O.C.; Abdrabo, M.A.; Essel, A.; Lennard, C.; Padgham, J.; Urquhart, P. IPCC Working Group II: Climate Change Assessment Report. Chapter 22 Africa. 2014. Available online: https://www.ipcc.ch/pdf/press/ipcc_leaflets_2010/ipcc_ar5_leaflet.pdf (accessed on 23 January 2017).
- Olsson, L.; Opondo, M.; Tschakert, P.; Argawal, A.; Eriksen, S.H.; Ma, S.; Zakieldeen, A.A.; Cutter, S. Livelihoods and Poverty. In Climate Change 2014: Impacts, Adaptation, and Vulnerability. Part A: Global and Sectoral Aspects. Contribution of Working Group II to the Fifth Assessment Report of the Intergovernmental Panel on Climate Change; Field, C.B., Barros, V.R., Dokken, D.J., Mach, K.J., Mastrandrea, M.D., Bilir, T.E., Chatterjee, M., Ebi, K.L., Estrada, Y.O., Genova, R.C., et al., Eds.; Cambridge University Press: Cambridge, UK; New York, NY, USA, 2014; pp. 793–832. [Google Scholar]
- Osbahr, H.; Dorward, P.; Stern, R.; Cooper, S. Supporting agricultural innovation in Uganda to respond to climate risk: Linking climate change and variability with farmer perceptions. Exp. Agric. 2010, 47, 293–316. [Google Scholar] [CrossRef]
- Okonya, J.; Syndikus, K.; Kroschel, J. Farmer’s perception of and coping strategies to climate change: Evidence from six agro-ecological zones of Uganda. J. Agric. Sci. 2013, 5, 252–263. [Google Scholar]


| District | Crop | Longitude | Latitude | Elevation (m) |
|---|---|---|---|---|
| North | ||||
| Arua | Rainfed maize | 30.91 | 3.05 | 1211 |
| Gulu | Rainfed maize | 32.28 | 2.78 | 1105 |
| Kitgum | Rainfed maize | 32.88 | 3.27 | 953 |
| Lira | Rainfed maize | 32.93 | 2.35 | 1091 |
| Soroti | Rainfed maize | 33.61 | 1.71 | 1123 |
| South | ||||
| Kabale | Rainfed maize | 30.01 | −1.23 | 1869 |
| Mbarara | Rainfed maize | 30.68 | −0.6 | 1402 |
| Tororo | Rainfed maize | 34.16 | 0.68 | 1171 |
| Bulindi-Hoima | Rainfed maize | 31.44 | 1.47 | 1209 |
| Namulonge | Rainfed maize | 32.61 | 0.52 | 1160 |
| Parameters | Precipitation Estimates | Temperature Estimates |
|---|---|---|
| Sensitivity index | 1.06 | 1.06 |
| Exposure index | 0.99 | 0.99 |
| Adaptive capacity index | 1.45 | 1.45 |
| Vulnerability index | 0.6 | 0.6 |
© 2017 by the authors. Licensee MDPI, Basel, Switzerland. This article is an open access article distributed under the terms and conditions of the Creative Commons Attribution (CC BY) license ( http://creativecommons.org/licenses/by/4.0/).
Share and Cite
Epule, T.E.; Ford, J.D.; Lwasa, S.; Lepage, L. Vulnerability of Maize Yields to Droughts in Uganda. Water 2017, 9, 181. https://doi.org/10.3390/w9030181
Epule TE, Ford JD, Lwasa S, Lepage L. Vulnerability of Maize Yields to Droughts in Uganda. Water. 2017; 9(3):181. https://doi.org/10.3390/w9030181
Chicago/Turabian StyleEpule, Terence Epule, James D. Ford, Shuaib Lwasa, and Laurent Lepage. 2017. "Vulnerability of Maize Yields to Droughts in Uganda" Water 9, no. 3: 181. https://doi.org/10.3390/w9030181