Review

CryoSat-2 Altimetry Applications over Rivers and Lakes

1
Department of Environmental Engineering, Technical University of Denmark, Bygningstorvet B115, 2800 Kongens Lyngby, Denmark
2
National Space Institute, Technical University of Denmark, Elektrovej 327, 2800 Kongens Lyngby, Denmark
*
Author to whom correspondence should be addressed.
Water 2017, 9(3), 211; https://doi.org/10.3390/w9030211
Submission received: 3 February 2017 / Revised: 5 March 2017 / Accepted: 9 March 2017 / Published: 13 March 2017
(This article belongs to the Special Issue The Use of Remote Sensing in Hydrology)

Abstract

:
Monitoring the variation of rivers and lakes is of great importance. Satellite radar altimetry is a promising technology to do this on a regional to global scale. Satellite radar altimetry data has been used successfully to observe water levels in lakes and (large) rivers, and has also been combined with hydrologic/hydrodynamic models. Except CryoSat-2, all radar altimetry missions have been operated in conventional low resolution mode with a short repeat orbit (35 days or less). CryoSat-2, carrying a Synthetic Aperture Radar (SAR) altimeter, has a 369-day repeat and a drifting ground track pattern and provides new opportunities for hydrologic research. The narrow inter-track distance (7.5 km at the equator) makes it possible to monitor many lakes and rivers and SAR mode provides a finer along-track resolution, higher return power and speckle reduction through multi-looks. However, CryoSat-2 challenges conventional ways of dealing with satellite inland water altimetry data because virtual station time series cannot be directly derived for rivers. We review the CryoSat-2 mission characteristics, data products, and its use and perspectives for inland water applications. We discuss all the important steps in the workflow for hydrologic analysis with CryoSat-2, and conclude with a discussion of promising future research directions.

1. Introduction

Rivers and lakes are important fresh water resources. The global distribution of rivers and lakes is shown in Figure 1. They supply drinking water for many people in the world [1] and in particular for the vast majority of people in poverty. However, these people often are also vulnerable to flooding from the very same rivers. For instance, the Brahmaputra River sustains lives and livelihood along its banks, while draining through the Assam Valley. However, floods occur in monsoons every year and severe floods have happened frequently in the last decade, which caused huge losses to life and property [2]. Just like rivers, lakes serve many purposes. Not only do they provide freshwater for human use, including agriculture, but they also maintain important natural processes and ecosystems [3]. Nevertheless, many lakes around the world are shrinking and some have vanished under the influence of climate change and anthropogenic activities while in other regions, lakes are expanding (e.g., inner Tibetan Plateau) [4,5,6,7,8]. Therefore, global monitoring of the variation of rivers and lakes is an important research topic.
Water level is one basic and key quantity in hydrological research, which is closely related to discharge in rivers and water volume in lakes and reservoirs. Traditionally, water level observations are recorded in situ by water-level recorders or visual readings from a staff gauge. These gauging stations are normally established at point scale and often organized on a national basis. Thus, the spatial resolution is limited and the data release is slow [10]. Moreover, the number of freely accessible gauging station records in rivers is decreasing since the late 1970s [11]. Also, data sharing is a big problem, especially in transboundary river basins [12]. Here, water level observations from satellite remote sensing have advantages over traditional observations. First, remote sensing has universal spatial coverage, i.e., transboundary and inaccessible or dangerous regions are also covered. Second, data acquisition is normally free and timely, which paves the way to operational forecasting systems. With respect to observing water level, satellite altimeters make it possible to monitor water levels in lakes and sufficiently large rivers with acceptable spatio-temporal resolution. Satellite altimetry has been an important tool in inland water monitoring although the technique was initially designed for monitoring oceans [13,14,15,16,17,18,19]. For example, satellite altimetry makes it possible to monitor the water level and storage variation of hundreds of lakes in the Tibetan Plateau [17,20,21]. Another application is supporting river discharge modelling, in particular in transboundary areas and remote areas, such as the Brahmaputra or Amazon river basins, etc. [22,23,24]. An alternative technology for precise remote sensing of water heights is Global Navigation Satellite System (GNSS) Reflectometry [25,26,27]. This technique requires, however, ground-based or airborne GNSS receivers in the vicinity of the lake or river.
The precision of altimetry measurements has improved significantly from the first satellite altimeter (on Skylab, 1973). The list of past and current satellite altimetry missions includes GEOS-3, SeaSat, Geosat, TOPEX/Poseidon, Geosat Follow-on, Jason-1/2/3 from the National Aeronautics and Space Administration (NASA). From the European Space Agency (ESA) there are ERS-1/2, ENVISAT, CryoSat-2, and Sentinel-3. Besides that, some other missions are also in operation, such as HY-2A planned by China, or SARAL/AltiKa as a joint Indian–French project (see Table 1 for an overview). All the above mentioned missions carry radar altimeters. Besides radar altimeter missions, there has been a satellite lidar mission, ICESat, which provided similar data products for inland waters. Common to all missions except CryoSat-2 is a repeat orbit with a short repeat cycle of 10 to 35 days. Such repeat cycles have sparse ground track patterns with an inter-track distance of at least 80 km at the equator. Precision and bias are compared across various satellite radar altimetry missions in [28].
ESA’s CryoSat-2 is distinctive due to its long repeat (369 days) and corresponding drifting ground track pattern and due to the SIRAL instrument (see details in Section 3). For short-repeat missions, one can derive water level time series at the locations where the satellite’s ground track regularly intersects with the water body—the so-called virtual station. This eases many aspects of processing altimetry data and integrating it into hydrologic models (more details in Section 6.3). CryoSat-2 with its drifting ground track pattern and a repeat cycle of 369 days has an entirely different sampling pattern. For this reason, use of CryoSat-2 for inland water research, especially river modeling, has been limited so far. However, the long-repeat orbit has the advantage of short inter-track distances (larger spatial coverage, see Table 1); moreover, CryoSat-2 has other important advantages, for example, a finer along-track resolution (for SAR and SARIn modes) compared to traditional pulse-limited radar altimeters [29]. The drifting ground track pattern with a small inter-track spacing of 7.5 km at the equator enables (i) monitoring of a much larger number of lakes and (ii) derivation of high resolution water level profiles along rivers. Moreover, these dense ground tracks increase the temporal resolution for large lakes. These characteristics create new opportunities for hydrologic research: Nielsen et al. [18] showed that small lakes (~9 km2) can be observed by CryoSat-2. Schneider et al. [30] calibrated a hydrodynamic river model with CryoSat-2 observations. Published study results show that performance of CryoSat-2 achieves root mean square error (RMSE) of a few centimeters for lakes [18,31] and between about 30 cm down to less than 5 cm using special data handling strategies for the Amazon River [32].
In this paper, we review the application of CryoSat-2 altimetry data over inland waters since its operation started in April 2010 up to today. Specifically, we first present the basic principle of satellite radar altimetry, and provide a CryoSat-2 mission overview. Then, we present data processing and data products, and review the use of CryoSat-2 altimetry data over lakes and rivers, and finally we discuss prospects of potential use of CryoSat-2 in hydrological applications.

2. Basic Principles of Radar Altimetry

In satellite radar altimetry, a microwave pulse is sent out by the altimeter, reflected by the surface, and finally part of its echo is recorded at the altimeter. The time series of returned power measured by the altimeter is commonly referred to as waveform [33] (inset in Figure 2). The principle of satellite radar altimeters obtaining surface height is to measure the two-way travel time of the microwave pulse travelling between the altimeter and the surface. This time interval can be then converted into a distance, also called range (Figure 2), by multiplying with the speed of light at which electromagnetic waves travel. With the position of the satellite, i.e., the altitude of satellite, surface height can be obtained by subtracting the range from the altitude of satellite. A Doppler Orbit and Radio Positioning Integration by Satellite (DORIS) receiver is deployed on-board for real-time measurements of satellite position, velocity and time. The measurement accuracy of the satellite position is 2–6 cm [34].
The range window, i.e., the elevation window where the satellite altimeter is sensitive to observations, has to be adapted dynamically to the topography. This can either be done in closed loop or open loop. In open loop, the range window is positioned based on a DEM. Closed loop means that the altimetry instrument itself constantly adapts the range window based on measurements [36], which is the mode implemented on CryoSat-2.
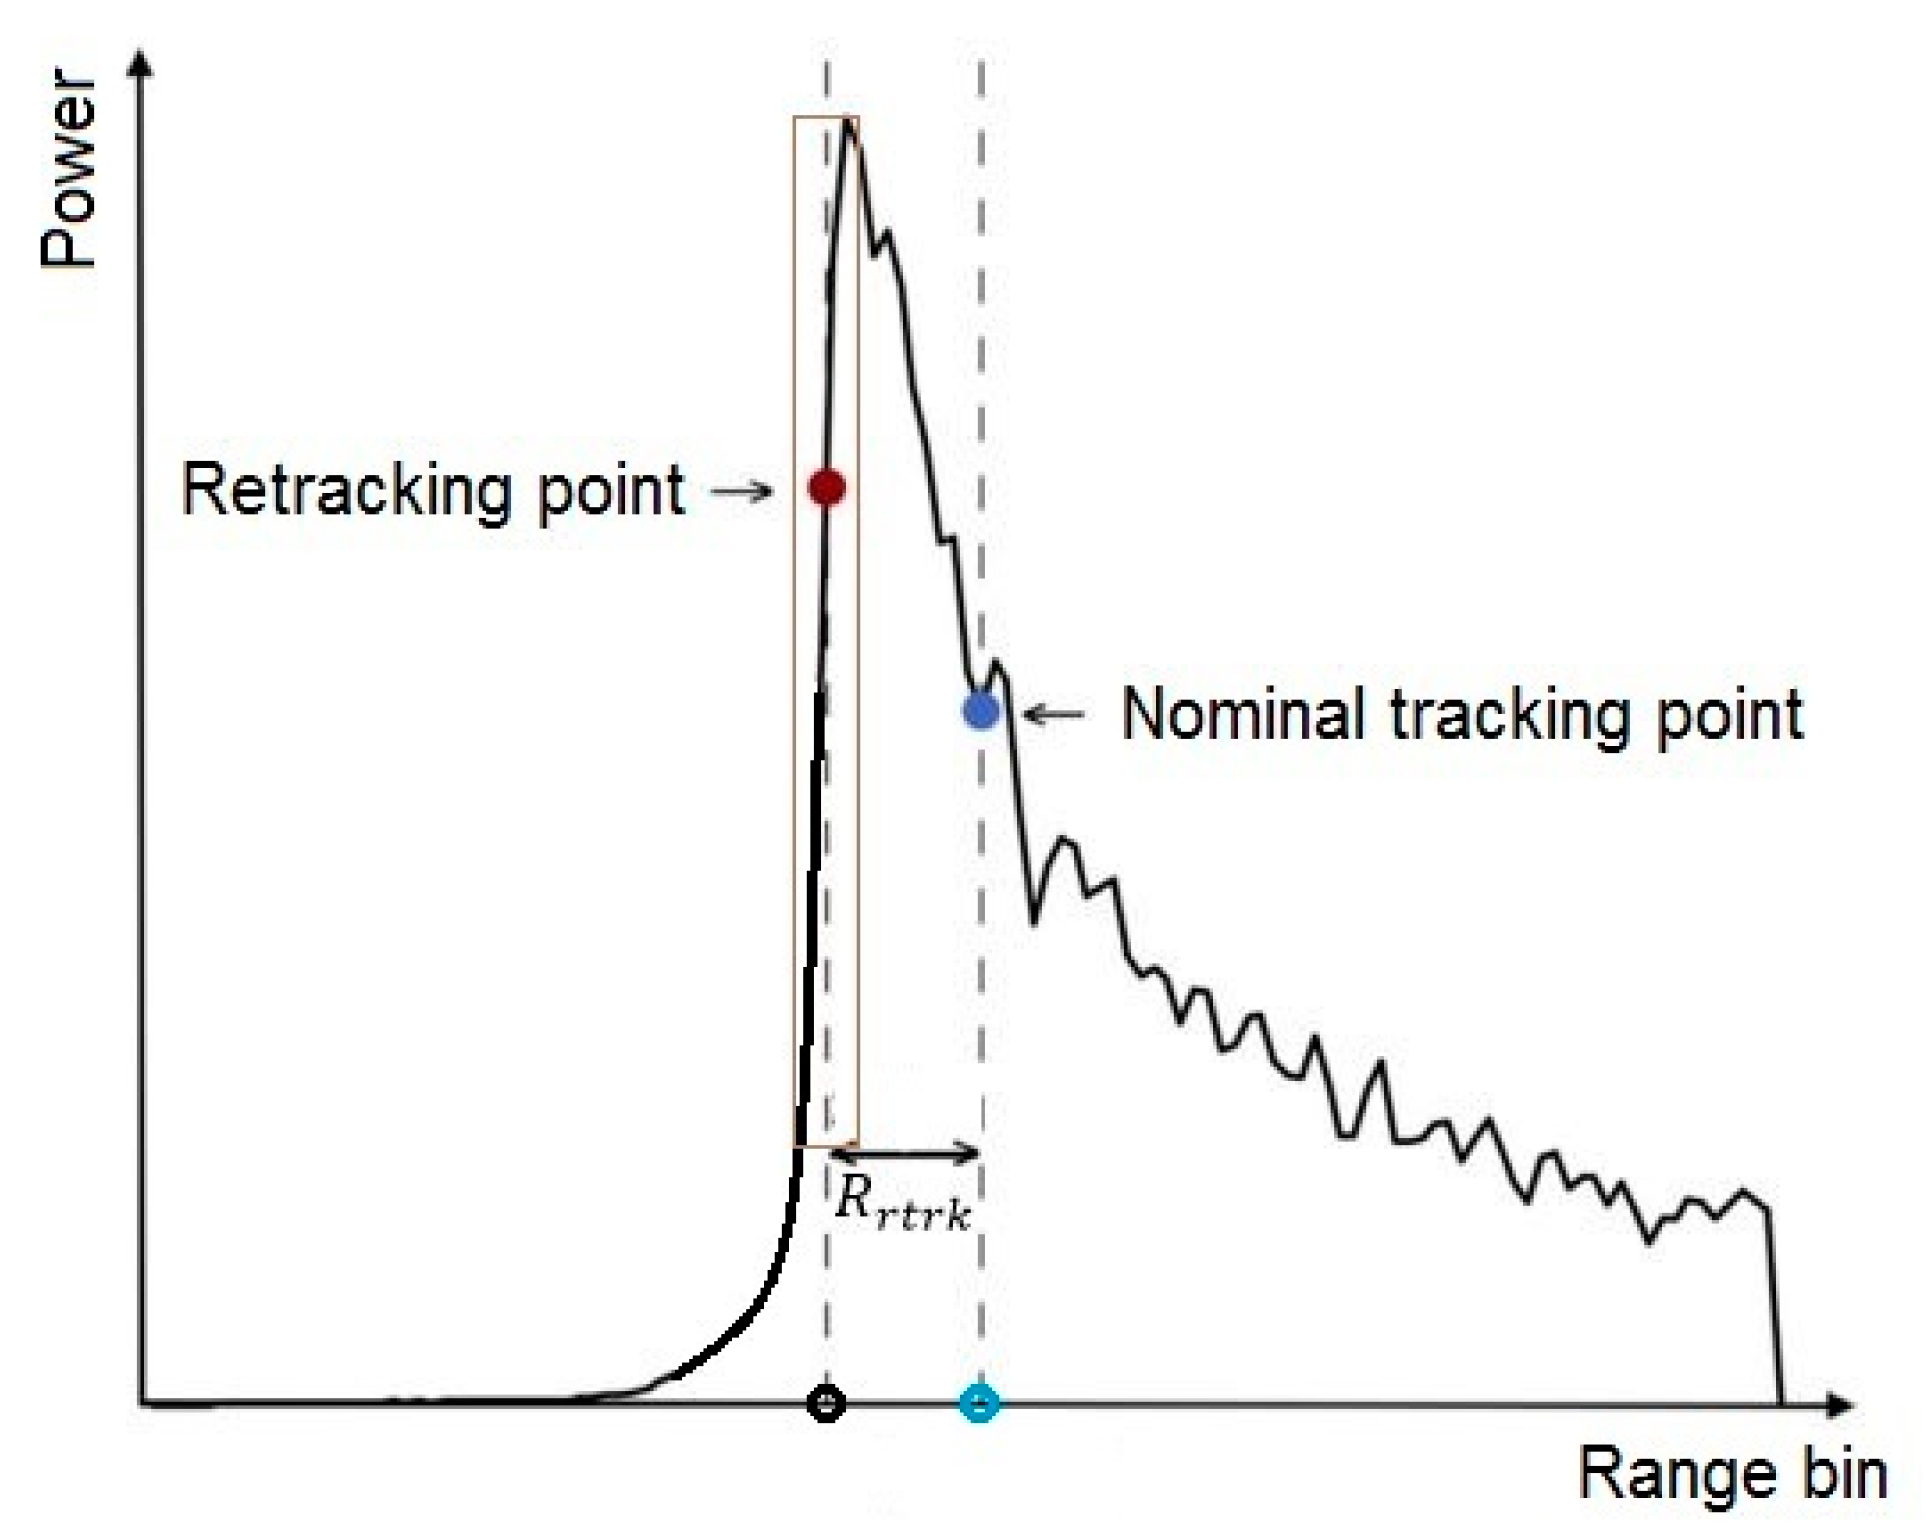
In general, waveforms returned from small inland open water bodies have a single strong peak due to the quasi-specular scattering of the smooth water surface. Those returned from large rough water bodies usually have only one peak with a steep leading edge and a slowly decaying trailing edge (Figure 3). If the exact location of the leading edge in the return waveform can be determined, the signal travel time can be estimated, therefore the range (and ultimately the surface elevation) can be calculated [37]. This is performed by the on-board tracker.
However, due to the diversity of reflecting surfaces, waveforms change dramatically in shape and power. Waveforms returned from inhomogeneous terrain (e.g., water and land transition area) usually have a complicated shape with multiple peaks [32,38]. Therefore, the leading edge of the returned waveform deviates from the altimeter tracking position (nominal tracking point), causing an error in the measured range which is accounted for by retracking [39] (Figure 3).
The altimeter waveform is provided in a set of power signals with respect to time at a specified number of sample bins [37] (Figure 3). Waveform retracking is the process of finding the mid-bin of the leading edge (retracking point) in the return waveform to calculate the difference between the nominal tracking position and the retracking position (Figure 3), thus correcting the on-board tracker range [37,38].
R c o r r = R + R r t r k Δ R g e o
where R is the range computed by the on-board tracker; Rrtrk is the retracker correction and ΔRgeo is the sum of corrections including ionosphere, wet and dry troposphere, solid earth tide, ocean loading tide, and pole tide. All corrections are available in the L1b data product. Thus, the corrected range Rcorr between the satellite and water surface can be derived.
For hydrological purpose, one can conveniently refer the surface to the geoid. Finally, the surface elevation H is obtained by subtracting the corrected range R and geoid undulation N from the satellite altitude h:
H = h R c o r r N

3. Mission Overview

ESA’s CryoSat-2 satellite was launched on 8 April 2010. The primary objectives of this mission are monitoring the Arctic sea ice thickness variation and the influence of the Antarctic and Greenland ice sheets on global sea-level [34,40]. However, like previous satellite altimetry missions, it also proved to be useful for monitoring of inland water levels [13,19,41].

3.1. Instrument

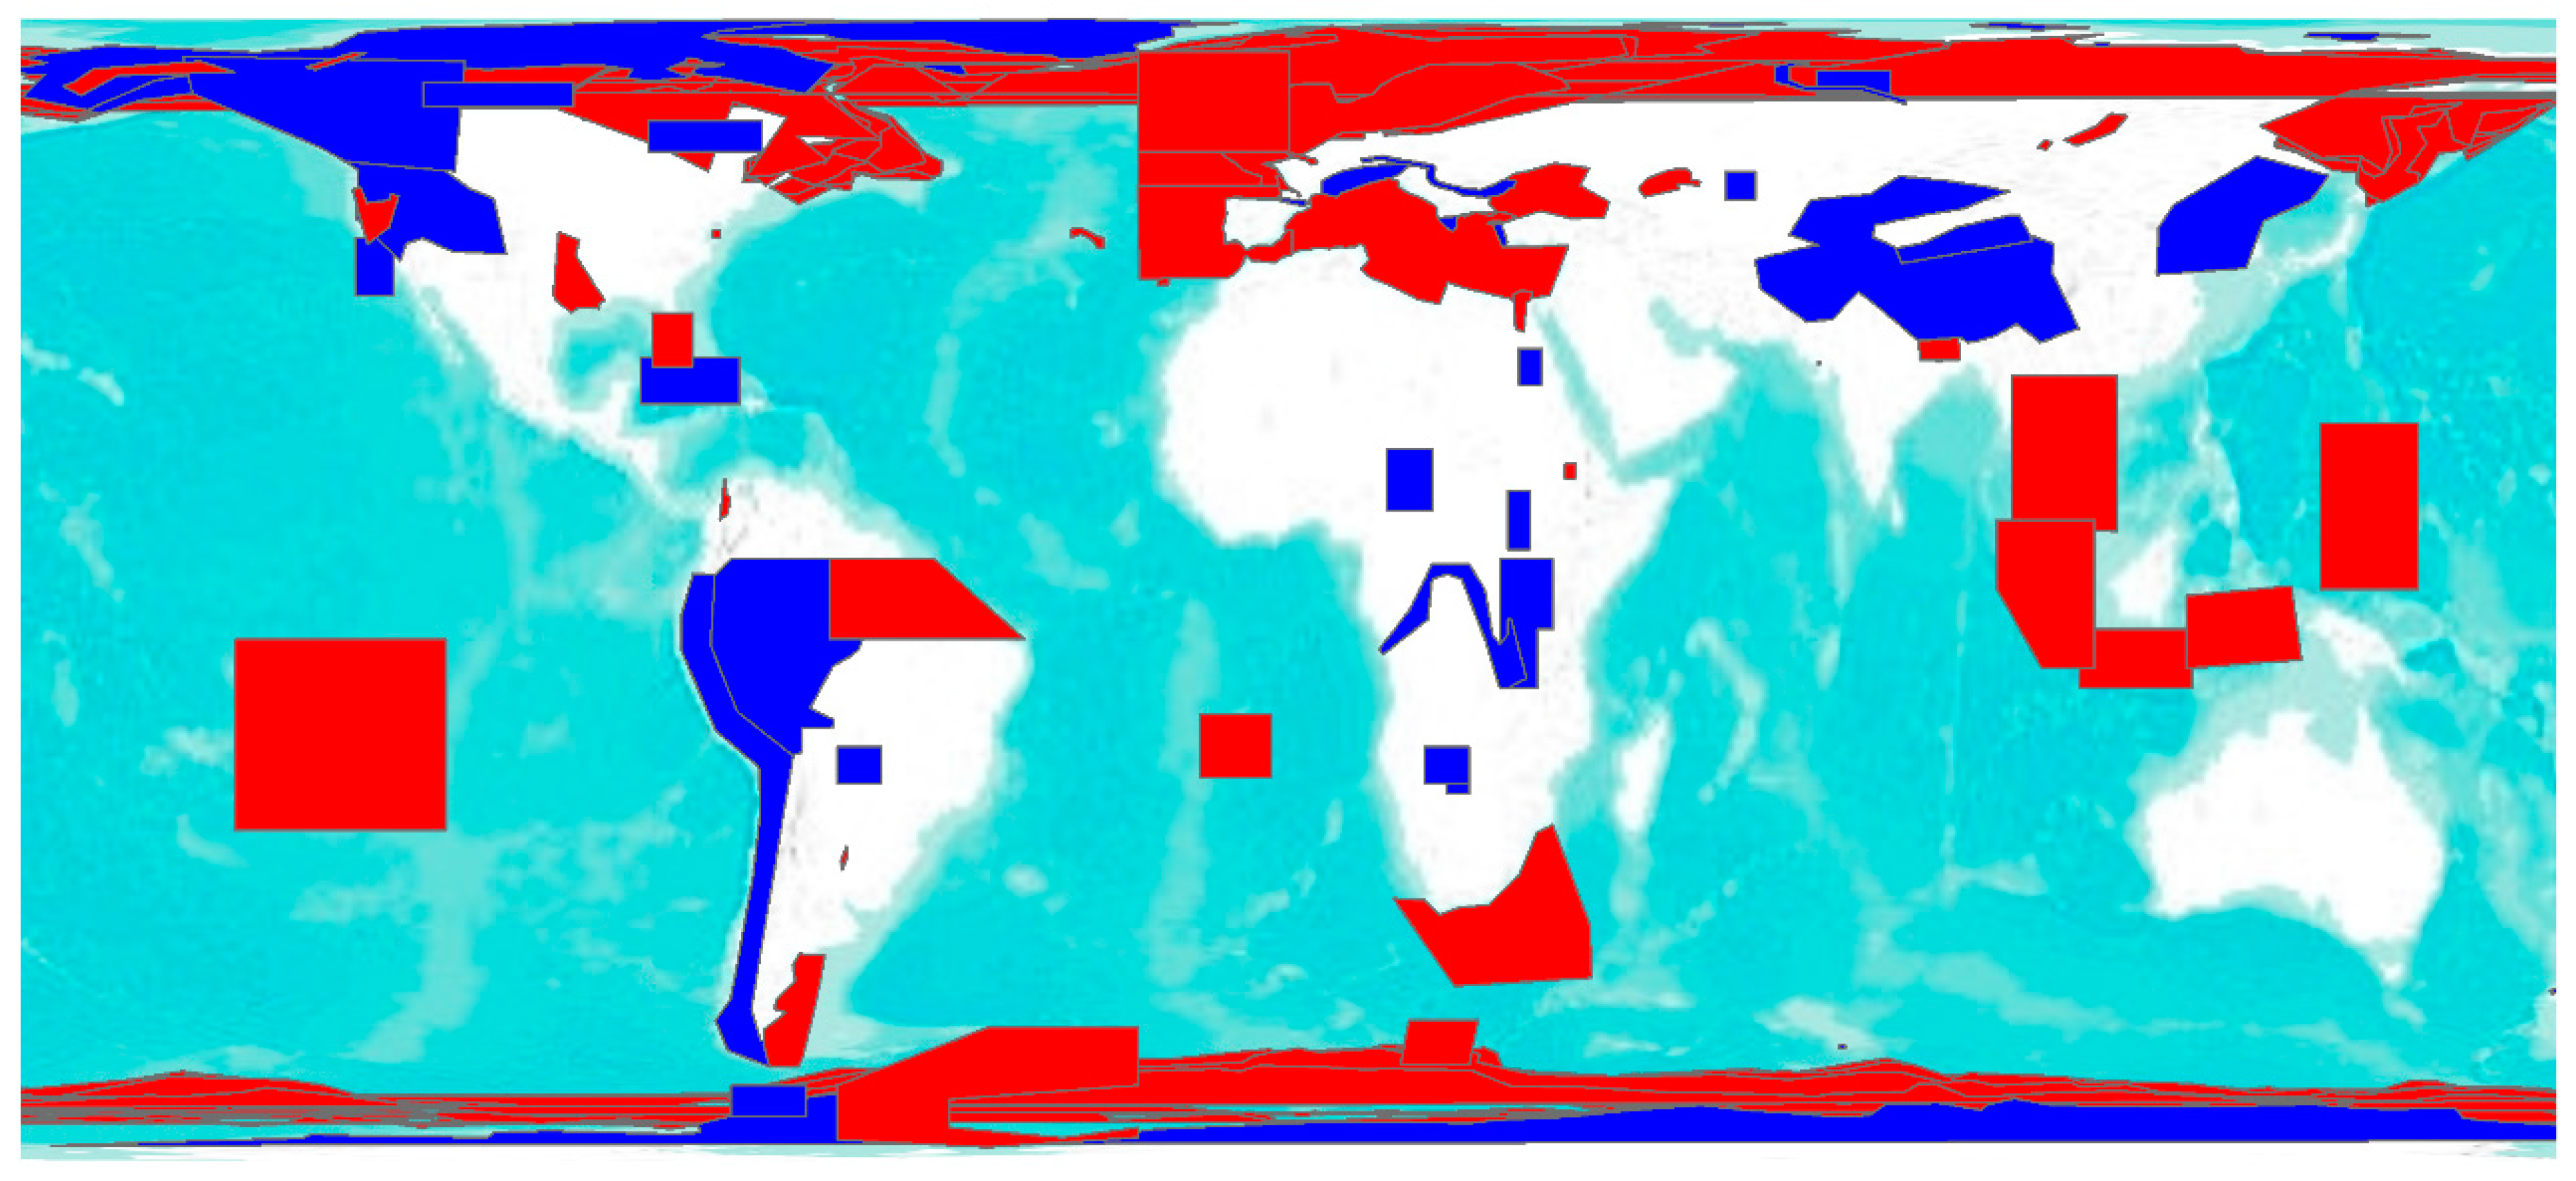
The radar altimetry instrument on CryoSat-2 is called SIRAL (Synthetic Aperture Interferometric Radar Altimeter). It is a single Ku-band radar altimeter using the full deramp range compression. It is operating in three distinct modes: Low Resolution Mode (LRM), Synthetic Aperture mode (SAR), and Synthetic Aperture Interferometric mode (SARIn) (Figure 4). Over the central regions of the ice sheets and most of the continental area, the instrument will provide the measurements as a conventional radar altimeter in LRM. SAR mode enhances the along-track spatial resolution to, for example, measure ice flows and narrow leads of open water which cannot be achieved by LRM. It is also used over some coastal regions. SARIn mode is used over the topographic surfaces of the ice-sheet margins, over mountain glaciers, and over other regions of interest, for example, large river systems such as the Danube or Congo River. In this mode, the altimeter performs synthetic aperture processing with two antennas and thus precisely determines the position of the ground surface in the return pulse. The operation mode is selected from a geographical mask [42] (see Figure 4), which is updated every two weeks to allow for changes in sea ice extent. Especially the two-antenna SARIn mode makes CryoSat-2 unique among current satellite altimetry missions. For more details, please refer to [34,43].

3.2. Orbit

Satellite radar altimeters sample elevation globally along the orbit ground track. Orbits are constrained by the equations of motion. The primary factors that affect the orbit geometry are the altitude, inclination and eccentricity [44]. CryoSat-2’s orbit is non-sun-synchronous with a mean altitude of 717 km and a high inclination of 92°. The repeat period is 369 days or 5344 orbits. However, the orbit also has a 30-day subcycle, which encompasses the full 369-day repeat by successive shifts. In other words, the orbit shifts about 7.5 km at the equator every 30 days and returns to the same place every 369 days. More information is detailed in [43].

3.3. Ground Track

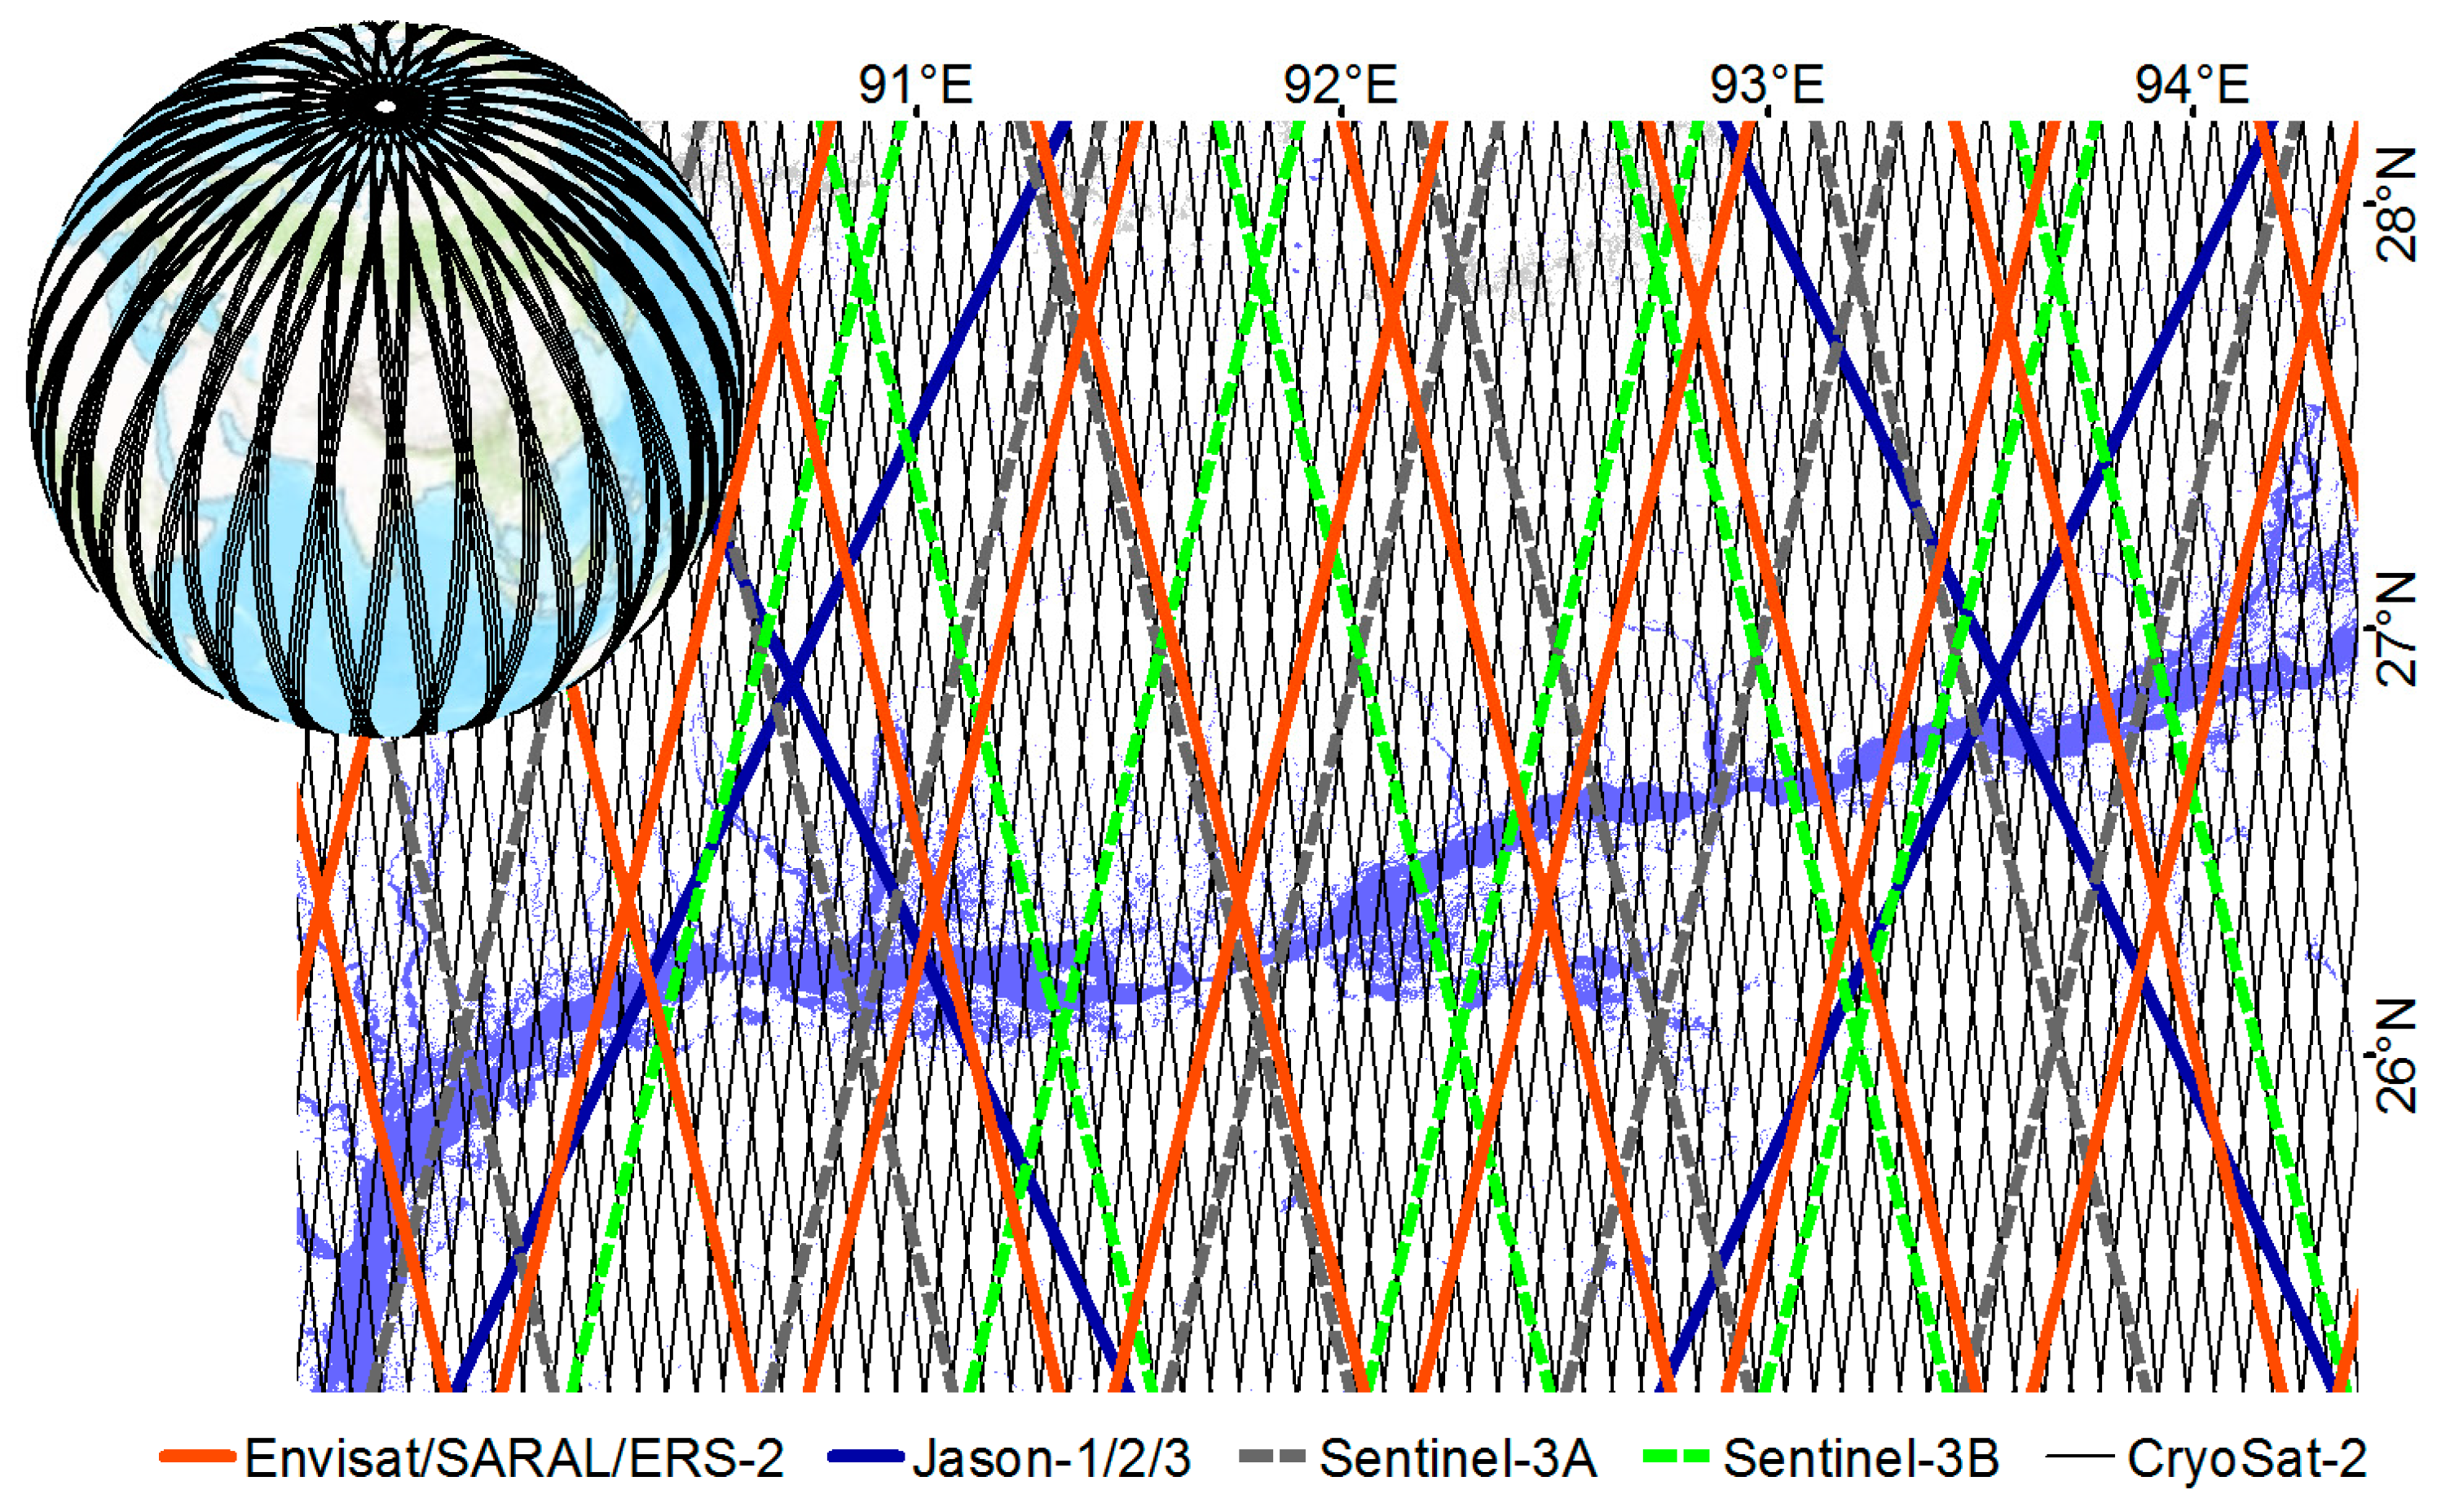
As already mentioned, CryoSat-2’s orbit is long-repeat (geodetic orbit) and leads to a particular drifting ground track pattern (Figure 5). Up to today, with the exception of CryoSat-2, all satellite altimeters used to measure river water levels were on short-repeat orbits. The resulting ground tracks for the main missions are displayed in Figure 5 for the Brahmaputra River in the Assam Valley, India as an example. At locations where the conventional missions with short-repeat cycles intersect with the river (or a lake), time series of water level measurements are established. This also means that processing efforts, such as water masking, can be limited to these specific locations, which are spaced with the inter-track distance indicated in Table 1. Besides that, observations from short-repeat orbits result in water level time series with relatively high temporal resolution. The availability of dense time series eases outlier filtering and integration into hydrologic models. CryoSat-2 however, as can be seen from Figure 5 and Table 1, has a much smaller inter-track distance. This requires, amongst others, continuous water masks for processing. The challenges of dealing with the drifting ground track are described in Section 5.1 for lakes and Section 6.1 for rivers.

3.4. Footprint

The ground footprint size is an important characteristic that determines what the altimeter can measure [36]. The footprint is the area on the Earth’s surface illuminated by the radar beam. For the pulse-limited altimeter (used by all previous radar altimetry missions), a very short duration of the pulse means that a small area is illuminated simultaneously. This is also referred to as the Pulse-limited Footprint (PLF) [45].
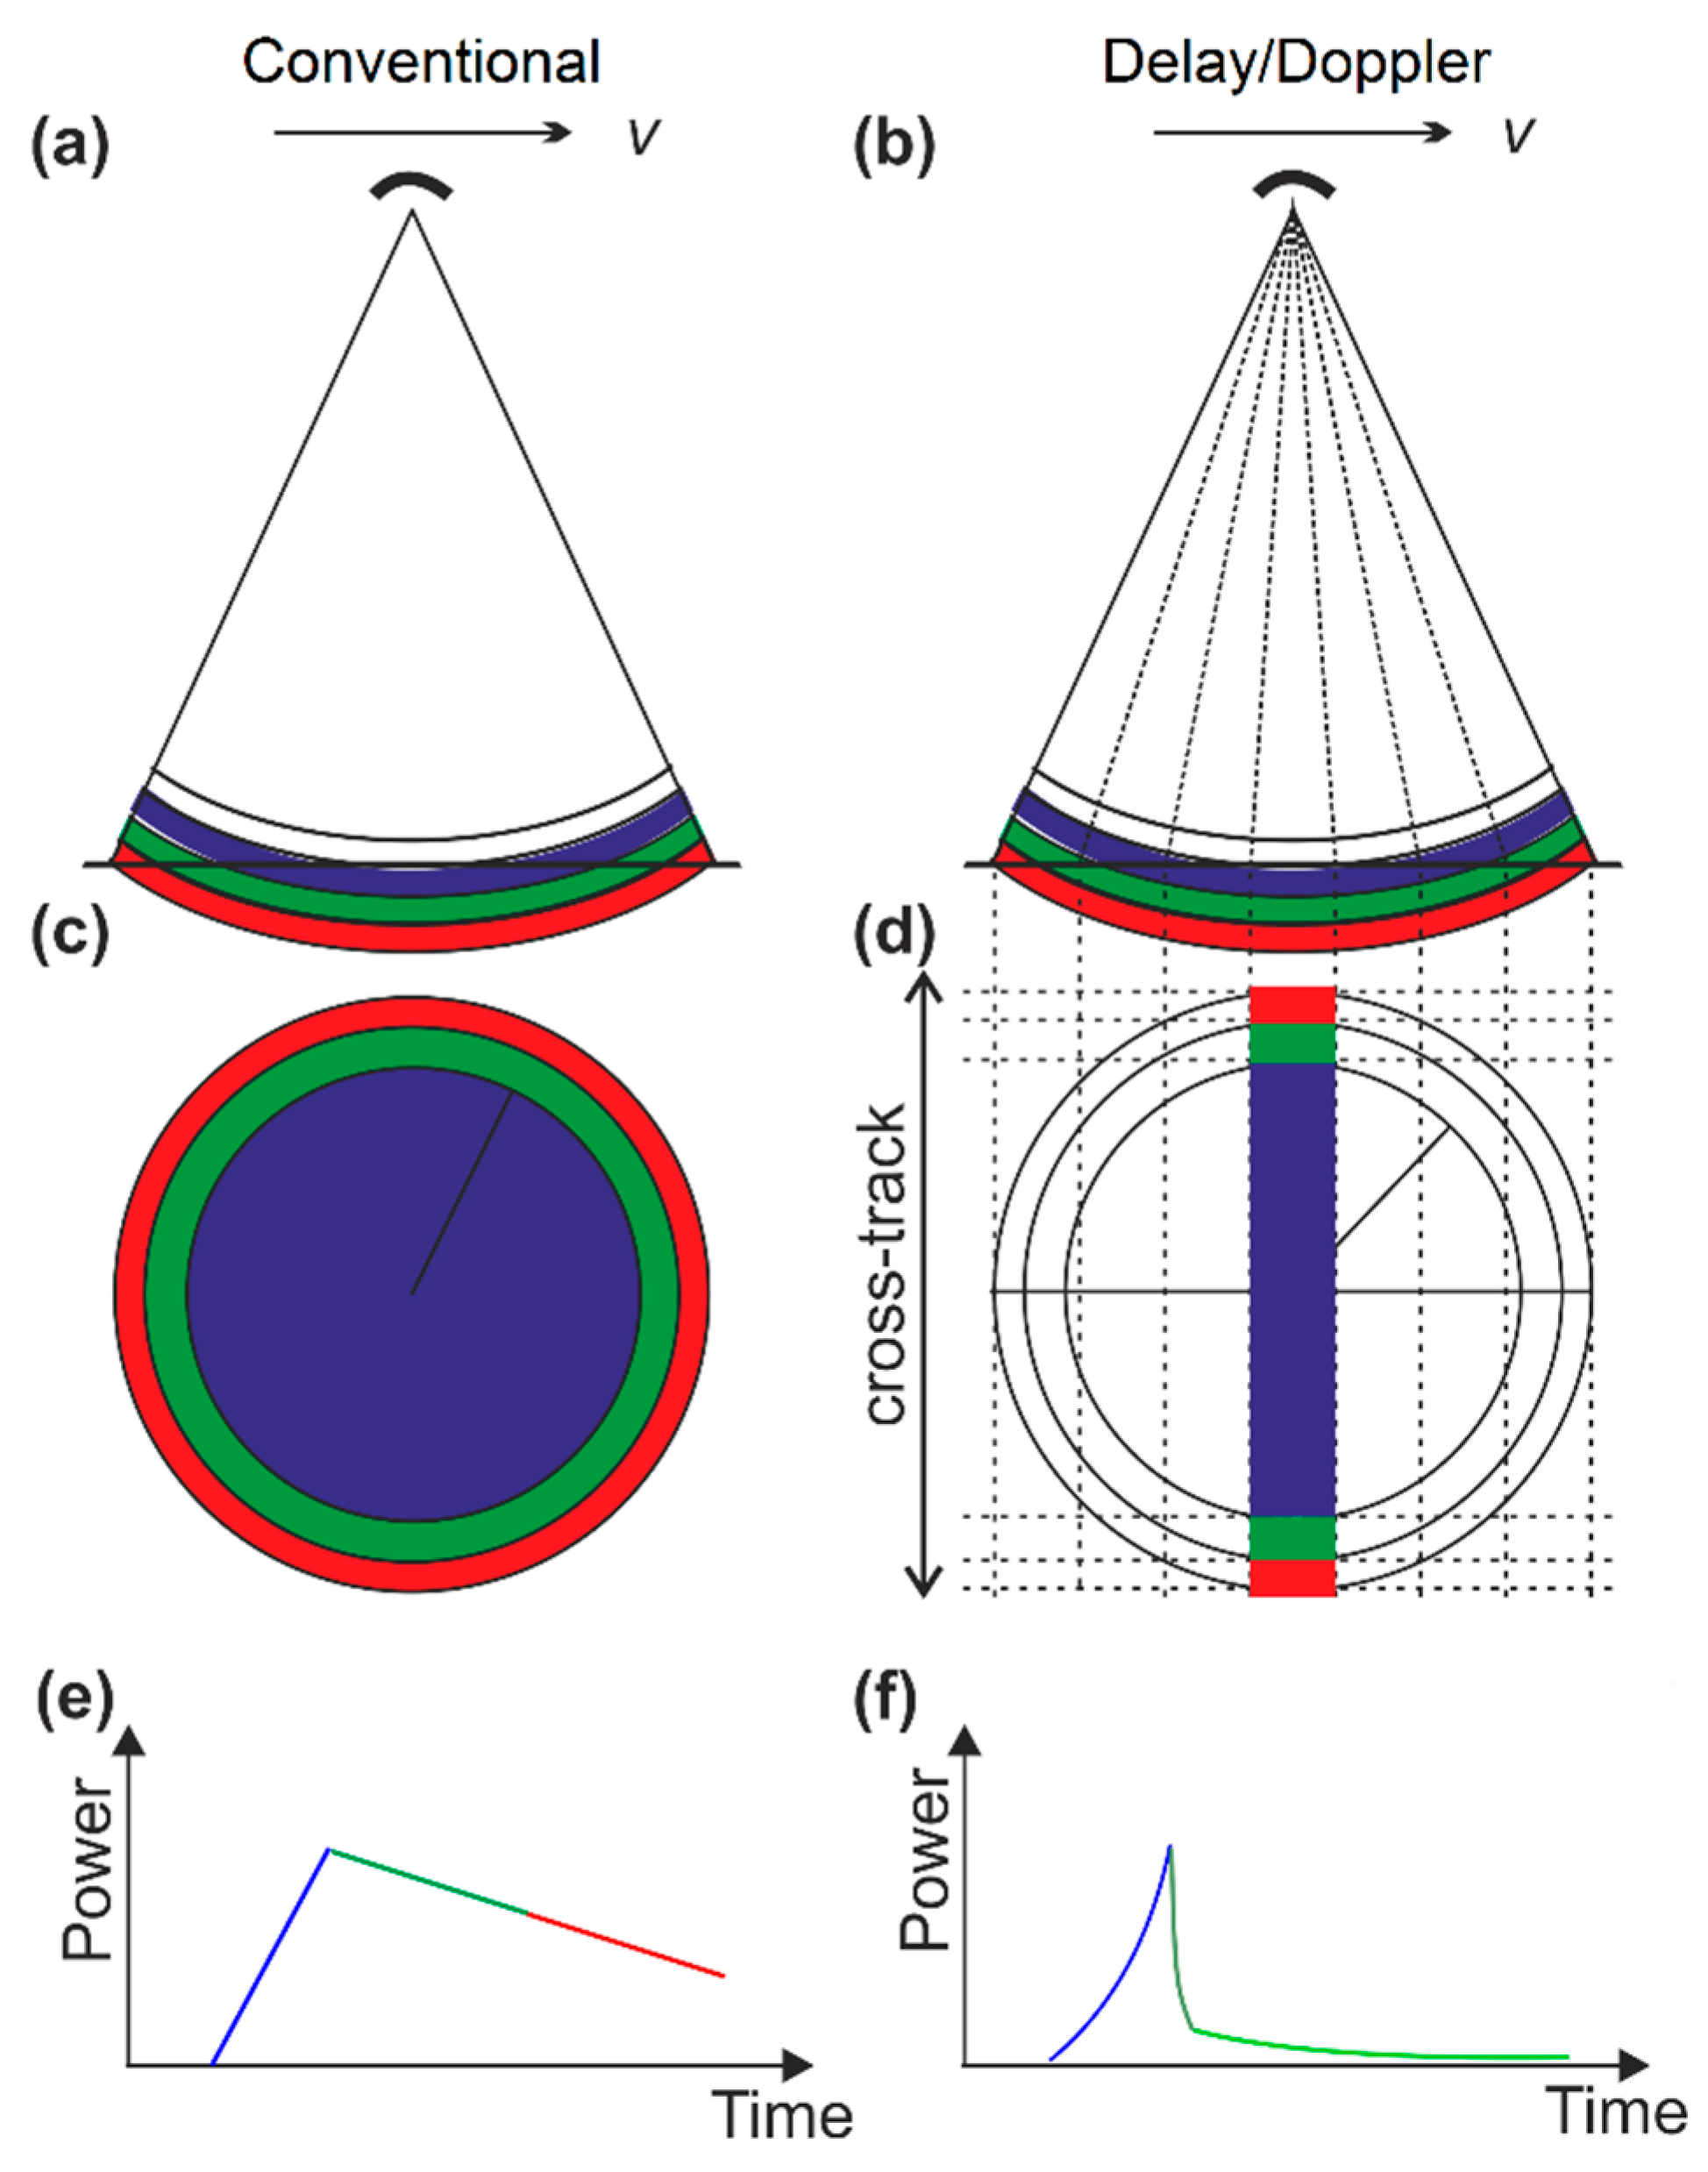
LRM on CryoSat-2 is the conventional pulse-limited radar altimeter mode (Figure 6). One pulse is transmitted with a very short duration (3.125 ns), so the pulse does not illuminate the whole beam width at the same time. Specifically, the illuminated area continues to grow linearly until the rear of the pulse intersects the surface at nadir [33]. Thereafter, the footprint becomes annulus with constant area for smooth surfaces. The radius r can be calculated:
r = c τ ( c τ + h )
where c is the speed of light, h is the altitude of the satellite and τ is the pulse length. For LRM, r is about 830 m and thus the PLF area is about 2.15 km2. It should be noted that the true illuminated area may be discontinuous or irregular in shape due to the roughness and slope of surface [46].
In SAR/SARIn modes, the delay/Doppler beam allows the relative along-track position to be estimated relative to the position of the altimeter (Figure 6). Therefore, the illuminated area has two independent variables, i.e., along-track position and cross-track position (time delay) [47]. In the cross-track direction, the illuminated area width is the same as that in LRM. In the along-track direction, it can be seen as sharpened beam-limited. The illuminated area can be approximated by the rectangle defined by the cross-track radius and along-track width Δx (Figure 6d).
f D = 2 v r c f c
v r = v s i n θ
f c = c λ
Δ x = h s i n θ
Therefore, Δx can be expressed as:
Δ x = λ h 2 v f D
where v is the velocity of the satellite; λ is the wavelength; fD is approximately equal to the inverse of the time during which the surface is covered by the beam, i.e., PRF/64 [34].
The pulse-limited width in the cross-track direction is about 1.65 km and the sharpened beam-limited width in the along-track direction is about 300 m, thus the footprint for SAR/SARIn is about 0.5 km2.
The SAR/SARIn modes compensate for the extra delay and thus the return waveform is much sharper than that derived from LRM [47] (Figure 6e,f). In addition, in SARIn mode, two antennas allow to precisely determine the ground position of the returned echo, because the returned echo is not necessarily from nadir point.

4. Data Products

ESA provides different datasets (ftp://science-pds.cryosat.esa.int). Here, we give an introduction to Level-1b and Level-2 datasets which are used in inland water research.

4.1. Level-1b Data

Level-1b data contain the reflected waveforms and average waveforms (for LRM and SAR) along with the measurement time and geographical location. Calibration corrections are included and have been applied to the window delay computations. Signal propagation delays and other geophysical corrections are included in the data products but have not been applied to the range, therefore, the range needs to be corrected by taking these corrections into account. Data record structure is described in [34].

4.2. Level-2 GDR Data

Level-2 GDR (Geophysical Data Record) data, i.e., ground elevation, corrected for range and geo-physical effects (see Equation (2)), are produced by ESA systematically. They are the result of retracking and correcting the above discussed Level-1b data. Furthermore, other research groups produce their own Level-2 data, usually based on ESA’s Level-1b data [31,32,48].

4.3. Level-3 (Along-Track) Products

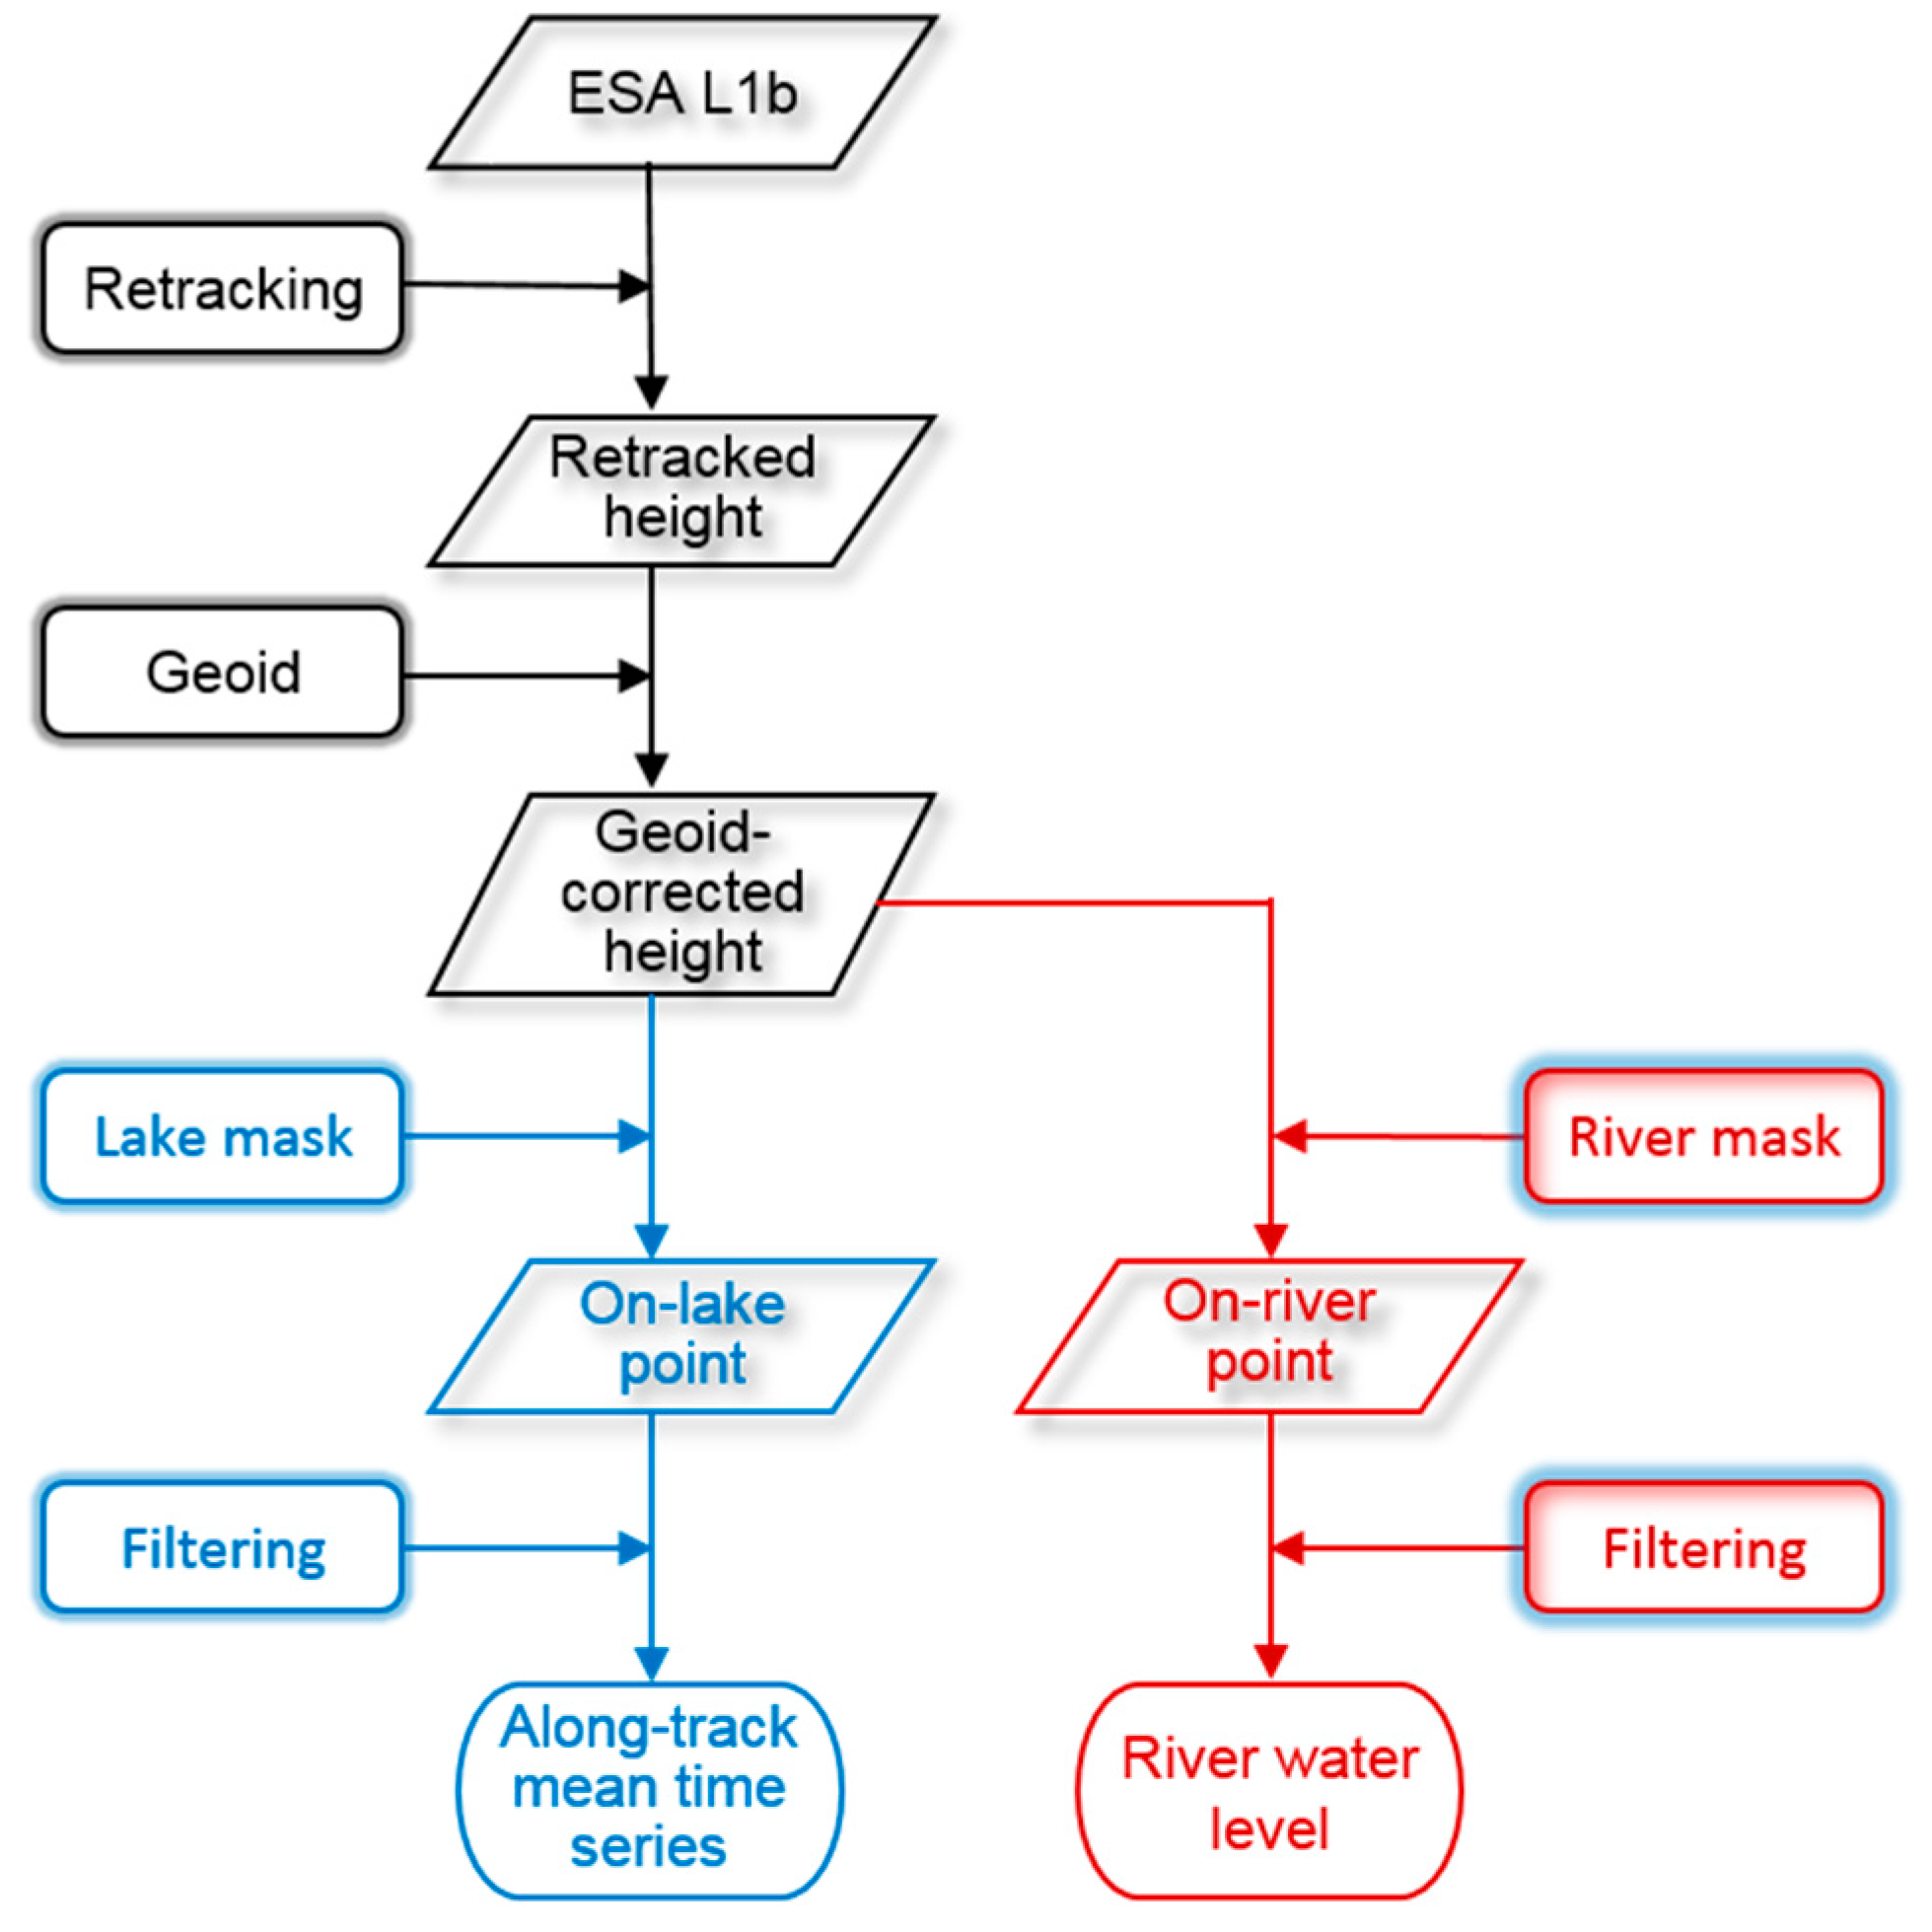
Besides the ESA L2 product, very few sources provide water level data. AltWater (http://altwater.dtu.space/) from DTU space (National Space Institute, Technical University of Denmark) is the only one providing L3 water levels (along-track product) derived from CryoSat-2. While this product just covers a limited amount of lakes and reservoirs, those who aim at rivers or other inland water bodies need to process time series from scratch. Figure 7 gives a brief overview of the procedure to produce time series for lakes and water level for rivers. More details for time series construction are given in Section 5 and Section 6.

5. Use of CryoSat-2 over Lakes

CryoSat-2, due to its special ground-track pattern, visits many lakes at global scale and provides water levels for smaller lakes than any of the previous missions. In the following sections, we will present lake level and storage variations analysis using CryoSat-2 data.

5.1. Time Series Construction

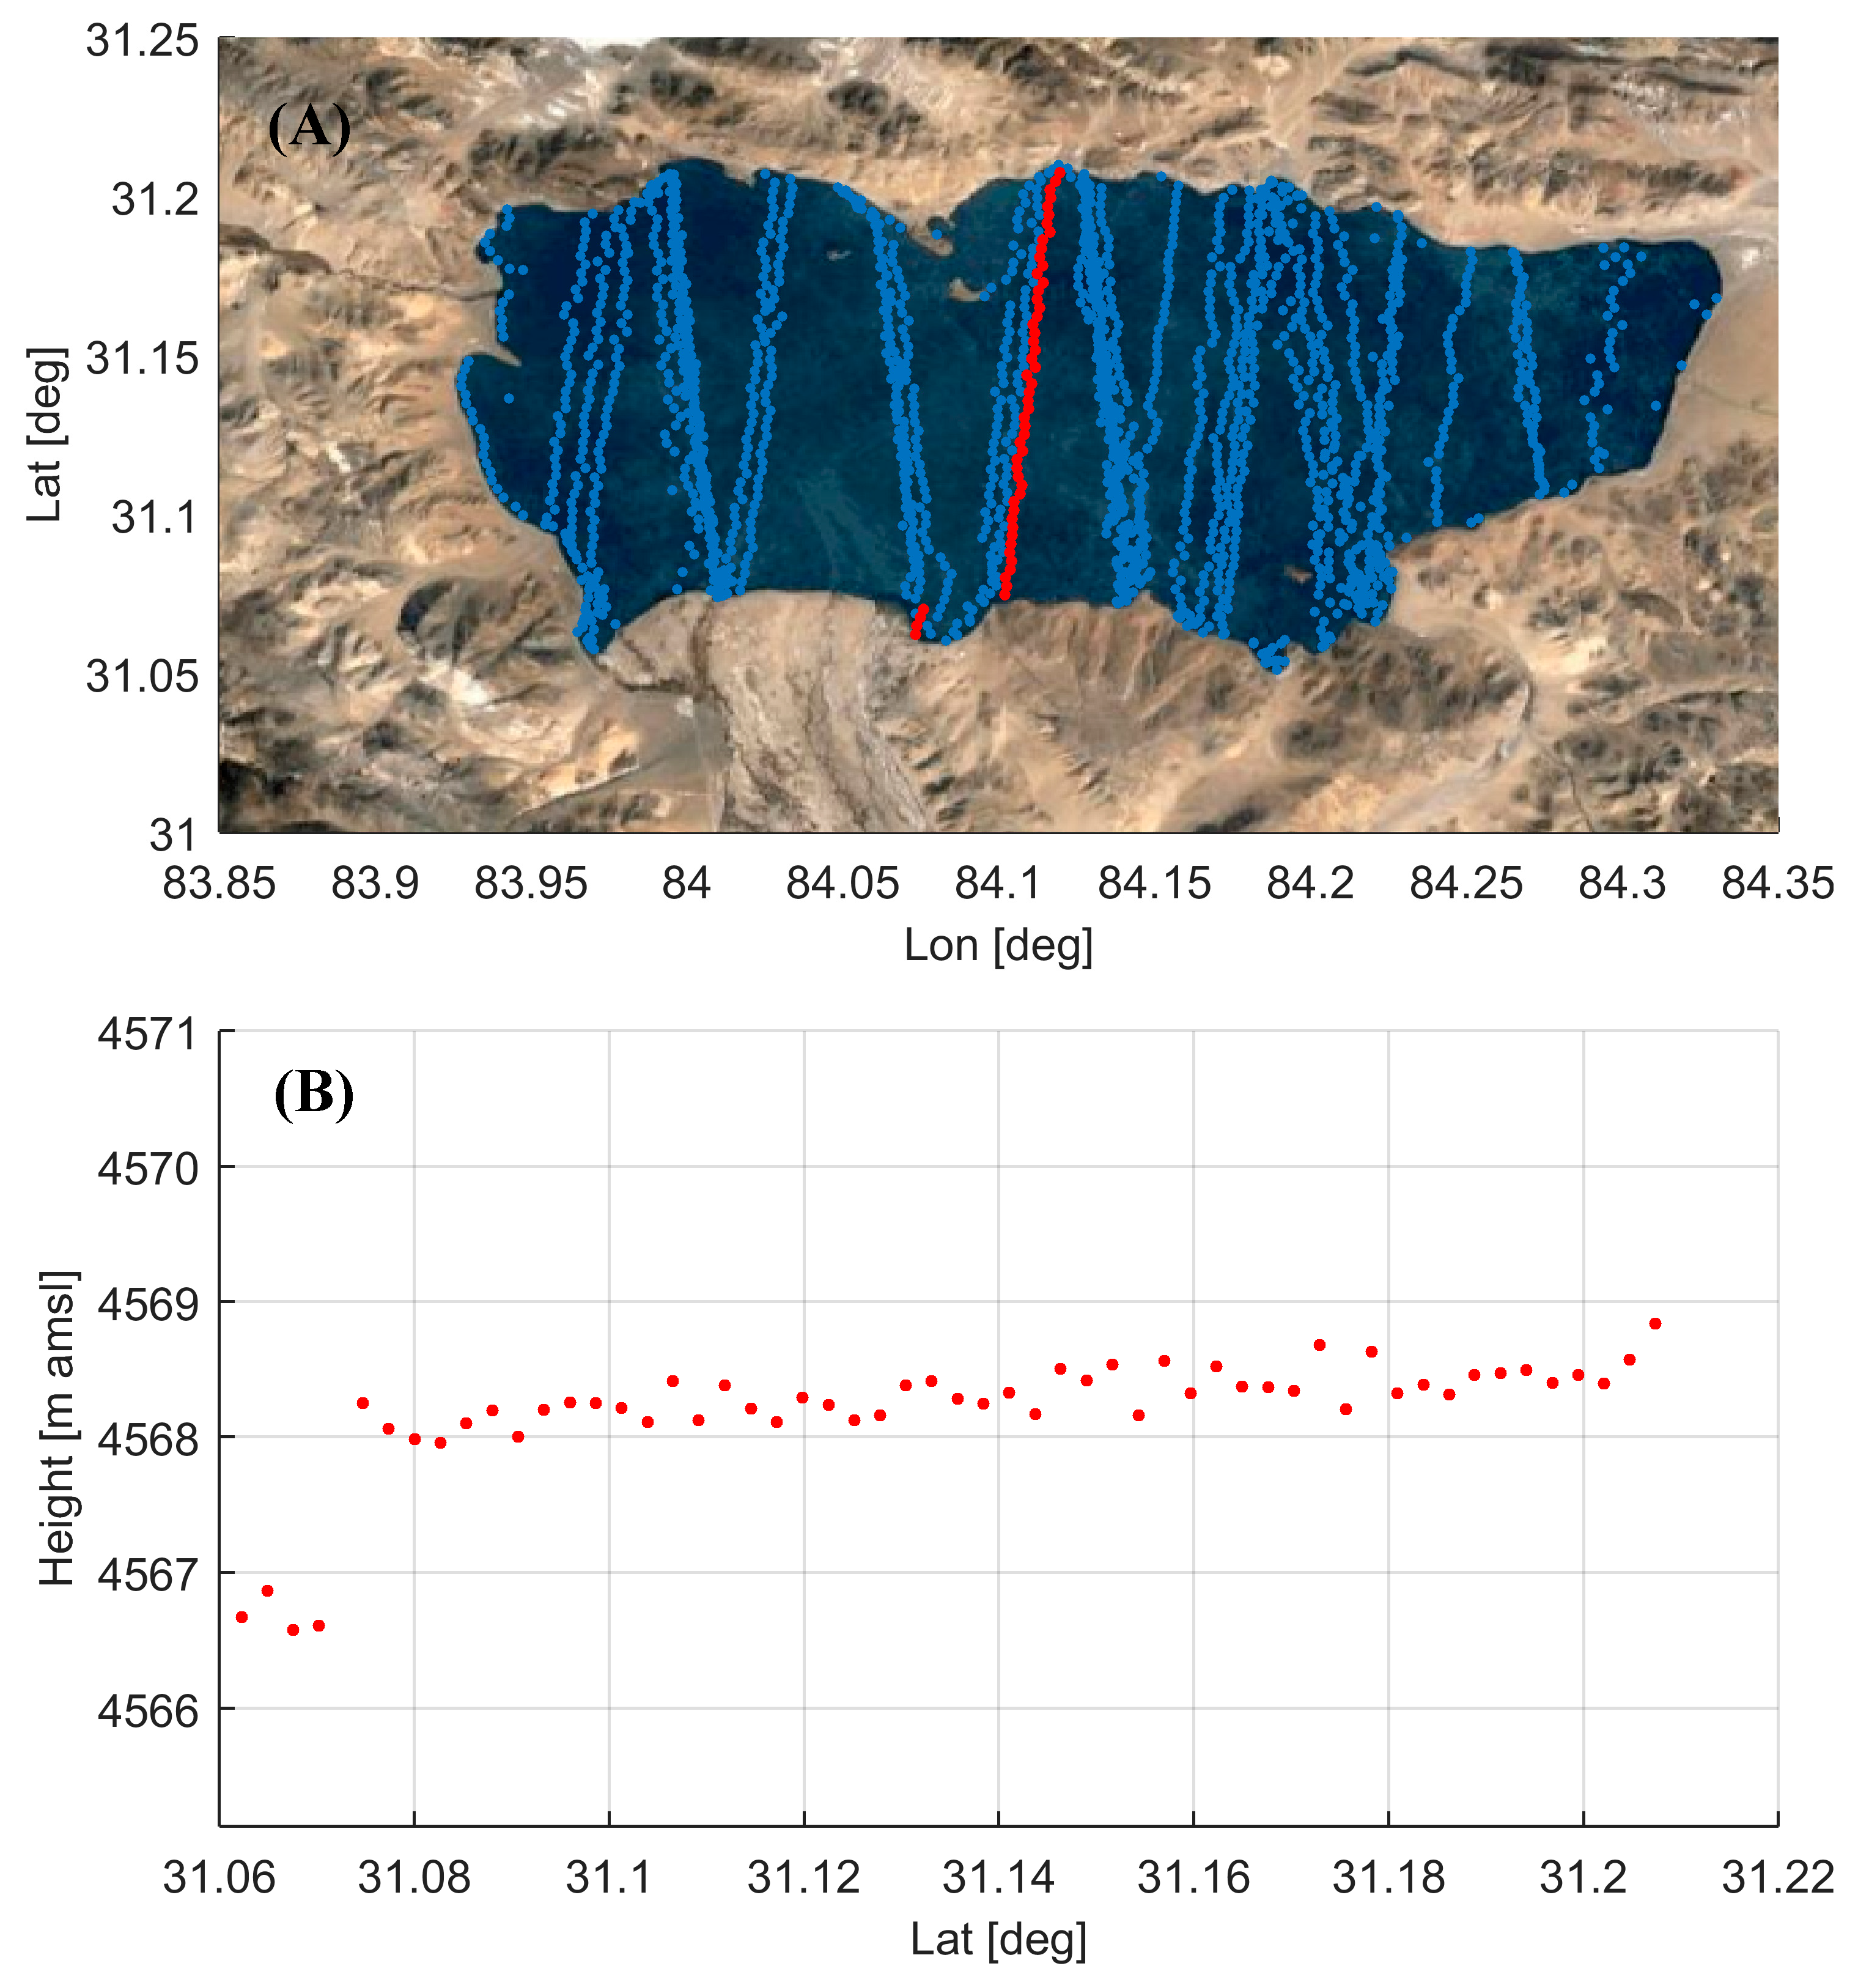
Unlike in situ hydrometric equipment which records the water level at a fixed location, altimetry provides multiple along-track measurements at different locations during a very short time slice (Figure 8). In order to investigate the variation of water level, the first step is to construct a water level time series. The most straightforward method is taking an average of all values along one track. However, outliers in the altimetry observations should be excluded. They occur, for example, near the shore because the waveforms are contaminated by land.
There exist several methods to generate along-track water levels. Kleinherenbrink et al. [48] suggested a tailored outlier removal procedure to derive the along-track mean lake level. More specifically, they utilized the mode and a threshold as the filter to identify outliers. The threshold of 1 m was chosen under the assumption that the measurements should not deviate more than 1 m from the mode. Schwatke et al. [49] employed several criteria to remove outliers, such as height error threshold, using the deviation around the median of measurements from a moving part of each track (7 km and 3 km) and support vector regression, which applies a linear regression with zero-slope constraint. However, these two approaches provide different results on outlier detection (Figure 2 in [49]). Similarly, Göttl et al. [31] excluded outliers using the moving 5-point standard deviation with a threshold of 10 cm. Nielsen et al. [18] proposed a robust method to obtain the mean water level, which assumes that the observation error follows a mixture distribution between a Gaussian and a Cauchy distribution. The advantage of this method is that the estimated mean water levels are not significantly biased by the outlying observations. The accuracy of all methods also depends on the water mask, that is, to make sure that spurious measurements are not dominant in each individual track.
The time series can be constructed by a straightforward connection of all along-track mean measurements if each individual along-track mean is accurate. Several methods are employed to estimate the water level time series, taking into account the error of measurements. In [50], besides simply connecting individual measurements, two weighted moving averaging methods were used to construct the time series. Specifically, three consecutive measurements are averaged using their error as weighting factor. Kalman filtering is used for the construction of water level time series in DAHITI [49]. The water surface was assumed to be controlled by deterministic and stochastic processes. By taking the accuracy of each track height into account, this algorithm produces an optimal estimate of water level time series. Similarly, Nielsen et al. [18] proposed a state-space model to describe the lake level variation with time under the assumption that lake level observations taken in a short time span are more strongly correlated. In this model, the true unobserved water level is described by a simple random walk. The model provides predictions of the evolution of the true lake water level. Lake levels produced with the described procedure by Nielsen et al. can be found in the aforementioned AltWater database.

5.2. Lake Level Trend Estimation

In order to investigate the characteristics of lake level changes, both inter-annual and intra-annual, generally linear or periodic non-linear regression models are used.
The Tibetan Plateau is a crucial test ground for inland water altimetry research due to the vast number of lakes, most of them unmonitored. Kleinherenbrink et al. [17] studied 30 lakes on the Tibetan Plateau and Tian Shan areas over a 2-year period. They used a simple harmonic model to determine the phases and amplitudes for both annual and semi-annual variations in addition to a long-term trend. This was successful except for some lakes, which probably exhibit water level changes with different cycles, and thus cannot be captured by this harmonic model. Jiang et al. [21] studied 70 lakes on the Tibetan Plateau over the past five years using a weighted linear regression model. Their results show that lakes are still rising at similar rate to that of 2003–2009, especially in the northern Tibetan Plateau.
Other studies focused on specific individual lakes. Song et al. [51] investigated the variation of Namco based on multiple data sources including Cryosat-2 using an iterative reweighted linear model. Similarly, Tourian et al. [52] studied the desiccation of Lake Urmia in Iran.
Lake levels, especially in endorheic lakes, like the majority of the lakes in Tibetan Plateau, are sensitive to regional climate change, which leads to changes in precipitation and evaporation. Moreover, lake level change is also controlled by regional hydrological conditions. Many studies have investigated the driving factors of significant lake level changes in order to understand and explain the mechanisms behind the change. However, lake rise on the Tibetan Plateau seems to be driven by many factors and their interactions [17,21,53,54,55,56], and a simple, process-based model remains elusive. In this context, CryoSat-2 can play an important role to further our understanding of lake response to climate change due to its dense spatial coverage.

5.3. Lake Storage Calculation

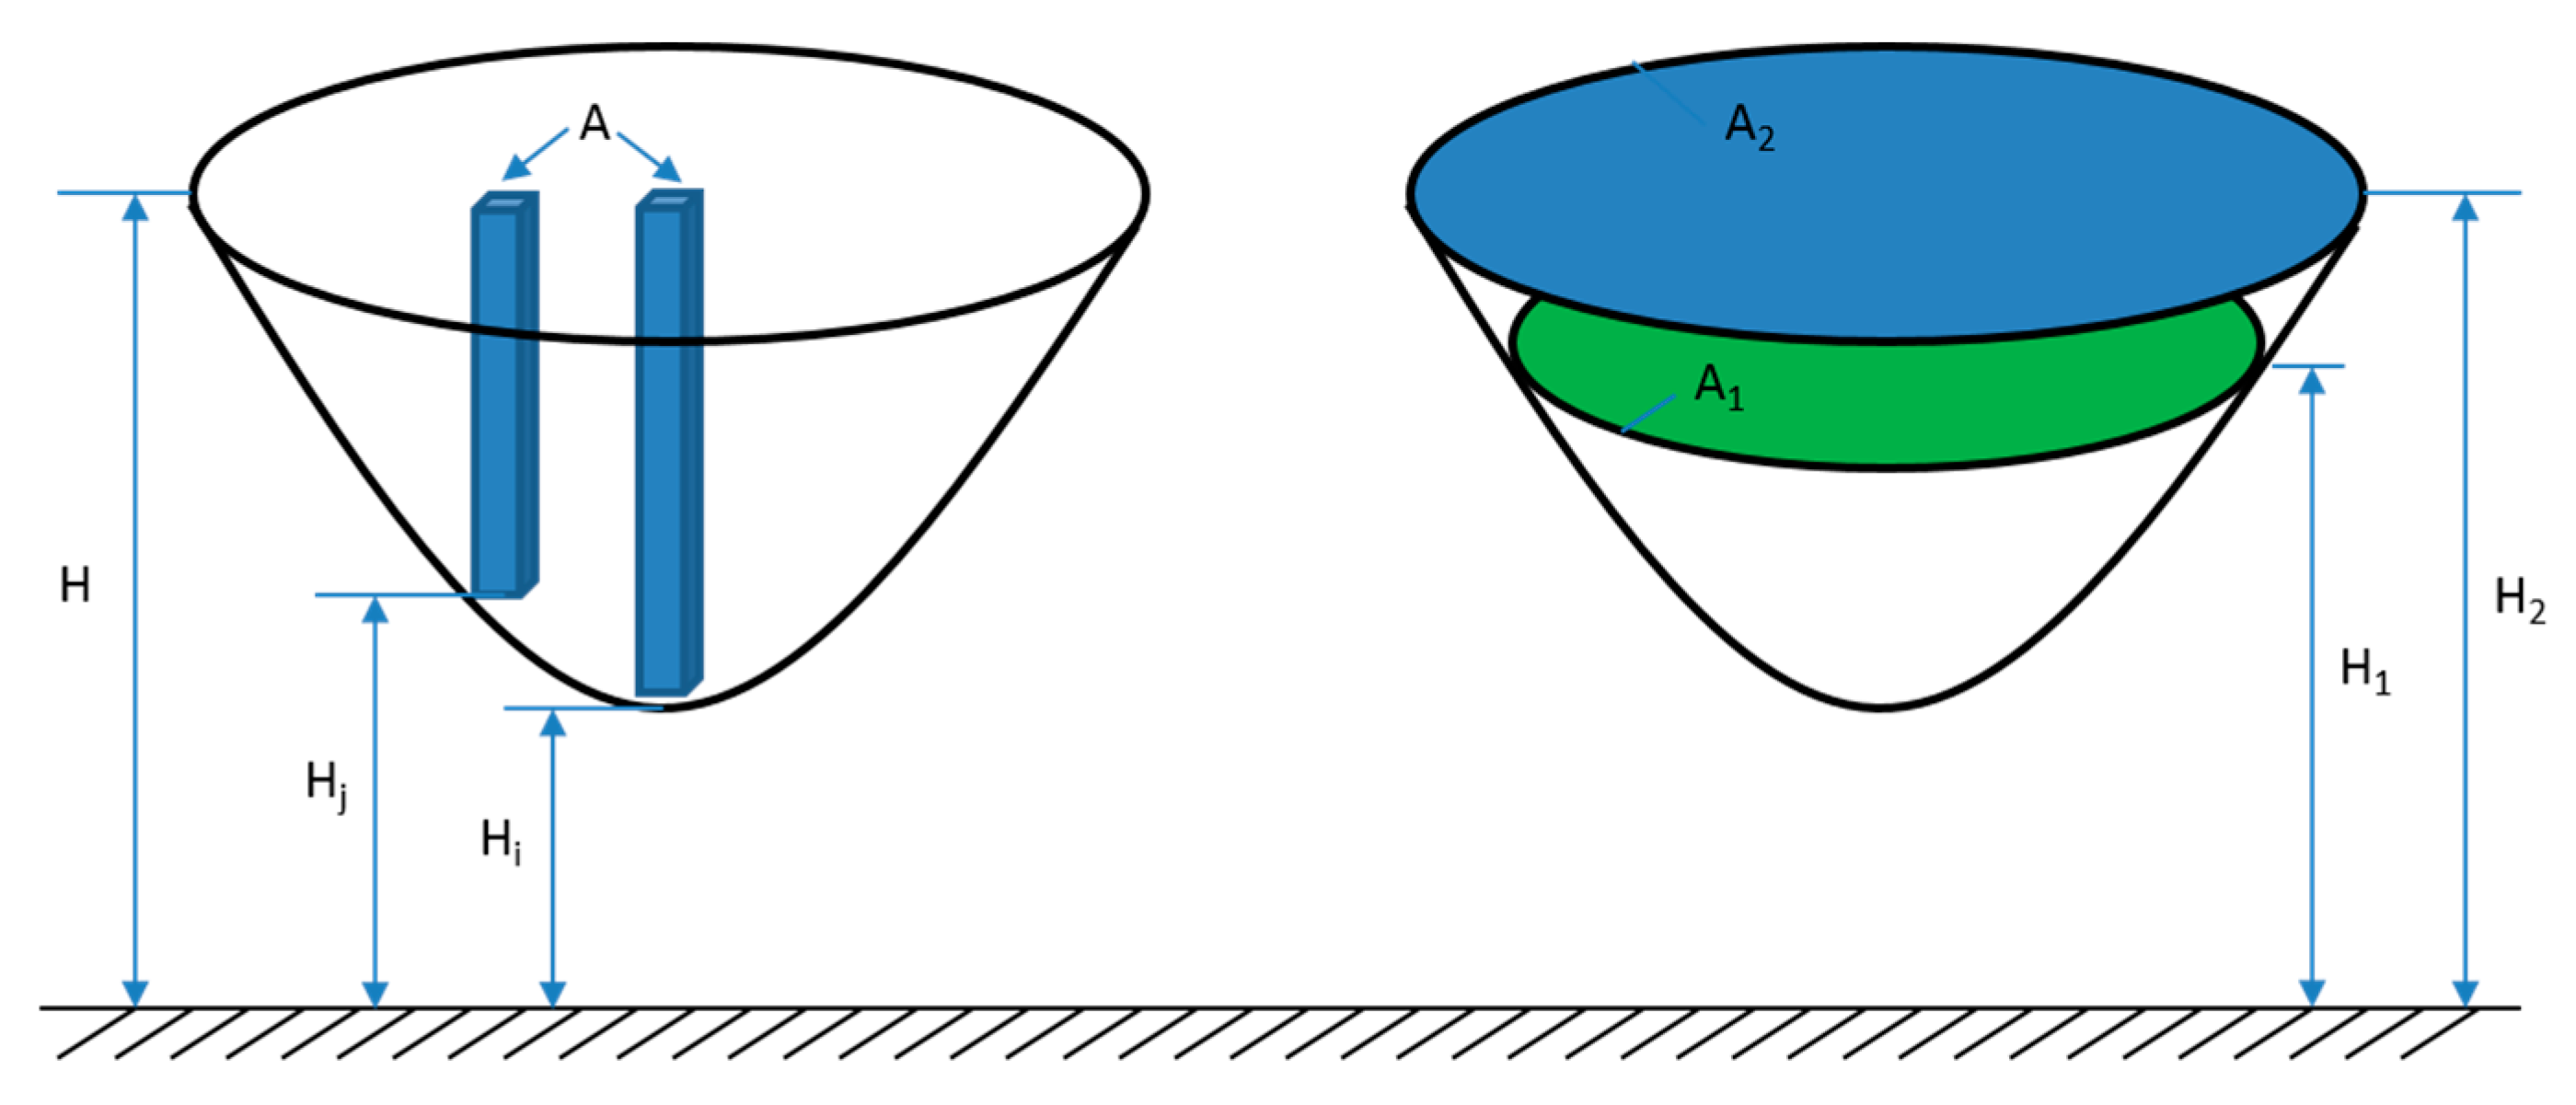
The relationship between water volume and water level is known if the bathymetry is available (Figure 9). We can calculate it by summing all small volumes as below:
V = i = 1 n ( H H i ) A
with V total storage, H lake surface height, Hi the bottom elevation of each volume, and A is the sectional area of volume. This can be used to establish the stage-storage curve. Thus, the instantaneous storage can be calculated using altimetry data.
However, for real-world applications, the bathymetric data is often unavailable. Instead of the total storage, storage changes can be estimated combining lake level with corresponding extent, both of which can be obtained from remote sensing datasets. Then, we can calculate the storage change under the assumption that the volume is a circular cone [57] (Figure 9):
S = 1 3 ( H 2 H 1 ) ( A 1 + A 2 + A 1 × A 2 )
where, S is the storage change; H2, H1 and A2, A1 are lake levels and areal extents at different dates, respectively. Sometimes, the estimation of storage change based on a constant extent gives a reasonable approximation [58]. However, with the high temporal resolution SAR imagery from Sentinel-1, dynamic lake storage changes can be estimated. For example, Baup et al. [59] estimated the volume of small lakes by combining high-resolution SAR images and altimetry.
Water storage of lakes and reservoirs inferred from altimetry is of great value to regional water management and hydrologic modeling. In addition, it contributes to the understanding of total water storage changes (including ground water storage) variation inferred from GRACE. For example, the lake mass change inferred from altimetry accounts for 61% of storage increases derived from GRACE in the inner Tibetan Plateau [20].

6. Use of CryoSat-2 over Rivers

In general, the application of satellite altimetry requires the river to be of a certain minimum width around a hundred to a few hundred meters due to the footprint size of the altimeter. Otherwise, the waveform is too contaminated by the surrounding land surface. Furthermore, steep river valleys make it hard for the range window to be adapted to the river water surface if the altimeter operates in closed loop mode such as on CryoSat-2 [60]. Another important factor is the orientation of the river in relation to the ground track: All satellite altimetry missions have ground tracks with a predominantly north–south direction, which gives most regular observations over rivers flowing in the east–west direction.

6.1. Masking and Filtering

The unique drifting ground track pattern of CryoSat-2 challenges common ways of dealing with satellite altimetry data over rivers. All the conventional satellite altimetry missions have an inter-track spacing between two consecutive ground tracks of at least 80 km at the equator. This is also reflected in the processing methods of the currently active databases for inland water satellite altimetry: HydroWeb (http://www.legos.obs-mip.fr/en/soa/hydrologie/hydroweb/) applies rectangular masks at the locations of the virtual stations [61]. The DAHITI (http://dahiti.dgfi.tum.de/en/) database uses simple latitude thresholds, exploiting the fact that the altimetry satellites’ ground tracks run in a predominantly north–south direction [49]. CryoSat-2 however has a much finer inter-track spacing of approximately 7.5 km (compare Figure 4 and Table 1). This means that, instead of locally limited river masks, continuous river masks are needed.
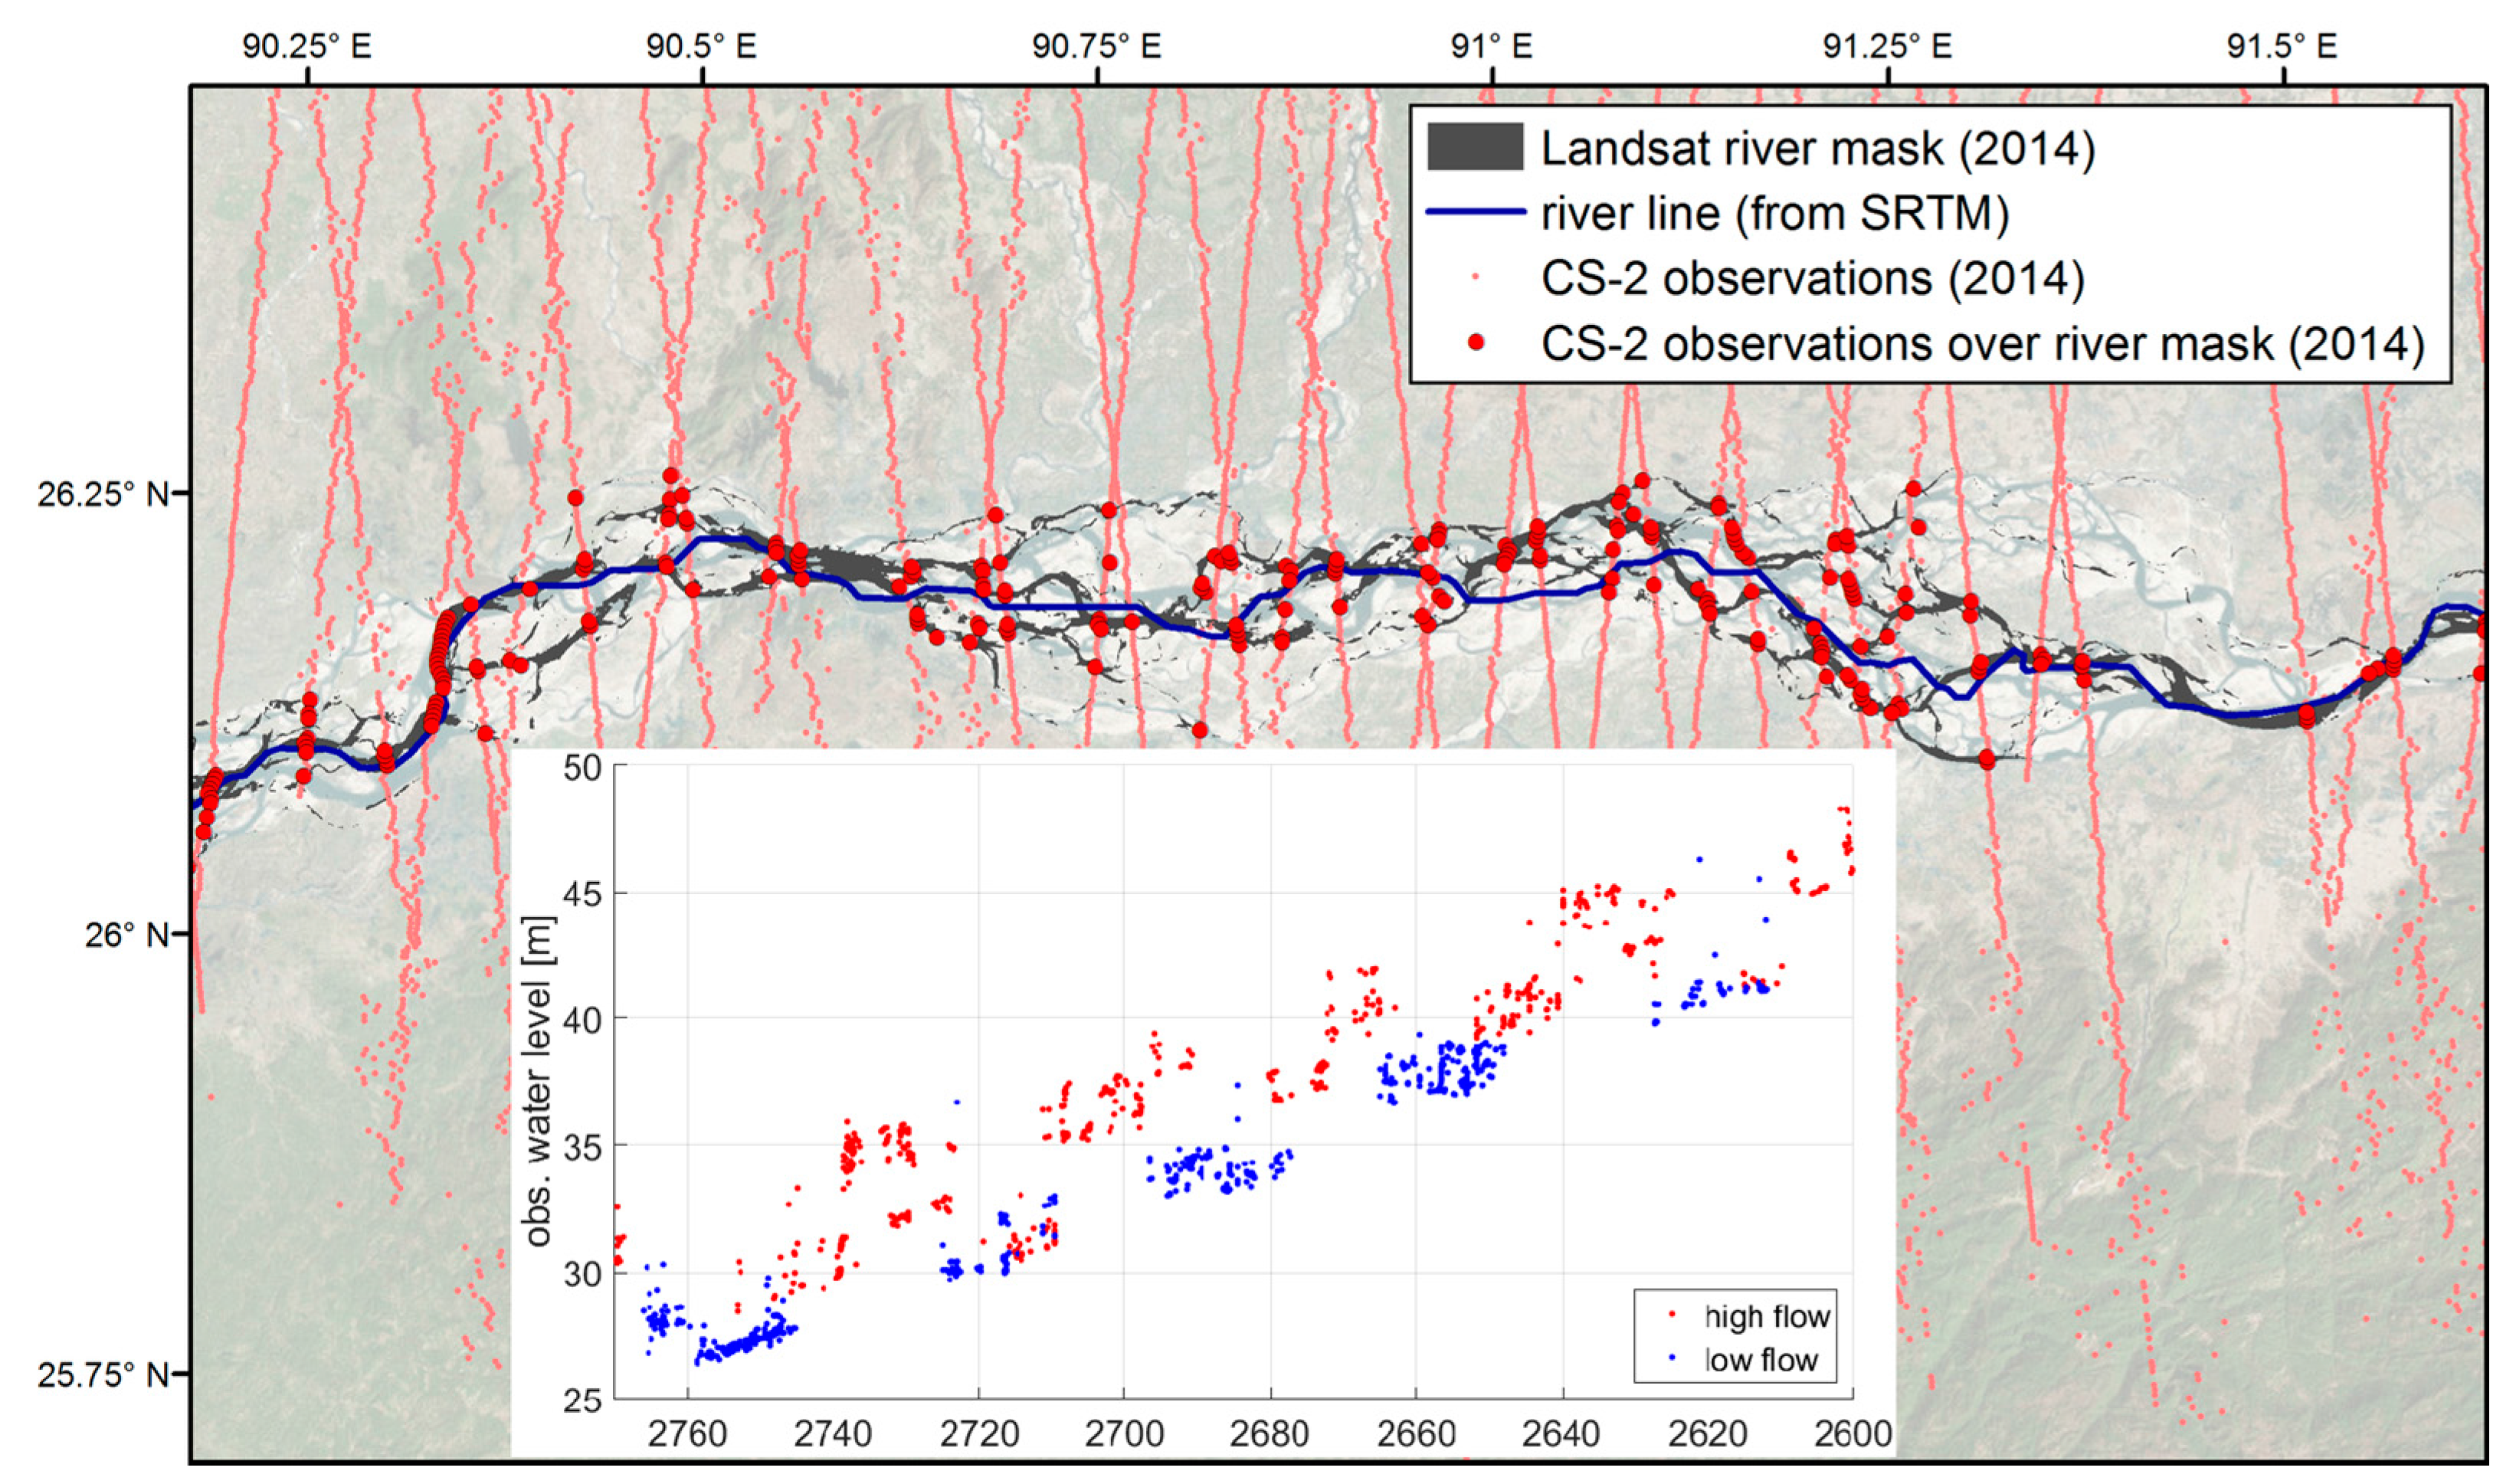
Another database, the ESA project River&Lake (http://tethys.eaprs.cse.dmu.ac.uk/RiverLake/shared/main), already used a continuous global river mask, however it is static and at low resolution [62], not accounting for potential changes in the course of the rivers over the years. High-resolution and potentially dynamic water masks, to take into account changes of the water body’s extent, are derived from remote sensing imagery. Often, optical imagery, e.g., from Landsat, is used [30,63]. Such optical imagery provides high spatial and temporal resolution (30 m and 16 days, respectively, in the case of Landsat), is available freely, and easy to process. However, issues with cloud cover can severely limit the actual amount of data available, for example, making it possible to only derive one mask each year for the Brahmaputra River [30] as shown in Figure 10. Recently, readily processed, global and multi-temporal water masks from Landsat imagery have been made available, for example, the Global Surface Water Explorer [9]. Such masks could support the development of global altimetry databases. However, there also exists a weather independent alternative to derive water masks: SAR imagery. Since the start of the Sentinel-1A mission in 2014 as part of the Copernicus programme, high resolution SAR imagery is freely available. Its use could improve the river masks significantly, and hence improve the amount and quality of the extracted CryoSat-2 water level observations.
Besides the challenges to river masking, the absence of a (short) repeat cycle also means that time series analysis for outlier filtering and uncertainty estimation of the observations cannot be applied for CryoSat data over rivers, at least not directly: In the case of virtual station time series, water level amplitudes can be observed during the course of a year, potentially detecting outliers. Both DAHITI and HydroWeb use some outlier filtering based on the whole time series for their virtual station products.
Due to these challenges, neither DAHITI nor HydroWeb (nor the now inactive River&Lake database) currently offer readily available water level measurements over rivers from CryoSat-2, but only from the repeat orbit missions.

6.2. Densification

For various purposes, such as the creation of time series and the validation of CryoSat-2 observations against in situ station observations, it can be necessary to interpolate the spatio-temporally distributed observations of CryoSat-2 onto certain points (e.g., virtual stations). To achieve this, there exist, in principle, three methods:
First, the interpolation of water level observations along the river, using the water level slope. This water level slope can, for example, be estimated from the very same data, as done by Villadsen et al. [19] with CryoSat-2 data over the Ganges and Brahmaputra rivers. They interpolated the CryoSat-2 data to Envisat virtual stations along the Brahmaputra River and found a reasonable agreement between Envisat and CryoSat-2 data. However, such simple interpolation introduces errors, for example, by not taking into account changing water level slopes between a high- and low-flow season or approaching or receding flood waves.
Another suggestion was made by Tourian et al. [50]. They used quantiles of relative water levels at virtual stations, and transferred those to defined stations using simple time lags along the river network. By this, they can densify multi-mission altimetry datasets. They also included CryoSat-2 data in their study. However, the application of this method to CryoSat-2 still is challenging as the proposed method derives the quantiles from empirical cumulative distribution functions. With the proposed method, these distributions can only be derived from virtual station time series with a sufficient number of observations at the same location. For CryoSat-2, the quantile values were interpolated from downstream and upstream virtual stations with a short repeat cycle. This interpolation potentially introduces errors: In a direct comparison of in situ and CryoSat-2 data close to the in situ stations, Tourian et al. found that CryoSat-2 performs better than most other missions. Its inclusion in the entire dataset of repeat orbit missions however slightly deteriorated the performance of the multi-mission dataset.
The third possibility is the spatio-temporal interpolation of the scattered CryoSat-2 observations to obtain continuous water level surfaces. Such an interpolation should be aware of the correlations of the water levels in time and in space, due to the river network and the physics of river flow. Kriging methods have been suggested for such tasks and applied, for example, with synthetic SWOT data over the Ganges-Brahmaputra-Meghna Delta [64] or the Tennessee River [65]. A multi-mission dataset has been interpolated with spatio-temporal kriging by Boergens et al. [66], however also here CryoSat-2 was not included. This is due to the fact that the method requires the altimetry data to be in the form of virtual station time series. Simple spatio-temporal interpolation of CryoSat-2 water level observations can be successful, at least for simple river networks as shown by Bercher et al. for CryoSat-2 data over a tributary of the Amazon River [67]. Their results, however, were not validated against in situ data.

6.3. Merging with Hydrodynamic Models

River discharge is one key component of the water cycle and is one of the most important quantities for the hydrology community. Although discharge can be inferred from altimetry data based on Manning’s equation if cross-sectional geometry and roughness are available or can be estimated, the estimates of discharge are only produced at the time of altimetry overpasses [68]. As discussed above, data based densification approaches also have their shortcomings and inaccuracies. The best estimators of water levels, continuous in time and space, are hydrodynamic models. Such models then can be informed by altimetry data in different ways.
On the one hand, calibration of model parameters such as channel shape and channel roughness is possible. This was performed with data from conventional altimetry missions such as Envisat and ERS-2 [69,70], TOPEX/Poseidon [71]. Schneider et al. [30] exploited the fine spatial resolution along the course of a river (compare Figure 10). Here, CryoSat-2 data was used over the Brahmaputra River in combination with Envisat virtual station data to calibrate cross section shapes and datums of a hydrodynamic model of the river. The calibrated model is able to reproduce water level–discharge relationships with an accuracy that hardly can be obtained by using globally available DEMs such as SRTM for model parameterization only.
On the other hand, satellite altimetry data also can be used to update the states of a hydrodynamic river model, i.e., its water levels via data assimilation. This has, for example, been successfully demonstrated with Envisat data over the Brahmaputra River [22], the Amazon River [72] or over the Zambezi River [16]. Jason-2 altimetry has successfully been assimilated to a hydrodynamic model of the Ganges-Brahmaputra-Meghna river system in a real-time flood forecasting system [73]. As for many of the aforementioned methods, all these studies, however, do use altimetry data in the form of virtual station time series. To assimilate CryoSat-2 data, a flexible modelling-data assimilation approach is needed, being able to handle altimetry measurements arbitrarily distributed in time and space. One such framework was proposed by Schneider et al. [74], and has been tested with a 1D hydrodynamic model of the Brahmaputra River. With this modelling and data assimilation approach, any kind of altimetry data, including multi-mission datasets, can be ingested.

7. Discussion and Perspectives

CryoSat-2, with its SIRAL altimetry instrument, began a new era of SAR altimetry, which outperforms conventional altimeters by providing a finer along-track resolution [32]. However, to date, applications of CryoSat-2 data for hydrologic studies are scarce. This is due to the new challenges posed by CryoSat-2 compared to previous missions which originate from the drifting ground track pattern. These issues, mentioned above, are reflected in the limited availability of CryoSat-2 water level data in inland water altimetry databases.
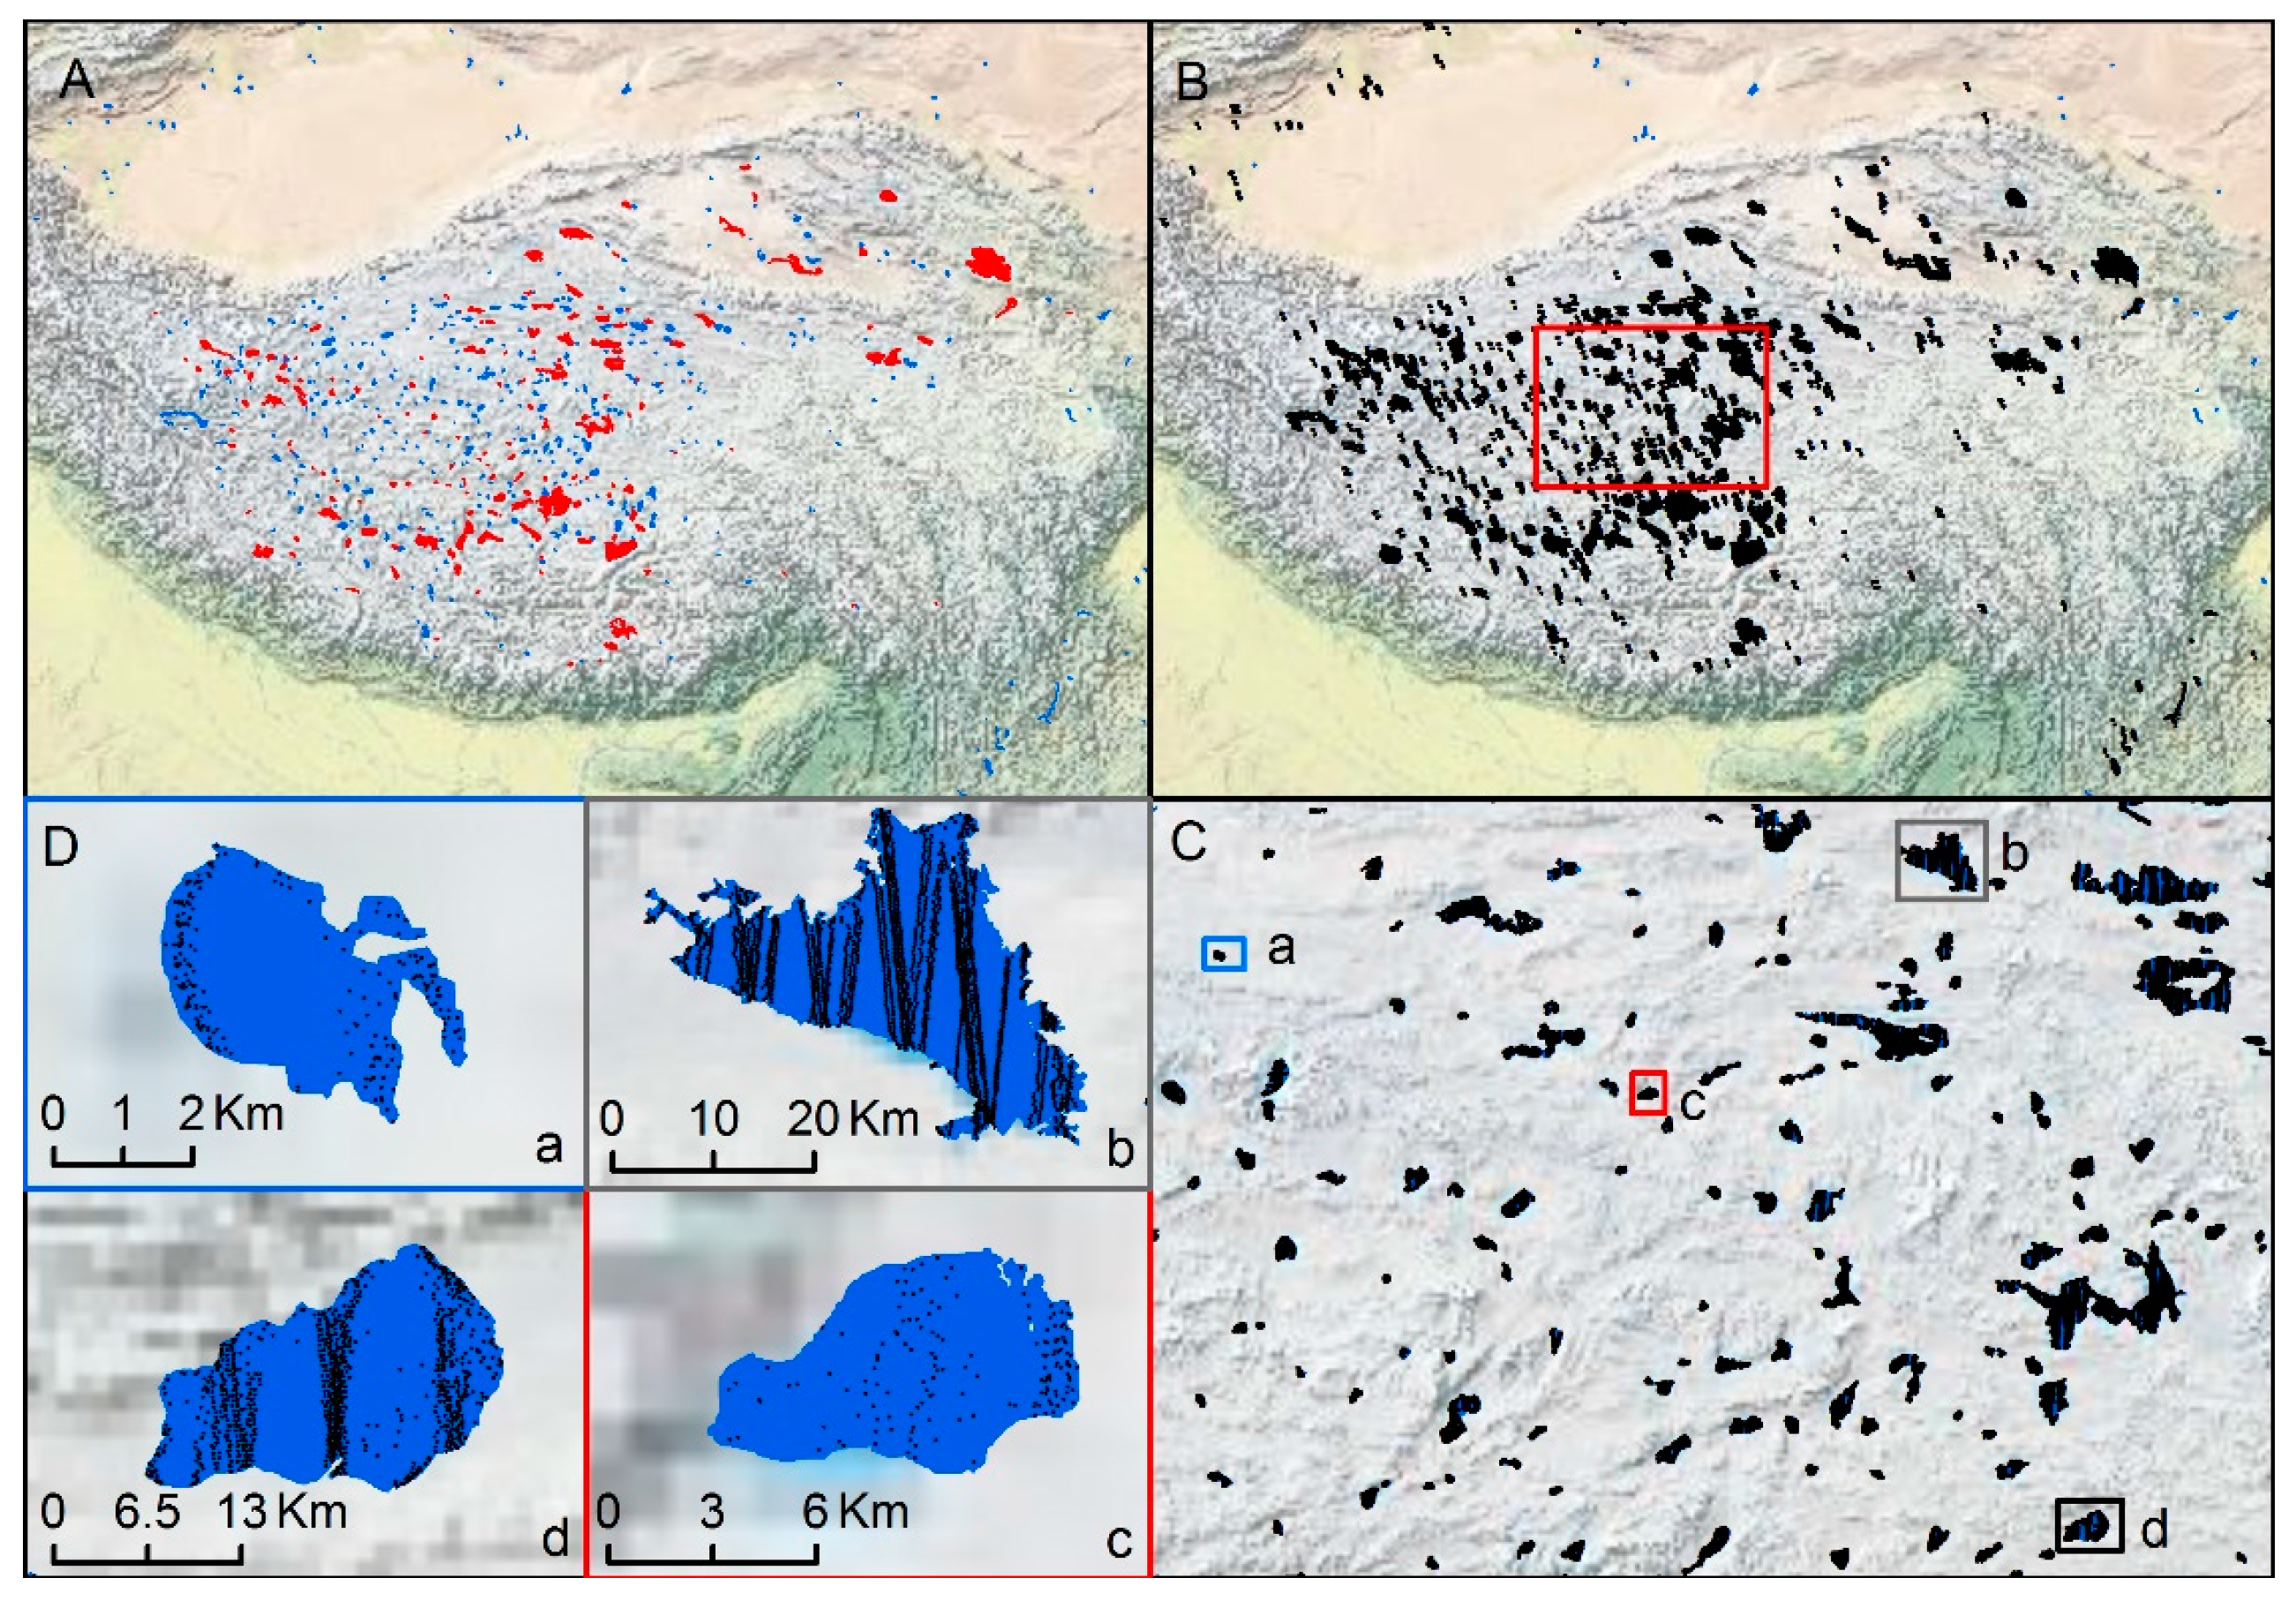
However, besides the new altimetry instrument, CryoSat-2 has other advantages over the previous short-repeat missions. The small inter-track distance is beneficial over lakes: For example, the study of Kleinherenbrink et al. [17] shows that CryoSat visited 125 lakes with at least four passes over the period February 2012 to January 2014 in the Tibetan Plateau and Tian Shan area. Actually, CryoSat-2 sampled more than 400 lakes with at least ten passes over 6 years in the Tibetan Plateau (Figure 11), including practically all lakes with surface areas exceeding 5 km2. This is unachievable using previous altimetry missions. Moreover, the study of Nielsen et al. [18] indicates that CryoSat-2 has better precision than Envisat with regard to mean water level. Therefore, CryoSat-2 shows great advantages over other missions in lake level monitoring.
CryoSat-2 also can be used beneficially over rivers. One important novelty and advantage of CryoSat-2 is that its ground track pattern allows deriving high-resolution water level profiles [26] (Figure 10). Similarly, data from ICESat with slightly lower along-river resolution than CryoSat-2 has been used for a hydraulic characterization of the Congo River [75], allowing to derive water surface slopes with greater detail than those previously derived from virtual station altimetry. Such hydraulic characteristics of rivers can be used to parameterize or calibrate hydrodynamic models of the same rivers, with higher spatial resolution than previously possible. Furthermore, with a flexible data assimilation approach, CryoSat-2 data can be used to update hydrodynamic models [74].
Moreover, the higher resolution and the better signal-to-noise ratio of SAR/SARIn data allow monitoring water levels of narrow rivers [30,76], for which the application of satellite altimetry for water level measurements has been restricted in the past [77]. Given that most major rivers are less than 1 km wide [78,79], SAR altimetry will be of great value for river water level monitoring due to its higher spatial resolution and higher precision. With the operation of Sentinel-3A and upcoming Sentinel-3B, SAR altimetry is likely to get more attention in river monitoring with the increase in both accuracy and coverage (inter-track distance at the equator 52 km of the constellation).
Some of the strategies developed for CryoSat-2, such as new approaches to densification of altimetry measurements and combination with hydrodynamic models will support processing and application of data from the upcoming SWOT mission. SWOT, expected to be launched in 2020 by NASA, will be the first satellite altimetry mission to provide images of water heights (instead of points at nadir) [80]. Hence, its capabilities and potential applications over inland water bodies have been assessed in many studies [64,81,82,83,84]. The mission’s new sampling pattern will require some of the techniques developed for CryoSat-2 data, such as flexible data assimilation approaches or interpolation methods. Also, SWOT will provide instantaneous water level profiles along rivers within single measurements (images). This is different from CryoSat-2, which provides water level profiles sampled in a series of consecutive overflights. Combination of all the different missions and data types will greatly enhance our understanding of water storage and flow characteristics and support model calibration and operational forecasting.

8. Conclusions

Being an ongoing mission, CryoSat-2 will continue to build up its dataset starting in 2010. In this review, promising applications of CryoSat-2 over lakes and rivers have been summarized. CryoSat-2 can be used beneficially over inland water. If exploited correctly, it features some significant advantages over previous short-repeat cycle missions mostly related to its drifting ground track pattern and resulting shorter inter-track distance.
Using CryoSat-2 data requires moving beyond the concept of virtual stations, or station data in general. Some of the data processing developed for CryoSat-2 inland water altimetry data will be useful for handling data delivered by the state-of-the-art Sentinel-3 altimeter. In general, the technology push created by CryoSat-2 can ultimately lead to data processing and model integration techniques being able to effectively handle altimetry datasets with arbitrary spatio-temporal distribution, or multi-mission datasets. This could also include new, unconventional data types, such as data acquired from UAVs (Unmanned Aerial Vehicle).
The new generation of SAR altimeters (Sentinel-3, Jason-CS/Sentinel-6 and SWOT) is expected to provide higher resolution data at unprecedented spatial coverage. This will further improve our abilities to monitor surface water variations, especially in data-sparse regions, and also help to advance forecasting applications.

Acknowledgments

Liguang Jiang is supported by China Scholarship Council, which is gratefully acknowledged.

Author Contributions

All authors contributed extensively to this paper.

Conflicts of Interest

The authors declare no conflict of interest.

References

  1. Vorosmarty, C.J. Global Water Resources: Vulnerability from Climate Change and Population Growth. Science 2000, 289, 284–288. [Google Scholar] [CrossRef] [PubMed]
  2. Flood Fury: Why Brahmaputra’s Trail of Destruction Has Become Annual Ritual in Assam. The Indian Express. Available online: http://indianexpress.com/article/india/india-news-india/flood-fury-why-brahmapurtas-trail-of-destruction-has-become-annual-ritual-in-assam-2958587/ (accessed on 16 January 2017).
  3. United States Geological Survey (USGS). The Water Cycle. Available online: http://water.usgs.gov/edu/watercyclefreshstorage.html (accessed on 10 March 2017).
  4. Ma, R.; Duan, H.; Hu, C.; Feng, X.; Li, A.; Ju, W.; Jiang, J.; Yang, G. A half-century of changes in China’s lakes: Global warming or human influence? Geophys. Res. Lett. 2010, 37. [Google Scholar] [CrossRef]
  5. Oren, A.; Plotnikov, I.S.; Sokolov, S.S.; Aladin, N.V. The Aral Sea and the Dead Sea: Disparate lakes with similar histories. Lakes Reserv. Res. Manag. 2010, 15, 223–236. [Google Scholar] [CrossRef]
  6. Carroll, M.L.; Townshend, J.R.G.; Dimiceli, C.M.; Loboda, T.; Sohlberg, R.A. Shrinking lakes of the Arctic: Spatial relationships and trajectory of change. Geophys. Res. Lett. 2011, 38, 1–5. [Google Scholar] [CrossRef]
  7. Gao, H.; Bohn, T.J.; Podest, E.; McDonald, K.C.; Lettenmaier, D.P. On the causes of the shrinking of Lake Chad. Environ. Res. Lett. 2011, 6, 34021. [Google Scholar] [CrossRef]
  8. Tao, S.; Fang, J.; Zhao, X.; Zhao, S.; Shen, H.; Hu, H.; Tang, Z.; Wang, Z.; Guo, Q. Rapid loss of lakes on the Mongolian Plateau. Proc. Natl. Acad. Sci. USA 2015, 112, 2281–2286. [Google Scholar] [CrossRef] [PubMed]
  9. Pekel, J.-F.; Cottam, A.; Gorelick, N.; Belward, A.S. High-resolution mapping of global surface water and its long-term changes. Nature 2016, 540, 418–422. [Google Scholar] [CrossRef] [PubMed]
  10. Da Silva, J.S.; Calmant, S.; Seyler, F.; Moreira, D.M.; Oliveira, D.; Monteiro, A. Radar Altimetry Aids Managing Gauge Networks. Water Resour. Manag. 2014, 28, 587–603. [Google Scholar] [CrossRef]
  11. Global Runoff Data Center (GRDC). Global Runoff Database 2015. Available online: http://www.bafg.de/GRDC/EN/Home/homepage_node.html (accessed on 10 March 2017).
  12. Biancamaria, S.; Hossain, F.; Lettenmaier, D.P. Forecasting transboundary river water elevations from space. Geophys. Res. Lett. 2011, 38, 1–5. [Google Scholar] [CrossRef]
  13. Birkett, C.M. The contribution of TOPEX/POSEIDON to the global monitoring of climatically sensitive lakes. J. Geophys. Res. 1995, 100, 25179. [Google Scholar] [CrossRef]
  14. Berry, P.A.M.; Garlick, J.D.; Freeman, J.A.; Mathers, E.L. Global inland water monitoring from multi-mission altimetry. Geophys. Res. Lett. 2005, 32, 1–4. [Google Scholar] [CrossRef]
  15. Crétaux, J.F.; Birkett, C. Lake studies from satellite radar altimetry. C. R. Geosci. 2006, 338, 1098–1112. [Google Scholar] [CrossRef]
  16. Michailovsky, C.I.; Bauer-Gottwein, P. Operational reservoir inflow forecasting with radar altimetry: The Zambezi case study. Hydrol. Earth Syst. Sci. 2014, 18, 997–1007. [Google Scholar] [CrossRef] [Green Version]
  17. Kleinherenbrink, M.; Lindenbergh, R.C.; Ditmar, P.G. Monitoring of lake level changes on the Tibetan Plateau and Tian Shan by retracking Cryosat SARIn waveforms. J. Hydrol. 2015, 521, 119–131. [Google Scholar] [CrossRef]
  18. Nielsen, K.; Stenseng, L.; Andersen, O.B.; Villadsen, H.; Knudsen, P. Validation of CryoSat-2 SAR mode based lake levels. Remote Sens. Environ. 2015, 171, 162–170. [Google Scholar] [CrossRef] [Green Version]
  19. Villadsen, H.; Andersen, O.B.; Stenseng, L.; Nielsen, K.; Knudsen, P. CryoSat-2 altimetry for river level monitoring—Evaluation in the Ganges–Brahmaputra River basin. Remote Sens. Environ. 2015, 168, 80–89. [Google Scholar] [CrossRef]
  20. Zhang, G.; Yao, T.; Xie, H.; Kang, S.; Lei, Y. Increased mass over the Tibetan Plateau: From lakes or glaciers? Geophys. Res. Lett. 2013, 40, 2125–2130. [Google Scholar] [CrossRef]
  21. Jiang, L.; Nielsen, K.; Andersen, O.B.; Bauer-Gottwein, P. Monitoring recent lake level variations on the Tibetan Plateau using CryoSat-2 SARIn mode data. J. Hydrol. 2017, 544, 109–124. [Google Scholar] [CrossRef]
  22. Michailovsky, C.I.; Milzow, C.; Bauer-Gottwein, P. Assimilation of radar altimetry to a routing model of the Brahmaputra River. Water Resour. Res. 2013, 49, 4807–4816. [Google Scholar] [CrossRef]
  23. Maswood, M.; Hossain, F. Advancing River Modeling in Ungauged Basins using Satellite Remote Sensing: The case of the Ganges-Brahmaputra-Meghna basins. Int. J. River Basin Manag. 2016, 14, 103–117. [Google Scholar] [CrossRef]
  24. Paris, A.; de Paiva, R.D.; da Silva, J.S.; Moreira, D.M.; Calmant, S.; Garambois, P.-A.; Collischonn, W.; Bonnet, M.-P.; Seyler, F. Stage-discharge rating curves based on satellite altimetry andmodeled discharge in the Amazon basin. Water Resour. Res. 2016, 52, 3787–3814. [Google Scholar] [CrossRef]
  25. Semmling, M.; Beyerle, G.; Beckheinrich, J.; Ge, M.; Wickert, J. Airborne GNSS reflectometry using crossover reference points for carrier phase altimetry. In Proceedings of the 2014 IEEE International Geoscience and Remote Sensing Symposium, Quebec City, QC, Canada, 13–18 July 2014; pp. 3786–3789.
  26. Jin, S.; Komjathy, A. GNSS reflectometry and remote sensing: New objectives and results. Adv. Space Res. 2010, 46, 111–117. [Google Scholar] [CrossRef]
  27. Richter, A.; Popov, S.V.; Fritsche, M.; Lukin, V.V.; Matveev, A.Y.; Ekaykin, A.A.; Lipenkov, V.Y.; Fedorov, D.V.; Eberlein, L.; Schröder, L.; et al. Height changes over subglacial Lake Vostok, East Antarctica: Insights from GNSS observations. J. Geophys. Res. Earth Surf. 2014, 119, 2460–2480. [Google Scholar] [CrossRef]
  28. Asadzadeh Jarihani, A.; Callow, J.N.; Johansen, K.; Gouweleeuw, B. Evaluation of multiple satellite altimetry data for studying inland water bodies and river floods. J. Hydrol. 2013, 505, 78–90. [Google Scholar] [CrossRef]
  29. Ricker, R.; Hendricks, S.; Helm, V.; Gerdes, R. Classification of CryoSat-2 radar echoes. In Towards an Interdisciplinary Approach in Earth System Science: Advances of a Helmholtz Graduate Research School; Springer: Cham, Switzerland, 2015; pp. 149–158. [Google Scholar]
  30. Schneider, R.; Godiksen, P.N.; Villadsen, H.; Madsen, H.; Bauer-Gottwein, P. Application of CryoSat-2 altimetry data for river analysis and modelling. Hydrol. Earth Syst. Sci. 2017, 21, 751–764. [Google Scholar] [CrossRef]
  31. Göttl, F.; Dettmering, D.; Müller, F.; Schwatke, C. Lake Level Estimation Based on CryoSat-2 SAR Altimetry and Multi-Looked Waveform Classification. Remote Sens. 2016, 8, 885. [Google Scholar] [CrossRef]
  32. Villadsen, H.; Deng, X.; Andersen, O.B.; Stenseng, L.; Nielsen, K.; Knudsen, P. Improved inland water levels from SAR altimetry using novel empirical and physical retrackers. J. Hydrol. 2016, 537, 234–247. [Google Scholar] [CrossRef] [Green Version]
  33. Chelton, D.B.; Ries, J.C.; Haines, B.J.; Fu, L.-L.; Callahan, P.S. Satellite altimetry. In Satellite Altimetry and Earth Sciences: A Handbook of Techniques and Applications; Academic Press: Cambridge, MA, USA, 2001; Volume 69, pp. 2504–2510. [Google Scholar]
  34. European Space Agency. Mullar Space Science Laboratory CryoSat Product Handbook; European Space Agency: Paris, France, 2012; Volume DLFE-3605, Available online: https://earth.esa.int/c/document_library/get_file?folderId=125272&name=DLFE-3605.pdf (accessed on 27 January 2017).
  35. Jain, M.; Andersen, O.B.; Dall, J. Improved Sea Level Determination in the Arctic Regions through Development of Tolerant Altimetry Retracking; Technical University of Denmark: Kgs. Lyngby, Denmark, 2015. [Google Scholar]
  36. Rosmorduc, V.; Benveniste, J.; Lauret, O.; Maheu, C.; Milagro, M.; Picot, N. Radar Altimetry Tutorial; Benveniste, J., Picot, N., Eds.; European Space Agency: Paris, France, 2011. [Google Scholar]
  37. Bao, L.; Lu, Y.; Wang, Y. Improved retracking algorithm for oceanic altimeter waveforms. Prog. Nat. Sci. 2009, 19, 195–203. [Google Scholar] [CrossRef]
  38. Jain, M.; Andersen, O.B.; Dall, J.; Stenseng, L. Sea surface height determination in the Arctic using Cryosat-2 SAR data from primary peak empirical retrackers. Adv. Space Res. 2015, 55, 40–50. [Google Scholar] [CrossRef]
  39. Davis, C.H. Growth of the Greenland ice sheet: A performance assessment of altimeter retracking algorithms. IEEE Trans. Geosci. Remote Sens. 1995, 33, 1108–1116. [Google Scholar] [CrossRef]
  40. European Space Agency. CryoSat Level-2 Product Evolutions and Quality Improvements in Baseline C. 2015. Available online: https://earth.esa.int/documents/10174/1773005/C2-Evolution-BaselineC-Level2-V3 (accessed on 27 January 2017).
  41. Birkett, C.M.; Beckley, B.D. Investigating the Performance of the Jason-2/OSTM Radar Altimeter over Lakes and Reservoirs. Mar. Geod. 2010, 33, 204–238. [Google Scholar] [CrossRef]
  42. Geographical Mode Mask. Content—Earth Online—ESA. Available online: https://earth.esa.int/web/guest/-/geographical-mode-mask-7107 (accessed on 16 January 2017).
  43. Wingham, D.J.; Francis, C.R.; Baker, S.; Bouzinac, C.; Brockley, D.; Cullen, R.; de Chateau-Thierry, P.; Laxon, S.W.; Mallow, U.; Mavrocordatos, C.; et al. CryoSat: A mission to determine the fluctuations in Earth’s land and marine ice fields. Adv. Space Res. 2006, 37, 841–871. [Google Scholar] [CrossRef]
  44. Ulaby, F.T.; Long, D.G.; Blackwell, W.J.; Elachi, C.; Fung, A.K.; Ruf, C.; Sarabandi, K.; Zebker, H.A.; van Zyl, J. Microwave Radar and Radiometric Remote Sensing; University of Michigan Press: Ann Arbor, MI, USA, 2014. [Google Scholar]
  45. Soussi, B. ENVISAT ALTIMETRY Level 2 User Manual. Available online: https://earth.esa.int/pub/ESA_DOC/ENVISAT/RA2-MWR/PH_light_1rev4_ESA.pdf (accessed on 27 January 2017).
  46. Fetterer, F.M.; Drinkwater, M.R.; Jezek, K.C.; Laxon, S.W.C.; Onstott, R.G.; Ulander, L.M.H. Sea ice altimetry. In Microwave Remote Sensing of Sea Ice; Carsey, F.D., Ed.; Geophysical Monograph Series; American Geophysical Union (AGU): Washington, DC, USA, 1992; Volume 68, pp. 111–135. [Google Scholar]
  47. Keith Raney, R. The delay/doppler radar altimeter. IEEE Trans. Geosci. Remote Sens. 1998, 36, 1578–1588. [Google Scholar] [CrossRef]
  48. Kleinherenbrink, M.; Ditmar, P.G.; Lindenbergh, R.C. Retracking Cryosat data in the SARIn mode and robust lake level extraction. Remote Sens. Environ. 2014, 152, 38–50. [Google Scholar] [CrossRef]
  49. Schwatke, C.; Dettmering, D.; Bosch, W.; Seitz, F. DAHITI—An innovative approach for estimating water level time series over inland waters using multi-mission satellite altimetry. Hydrol. Earth Syst. Sci. 2015, 19, 4345–4364. [Google Scholar] [CrossRef]
  50. Tourian, M.J.; Tarpanelli, A.; Elmi, O.; Qin, T.; Brocca, L.; Moramarco, T.; Sneeuw, N. Spatiotemporal densification of river water level time series by multimission satellite altimetry. Water Resour. Res. 2016, 52, 1140–1159. [Google Scholar] [CrossRef]
  51. Song, C.; Ye, Q.; Cheng, X. Shifts in water-level variation of Namco in the central Tibetan Plateau from ICESat and CryoSat-2 altimetry and station observations. Sci. Bull. 2015, 60, 1287–1297. [Google Scholar] [CrossRef]
  52. Tourian, M.J.; Elmi, O.; Chen, Q.; Devaraju, B.; Roohi, S.; Sneeuw, N. A spaceborne multisensor approach to monitor the desiccation of Lake Urmia in Iran. Remote Sens. Environ. 2015, 156, 349–360. [Google Scholar] [CrossRef]
  53. Zhang, G.; Xie, H.; Kang, S.; Yi, D.; Ackley, S.F. Monitoring lake level changes on the Tibetan Plateau using ICESat altimetry data (2003–2009). Remote Sens. Environ. 2011, 115, 1733–1742. [Google Scholar] [CrossRef]
  54. Gao, L.; Liao, J.; Shen, G. Monitoring lake-level changes in the Qinghai–Tibetan Plateau using radar altimeter data (2002–2012). J. Appl. Remote Sens. 2013, 7, 73470. [Google Scholar] [CrossRef]
  55. Li, Y.; Liao, J.; Guo, H.; Liu, Z.; Shen, G. Patterns and potential drivers of dramatic changes in Tibetan lakes, 1972–2010. PLoS ONE 2014, 9, e111890. [Google Scholar] [CrossRef] [PubMed]
  56. Song, C.; Huang, B.; Ke, L. Heterogeneous change patterns of water level for inland lakes in High Mountain Asia derived from multi-mission satellite altimetry. Hydrol. Process. 2015, 29, 2769–2781. [Google Scholar] [CrossRef]
  57. Taube, C.M. Chapter 12: Three methods for computing the volume of a lake. In Manual of Fisheries Survey Mehtods II: With Periodic Updates; Schneider, J.C., Ed.; Michigan Department of Natural Resources: Lansing, MI, USA, 2000. [Google Scholar]
  58. Phan, V.H.; Lindenbergh, R.; Menenti, M. ICESat derived elevation changes of Tibetan lakes between 2003 and 2009. Int. J. Appl. Earth Obs. Geoinf. 2012, 17, 12–22. [Google Scholar] [CrossRef]
  59. Baup, F.; Frappart, F.; Maubant, J. Combining high-resolution satellite images and altimetry to estimate the volume of small lakes. Hydrol. Earth Syst. Sci. 2014, 18, 2007–2020. [Google Scholar] [CrossRef]
  60. Dehecq, A.; Gourmelen, N.; Shepherd, A.; Cullen, R.; Trouvé, E. Evaluation of CryoSat-2 for height retrieval over the Himalayan range. In Proceedings of the CryoSat-2 Third User Workshop, Dresden, Germany, 12–14 March 2013.
  61. Rosmorduc, V. Hydroweb Product User Manual Version 1.0; Theia—Land Data Centre: Ramonville-Saint-Agne, France, 2016. [Google Scholar]
  62. Berry, P.A.M.; Wheeler, J.L. JASON2-ENVISAT Exploitation—Development of Algorithms for the Exploitation of JASON2-ENVISAT Altimetry for the Generation of a River and Lake Product; Product Handbook v3.5; De Montfort University: Leicester, UK, 2009. [Google Scholar]
  63. Michailovsky, C.I.; McEnnis, S.; Berry, P.A.M.; Smith, R.; Bauer-Gottwein, P. River monitoring from satellite radar altimetry in the Zambezi River basin. Hydrol. Earth Syst. Sci. 2012, 16, 2181–2192. [Google Scholar] [CrossRef] [Green Version]
  64. Paiva, R.C.D.; Durand, M.T.; Hossain, F. Spatiotemporal interpolation of discharge across a river network by using synthetic SWOT satellite data. Water Resour. Res. 2015, 51, 430–449. [Google Scholar] [CrossRef]
  65. Yoon, Y.; Durand, M.; Merry, C.J.; Rodriguez, E. Improving temporal coverage of the SWOT mission using spatiotemporal kriging. IEEE J. Sel. Top. Appl. Earth Obs. Remote Sens. 2013, 6, 1719–1729. [Google Scholar] [CrossRef]
  66. Boergens, E.; Buhl, S.; Dettmering, D.; Klüppelberg, C.; Seitz, F. Combination of multi-mission altimetry data along the Mekong River with spatio-temporal kriging. J. Geod. 2016. [Google Scholar] [CrossRef]
  67. Bercher, N.; Dinardo, S.; Lucas, B.M.; Fleury, S.; Calmant, S.; Crétaux, J.-F.; Femenias, P.; Boy, F.; Picot, N.; Benveniste, J. Applications of CryoSat-2 SAR & SARIn modes for the monitoring of river water levels. In Proceedings of the CryoSat Third User Workshop, Dresden, Germany, 12–14 March 2013; pp. 1–7.
  68. Lettenmaier, D.P.; Alsdorf, D.; Dozier, J.; Huffman, G.J.; Pan, M.; Wood, E.F. Inroads of remote sensing into hydrologic science during the WRR era. Water Resour. Res. 2015, 51, 7309–7342. [Google Scholar] [CrossRef]
  69. Domeneghetti, A.; Tarpanelli, A.; Brocca, L.; Barbetta, S.; Moramarco, T.; Castellarin, A.; Brath, A. The use of remote sensing-derived water surface data for hydraulic model calibration. Remote Sens. Environ. 2014, 149, 130–141. [Google Scholar] [CrossRef]
  70. Yan, K.; Tarpanelli, A.; Balint, G.; Moramarco, T.; Di Baldassarre, G. Exploring the Potential of SRTM Topography and Radar Altimetry to Support Flood Propagation Modeling: Danube Case Study. J. Hydrol. Eng. 2014, 20, 04014048. [Google Scholar] [CrossRef]
  71. Biancamaria, S.; Bates, P.D.; Boone, A.; Mognard, N.M. Large-scale coupled hydrologic and hydraulic modelling of the Ob River in Siberia. J. Hydrol. 2009, 379, 136–150. [Google Scholar] [CrossRef] [Green Version]
  72. Paiva, R.C.D.; Collischonn, W.; Bonnet, M.-P.; de Gonçalves, L.G.G.; Calmant, S.; Getirana, A.; da Santos Silva, J. Assimilating in situ and radar altimetry data into a large-scale hydrologic-hydrodynamic model for streamflow forecast in the Amazon. Hydrol Earth Syst. Sci. 2013, 10, 2879–2925. [Google Scholar]
  73. Hossain, F.; Maswood, M.; Siddique-E-Akbor, A.H.; Yigzaw, W.; Mazumdar, L.C.; Ahmed, T.; Hossain, M.; Shah-Newaz, S.M.; Limaye, A.; Lee, H.; et al. A promising radar altimetry satellite system for operational flood forecasting in flood-prone Bangladesh. IEEE Geosci. Remote Sens. Mag. 2014, 2, 27–36. [Google Scholar] [CrossRef]
  74. Schneider, R.; Godiksen, P.N.; Ridler, M.-E.; Villadsen, H.; Madsen, H.; Bauer-Gottwein, P. Combining Envisat type and CryoSat-2 altimetry to inform hydrodynamic models. In Proceedings Living Planet Symposium 2016; Ouwehand, L., Ed.; ESA Special Publications SP-740; European Space Agency: Paris, France, 2016. [Google Scholar]
  75. O’Loughlin, F.; Trigg, M.A.; Schumann, G.J.P.; Bates, P.D. Hydraulic characterization of the middle reach of the Congo River. Water Resour. Res. 2013, 49, 5059–5070. [Google Scholar] [CrossRef]
  76. Cotton, P.D.; Andersen, O.; Stenseng, L.; Boy, F.; Cancet, M.; Cipollini, P.; Gommenginger, C.; Dinardo, S.; Egido, A.; Fernandes, M.J.; et al. Improved Oceanographic Measurements from SAR Altimetry: Results and Scientific Roadmap from ESA Cryosat Plus for Oceans Project; Special Publication ESA SP 2016; European Space Agency: Paris, France, 2016. [Google Scholar]
  77. Maillard, P.; Bercher, N.; Calmant, S. New processing approaches on the retrieval of water levels in Envisat and SARAL radar altimetry over rivers: A case study of the São Francisco River, Brazil. Remote Sens. Environ. 2015, 156, 226–241. [Google Scholar] [CrossRef]
  78. Yamazaki, D.; O’Loughlin, F.; Trigg, M.A.; Miller, Z.F.; Pavelsky, T.M.; Bates, P.D. Development of the Global Width Database for Large Rivers. Water Resour. Res. 2014, 50, 3467–3480. [Google Scholar] [CrossRef] [Green Version]
  79. Andreadis, K.M.; Schumann, G.J.P.; Pavelsky, T. A simple global river bankfull width and depth database. Water Resour. Res. 2013, 49, 7164–7168. [Google Scholar] [CrossRef]
  80. Biancamaria, S.; Lettenmaier, D.P.; Pavelsky, T.M. The SWOT Mission and Its Capabilities for Land Hydrology. Surv. Geophys. 2016, 37, 307–337. [Google Scholar] [CrossRef]
  81. Biancamaria, S.; Durand, M.; Andreadis, K.M.; Bates, P.D.; Boone, A.; Mognard, N.M.; Rodríguez, E.; Alsdorf, D.E.; Lettenmaier, D.P.; Clark, E.A. Assimilation of virtual wide swath altimetry to improve Arctic river modeling. Remote Sens. Environ. 2011, 115, 373–381. [Google Scholar] [CrossRef] [Green Version]
  82. Yoon, Y.; Durand, M.; Merry, C.J.; Clark, E.A.; Andreadis, K.M.; Alsdorf, D.E. Estimating river bathymetry from data assimilation of synthetic SWOT measurements. J. Hydrol. 2012, 464–465, 363–375. [Google Scholar] [CrossRef]
  83. Durand, M.; Neal, J.; Rodríguez, E.; Andreadis, K.M.; Smith, L.C.; Yoon, Y. Estimating reach-averaged discharge for the River Severn from measurements of river water surface elevation and slope. J. Hydrol. 2014, 511, 92–104. [Google Scholar] [CrossRef]
  84. Garambois, P.-A.; Monnier, J. Inference of effective river properties from remotely sensed observations of water surface. Adv. Water Resour. 2015, 79, 103–120. [Google Scholar] [CrossRef]
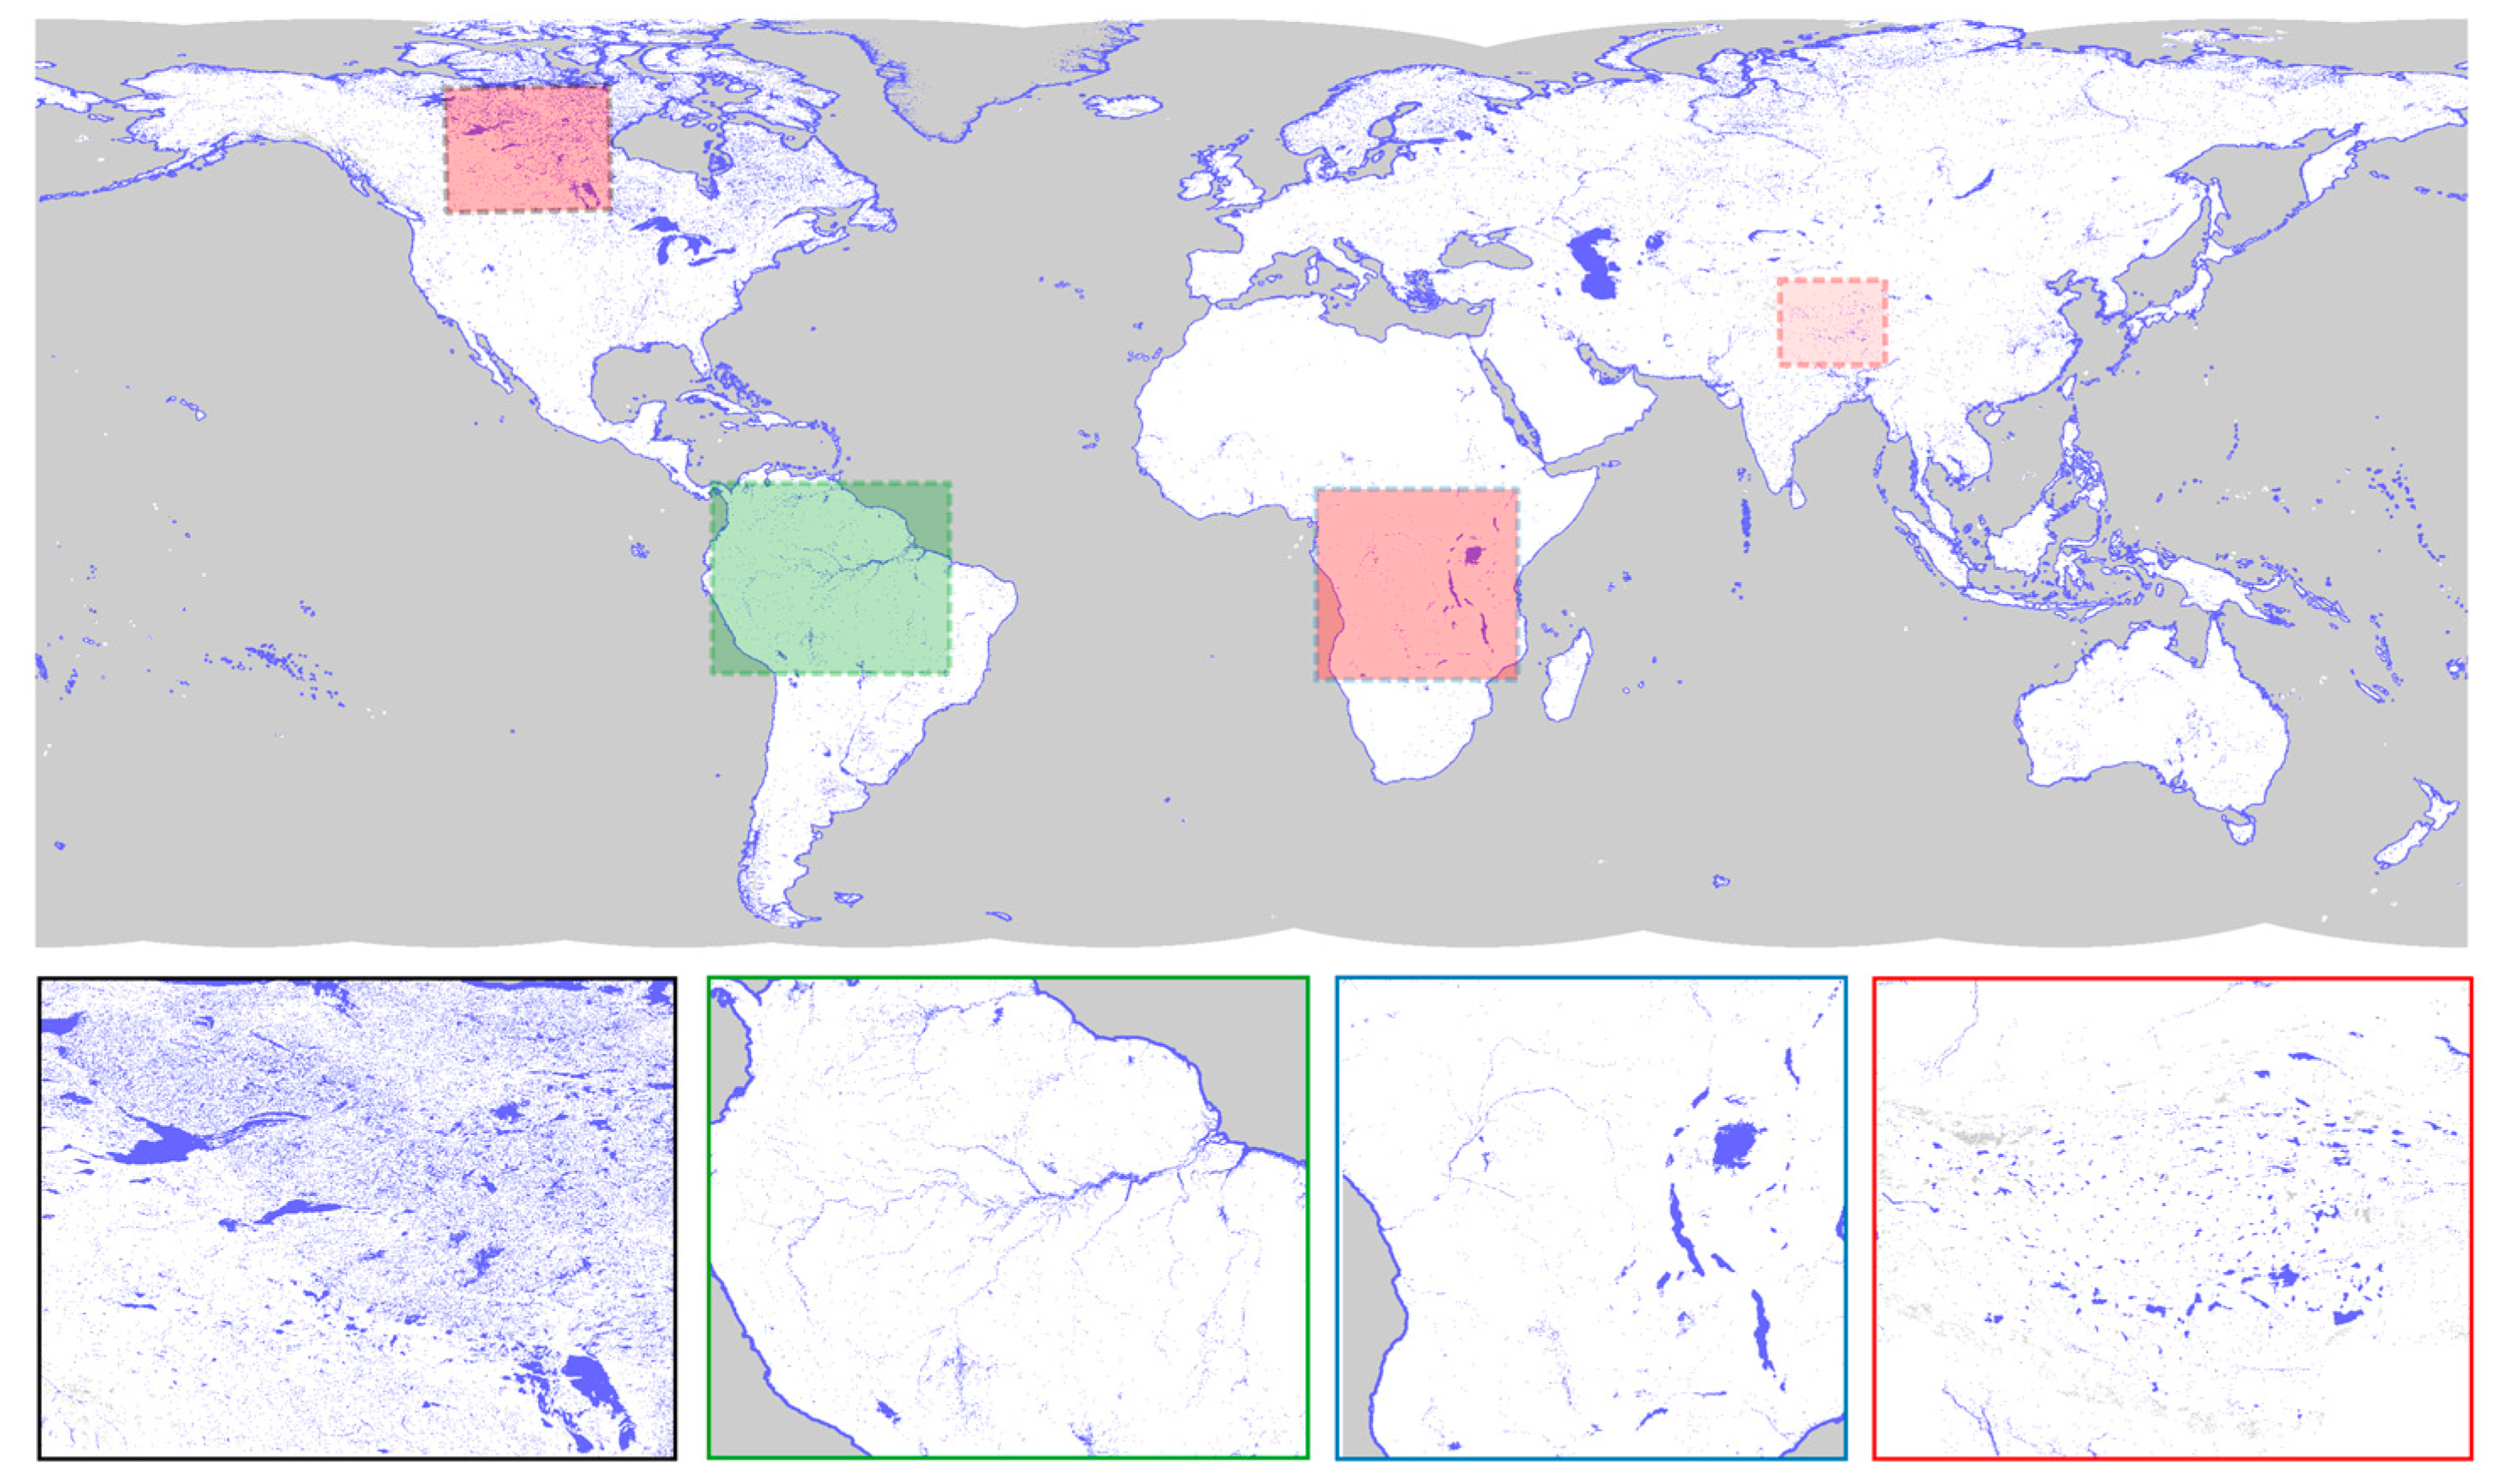
Figure 1. Global surface water distribution. (Zoom-in figures at bottom are from Kivalliq Region in Canada, Amazon River basin, source region of Congo river basin, and Tibetan Plateau, respectively. Data source: Global Surface Water Explorer [9]).
Water 09 00211 g001
Figure 2. Altimetry principle of water level measurement (Modified from [35]).
Water 09 00211 g002
Figure 3. Illustration of waveform showing the nominal tracking point and retracking point.
Water 09 00211 g003
Figure 4. Geographical mode mask 3.8 (synthetic aperture radar (SAR) mode in red, SARIn mode in blue, all remaining areas in low resolution mode (LRM) [42]).
Water 09 00211 g004
Figure 5. Ground track patterns. Inset: Ground tracks of CryoSat-2 over a period of 16 days. Main: Ground tracks of different altimetry missions over the Assam Valley with the Brahmaputra River in South Asia. Jason-1/2/3 have a repeat cycle of 10 days, Sentinel-3A and B of 27 days, and Envisat, ERS-2 and SARAL/AltiKa of 35 days. CryoSat-2 has a full repeat cycle of 369 days.
Water 09 00211 g005
Figure 6. Comparison of a conventional pulse-limited radar altimeter and a SAR altimeter: (a,b) footprint side view; (c,d) footprint plan view; and (e,f) waveform. Adapted from [47].
Water 09 00211 g006
Figure 7. Flow chart of CryoSat-2 data processing.
Water 09 00211 g007
Figure 8. CryoSat-2 ground tracks over Taro Co in the Tibetan Plateau. Upper: ground tracks; bottom: measurements from track 18942, indicated by red dots on the left figure.
Water 09 00211 g008
Figure 9. Illustration of lake storage and storage change calculation.
Water 09 00211 g009
Figure 10. CryoSat-2 SARIn data over the Brahmaputra River in the Assam Valley. The map displays data for 2014, while the graph shows all data from the river stretch in the map view for 2010 to 2015, displaying the river water level profile observed by CryoSat-2.
Water 09 00211 g010
Figure 11. Map of lakes in the Tibetan Plateau seen by Envisat/SARAL ((A), in red) and CryoSat-2 (SARIn mode from 2010 to 2016 in black); (C) Zoom-in of the red rectangle in (B); (D) CryoSat-2 measurements of four lakes which have surface areas between 10 to 420 km2.
Water 09 00211 g011
Table 1. Summary of satellite altimetry missions.
SatelliteAgencyPeriodAltitude (km)AltimeterFrequency UsedRepetitivity (Day)Equatorial Inter-Track Distance (km)
SkylabNASAMay 1973–February 1974435S193Ku-band
GEOS 3NASAApril 1975–July 1979845ALTKu and C-band
SeaSatNASAJuly–October 1978800ALTKu-band17
GeosatUS NavyOctober 1985–January 1990800Ku-band17
ERS-1ESAJuly 1991–March 2000785RAKu-band3580
Topex/PoseidonNASA/CNESSeptember 1992–October 20051336PoseidonKu and C-band10315
ERS-2ESAApril 1995–July 2011785RAKu-band3580
GFOUS Navy/NOAAFebruary 1998–October 2008800GFO-RAKu-band17165
Jason-1CNES/NASADecember 2001–June 20131336Poseidon-2Ku and C-band10315
EnvisatESAMarch 2002–April 2012800RA-2Ku and S-band3580
OSTM/Jason-2CNES/NASA/Eumetsat/NOAAJun 2008–present1336Poseidon-3Ku and C-band10315
CryoSat-2ESAApril 2010–present720SIRALKu-band3697.5
HY-2ChinaAugust 2011–present971Ku and C-band14, 168
SaralISRO/CNESFebruary 2013–present800AltiKaKa-band3580
Jason-3CNES/NASA/Eumetsat/NOAAJanuary 2016–present1336Poseidon-3BKu and C-band10315
Sentinel-3AESAFebruary 2016–present814SRALKu and C-band27104