1. Introduction
The negative impacts of climate change on urban water infrastructure have been an essential part of an intensive scientific discussion over the last couple of decades [
1,
2]. The Intergovernmental Panel on Climate Change (IPCC) reported an increase in the frequency of intense rainfall as a consequence of global climate change, which will continue to alter hydrologic regimes across the world [
3,
4,
5]. This increasing intensity of extreme rainfall combined with increasing urbanization (resulting in more impervious areas) are making conventional drainage systems more vulnerable due to increased peak flow volumes and shorter times to peak flow. Recent studies have pointed out that increased intense rainfall events and increased urbanization have increased the risk of widespread urban flooding and sewage overflow hazards [
6,
7,
8]. It was reported that short duration intense rainfall events (with durations of 12, 18, 30 min and 1 h) have become more frequent in recent years [
9]. This paper focuses on the effects of this increasing intensity of extreme rainfall events on the performance of the sewer network and presents a generalised framework for assessing and mitigating the impact of such rainfall events on the sanitary sewer network.
Intense rainfall increases flow into the sewer system and this increased portion of flow that occurs during and after a rainfall event is called Rainfall Derived Infiltration and Inflow (RDII). Sanitary sewers are designed to accommodate a certain amount of inflow and infiltration. During intense rainfall events, this amount of inflow and infiltration is exceeded and hence may lead to Sanitary Sewer Overflows (SSOs) [
10,
11,
12]. The SSOs occur when the sewage overflows from the manholes to the surface level due to sewers running under pressure, while manhole surcharge is a situation when sewage rises in the manhole shaft but does not overflow as in the case of SSOs. These SSOs carry inherent risks to human health as well as to the environment. It is necessary to have a better understanding about the sources of RDII in planning a sewer system and propose mitigation strategies to reduce SSOs. As the name indicates, RDII is made up of stormwater entering the sanitary sewer system in terms of inflow as well as rainfall derived infiltration. Inflow is stormwater which enters the sewer pipes through direct connections: roof downpipes which are illegally connected to the sanitary sewers, broken manhole covers and cross-connections between stormwater and sewer pipes. On the other hand, infiltration is the runoff that filters through the soil and then enters the sewer network through cracked pipe sections, defective joints and damaged manhole walls. It can also occur due to rise in the water table.
This study presents a generalised framework for assessing and mitigating the impacts of intense rainfall on the sanitary sewer network. The first part of this framework aims to evaluate the possible impacts of short duration intense rainfall on the performance of the sanitary sewer system. This will include determining RDII flows and conducting hydraulic modelling of a sewer system for performance assessment. The performance of the sewer network is assessed based on various indicators that were used to quantify the SSOs and manhole surcharges. These indicators will help to investigate the hydraulic performance of the existing sewer system under short duration intense rainfall events. The second part of this framework proposes sustainable mitigation strategies for controlling the SSO and surcharge problems. Earlier studies have recommended the implementation of Water Sensitive Urban Design (WSUD) strategies as sustainable and cost-effective approaches for managing stormwater runoff [
13,
14,
15]. There are different types of sustainable WSUD strategies available in the literature: rainwater tanks, rain gardens, bio-retention cells, porous pavements, green roofs, infiltration trenches and vegetative swales [
16,
17]. These techniques are also known with different terminologies: low impact development (LID), sustainable urban drainage system (SUDS) and, most recently, green infrastructure [
18,
19]. These WSUD strategies can also reduce SSOs and surcharges by controlling excess stormwater runoff entering the sewer network in terms of RDII. However, there are few studies about the benefits of WSUD for reducing sewer overflows as these strategies are commonly used for stormwater management. Common approaches of SSO mitigation focus largely on structural actions and are well documented in literature [
20,
21,
22,
23]. Hence, the framework presented in this study includes a detailed modelling of WSUD approaches for reducing rainfall induced sewer overflows. Such a framework will benefit the water industry as it will improve the sustainability of the sewer network.
Furthermore, the generalised framework proposed in this study has been applied for a case study residential catchment in Melbourne, Australia. However, this paper covers only the first part of the framework. This includes the detailed hydraulic modelling to analyse the performance of the case study sewer network during a wet and a dry year. The chosen wet year was 2010, which was identified by the Australian Bureau of Meteorology (BoM) as the third wettest year on record for Australia [
24]. For the case study area, the total annual rainfall in 2010 was 681 mm, which was well above the annual mean rainfall of 588 mm. Such an analysis will help to provide cost-effective remedial solutions for controlling existing SSO and surcharge problems. This will help the relevant water authorities to take adequate measures to minimize the environmental and human health impacts at locations identified to be at risk. The number of sewer overflows and surcharges at those locations are expected to increase because short duration intense rainfall events are becoming more frequent as a consequence of climate change [
9]. The second part of the proposed framework will be applied at a later stage.
2. Proposed Framework
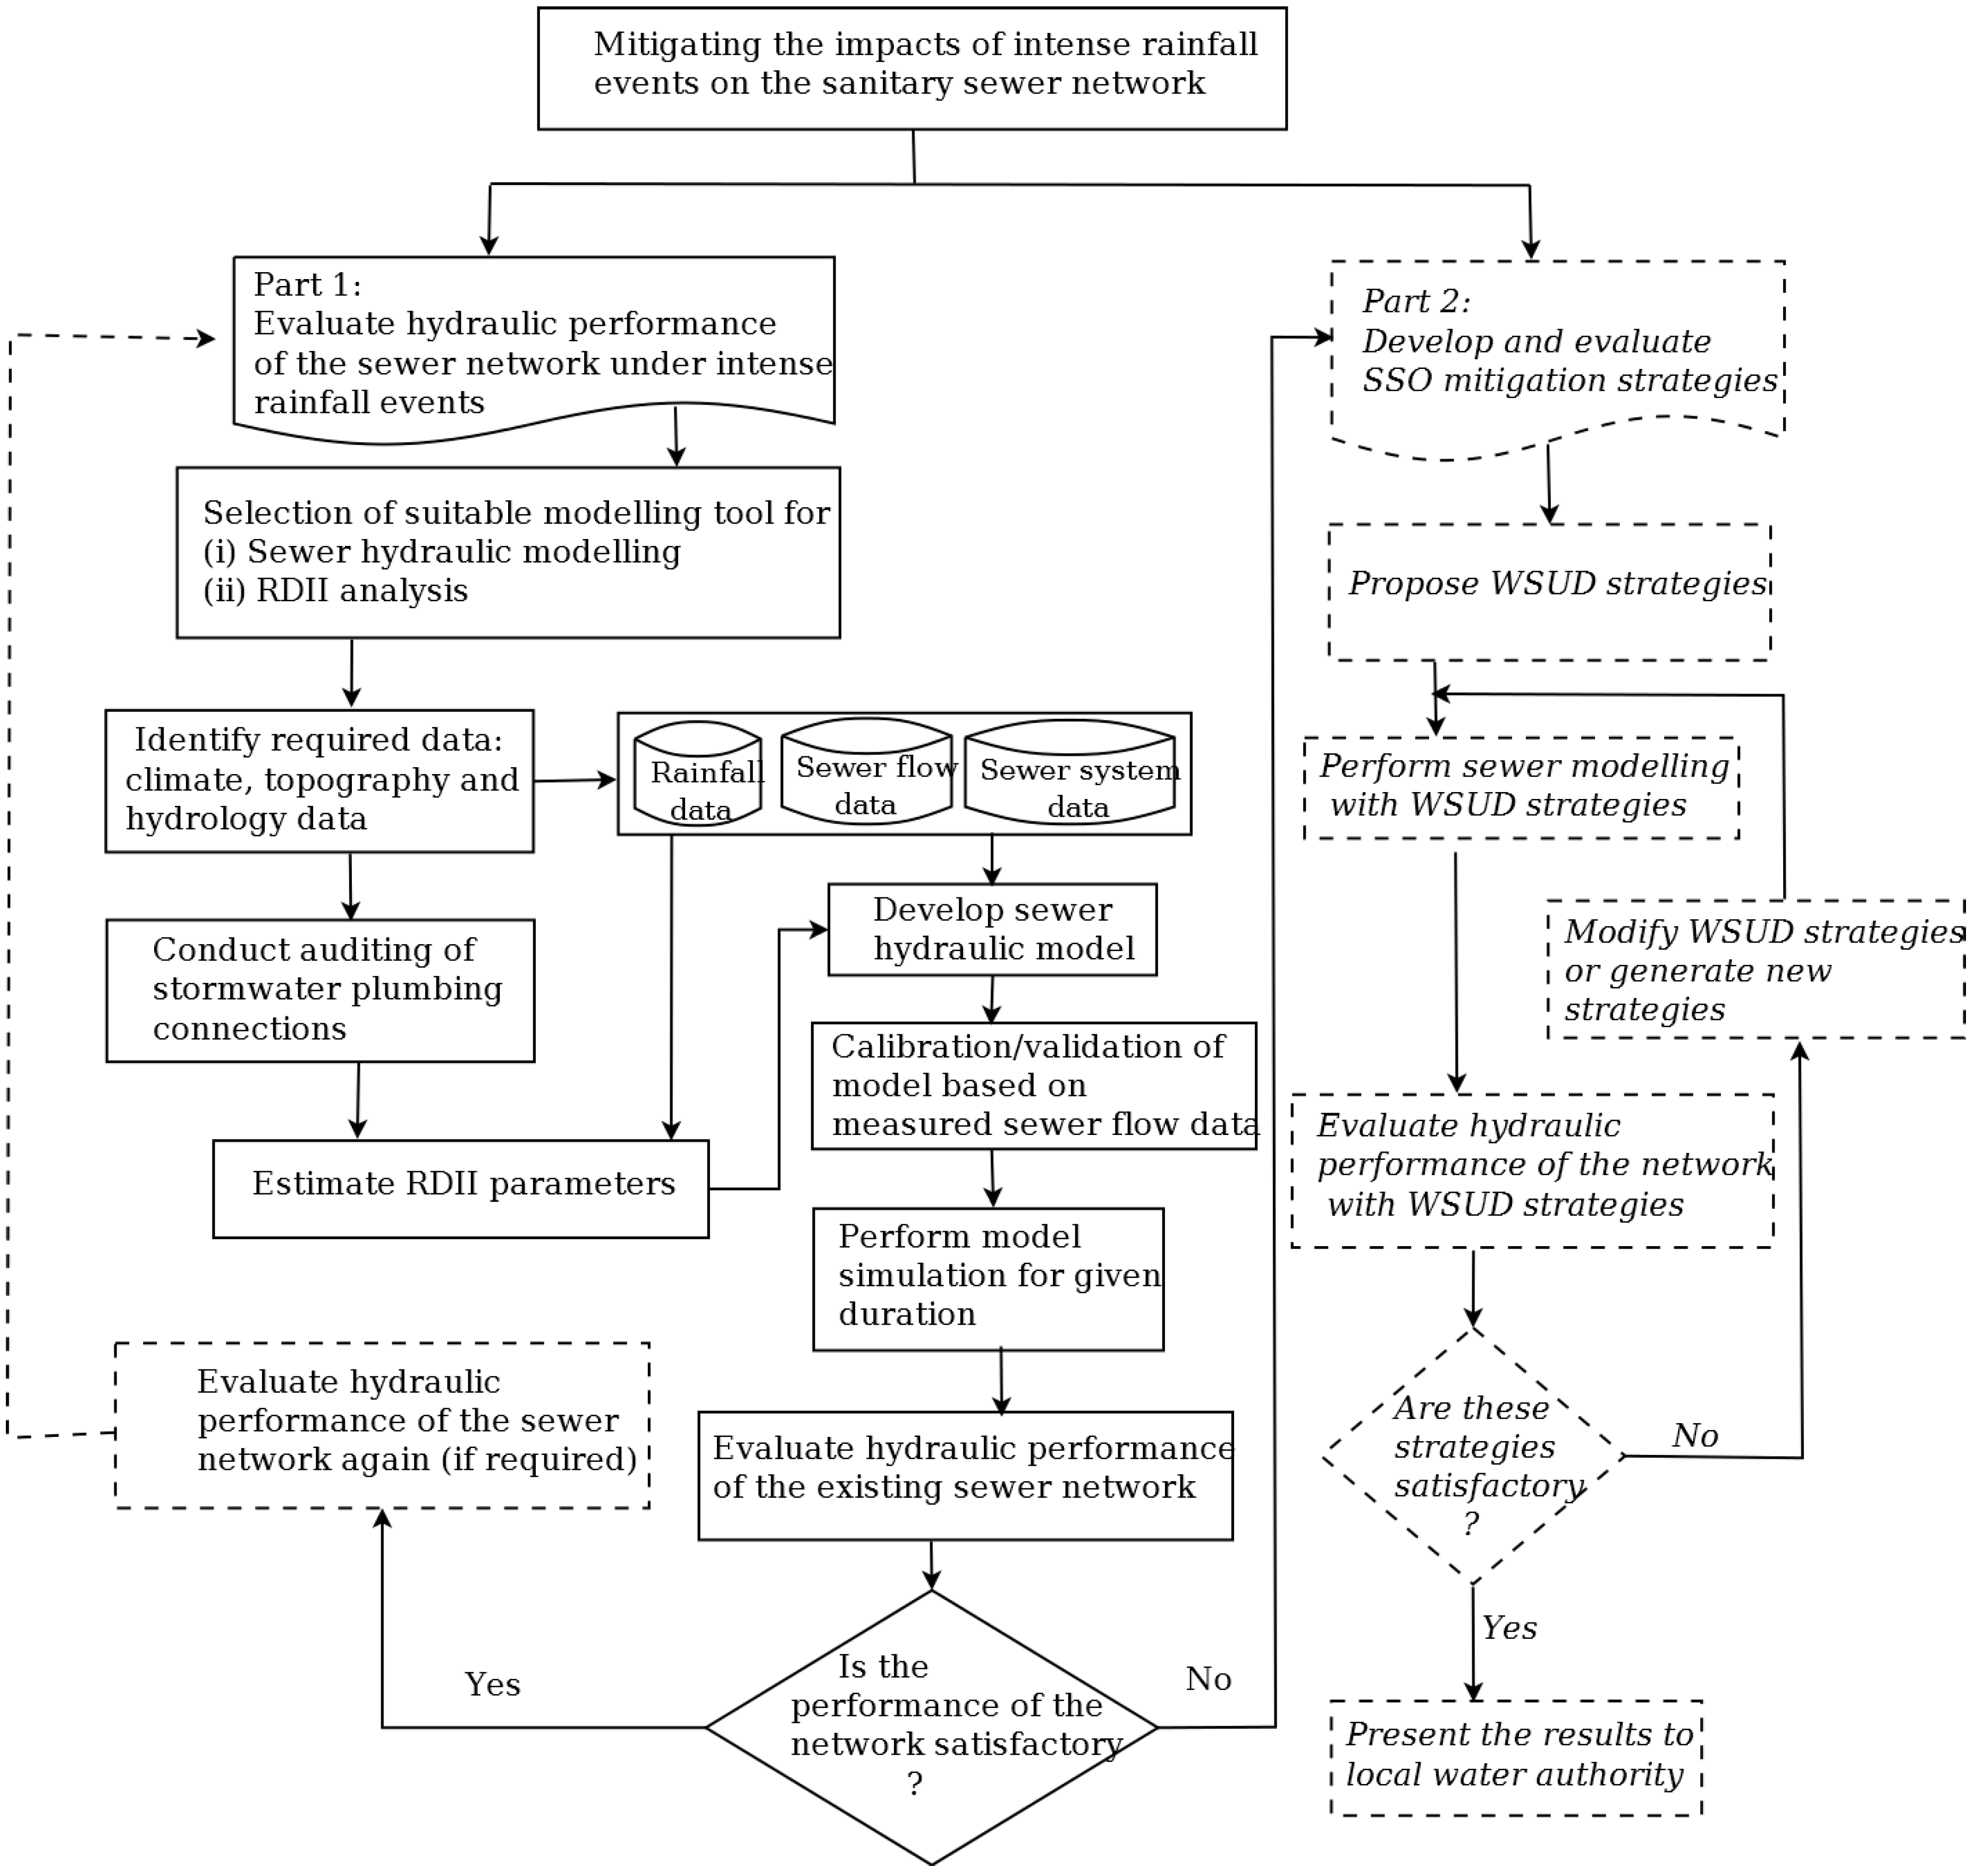
Figure 1 presents the generalised framework used for assessing and mitigating the impacts of short duration intense rainfall on the sewer network.
The proposed framework is divided into two parts. The first part evaluates the hydraulic performance of the existing sewer network in terms of SSOs and surcharges. The second part proposes sustainable mitigation strategies for reducing the sewer overflows.
2.1. Part 1: Evaluation of the Hydraulic Performance of the Sewer Network
The modelling steps involved in evaluating the performance of the sewer system are described in the following sections:
Selection of suitable modelling tools—Two modelling tools are required (1) Model for hydraulic evaluation of the sewer network and (2) Model to evaluate RDII parameters.
PCSWMM which uses Stormwater Management Model (SWMM) as its basic engine was used in this study for the sewer hydraulic modelling. PCSWMM (CHI software) was selected because EPA SWMM is a widely used platform to investigate sewer overflows [
25]. PCSWMM is used to simulate sewer flows and compute surcharge and overflow through manholes. It also provides hydrographs at each surcharged manhole including duration and surcharge depth, which can be used to assess the hydraulic performance of the existing sewer system [
26,
27].
The Sanitary Sewer Overflow Analysis and Planning (SSOAP) Toolbox [
28] has been selected to estimate RDII parameters as input into PCSWMM. The SSOAP software applies the synthetic unit hydrograph method (SUH) to estimate the RDII parameters. This procedure is recommended in the literature as accurate and the industry standard methodology to quantify RDII parameters [
11,
29].
Data collection—Data required for the hydraulic performance analysis are rainfall, measured sewer flow at point of interest and physical sewer system network geometry and layout. The SSOAP toolbox requires rainfall and measured sewer flow to estimate RDII flows. The sewer system data are needed for the hydraulic modelling for the selected case study area.
Auditing of households stormwater plumbing connections—The connections of properties in the study area should be checked (if possible) for any cross-connections between the stormwater plumbing and existing sewer pipes. This is because the inflow component of the RDII depends on the stormwater that enters the sewer network through direct connections and it plays a significant role in generating peak RDII flows.
RDII parameters estimation—The SSOAP toolbox identifies the unit hydrograph parameters or the RDII parameters (R, T, K) through a systematic analysis of measured sewer flow data and rainfall data. This method contains three unit hydrographs and each unit hydrograph is characterized by a set of R, T and K parameters. Here, R parameter represents the fraction of rainfall volume that enters the sanitary sewer system as RDII during a rainfall event. T parameter is the time from the onset of rainfall to the peak of the RDII hydrograph in hours, and K parameter represents the ratio of time to recession of the RDII hydrograph to the time to peak; this analysis is undertaken in two steps. In the first step, the measured wastewater flow is analysed to generate the RDII hydrograph which is then used (in the second step) to identify the RDII parameters (R, T, K).
Developing a hydraulic model of the sewer network—The rainfall, flow, sewer system data and RDII parameters are used as the input to the sewer hydraulic model to estimate the RDII flows. After assigning the input data to the model, the next step is to divide the total catchment area into the sub-catchment areas to prepare a hydrologic model for a sanitary sewer system and divert wastewater flows to various loading point of sewer system. Geographic Information System (GIS) has been used to delineate the sewer-shed area into small sub-catchments leading to the flow monitoring locations (manholes). Here, each sub-catchment area is associated with a flow loading point (i.e., manhole) in the developed sewer network model.
Model calibration and validation—The successful application of a model depends on how well it is calibrated. During calibration, model parameters are adjusted within their physically meaningful ranges until the simulated flow matches the observed flow. Validation is then conducted to confirm that the calibrated parameters provide a consistent prediction. Model calibration and validation can be conducted using peak rainfall events from the available data. Sewer system performance evaluation—After calibration and validation, the next step is to perform a continuous simulation of the sewer network for a given duration. This simulation will help to assess the impacts of intense rainfall events on the performance of the sewer network in terms of SSOs and surcharges. In addition, a set of performance indicators needs to be developed for evaluating the performance of the sewer system. The performance indicators that could be selected can include number of overflowing manholes, number of overflow days, total overflow volume, peak overflow rates, manhole with maximum volume of overflow, manhole with maximum hours flooded, number of surcharging manholes and manhole with maximum hours surcharged. Based on the local conditions, other performance indicators can also be selected. Earlier studies such as [
30,
31] have recommended performance indicators as assessment tools because simulation results do not adequately reflect the sewer network performance. Moreover, these indicators can also be used for describing and comparing the possible impacts of intense rainfall on the sewer system. Mitigation strategies are proposed based on the results of these performance indicators. If the system experiences SSO and surcharges, the next step is to develop mitigation strategies for controlling these problems.
2.2. Part 2: Define Optimal Strategies for Sewer Overflow Mitigation
In the second part of this framework, mitigation strategies are developed and assessed. These strategies are selected based on their sustainability and cost efficiency. WSUD strategies have shown to be sustainable, innovative and cost-effective approaches for controlling stormwater runoff. These strategies can also reduce sewer overflow volume and peak overflow rate by capturing excess stormwater runoff entering the sewer network during intense rainfall events [
17,
32,
33,
34,
35,
36,
37]. The steps involved in the modelling of WSUD strategies for reducing sewer overflows are presented in brief below.
Selection of suitable WSUD approaches based on literature review and discussion with local water professionals.
Development of WSUD strategies for sewer modelling.
Perform sewer hydraulic modelling with the developed strategies.
Evaluation of hydraulic performance of the existing sewer network with WSUD strategies.
Check if the proposed strategies meet the desired objectives. If the proposed strategies fail to provide satisfactory results, then modify or generate new strategies.
This paper presents the detailed modelling results for the first part of the framework and only a brief discussion is provided for the second part. Another publication will present the detailed outcomes of modelling for the second part of the framework. The first part of the framework has been applied to a residential catchment in Melbourne, which is described in the next section.
3. Case Study Area
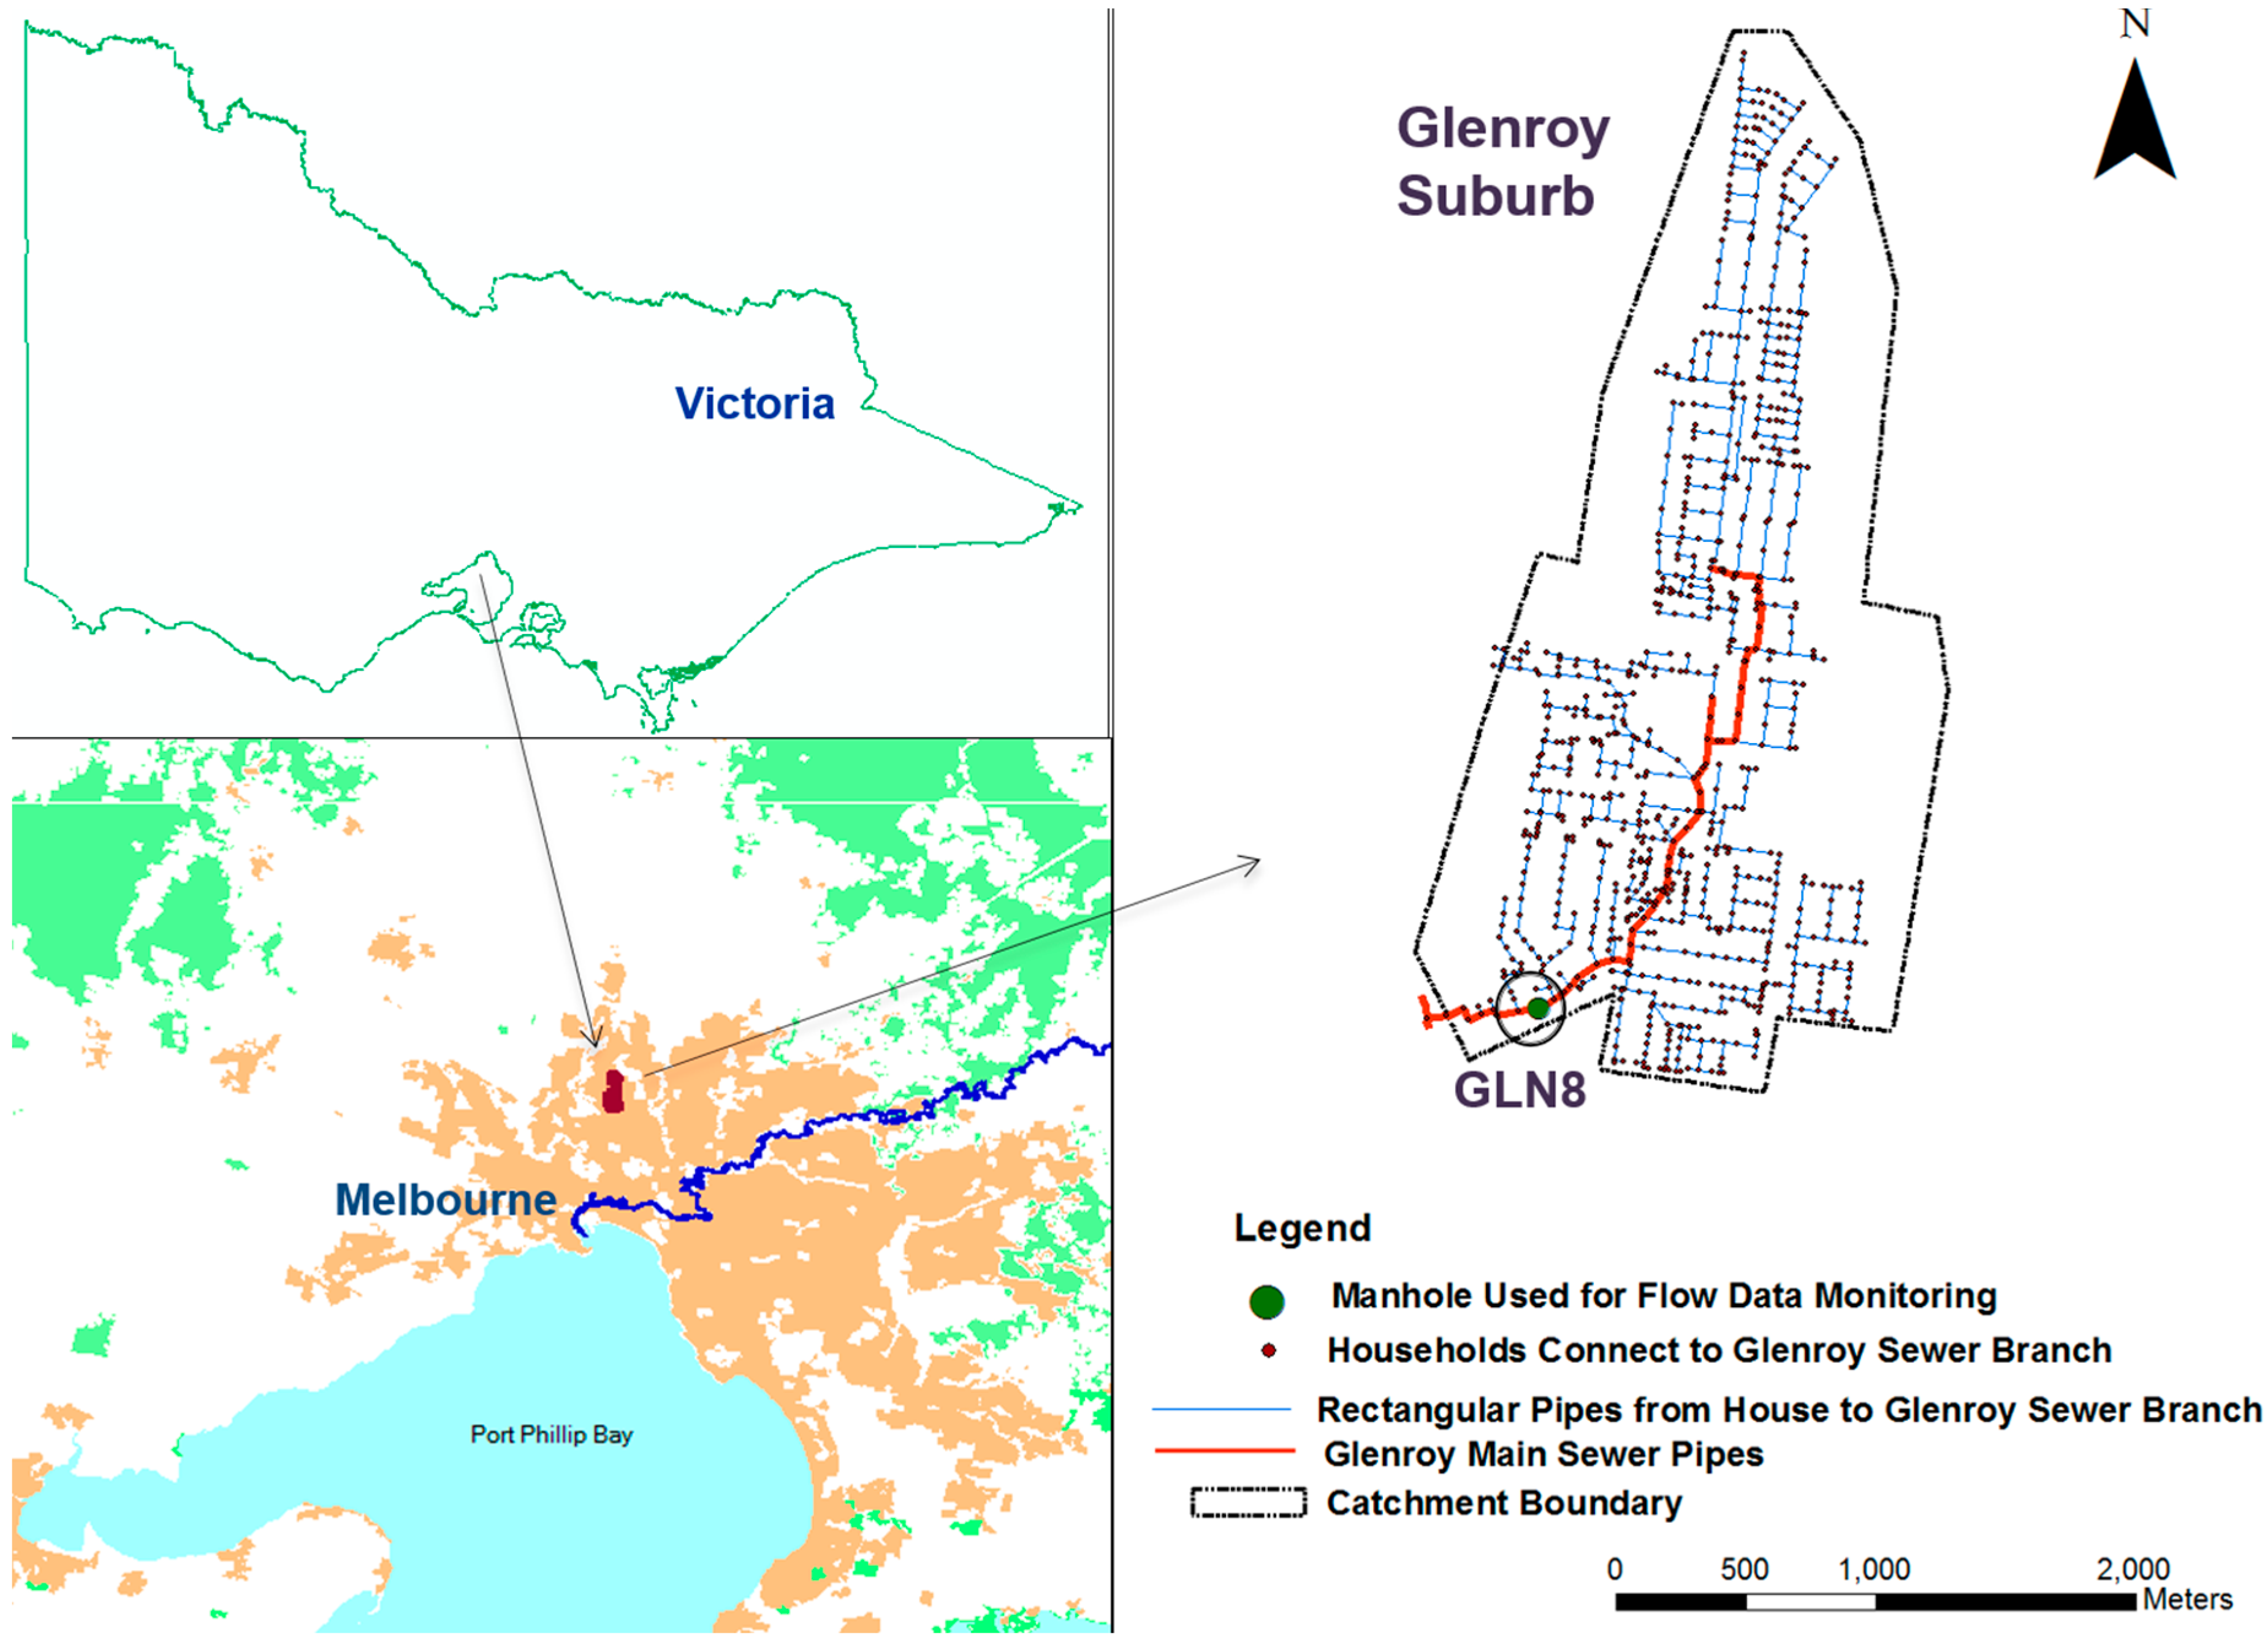
The selected case study area was a residential catchment in Glenroy (a suburb in northern Melbourne), which comes under the jurisdiction of Yarra Valley Water, a water retailer servicing 1.6 million people. The study area is located within the larger Pascoe Vale catchment and consists mainly of residential households. The study area is serviced by a separate sewer and stormwater drainage system. The total contributing sewershed area of the catchment is 6.88 km
2 and has 3750 sewer connections. The length of the main sewer pipe is approximately 3.2 km and the pipe material is concrete. A flow meter was temporarily installed in the sewer network at a downstream manhole (named GLN8) (Yarra Valley Water sewer network identification number) for flow data collection from the whole catchment. The location of the study area and the layout of the Glenroy sewer network indicating the main sewer pipe and the location of the flow meter are shown in
Figure 2.
At the GLN8 manhole, flow data was measured at a six-minute time-step during the period November–December of 2010. Flow was measured continuously at the manhole using a Sigma 940 flow meter. This flow meter is widely used for long-term flow monitoring and sanitary sewer evaluation studies. It has high accuracy levels of data measurement in low-flow, full-pipe or reversed-flow conditions [
38]. Six-minute time-step rainfall data was obtained from the Bureau of Meteorology, Australia, for a nearby rain gauge station (Essendon Airport Melbourne; station no 086038). There were several intense rainfall events in 2010 and a number of them occurred during the months of November and December. Few events occurred on 8 December 2010 (23.4 mm of rainfall occurred on that day) with 9.8 mm falling in an interval of 18 min (from 9.48 a.m. to 10.06 a.m.) with an Average Recurrence Interval (ARI) of about 1.5 years. The ARIs were calculated using the 2016 Intensity–Frequency–Duration (IFD) design rainfalls that are provided by the Bureau of Meteorology for use in conjunction with the 2016 edition of Australian Rainfall and Runoff (ARR) [
39]. This intense rainfall over a short duration had caused the downstream manhole GLN8 to overflow (which was observed during the flow measurements).
4. Sewer System Hydraulic Performance Assessment
The proposed framework (presented in
Figure 1) for assessing the hydraulic performance of the sewer network has been systematically implemented for the case study sewershed area. The detailed modelling of the hydraulic performance analysis is described in the following sections.
4.1. Data Collection
Climate, topography, and hydrology data are needed for this hydraulic performance assessment. The data used for this study were collected from various Australian government authorities. The climate data was collected from the Bureau of Meteorology. The GIS data for the catchment and the sewer network data were collected from Yarra Valley Water. All datasets used for the sewer performance analysis are presented in
Table 1.
The investigation of stormwater plumbing connections at the properties were acquired from discussions with the water utility (YVW) and were not performed for this study due to the budgetary and time constraints. However, the utility is planning to conduct auditing of household stormwater connections in some other catchment.
4.2. RDII Analysis
To quantify RDII flow, the SSOAP toolbox determines the RDII hydrograph parameters (R, T, K) through unit hydrograph curve fitting analysis. As stated earlier, this analysis is undertaken in two steps. These two steps of the analysis are presented in the following sub-sections and a detailed description can be found in [
26].
4.2.1. Hydrograph Decomposition
The SSOAP toolbox applies the Hydrograph Decomposition method to decompose the measured wastewater flows into Dry Weather Flow (DWF) and RDII components. A description of the steps involved in the hydrograph decomposition is given below.
Step 1—Dry Weather Flow analysis: The DWF analysis determines the typical characteristics of DWF diurnal patterns in each flow meter location.
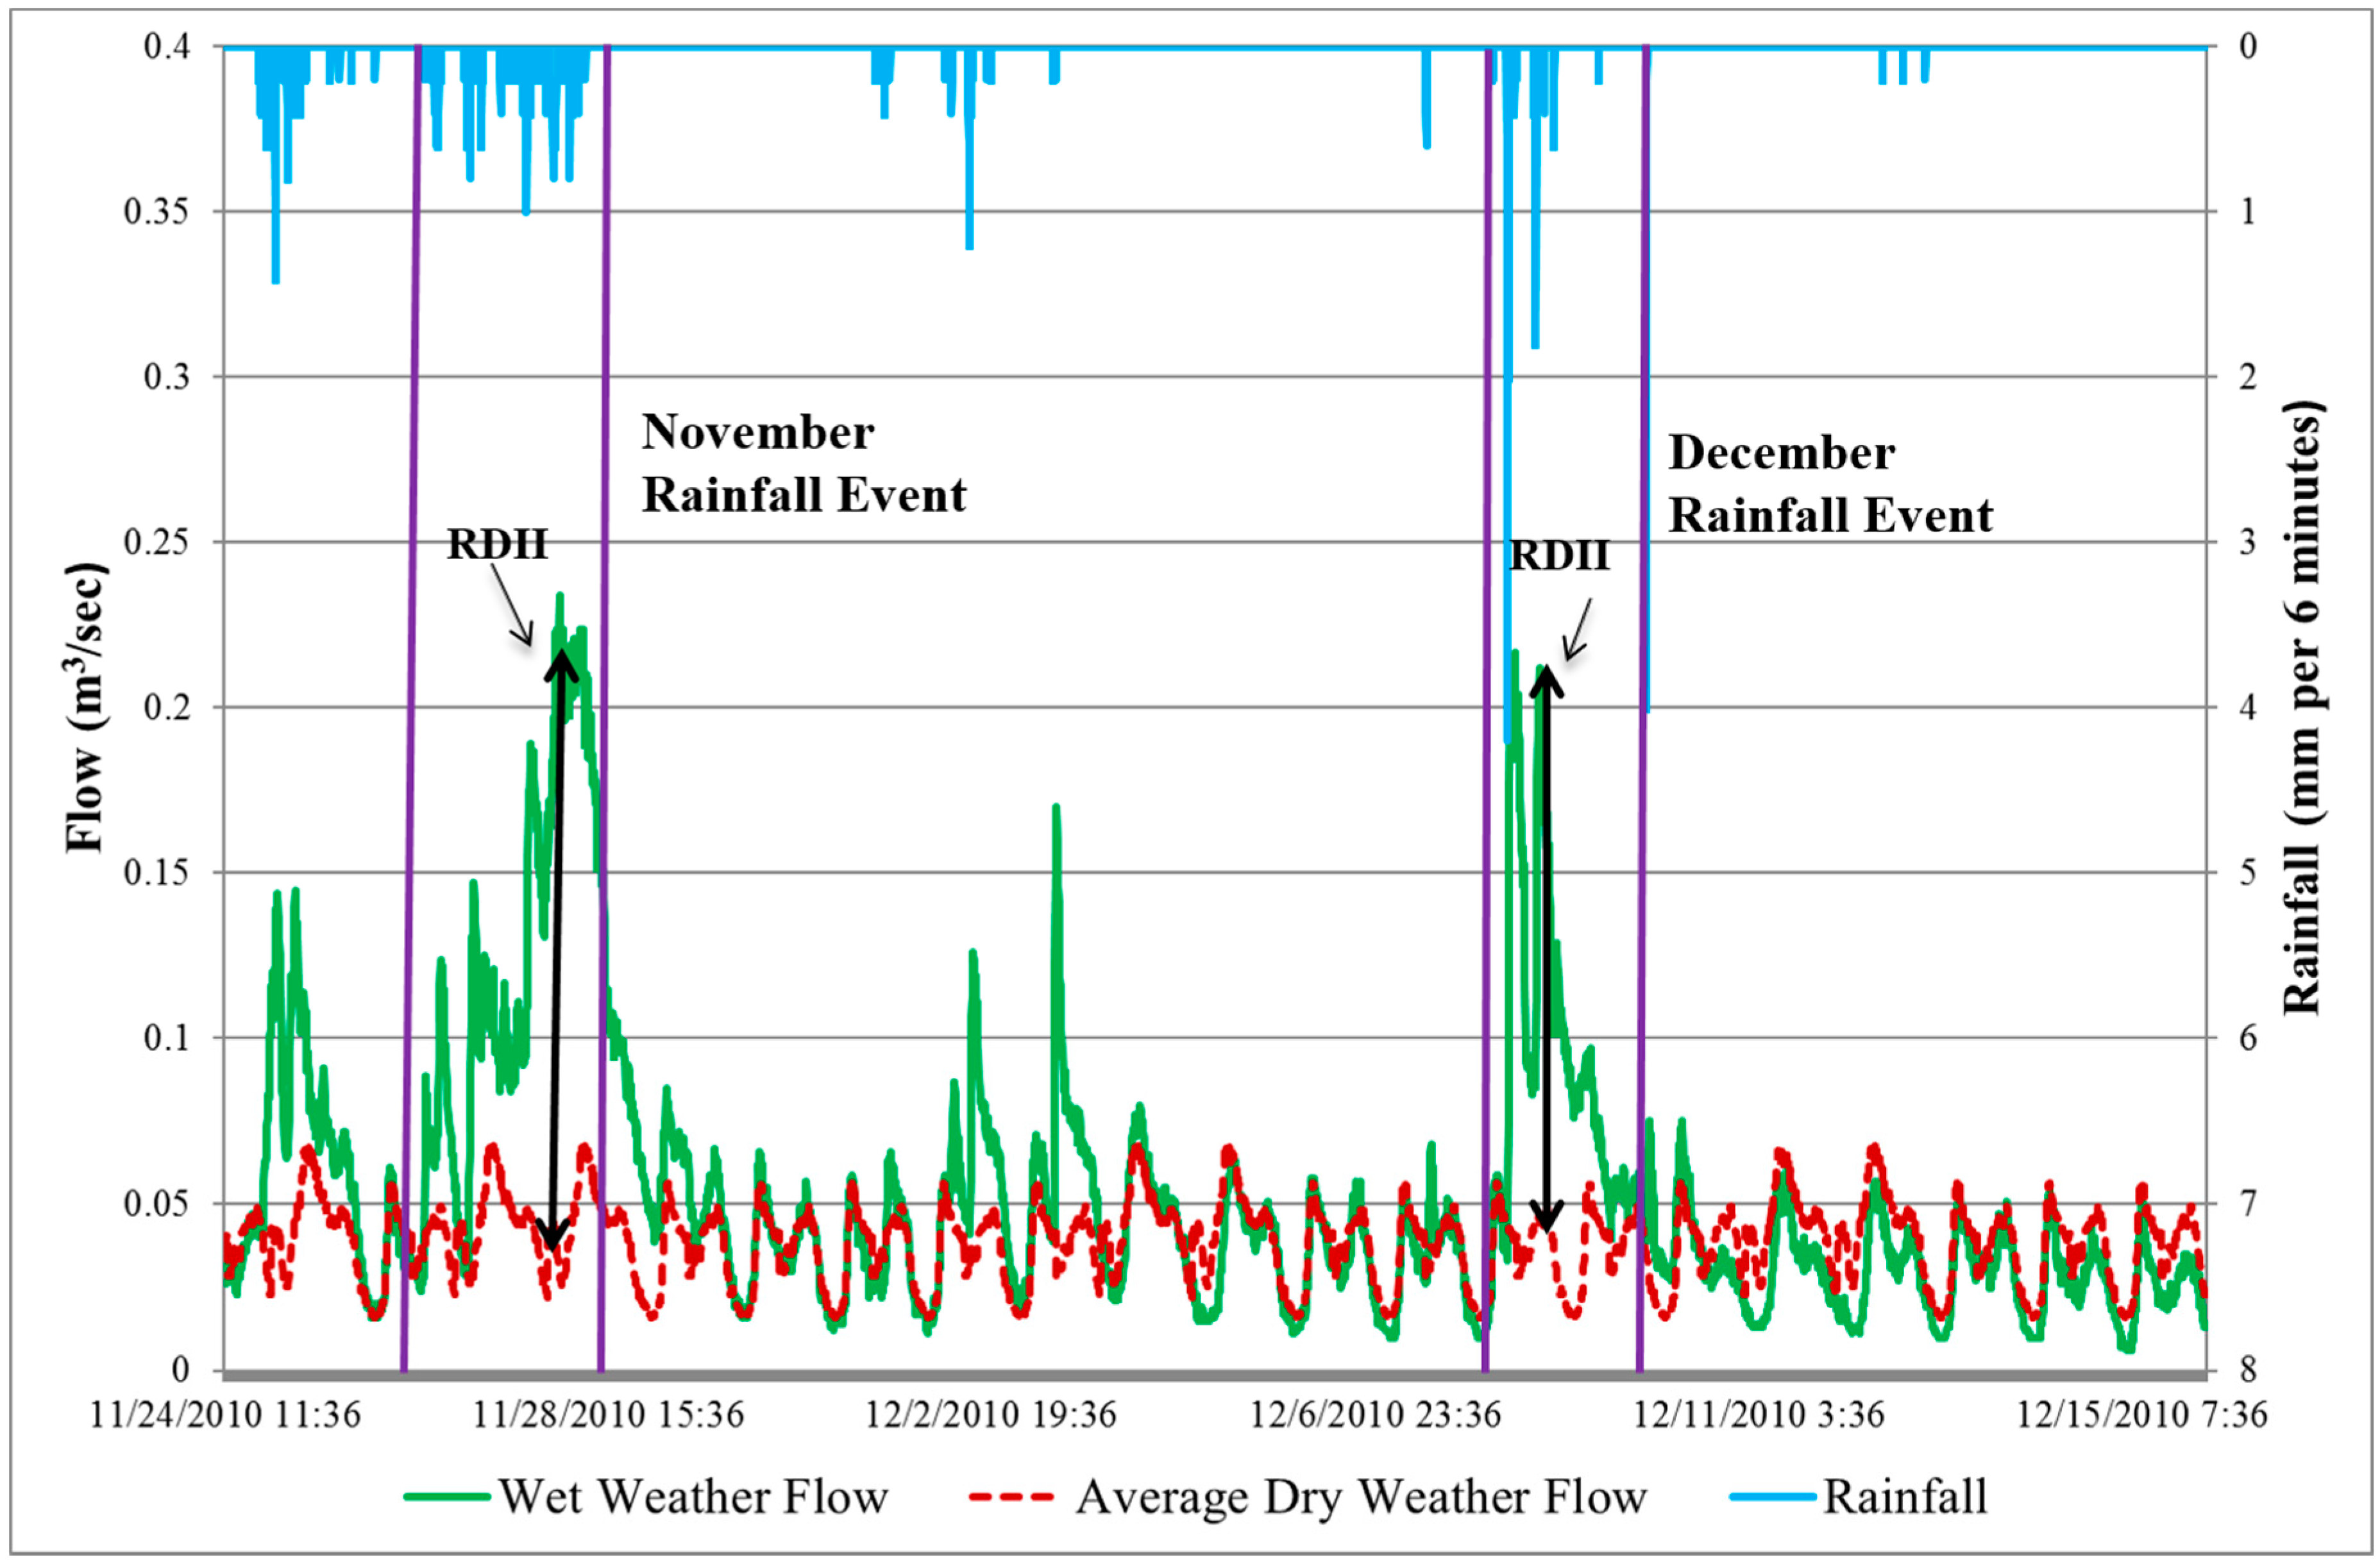
Step 2—Wet Weather Flow analysis: After computing the average DWF hydrograph, the model performs wet weather flow (WWF) analysis to calculate the RDII hydrograph for each rainfall event. WWF is the combination of DWF (identified in Step 1 above) and RDII. The latter component for each rainfall event is calculated by deducting the average DWF hydrograph from the total WWF hydrograph (which is the measured flow). This difference is the rainfall induced RDII volume entering the sewer network during the rainfall event.
Figure 3 shows the RDII hydrograph determined by subtracting the DWF from the measured wastewater flows. The figure also indicates the two significant rainfall events selected for the RDII analysis at the GLN8 flow meter.
4.2.2. Triangular Unit Hydrograph Curve Fitting
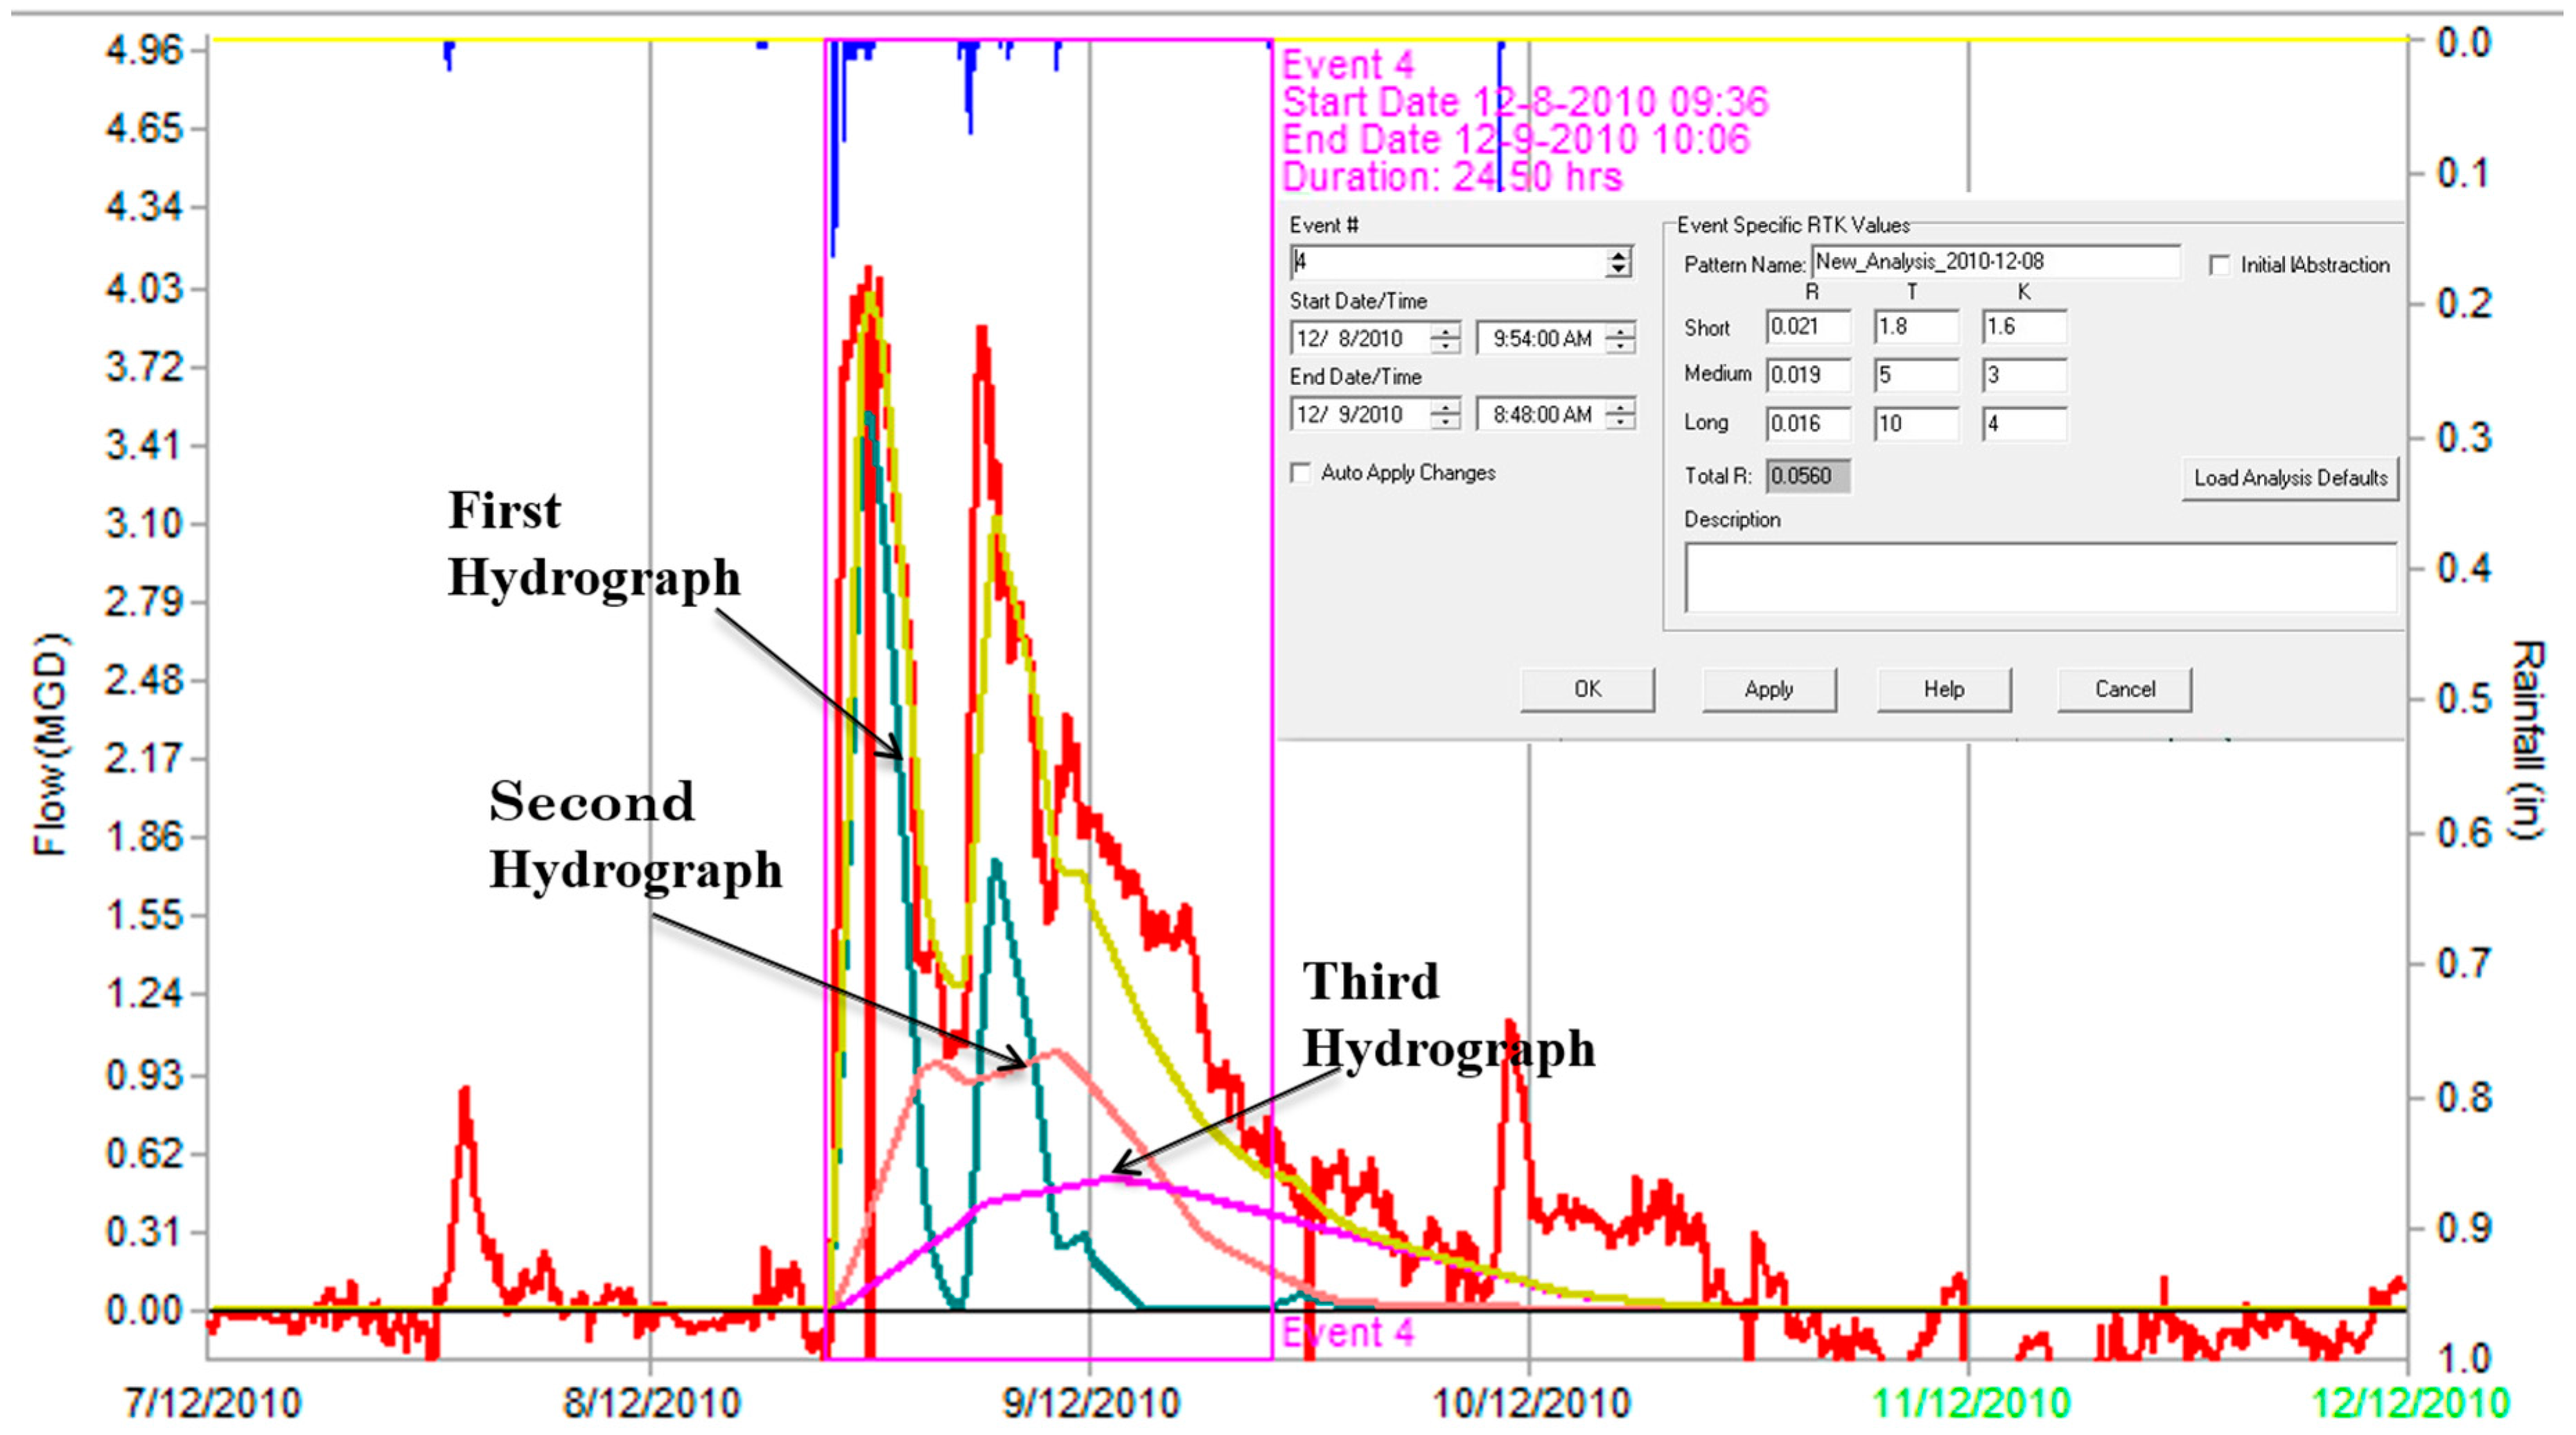
The SSOAP software defines the triangular unit hydrograph (UH) curve fitting method to simulate the RDII. This method is based on fitting three triangular unit hydrographs to an actual RDII hydrograph derived (in the previous step) from the flow data. As stated earlier, each hydrograph has three parameters of R, T, K. Total R value is the sum of three unit hydrograph parameters (R1, R2, and R3) and it denotes the percentage of rainfall volume which enters the sewer network in terms of RDII. A high value of R1 suggests that the inflow is a major component of RDII. If the proportion of R2 and R3 dominants in the total R, it denotes that infiltration is a major component of RDII. These three unit hydrographs also describe fast, medium and slow response of RDII.
Figure 4 shows estimation of the R, T, K parameters based on the triangular unit hydrograph method (using the SSOAP software).
The first hydrograph (
Figure 4) indicates the fast response of the rainfall derived inflow component. The second hydrograph represents a medium response component of the RDII hydrograph, which contains both rainfall derived infiltration and inflow. The third hydrograph denotes rainfall derived infiltration and represents the slow response of the RDII.
A previous study was undertaken for calibrating the R, T and K parameters using the SSOAP toolbox [
40]. This software simplifies the calibration procedure by using a built-in graphical tool (shown in
Figure 4) that provides a visual-based automatic calibration approach. The model uses a FPS (foot–pound–second) unit system and the same parameters and their units are depicted in
Figure 4.
Table 2 presents the three sets of calibrated R, T and K parameters (nine parameters in total) for the two intense rainfall events during the period November–December 2010 at the GLN8 flow meter location.
RDII responses within the sanitary sewer network vary from event to event because different rainfall events could lead to different RDII responses throughout the year. Therefore, the ideal condition for determining the characteristics of the relationship between rainfall and RDII responses needs accurate long-term (a year or more) rainfall and measured sewer flow data. Total R, which is the fraction of rainfall volume entering the network as RDII, depends on many factors including total event rainfall, event rainfall intensity, ground water infiltration and antecedent moisture conditions. Hence, total R is the main parameter causing the variability of the RDII responses. The other parameters, T and K, are not changing significantly between rainfall events since they depend on the geometry and sewer system layout. These parameter values are only used for the iterative process in the triangular unit hydrograph curve fitting method. For continuous simulation of the hydraulic routing, monthly varying R, T, K parameters were required for evaluating the different RDII responses throughout the year. Therefore, we sought to establish a multi-variable linear regression equation to predict the remaining month’s (January–October) RDII responses based on the limited data (measured during November–December, 2010). It is recommended in the literature to apply multi linear regression to predict better responses of RDII when long-term data is unavailable [
26,
41]. In the multi-variable linear regression analysis, the dependent variable is total R and the selected independent variables are total event rainfall, peak rainfall intensity and 7-day rainfall total before the event. For developing the multi-variable linear regression model, six significant rainfall events from the wet months of November and December were considered for calibration (including one large rainfall event in November, 2010). The coefficient of determination (R2) was used to identify the best regression equation and a satisfactory value of 0.99 was obtained for the calibration. The regression model was validated for two significant rainfall events in December 2010 (including one large rainfall event). The coefficient of determination (R2) for the validation was 0.96, which indicates a good predictive capability of the regression equation. The equation (with regression coefficients) developed from this multi-variable linear regression analysis is as follows.
Total R = 0.0244 + [total event rainfall × (0.095)] + [peak rainfall intensity × (−0.1465)] + [7 days total rainfall before the event × (−0.00622)]
After calculating the monthly varied total R value, the fast, medium and slow RDII responses (R1, R2 and R3) were determined using the RDII analysis tool of the SSOAP software over the analysis period total months. These calibrated R, T and K parameters will now be used as inputs to the sewer hydraulic model for continuous simulation.
4.3. Sewer Hydraulic Modelling
This task involves the simulation of the sewer model using PCSWMM for assessing the performance of the existing sewer network.
4.3.1. Model Development
In this part of the study, GIS has been applied to delineate the study area into 38 sub-catchments with areas varying from 2 ha to 101 ha based on the overall layout of the sewer network. The sewer modelling has been undertaken using the dynamic wave routing approach. A set of model parameters has been used in the study. The following parameters were used in the hydraulic model: Percentage of imperviousness (Imp); Catchment slope (S); Manning’s n for overland flow (nImp and nPer); Manning’s n for closed conduit (nConduit); Depression storage for impervious and pervious areas (DSImp and DSPer); and the Infiltration parameters. The parameters calibrated, the calibration procedure and the parameter values are discussed in the next sub-section.
4.3.2. Model Calibration and Validation
Model calibration and validation have been conducted using two intense rainfall events during the wet months of November and December, 2010. The sewer model has been calibrated by using the measured sewer flow at the GLN8 flow meter location for the November rainfall event, 27–28 November. Then the calibrated model has been validated for another intense rainfall event that occurred from 8 to 9 December. The time series plots of the calibration and validation rainfall events are shown in
Figure 3.
In PCSWMM, calibration is done by using the Sensitivity Radio Tuning Calibration (SRTC) tool [
42], which was adopted for this study. However, the automatic calibration is also popular in rainfall-runoff modelling to estimate the best combination of model parameters [
43,
44]. Especially, the population-evolution-based Genetic algorithm (GA) has been extensively used for evaluating the optimal values of model parameters [
45,
46]. As the SRTC tool provided acceptable accuracy for calibration and validation (discussed in the next sub-section), automatic calibration tools such as the GA were not employed in this study. The different model parameters and their calibrated values are shown in
Table 3, which also presents typical values for the model parameters obtained from literature or calculated from the catchment data.
Other than the parameters presented in
Table 3, the unit hydrograph parameters (R, T and K) are also important parameters to be calibrated. These parameters have already been calibrated in the RDII analysis presented earlier using the SSOAP toolbox.
4.3.3. Calibration/Validation Results
The fitness evaluation of the calibration and validation hydrographs has been undertaken based on the Nash–Sutcliffe coefficient of efficiency (
ENS), which is a commonly used goodness-of-fit measure in hydrological models. The
ENS is suitable for reflecting the trends and overall fit of a flow hydrograph [
52]. The
ENS is represented by Equation (1) (taken from [
53]), where
Qobs and
Qsimu refer to the measured sewer flows and model simulated flows, respectively and
N defines the number of observations.
If the value of the
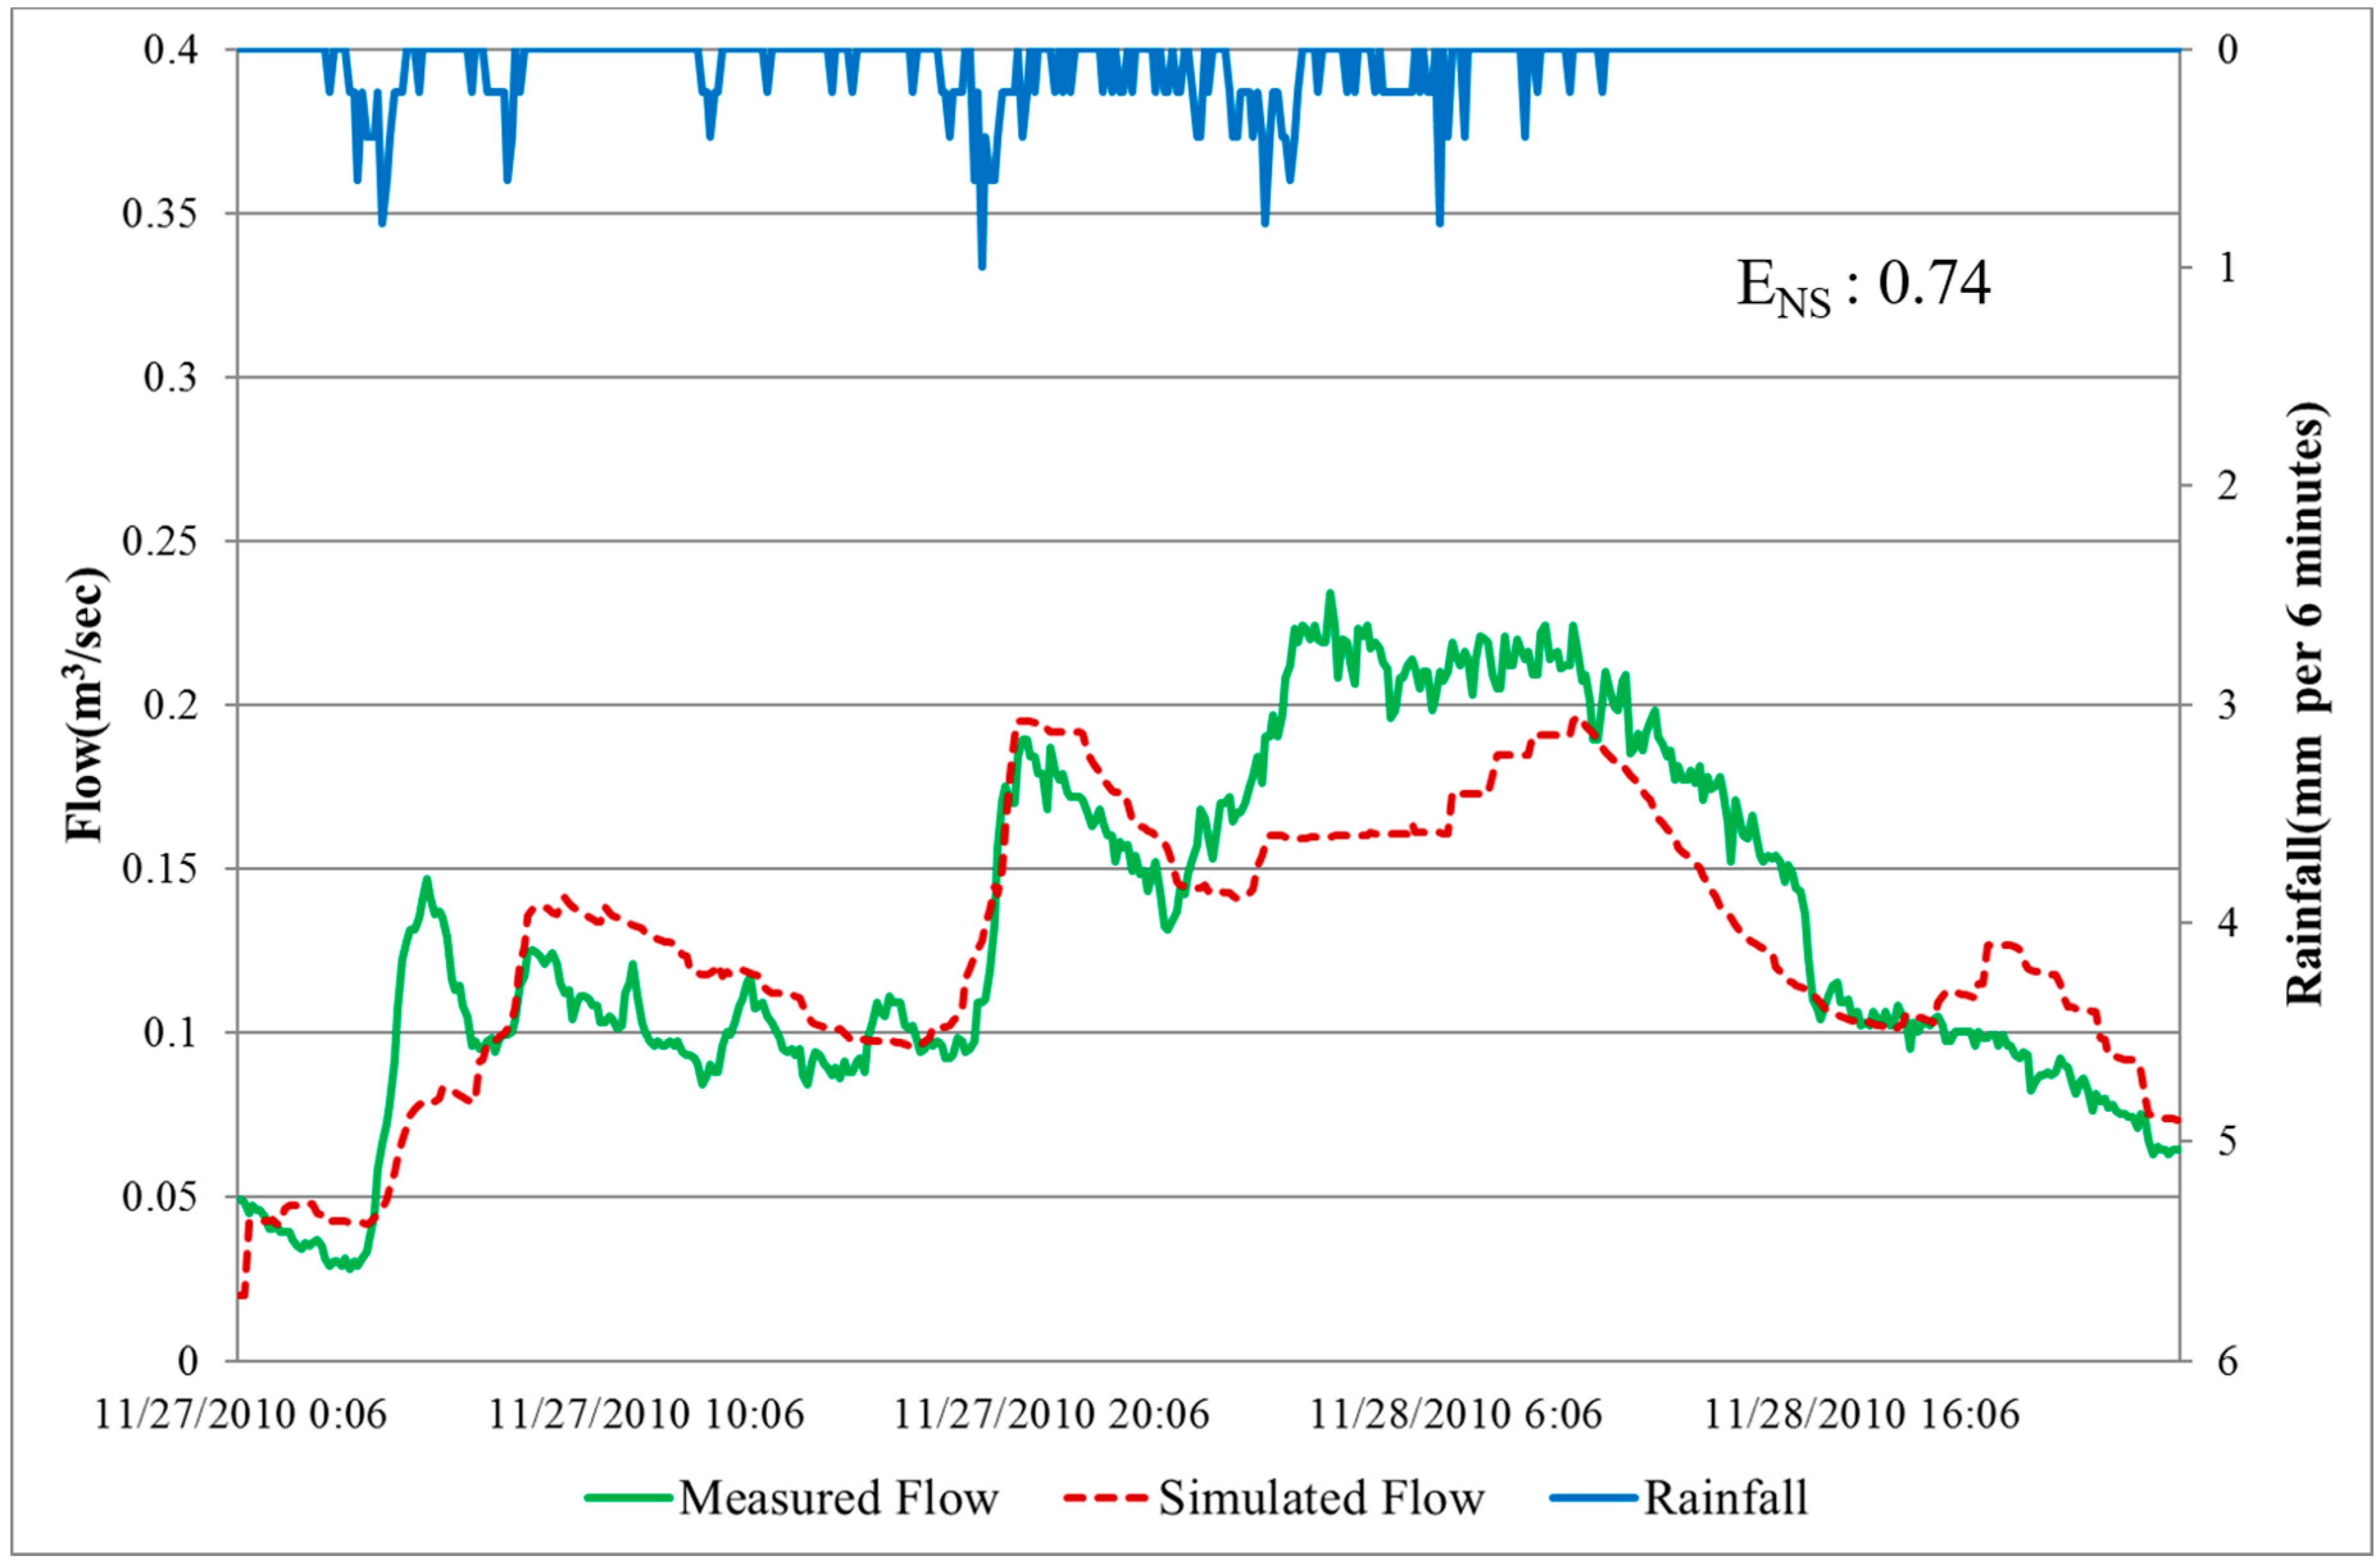
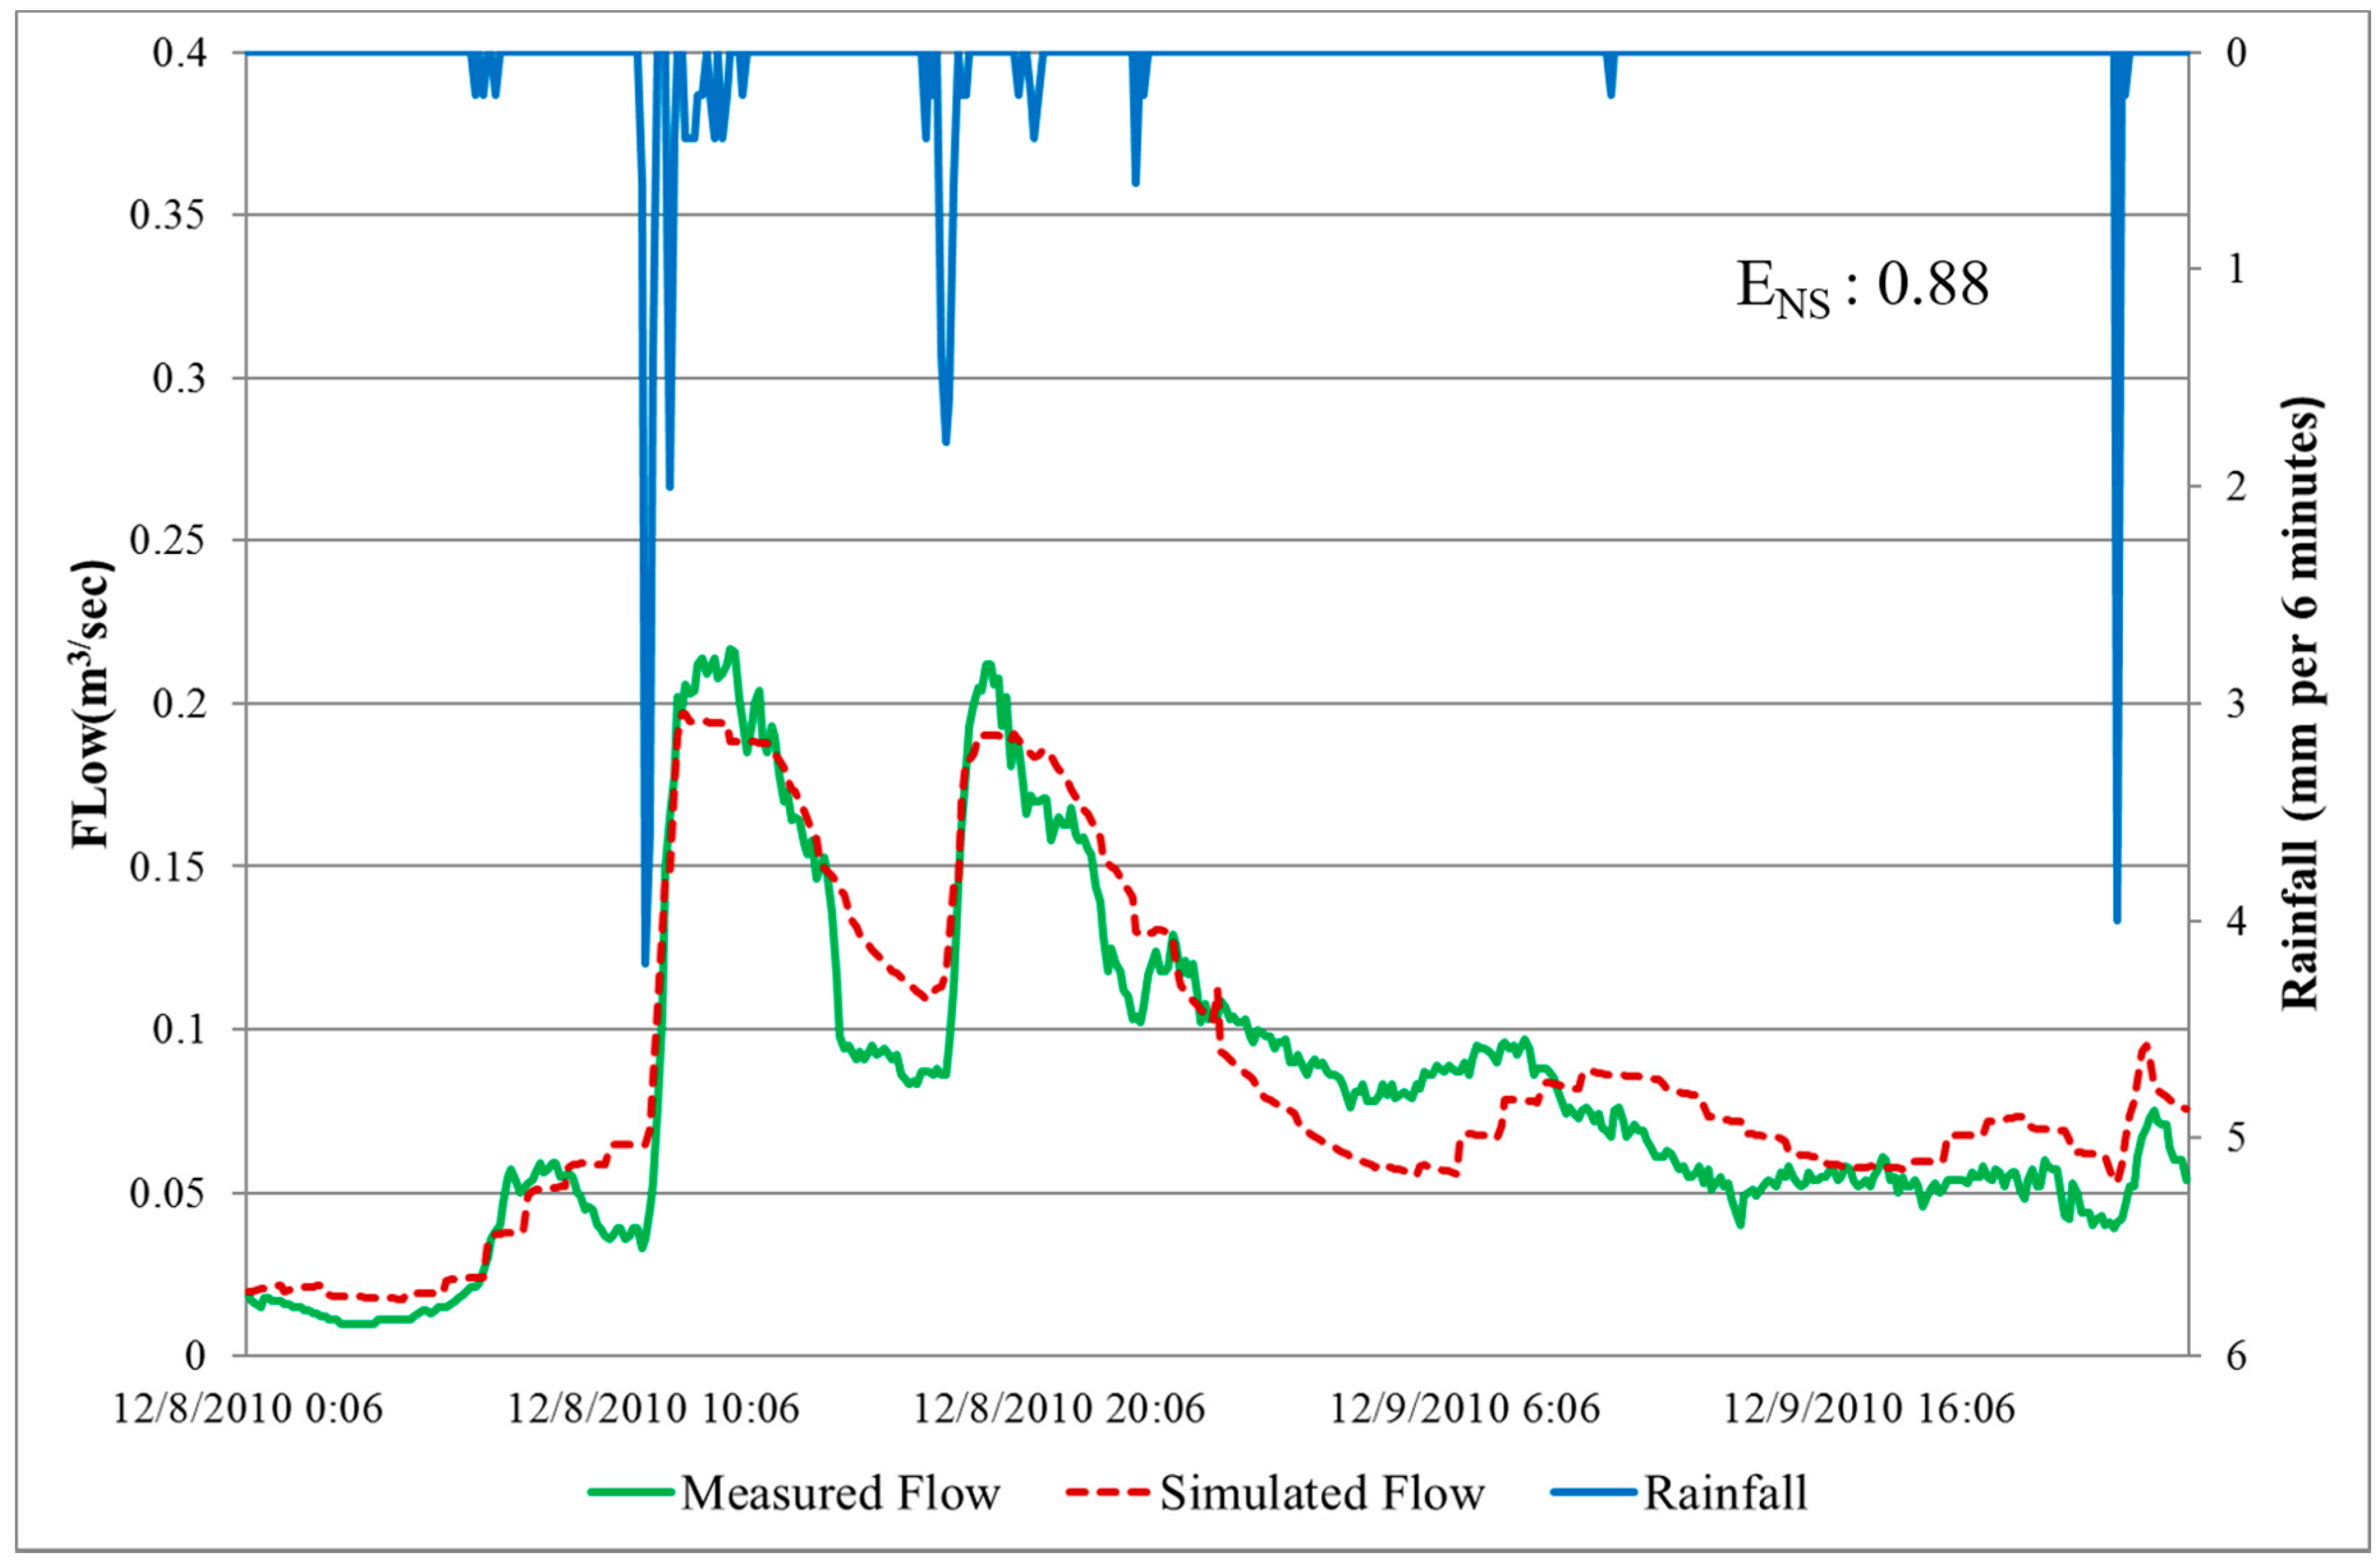
ENS is close to 1, it denotes that the prediction of the model simulated flow is as accurate as the measured flow. A comparison of the measured and simulated hydrograph for the calibration period is presented in
Figure 5, whereas the validation hydrographs are presented in
Figure 6. The
ENS values are also indicated in both these figures.
From
Figure 5, it can be seen that the calibration results are satisfactory with an
ENS coefficient of 0.74 and, although the model is not able to accurately capture some of the peak flows. An error of 13% was observed between the measured and simulated values over the calibration period, whereas the error over the validation period was 5%. Good performance is also achieved for the validation results, as can be seen in
Figure 6. The validation results again indicate an accurate match between the measured and simulated hydrographs and a much better simulation of the peak flows (when compared to that in the calibration).
4.4. Sewer Network Performance Evaluation
As stated earlier, a set of performance indicators were developed that would help in assessing the hydraulic performance of the sewer network under intense rainfall events. The performance indicators were compared for two years, one of which (2010) was a wet year in Melbourne with many intense rainfall events, whereas the other (2008) was a relatively dry year. According to the Bureau of Meteorology, if the daily rainfall exceeds 10 mm, the day is known to be a heavy precipitation day [
54]. The year 2010 had 19 heavy precipitation days whereas 2008 had nine such days. Moreover, the total annual rainfall for 2010 was 681.2 mm, which exceeds the long-term average of 587.9 mm and was accordingly denoted as a wet year [
55]. However, the total annual rainfall for 2008 was 369.8 mm, which was well below the long-term average (587.9 mm) and defined as a dry year. A continuous simulation of the sewer model was undertaken individually for both years using a six-minute time-step.
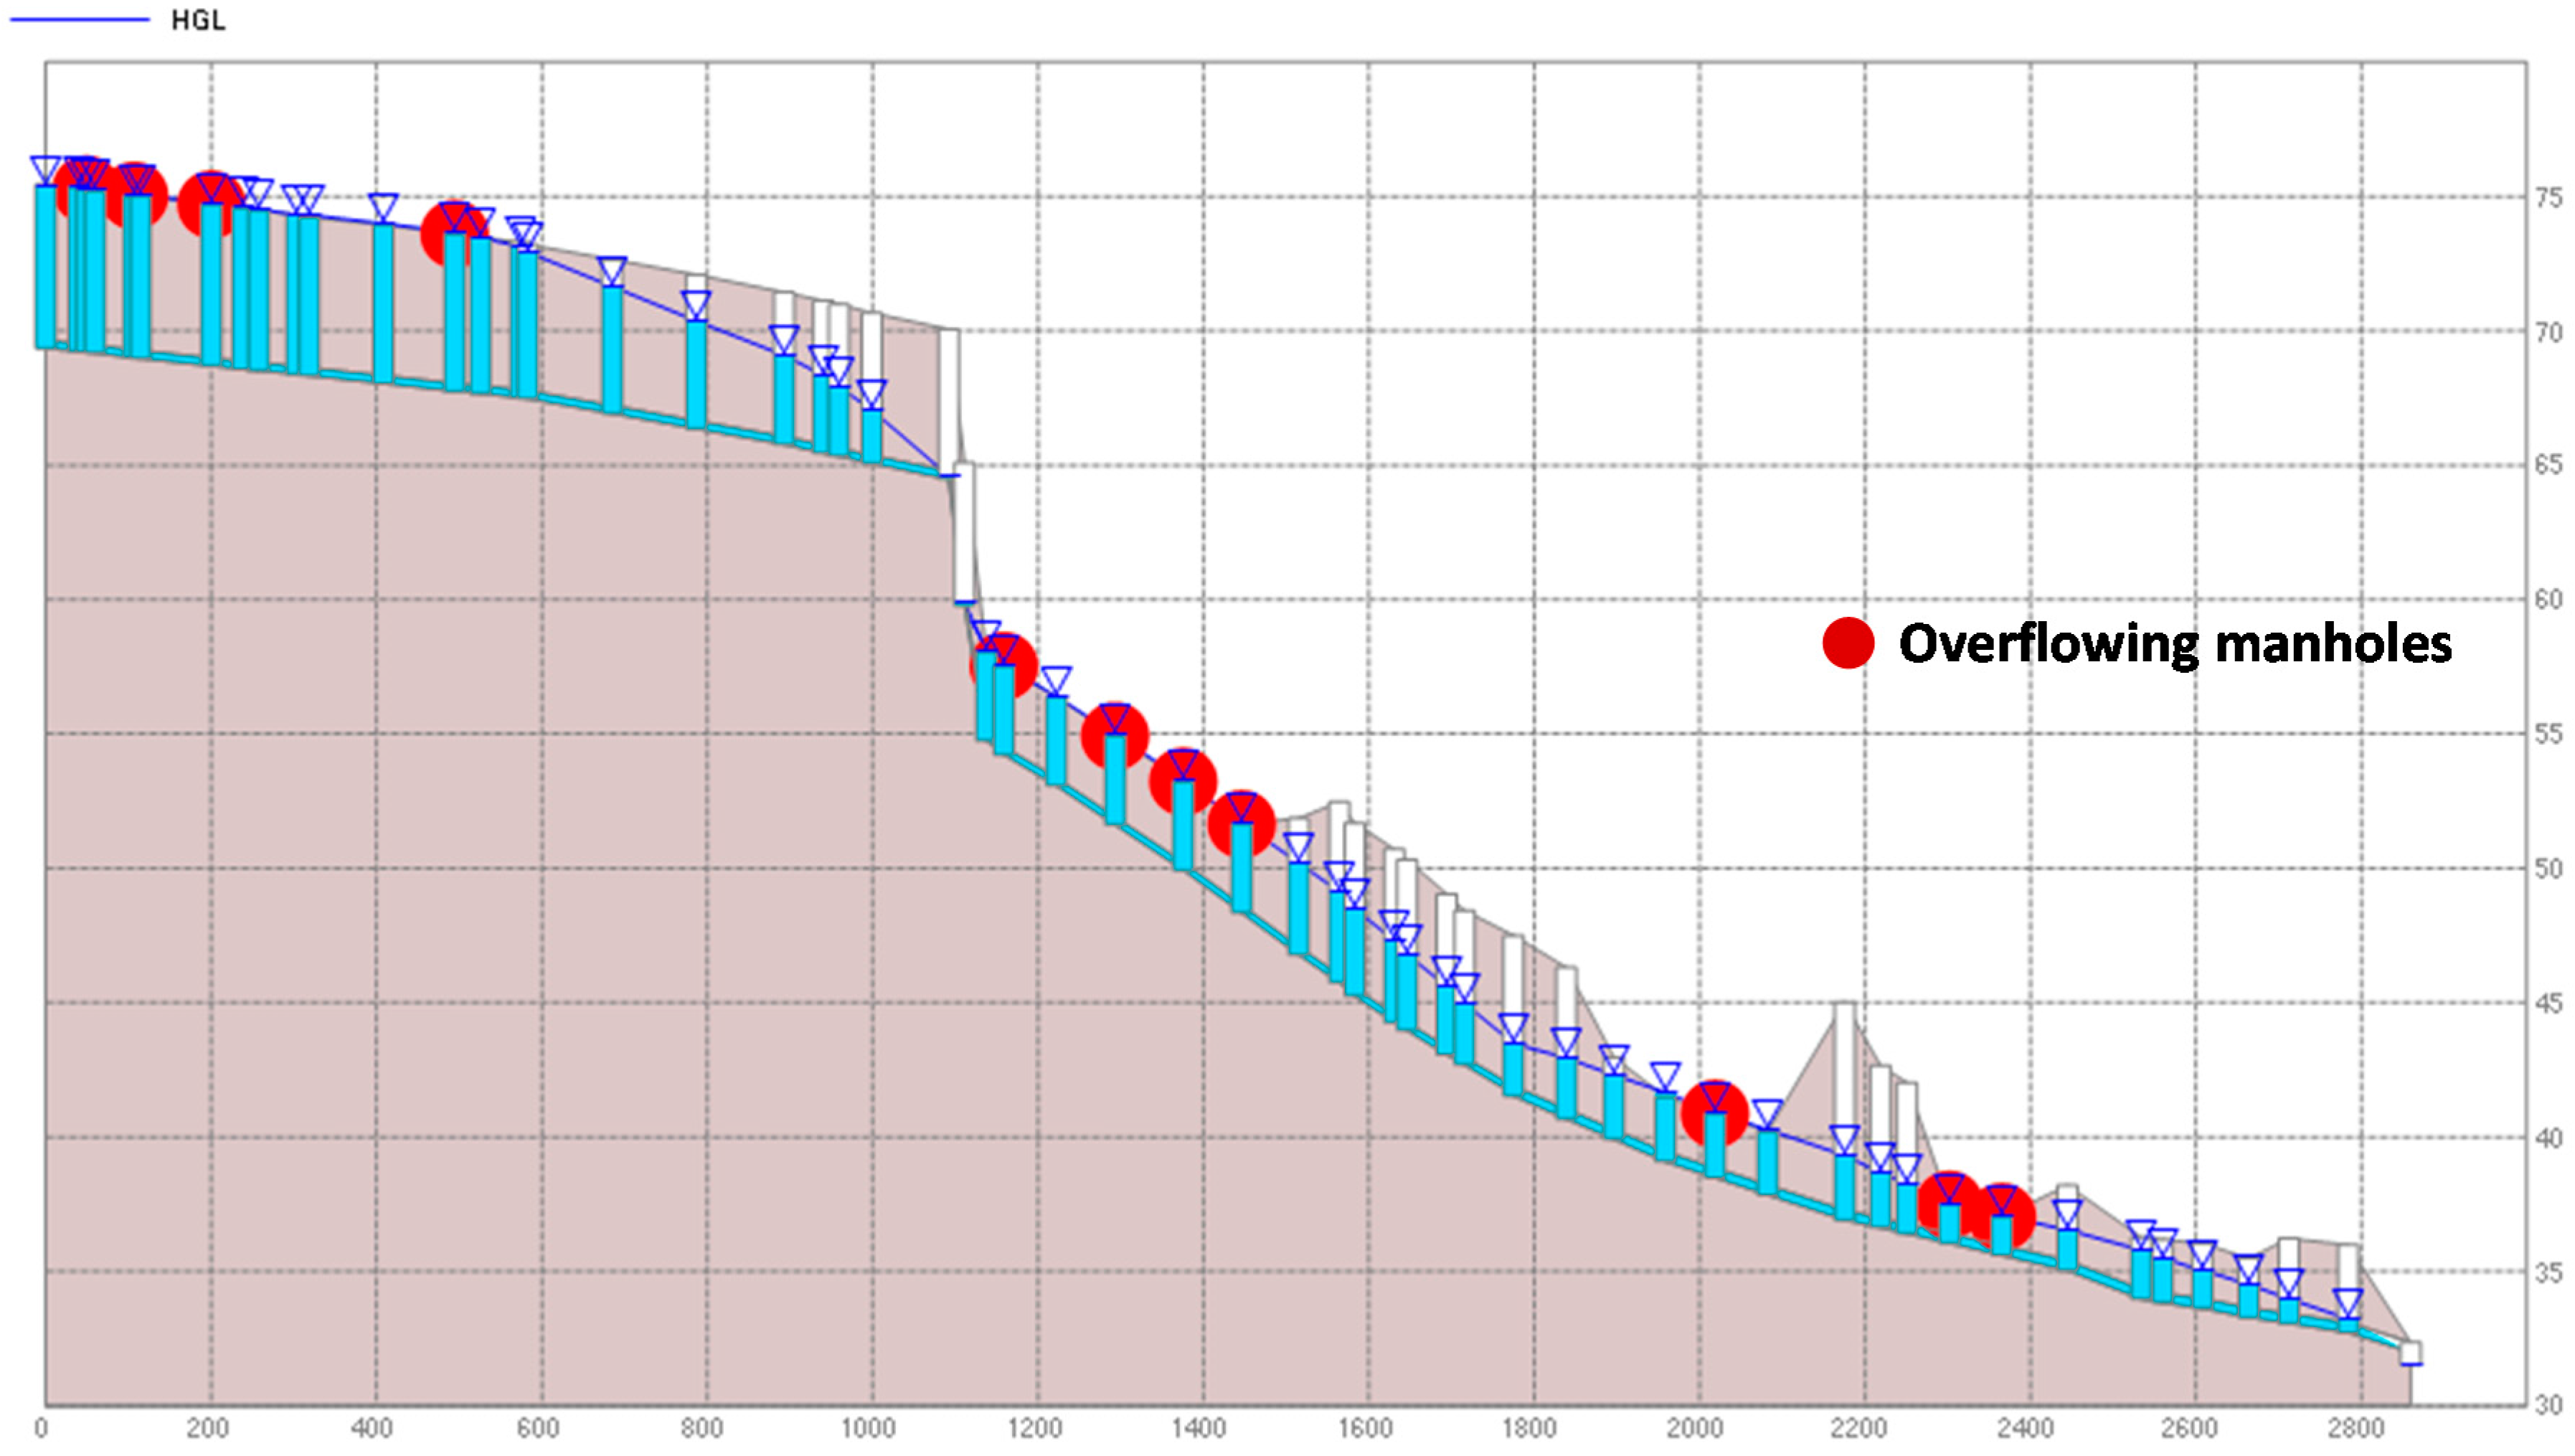
Figure 7 presents a hydraulic profile plot that indicates the manholes which had SSOs and surcharges due to the most intense rainfall event in 2010, which occurred on 30 October. On that day, the total daily rainfall was 55.2 mm, which was the most for a day in 2010. A rainfall of 29.2 mm occurred from 1:00 p.m. to 3.30 p.m., which corresponds to an ARI of 5 years. As a consequence of the intense rainfall over a short duration, 11 manholes had sewer overflows and 53 manholes had sewer surcharges (out of a total of 57 manholes in the network).
Figure 7 shows the location of the overflowing manholes, which in turn can be used by the water authorities to implement sewer overflow mitigation strategies.
The performance indicators used in this study to assess the performance of the sewer network in terms of SSOs and sewer surcharges and their values for 2008 and 2010 are presented in
Table 4.
The performance indicators presented in
Table 4 for the wet year (2010) showed that 11 manholes had sewer overflows, whereas 53 had sewer surcharges. There were several intense rainfall events in 2010 and sewer overflows occurred on 11 days in that year. However, for the dry year (2008), there was an intense rainfall event on 13 December (14 mm rainfall in two hours) and it caused six manholes to overflow and 52 manholes to surcharge. It can also be seen that 23 ML of sewage overflowed in 2010 (wet year) but only 3.42 ML in 2008 (dry year), which could have serious aesthetic, environmental and health issues for the selected residential catchment.
5. Discussion on Sewer Network Hydraulic Performance Assessment
The aforementioned results describe and compare the simulated impact of short duration intense rainfall events on an existing sewer network. In this analysis, we sought to establish a set of sewer network performance indicators which will help to evaluate the current situation of the existing sewer system in terms of its hydraulic performance. Since the sewer network in this case study area was quite old, RDII would be a major problem, in addition to pipe collapse, debris build-up and blockages. These in turn will lead to SSOs and surcharges.
Comparing the sewer network’s performance for the representative wet and dry years showed that the wet year with frequent intense rainfall events had five times the number of sewer overflow days than the dry year. The sewer overflow volume on the other hand was 23 ML for the wet year as compared to 3.42 ML for the dry year. These overflows release many harmful contaminants and spread pollutants, nutrients, and hazardous substances into the suburban creeks and waterways. Thus, these sewage overflows affect the ecosystem and biota in the receiving waters.
Another point to note is that an increase in rainfall intensity or extended surcharge conditions will eventually lead to more of the surcharging manholes to overflow. The existing network fails to cope with the intense rainfall events and as a consequence, the wet year indicates a significant amount of overflow volume, more overflowing days and a large number of critical locations where overflows and surcharges occur frequently. The results (presented in
Table 4) seem to indicate that the existing system in the case study catchment will fail to cope with the increased rainfall intensities. Therefore, the framework also proposes sustainable and cost-effective WSUD approaches for mitigating these negative impacts of sewer overflows. A future study will undertake detailed hydraulic modelling with various WSUD strategies for reducing rainfall induced sewer overflows for the same sewershed area. The proposed framework and these findings will serve as the basis for future studies. As stated in the framework, the performance indicators will also be used for comparing the performance of the existing system with that when sustainable mitigation strategies have been implemented.
6. Summary and Conclusions
Intense rainfall has an adverse impact on the performance of the sewer network by causing sanitary sewer overflows (SSOs) and surcharges. The aim of this paper is to investigate the negative impacts of the intense rainfall events on the performance of the existing sewer network. Therefore, this study has presented a framework for evaluating and mitigating the impacts of intense rainfall on the performance of the sewer network. The framework for the hydraulic performance assessment has been applied to a residential catchment in Melbourne and has assessed the performance of the sewer system under intense rainfall events. The application of the framework indicated that that overflows and surcharges were very frequent in the case study sewer network, especially for the wet year.
The framework undertaken for the hydraulic performance assessment would provide a good indication to the water managers in local councils about the performance of the sewer network, especially during intense rainfall events. The performance assessment modelling identifies the most critical locations (manholes) where overflows and surcharges frequently occur as well as providing the overflow volumes, and thus suitable measures could be taken to alleviate the problem.
Acknowledgments
The authors wish to thank Yarra Valley Water and the Bureau of Meteorology for providing the necessary data used in this study.
Author Contributions
The modelling and writing of the paper was undertaken by Tasnim Nasrin as part of her PhD studies under the supervision of Nitin Muttil (Principal Supervisor) and Ashok K. Sharma (Associate Supervisor). Nitin Muttil and Ashok K. Sharma guided the entire study and provided editorial comments towards writing of the paper.
Conflicts of Interest
The authors declare no conflict of interest.
References
- Willems, P. Revision of urban drainage design rules after assessment of climate change impacts on precipitation extremes at Uccle, Belgium. J. Hydrol. 2013, 496, 166–177. [Google Scholar] [CrossRef]
- Gamerith, V.; Olsson, J.; Camhy, D.; Hochedlinger, M.; Kutschera, P.; Schlobinski, S.; Gruber, G. Assessment of Combined Sewer Overflows under Climate Change-Urban Drainage Pilot Study Linz; IWA World Congress on Water, Climate and Energy: Dublin, Irland, 2012; Available online: http://www.smhi.se/polopoly_fs/1.24829.1347460676!/Paper_WCE_Dublin_Gamerith_etal.pdf (accessed on 9 May 2014).
- Berggren, K.; Olofsson, M.; Viklander, M.; Svensson, G.; Gustafsson, A.M. Hydraulic impacts on urban drainage systems due to changes in rainfall caused by climatic change. J. Hydrol. Eng. 2011, 17, 92–98. [Google Scholar] [CrossRef]
- Nie, L.; Lindholm, O.; Lindholm, G.; Syversen, E. Impacts of climate change on urban drainage systems—A case study in Fredrikstad, Norway. Urban Water J. 2009, 6, 323–332. [Google Scholar] [CrossRef]
- IPCC. Summary for policymakers. In Climate Change 2007: The Physical Science Basis. Contribution of Working Group I to the Fourth Assessment Report of the Intergovernmental Panel on Climate Change; Solomon, S., Qin, D., Manning, M., Chen, Z., Marquis, M., Averyt, K.B., Tignor, M., Miller, H.L., Eds.; Cambridge University Press: Cambridge, UK, 2007; pp. 1–18. [Google Scholar]
- Astaraie-Imani, M.; Kapelan, Z.; Fu, G.; Butler, D. Assessing the combined effects of urbanisation and climate change on the river water quality in an integrated urban wastewater system in the UK. J. Environ. Manag. 2012, 112, 1–9. [Google Scholar] [CrossRef] [PubMed]
- Willems, P.; Arnbjerg-Nielsen, K.; Olsson, J.; Nguyen, V.T.V. Climate change impact assessment on urban rainfall extremes and urban drainage: Methods and shortcomings. Atmos. Res. 2012, 103, 106–118. [Google Scholar] [CrossRef]
- Semadeni-Davies, A.; Hernebring, C.; Svensson, G.; Gustafsson, L.G. The impacts of climate change and urbanisation on drainage in Helsingborg, Sweden: Combined sewer system. J. Hydrol. 2008, 350, 100–113. [Google Scholar] [CrossRef]
- Yilmaz, A.G.; Perera, B.J.C. Extreme Rainfall Nonstationarity Investigation and Intensity-Frequency-Duration Relationship. J. Hydrol. Eng. 2014, 19, 1160–1172. [Google Scholar] [CrossRef]
- Pawlowski, C.W.; Rhea, L.; Shuster, W.D.; Barden, G. Some factors affecting inflow and infiltration from residential sources in a core urban area: Case study in a Columbus, Ohio, neighborhood. J. Hydraul. Eng. 2013, 140, 105–114. [Google Scholar] [CrossRef]
- Karuppasamy, E.; Inoue, T. Application of USEPA SSOAP Software to Sewer System Modeling. In Proceedings of the ASCE’s World Environmental and Water Resources Congress 2012, Crossing Boundaries, Albuquerque, NM, USA, 20–24 May 2012; pp. 3494–3504.
- Zhang, Z. Estimating rain derived inflow and infiltration for rainfalls of varying characteristics. J. Hydraul. Eng. 2007, 133, 98–105. [Google Scholar] [CrossRef]
- Yazdanfar, Z.; Sharma, A.K. Urban Drainage System Planning and Design—Challenges with Climate Change and Urbanization: A Review. Water Sci. Technol. 2015. [Google Scholar] [CrossRef] [PubMed]
- Blecken, G.T.; Hunt, W.F., III; Al-Rubaei, A.M.; Viklander, M.; Lord, W.G. Stormwater control measure (SCM) maintenance considerations to ensure designed functionality. Urban Water J. 2015, 14, 278–290. [Google Scholar] [CrossRef]
- Elliott, A.H.; Trowsdale, S.A. A review of models for low impact urban stormwater drainage. Environ. Model. Softw. 2007, 22, 394–405. [Google Scholar] [CrossRef]
- Arnbjerg-Nielsen, K.; Fleischer, H.S. Feasible adaptation strategies for increased risk of flooding in cities due to climate change. Water Sci. Technol. 2009, 60, 273–281. [Google Scholar] [CrossRef] [PubMed]
- Abi Aad, M.P.; Suidan, M.T.; Shuster, W.D. Modeling techniques of best management practices: Rain barrels and rain gardens using EPA SWMM-5. J. Hydrol. Eng. 2009, 15, 434–443. [Google Scholar] [CrossRef]
- Fletcher, T.D.; Shuster, W.; Hunt, W.F.; Ashley, R.; Butler, D.; Arthur, S.; Trowsdale, S.; Barraud, S.; Semadeni-Davies, A.; Bertrand-Krajewski, J.L. SUDS, LID, BMPs, WSUD and more—The evolution and application of terminology surrounding urban drainage. Urban Water J. 2014, 12, 525–542. [Google Scholar] [CrossRef]
- Fryd, O.; Dam, T.; Jensen, M.B. A planning framework for sustainable urban drainage systems. Water Policy 2012, 14, 865–886. [Google Scholar] [CrossRef]
- Beeneken, T.; Erbe, V.; Messmer, A.; Reder, C.; Rohlfing, R.; Scheer, M.; Schuetze, M.; Schumacher, B.; Weilandt, M.; Weyand, M. Real time control (rtc) of urban drainage systems—A discussion of the additional efforts compared to conventionally operated systems. Urban Water J. 2013, 10, 293–299. [Google Scholar] [CrossRef]
- Dirckx, G.; Schütze, M.; Kroll, S.; Thoeye, C.; De Gueldre, G.; Van De Steene, B. Cost-efficiency of rtc for cso impact mitigation. Urban Water J. 2011, 8, 367–377. [Google Scholar] [CrossRef]
- Fu, G.; Khu, S.T.; Butler, D. Optimal distribution and control of storage tank to mitigate the impact of new developments on receiving water quality. J. Environ. Eng. 2009, 136, 335–342. [Google Scholar] [CrossRef]
- Butler, D.; Schütze, M. Integrating simulation models with a view to optimal control of urban wastewater systems. Environ. Model. Softw. 2005, 20, 415–426. [Google Scholar] [CrossRef]
- BoM, Australia. 2015. Available online: http://www.bom.gov.au/climate/enso/lnlist (accessed on 5 May 2015).
- CHI. PCSWMM. 2016. Available online: http://www.chiwater.com/Software/PCSWMM/index.asp (accessed on 12 December 2016).
- Vallabhaneni, S.; Camp, D. Computer Tools for Sanitary Sewer System Capacity Analysis and Planning; US Environmental Protection Agency, Office of Research and Development: Washington, DC, USA, 2007.
- Vallabhaneni, S.; Lai, F.H.; Chan, C.; Burgess, E.H.; Field, R. SSOAP—A USEPA toolbox for SSO analysis and control planning. In Proceedings of the World Environmental and Water Resources Congress 2008, Honolulu, HI, USA, 12–16 May 2008; pp. 1–10.
- Bennis, S.; Bengassem, J.; Lamarre, P. Hydraulic performance index of a sewer network. J. Hydraul. Eng. 2003, 129, 504–510. [Google Scholar] [CrossRef]
- Hsu, M.H.; Chen, S.H.; Chang, T.J. Inundation simulation for urban drainage basin with storm sewer system. J. Hydrol. 2000, 234, 21–37. [Google Scholar] [CrossRef] [Green Version]
- Engelhard, C.; De Toffol, S.; Rauch, W. Suitability of CSO Performance indicators for Compliance with Ambient Water Quality. Urban Water J. 2008, 5, 43–49. [Google Scholar] [CrossRef]
- Berggren, K. Indicators for urban drainage system-assessment of climate change impacts. In Proceedings of the 11th International Conference on Urban Drainage, Edinburgh, UK, 31 August–5 September 2008; Available online: http://web.sbe.hw.ac.uk/staffprofiles/bdgsa/11th_International_Conference_on_Urban_Drainage_CD/ICUD08/pdfs/394.pdf (accessed on 11 June 2014).
- Llopart-Mascaró, A.; Farreny, R.; Gabarrell, X.; Rieradevall, J.; Gil, A.; Martínez, M.; Puertas, J.; Suárez, J.; Río, H.D.; Paraira, M. Storm tank against combined sewer overflow: Operation strategies to minimise discharges impact to receiving waters. Urban Water J. 2015, 12, 219–228. [Google Scholar] [CrossRef]
- Lucas, W.C.; Sample, D.J. Reducing combined sewer overflows by using outlet controls for Green Stormwater Infrastructure: Case study in Richmond, Virginia. J. Hydrol. 2015, 520, 473–488. [Google Scholar] [CrossRef]
- Liao, Z.L.; Zhang, G.Q.; Wu, Z.H.; He, Y.; Chen, H. Combined sewer overflow control with LID based on SWMM: An example in Shanghai. Water Sci. Technol. 2015, 71, 1136–1142. [Google Scholar] [CrossRef] [PubMed]
- Shamsi, U.M. Modeling to Quantify the LID Benefits for CSO Reduction. In Proceedings of the 5th EWRI National Low Impact Development Conference and Low Impact Development Symposium: Greening the Urban Environment, 2011, Philadelphia, PA, USA, 25–28 September 2011.
- Montalto, F.; Behr, C.; Alfredo, K.; Wolf, M.; Arye, M.; Walsh, M. Rapid assessment of the cost-effectiveness of low impact development for CSO control. Landsc. Urban Plan. 2007, 82, 117–131. [Google Scholar] [CrossRef]
- Sharma, A.K.; Pezzaniti, D.; Myers, B.; Cook, S.; Tjandraatmadja, G.; Chacko, P.; Chavoshi, S.; Kemp, D.; Leonard, R.; Koth, B.; et al. Water sensitive urban design: An investigation of current systems, implementation drivers, community perceptions and potential to supplement urban water services. Water 2016, 8, 272. [Google Scholar] [CrossRef]
- Hach Sigma 940 (2007): Hach Sigma 940 intrinsically safe area velocity flow meter. Hach Company: Loveland, CO, USA. Available online: www.e-d-s.com.au/documents/sigma_940.pdf (accessed on 20 November 2015).
- ARR Australia. IFD Design Rainfalls for Use with the 2016 Edition of Australian Rainfall and Runoff. 2016. Available online: http://www.bom.gov.au/water/designRainfalls/ifd/index.shtml (accessed on 15 December 2016). [Google Scholar]
- Nasrin, T.; Tran, H.D.; Muttil, N. Modelling Impact of Extreme Rainfall on Sanitary Sewer System by Predicting Rainfall Derived Infiltration/Inflow. In Proceedings of the MODSIM 2013: 20th International Congress on Modelling and Simulation, Adelaide, Australia, 1–6 December 2013; Available online: http://www.mssanz.org.au/modsim2013/L12/nasrin.pdf (accessed on 16 May 2014).
- Loehlein, M.D.; Meeneghan, T.J.; Prevost, T. A continuous simulation approach for separate sewered areas. J. Water Manag. Model, 2005, 13, 435–450. [Google Scholar]
- CHIWater Support. Calibrating a SWMM5 Model Using the SRTC Tool. 2014. Available online: http://support.chiwater.com/support/solutions/articles/29894-calibrating-a-swmm5-model-using-the-srtc-tool (accessed on 29 June 2014).
- Barco, J.; Wong, K.M.; Stenstrom, M.K. Automatic calibration of the US EPA SWMM model for a large urban catchment. J. Hydraul. Eng. 2008, 134, 466–474. [Google Scholar] [CrossRef]
- Muttil, N.; Jayawardena, A.W. Shuffled Complex Evolution model calibrating algorithm: Enhancing its robustness and efficiency. Hydrol. Processes 2008, 22, 4628–4638. [Google Scholar] [CrossRef] [Green Version]
- Fang, T.; Ball, J.E. Evaluation of spatially variable control parameters in a complex catchment modelling system: A genetic algorithm application. J. Hydroinform. 2007, 9, 163–173. [Google Scholar] [CrossRef]
- Liong, S.Y.; Chan, W.T.; ShreeRam, J. Peak-flow forecasting with genetic algorithm and SWMM. J. Hydraul. Eng. 1995, 121, 613–617. [Google Scholar] [CrossRef]
- Huber, W.C.; Dickinson, R.E.; Barnwell, T.O., Jr.; Branch, A. Storm Water Management Model; version 4; US Environmental Protection Agency, Environmental Research Laboratory: Washington, DC, USA, 1988.
- Sun, N.; Hall, M.; Hong, B.; Zhang, L. Impact of SWMM Catchment Discretization: Case Study in Syracuse, New York. J. Hydrol. Eng. 2012, 19, 223–234. [Google Scholar] [CrossRef]
- Chow, V.T.; Maidment, D.R.; Mays, L.W. Applied Hydrology; McGraw-Hill Education: New York, NY, USA, 1988. [Google Scholar]
- Rossman, L.A. Storm Water Management Model User’s Manual; version 5.0; National Risk Management Research Laboratory, Office of Research and Development, U.S. Environmental Protection Agency (U.S. EPA): Cincinnati, OH, USA, 2010.
- Tsihrintzis, V.A.; Hamid, R. Runoff quality prediction from small urban catchments using SWMM. Hydrol. Processes 1998, 12, 311–329. [Google Scholar] [CrossRef]
- Coutu, S.; Del Giudice, D.; Rossi, L.; Barry, D.A. Parsimonious hydrological modeling of urban sewer and river catchments. J. Hydrol. 2012, 464, 477–484. [Google Scholar] [CrossRef]
- Nash, J.; Sutcliffe, J.V. River flow forecasting through conceptual models part I—A discussion of principles. J. Hydrol. 1970, 10, 282–290. [Google Scholar] [CrossRef]
- BoM, Australia. 2016. Available online: http://www.bom.gov.au/climate/change/about/extremes.shtml (accessed on 5 December 2016).
- Walsh, T.C.; Pomeroy, C.A.; Burian, S.J. Hydrologic modeling analysis of a passive, residential rainwater harvesting program in an urbanized, semi-arid watershed. J. Hydrol. 2014, 508, 240–253. [Google Scholar] [CrossRef]
© 2017 by the authors. Licensee MDPI, Basel, Switzerland. This article is an open access article distributed under the terms and conditions of the Creative Commons Attribution (CC BY) license ( http://creativecommons.org/licenses/by/4.0/).


