
Performance and Cost Perspective in Selecting BMPs for Linear Projects
by
Abdolreza Osouli
1,*, 
Azadeh Akhavan Bloorchian
1,
Mark Grinter
2,
Aneseh Alborzi
1,
Scott L. Marlow
3,
Laurent Ahiablame
4 and
Jianpeng Zhou
1 1
Civil Engineering Department, Southern Illinois University Edwardsville, Edwardsville, IL 62026, USA
2
Construction Department, Southern Illinois University Edwardsville, Edwardsville, IL 62026, USA
3
Illinois Department of Transportation, Springfield, IL 62764, USA
4
Agricultural and Biosystems Engineering Department, South Dakota State University, Brookings, SD 57007, USA
*
Author to whom correspondence should be addressed.
Water 2017, 9(5), 302; https://doi.org/10.3390/w9050302
Submission received: 25 January 2017
/
Revised: 11 April 2017
/
Accepted: 21 April 2017
/
Published: 25 April 2017
Abstract
:Roads and developed land can alter hydrologic pathways, cause erosion, and increase pollution to nearby waters. Best management practices (BMPs) are commonly used to reduce adverse effects of post-construction runoff. This study is focused on providing performance and cost information for optimally selecting the BMPs for retaining post-construction stormwater on site. The performance of BMPs was simulated numerically using an idealized catchment in an urban setting environment. The cost of construction and maintenance of these BMPs were based on unit price. The considered BMPs were bioswale, infiltration trench, and vegetated filter strip. The effects of vegetated covers such as turf or prairie grass on stormwater runoff reduction of linear projects with and without BMPs were also evaluated. Finally, based on construction cost, maintenance costs, and performance of BMPs, recommendations are made to help decision makers in implementing the optimal BMP to control stormwater runoff for highways in urban areas.
1. Introduction
Departments of Transportation (DOTs) are facing increasing requirements to reduce the volume of highway stormwater runoff to limit the discharges into nearby surface waters via overland flow or through conveyance systems. In 2013, the Illinois Environmental Protection Agency (IEPA) workgroup recommended that new development sites should either demonstrate no net increase in runoff due to the development or retain runoff from a 25.4-mm (1-inch) 24-h storm event, which is approximately equivalent to a 90th percentile storm in Illinois [1]. This recommendation provides significant protections for Illinois water resources. The objective is to reduce the pollutant load directed to downstream sewer and stormwater treatment facilities. For example, if a site has 50% impervious area and is located in an area with sandy soils, capturing the runoff from a 25.4-mm (1 inch) rain event will typically keep 95% of phosphorus pollutants out of the downstream waters, and will keep 98% of the total suspended solids out of the discharges (IEPA 2013). The primary approach to control stormwater discharges on-site is to use best management practices (BMPs). The US Environmental Protection Agency (USEPA) defines BMPs as an engineered and constructed system that is designed to provide water quantity and quality control of stormwater [2].
Characteristics such as soil types and geologic conditions, and adjacent land uses, highway type, amount of open space in medians and shoulders, shoulder width and usage, highway landscaping and vegetation, and maintenance access all affect runoff volume reduction [3]. Measured percentage runoff volume reduction for vegetated filter strips is about 40% to 85% and for vegetated swales is from 50% to 94% [4,5,6]. Studies demonstrated almost 100% mitigation capacity for infiltration trenches [7,8]. The wide range in performances can be due to the sizes of the studied BMP relative to the contributing watershed area, the site conditions, and the quality of maintenance. Many of these performance measurements were conducted several years after construction of BMPs and depending on their maintenance quality, their functionality may have deteriorated by the time of monitoring [9]. Other limitations include: (1) many details of these measured sites are not known; (2) these measurements were evaluated in localized areas and most often not for linear projects. Many numerical studies of BMP performances were also conducted [10,11,12,13,14,15]. However, for practical applications, the BMP performance analysis lacks integration with cost analysis.
This study aimed to explore how effectively the runoff produced by first 25.4 mm (1 inch) precipitation can be retained on-site either by linear BMPs or vegetative surface cover using Personal Computer Storm Water Management Model (PCSWMM). The main objectives of this study are: (1) to quantify and compare the performance of linear BMPs as well as vegetated surface cover in runoff volume reduction; (2) to identify the contribution of BMP scaling, performances, and costs in the decision-making process and in contingency plans.
2. Study Area
2.1. Idealized Catchment
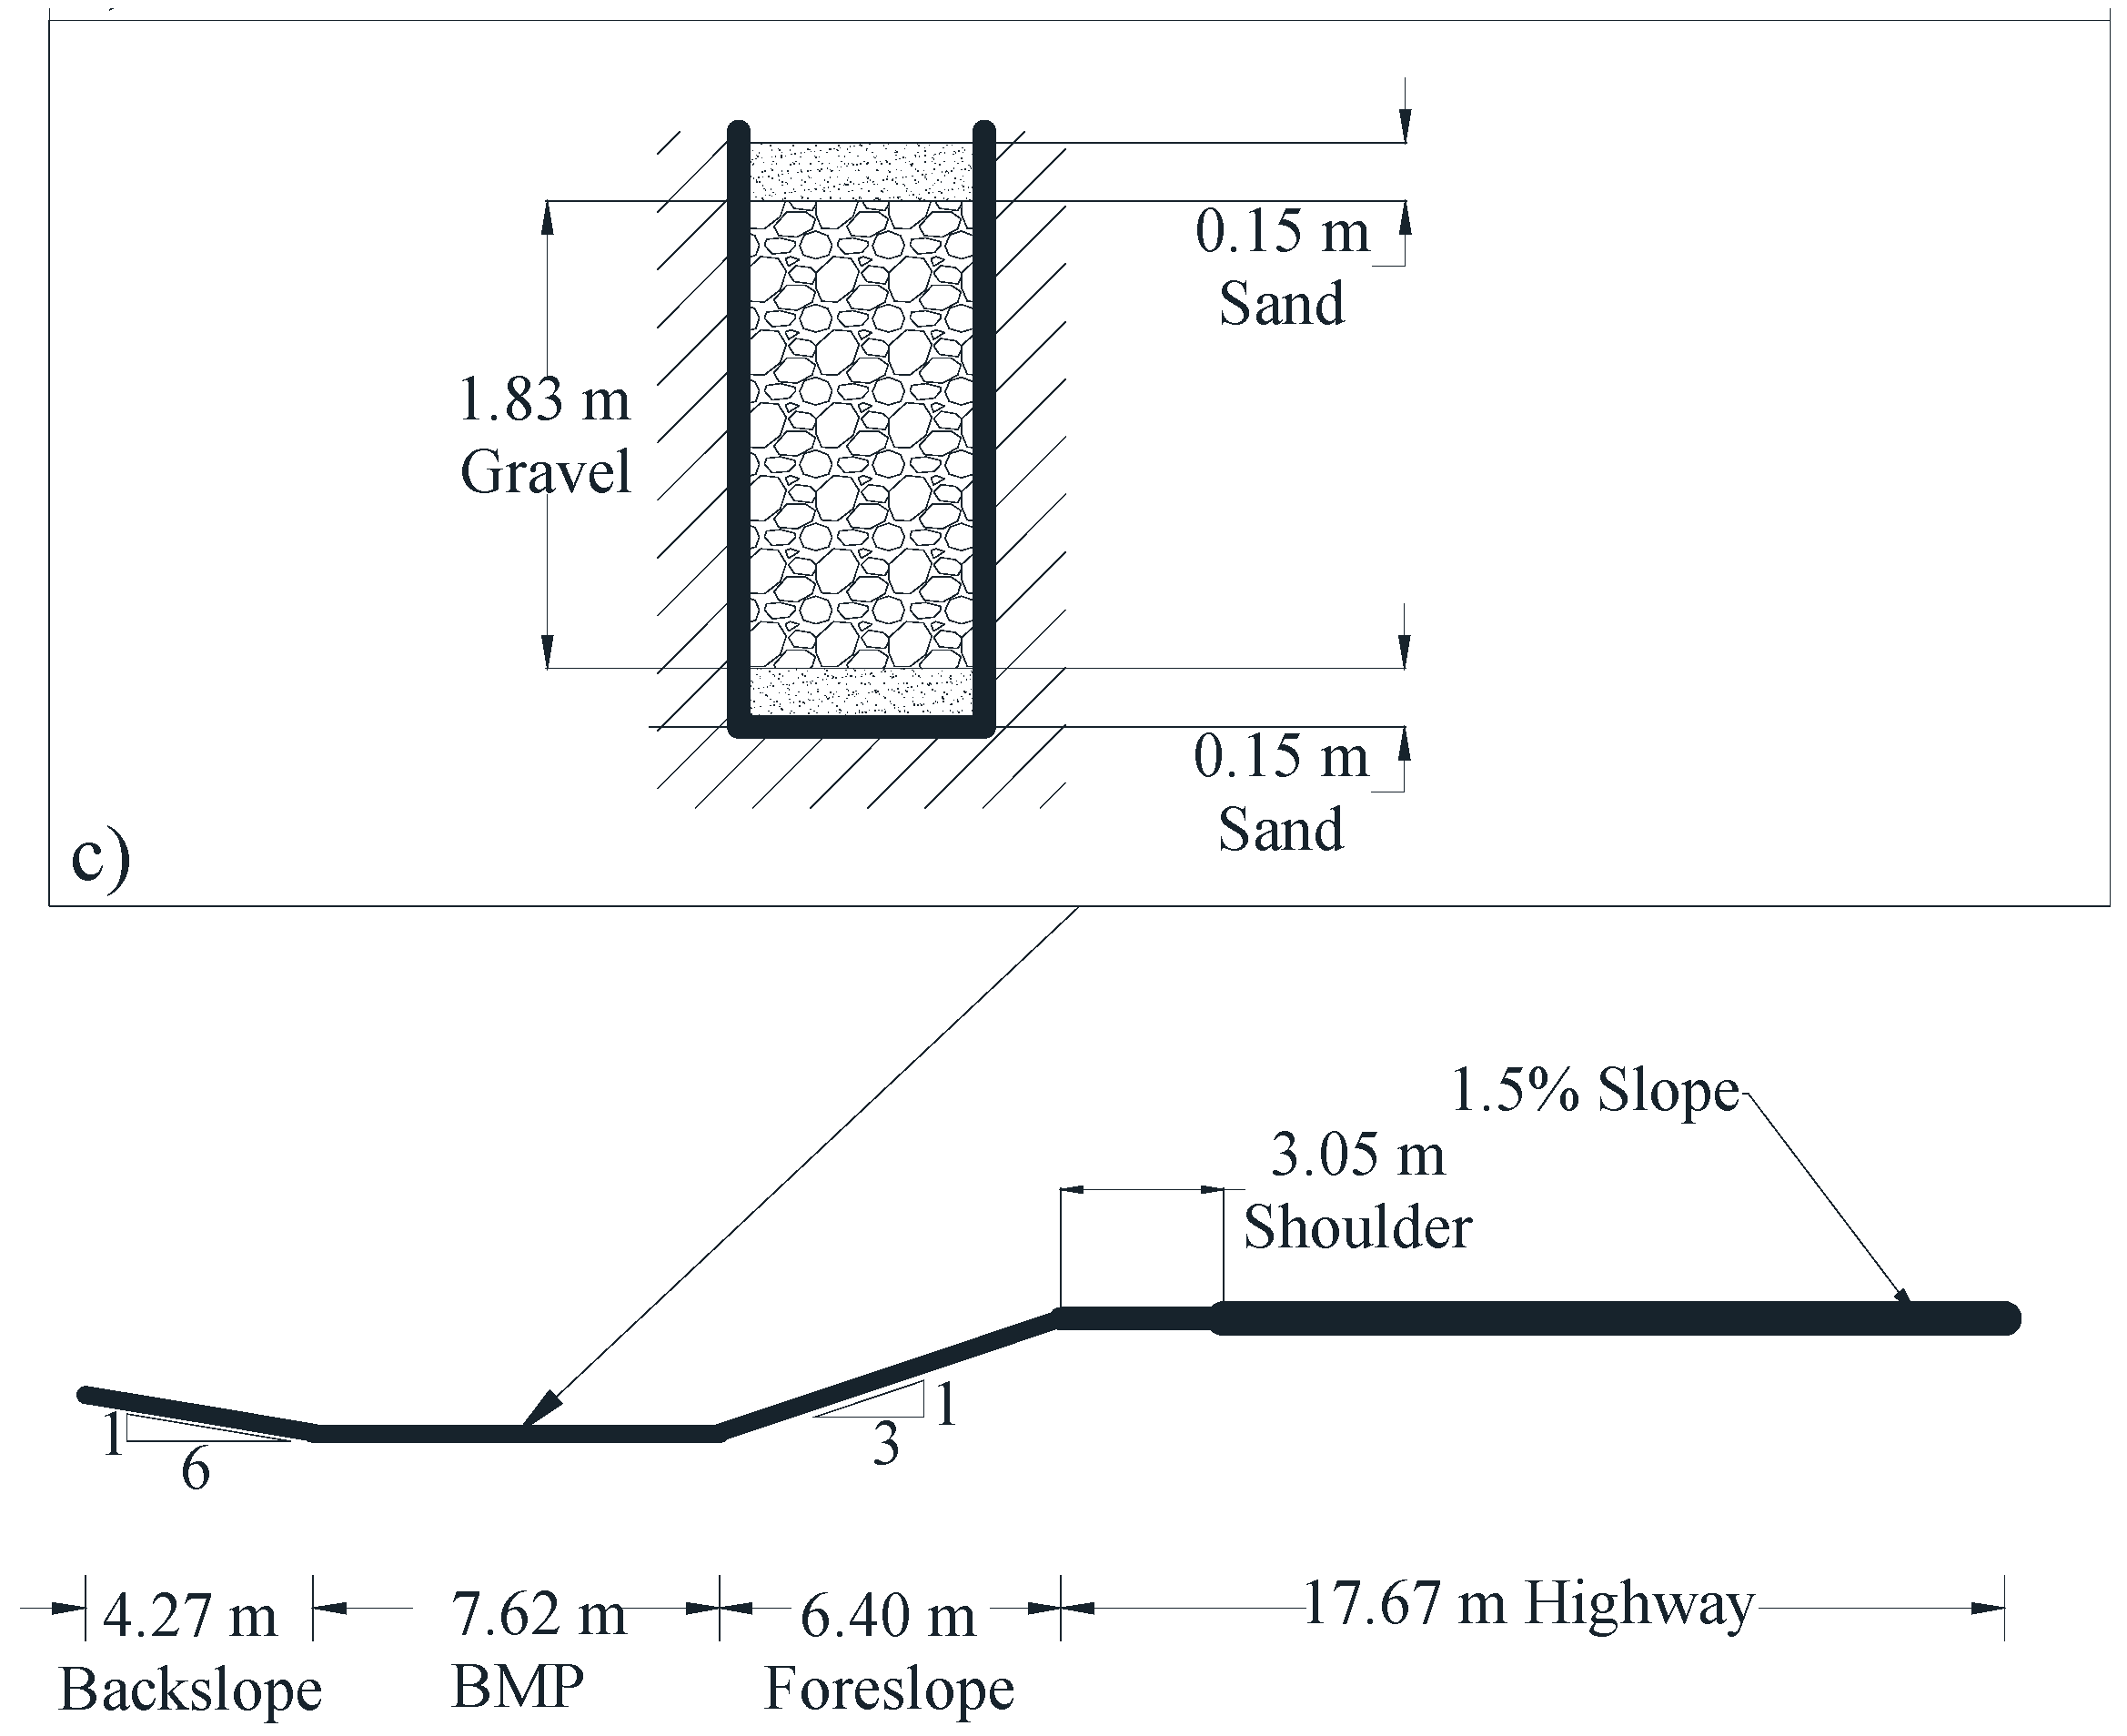
The idealized catchment area consisted of half of a typical eight-lane interstate highway in an urban area and its right of way [16]. Assuming a symmetric condition, simulating one side (inbound or outbound) of the highway was deemed sufficient. BMPs located within the right-of-way were modeled to identify their contribution in reducing stormwater runoff from a 25.4 mm (1 inch) rainfall event. The dimensions of the highway lanes and the 18.3 m (60-ft) adjacent right-of-way including the foreslope, level ground, and backslope which may be covered by vegetation, BMP, or bare soil is shown in Figure 1. A 1.5% typical cross-slope of an interstate highway is used for drainage purposes according to the literature [16,17,18]. The adjacent right-of-way area at the side of the idealized highway (S1) is divided into three subcatchments: foreslope (S2), level ground (S3), and backslope (S4).
The assumed length of the highway in the idealized catchment for this project is 152.4 m (500 ft). A representative 2.1 m (7 ft) high road embankment was considered for the highways. The slope of 3H:1V (33%), 0%, and 6H:1V was assumed for foreslope, level ground, and backslope, respectively [19]. Soil covers from sandy to clayey type material were considered herein.
2.2. Imperviousness and PCSWMM Simulation
Infiltration depends on soil hydrologic conditions and vegetation characteristics at the site. The distribution, amount, and type of vegetation adjacent to highways are important variables for controlling spatial and temporal variations in infiltration and erosion [19]. Turf and native prairie grasses are most commonly used. Prairie grasses have a dense root structure capable of growing to substantial depths below the ground surface.
Not only are the imperviousness characteristics of each class of soil different, but also the imperviousness percentages associated with different vegetation covers (i.e., bare soil, turf grass, and prairie grass) for each type of soil. In order to calibrate the imperviousness percentage for all three soil covers, field tests were conducted in areas that had turf, prairie, and no vegetative cover. Undisturbed soil core samples that were 20 cm (8 inch) in diameter were taken from these field sites. The cores were collected from areas that had silt loam and clay native soils. Permeability tests were performed on core samples as per ASTM D5856. Results demonstrated that the infiltration rate in soils with prairie vegetative cover to soils with turf was about 2.1 and the infiltration rate in soils that had turf cover to the ones covered with no vegetation was 1.3.
Based on these rates and considering the Natural Resources Conservation Service (NRCS) curve numbers (CNs), a series of simulations were conducted to calibrate the imperviousness for various soil types and vegetative covers. For soils, a curve number was interpolated knowing the curve numbers of sand, clay, and silt. Curve numbers for Hydrologic Soil Group (HSG) A and HSG D were assumed for sand and clay soils, respectively. The CN number of Group B and C was averaged in order to obtain the CN number for silt. Consequently, depending on the percentages of silt, clay, and sand, the CN number for each type of soil was calculated and assigned to each soil type.
In order to consider surface cover conditions, as the first step, the CN numbers for “lawn, open space, fair condition” was selected to model turf grass conditions. Then, a series of infiltration simulations with various imperviousness ratios ranging from 0% to 100% for prairie and bare soil conditions were conducted. The ratio of infiltration rates obtained from simulated results was compared to the ones measured for samples recovered from the field. The imperviousness ratio that resulted in same ratio of infiltration rates observed in the field between turf and prairie and turf and bare soil was selected for this study. A summary of resulted imperviousness ratios representing field conditions are shown in Table 1. Since the focus of the study was on infiltration performance of BMPs, the Green-Ampt model [20] was applied to stimulate the infiltration in the PCSWMM (i.e., EPA Storm Water Management Model). This study considered a 25.4-mm (1 inch) type II 24-h storm event [21]. The BMP parameter values are shown in Table 2.
For verification purposes, the modeling methodology and selected parameters were applied to two BMP sites: a bioswale in Virginia and a vegetated filter strip (VFS) in South Carolina. The performances of these BMPs were reported in an international BMP database by providing the inflow from and outflow to the BMP. The runoff volume reduction from simulations were about 20% more than the measured values for both BMPs. The maintenance level and many site specific conditions of these BMPs were not available; therefore, a 20% difference between simulation and field tests is reasonable and expected.
2.3. BMP Characteristics
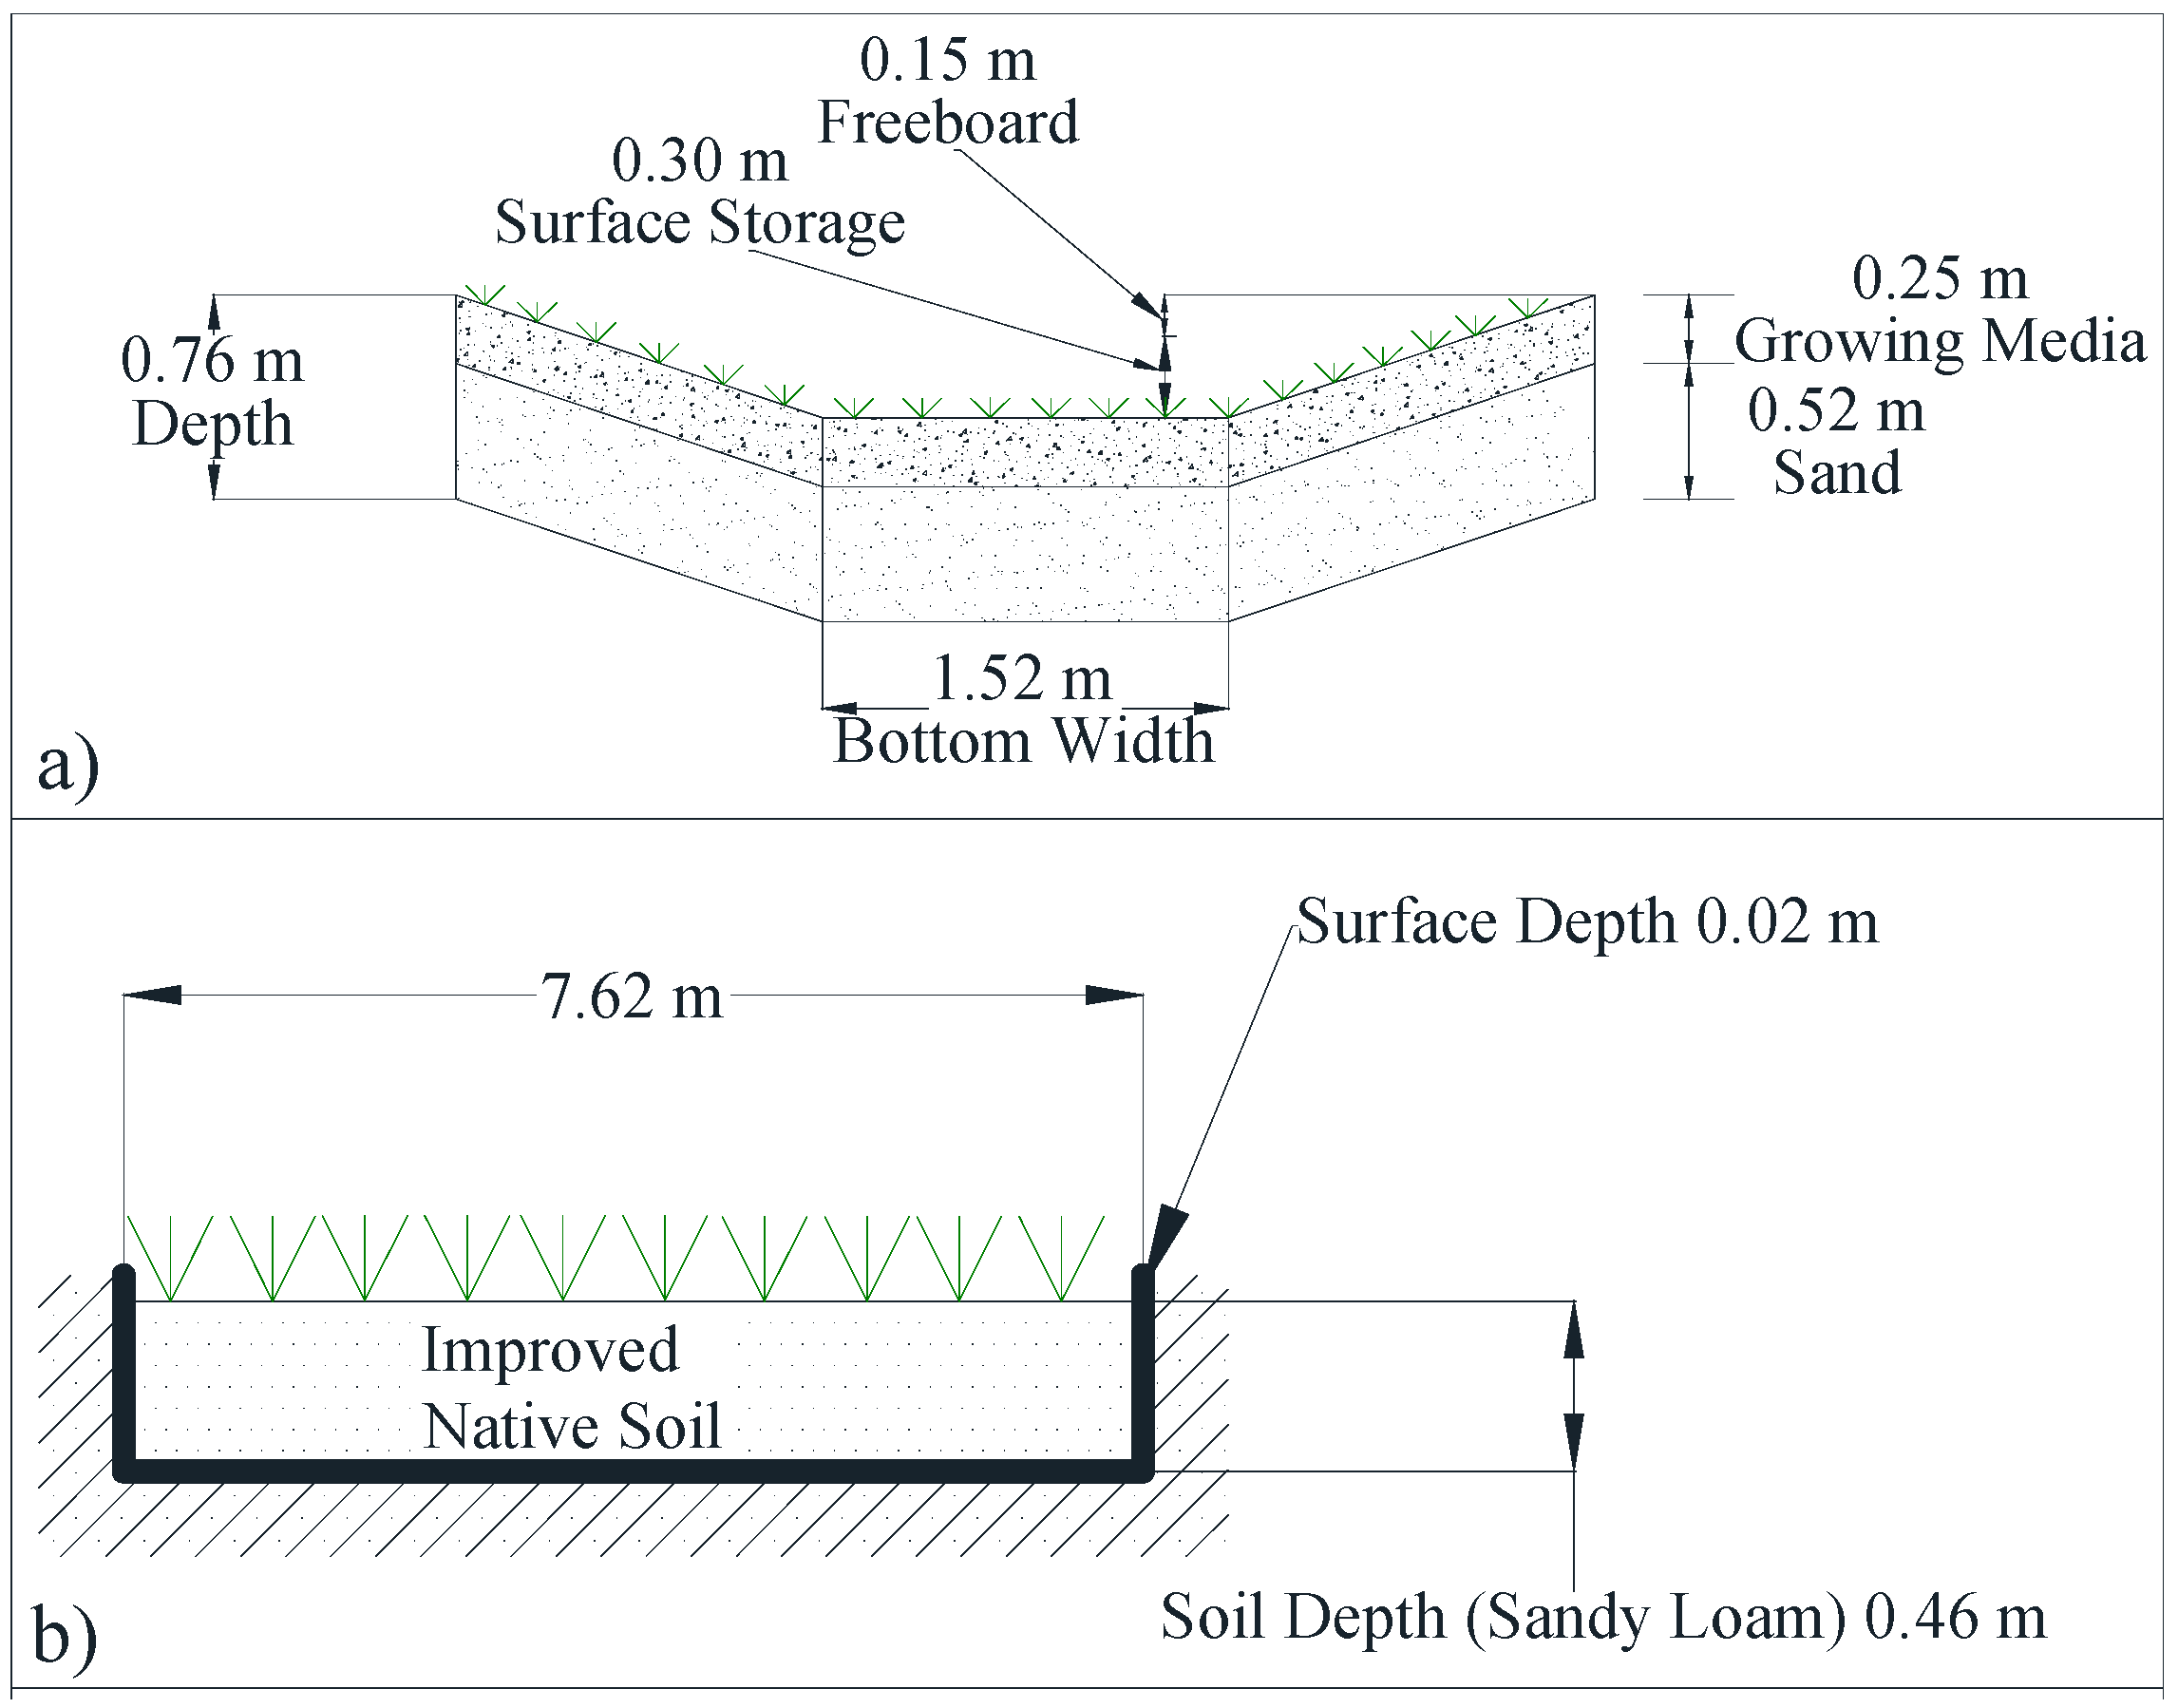
In the pre-BMP scenario in Figure 1, the vegetation cover was represented by turf or prairie grass. No underdrain was considered for the implemented BMPs. As the first step, the BMPs were modeled with typical dimensions reported in the literature [2,22,24,25,26]. These dimensions and cross sections are shown in Figure 2 for a bioswale, infiltration trench, and vegetated filter strip.
3. Construction and Maintenance Cost Considerations
Construction and maintenance costs a play significant role in making optimized decisions. Cost details based on prevailing wage, material, and equipment rates in Illinois in 2015 were broken down into discrete units, adjusted over a range of BMP geometry variations, and compiled into spreadsheet based cost calculators capable of generating BMP unit cost, based on a range of BMP dimensions. To aid in the processing, analysis, and examination of the output data, a post-processor module was developed to perform cost analysis. The parameters which were considered for constructing bioswale were excavation, haul off, growing media, plants and seeds, fabric, drain pipe (if applicable), and supervision. Construction costs for infiltration trench included excavation, haul off, aggregate cost and fabric, drain pipe (if applicable), and supervision. VFS cost was driven by geometry including VFS width and unit price for herbicide, labor, vertical tillage, and seeding. It should be noted that in the cost analyses, the value of land is not taken into account.
Maintenance costs also were considered. For instance, bioswales need to be mown annually to promote mesic plant regrowth and exclude woody plants. Over time bioswale effectiveness may be compromised by accumulated dead vegetation, trash, and surface sediment. Cleanup operations must be performed carefully so as not to disrupt the bioswales’ performance. Based on the cost of BMP construction and maintenance and their capacity in runoff volume reduction, and the goal of the design, engineers or decision makers can choose the type and size of the BMP.
4. Performance Efficiency
To determine the performance efficiency of the studied BMPs, the runoff volume at the outfall point of the idealized catchment was compared with the total input storm volume. The effectiveness of the system in controlling rainfall-produced runoff is determined by:
where P is the input precipitation (e.g., 25.4 mm (1 inch) rainfall) to the catchment area and R is the runoff at the outfall point of the catchment area. The ICPE is the index used to compare the performance of various considered scenarios herein.
4.1. Pre-BMP Conditions
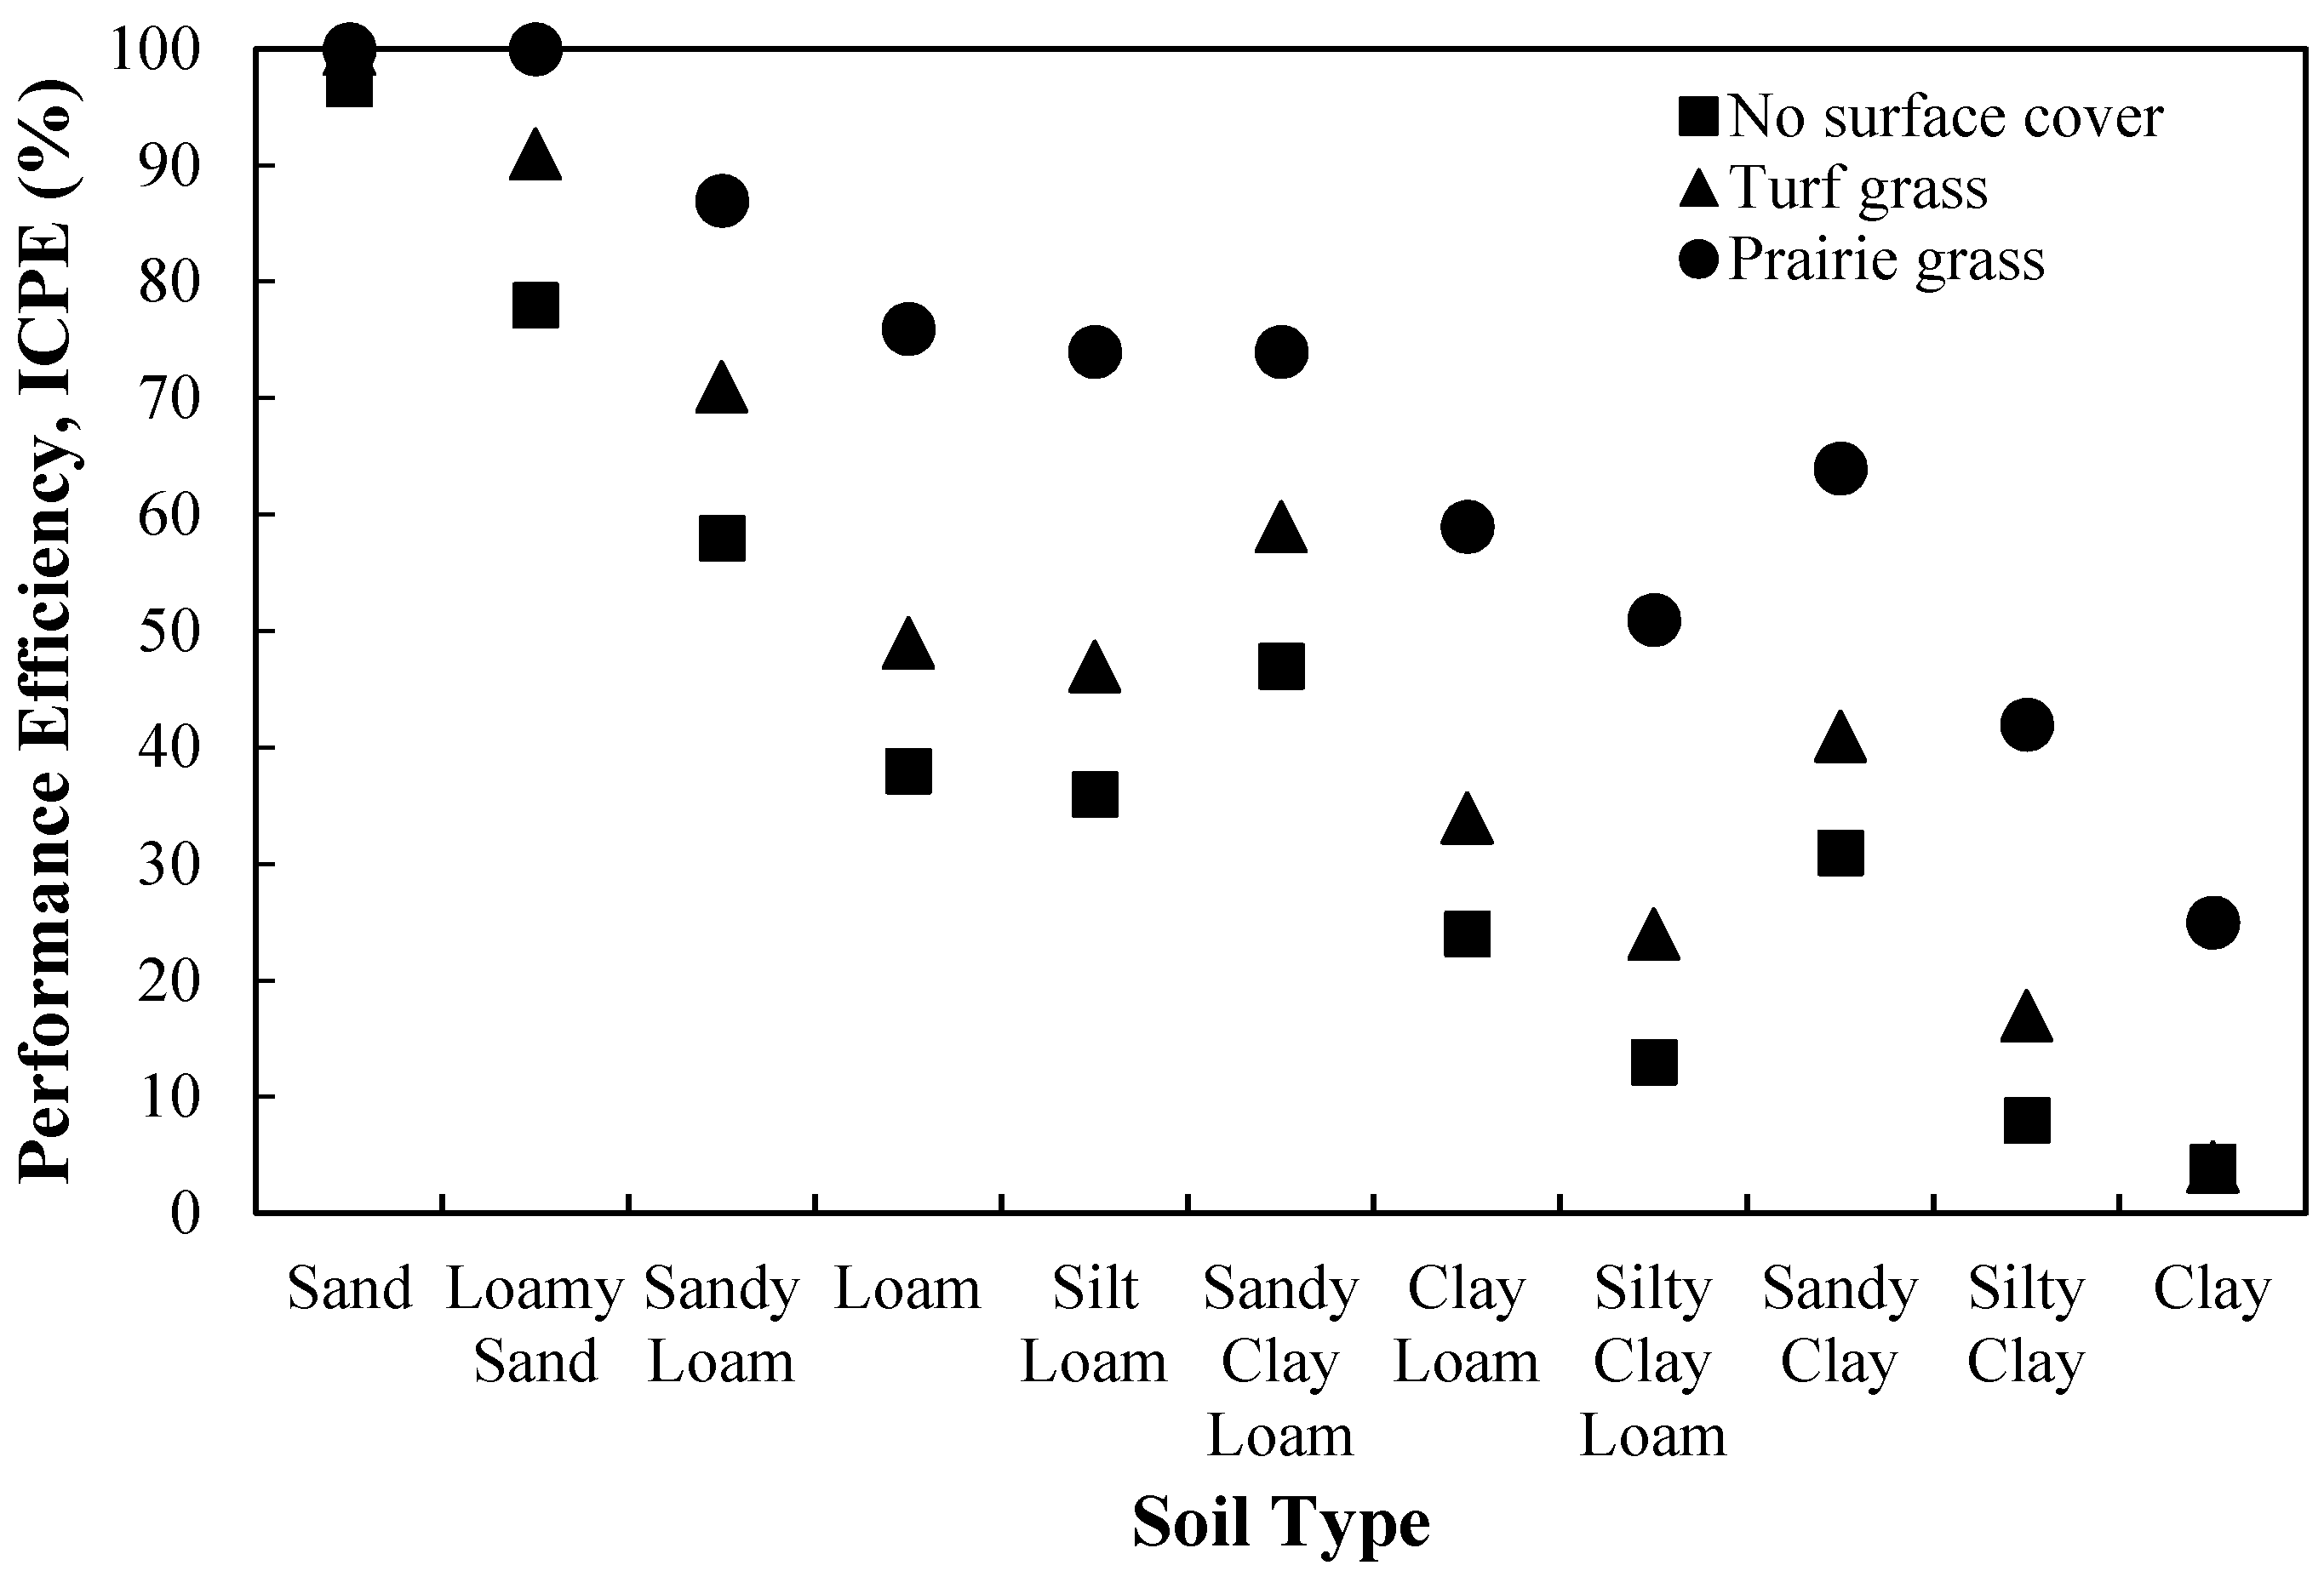
For the pre-BMP conditions, the amount of runoff from the catchment varies depending on the present soil types. Figure 3 illustrates the BMP performance results for pre-BMP conditions with turf, prairie, and no vegetative surface covers. Having vegetation cover on the soil surface resulted in an increase in capturing runoff even in pre-BMP condition. In sites with clayey soil, prairie grass surface cover shows 40% to 80% higher runoff volume reduction capacity than those sites covered by turf grass. For sites with sandy soils, the difference in ICPE of sites with prairie versus turf grass cover is less than 15%. The sites with turf grass cover show slightly more efficiency in capturing a portion of the 25.4 mm (1 inch) of rainfall compared to sites with no surface cover regardless of their in-place soil types. Therefore, even without implementing BMPs and by just using more infiltration friendly grass types in the right of way a significant increase in runoff reduction can be achieved.
4.2. Post-BMP Condition
It is worth noting that the BMPs in this study were simulated without any defects or clogging. Therefore, in an actual site with older BMPs that were not maintained well, the volume reduction efficiency would likely be less than what is presented herein.
4.2.1. Bioswale
As shown in Figure 4, bioswale implementation resulted in average performance efficiency (i.e., ICPE) of 89%, 90%, and 92% in runoff volume reduction from 25.4 mm (1 inch) rainfall, for sites with no vegetated surface cover, turf grass, and prairie grass, respectively. Moreover, the ascending trend of performance efficiency is repeated from clayey to sandy soil type in the range of 85% to 100% regardless of vegetated surface cover. The differences in efficiency among different vegetated covers are not as distinct as for pre-BMP scenarios. This indicates that establishing vegetative covers does not have the magnitude of impact as without BMPs.
4.2.2. Infiltration Trench
Infiltration trenches capture 100% of runoff in any soil type and cover situation unless they are fully saturated. The main challenge with infiltration trenches are their maintenance because if settleable particles and floatable organic materials are not removed from runoff water before it enters the infiltration trench, they clog the BMP. In these cases, removal and/or replacement of all or part of the coarse aggregate is likely [27].
4.2.3. VFS
As shown in Figure 5, the average runoff volume reduction (i.e., ICPE) of 86%, 88%, and 90% is obtained for sites with no vegetative surface cover, turf grass, and prairie grass respectively. In general, the implementation of vegetative filter strips would result in about 5% less performance efficiency in capturing 25.4 mm (1 inch) rainfall compared to bioswales.
5. Maintenance and Construction Costs
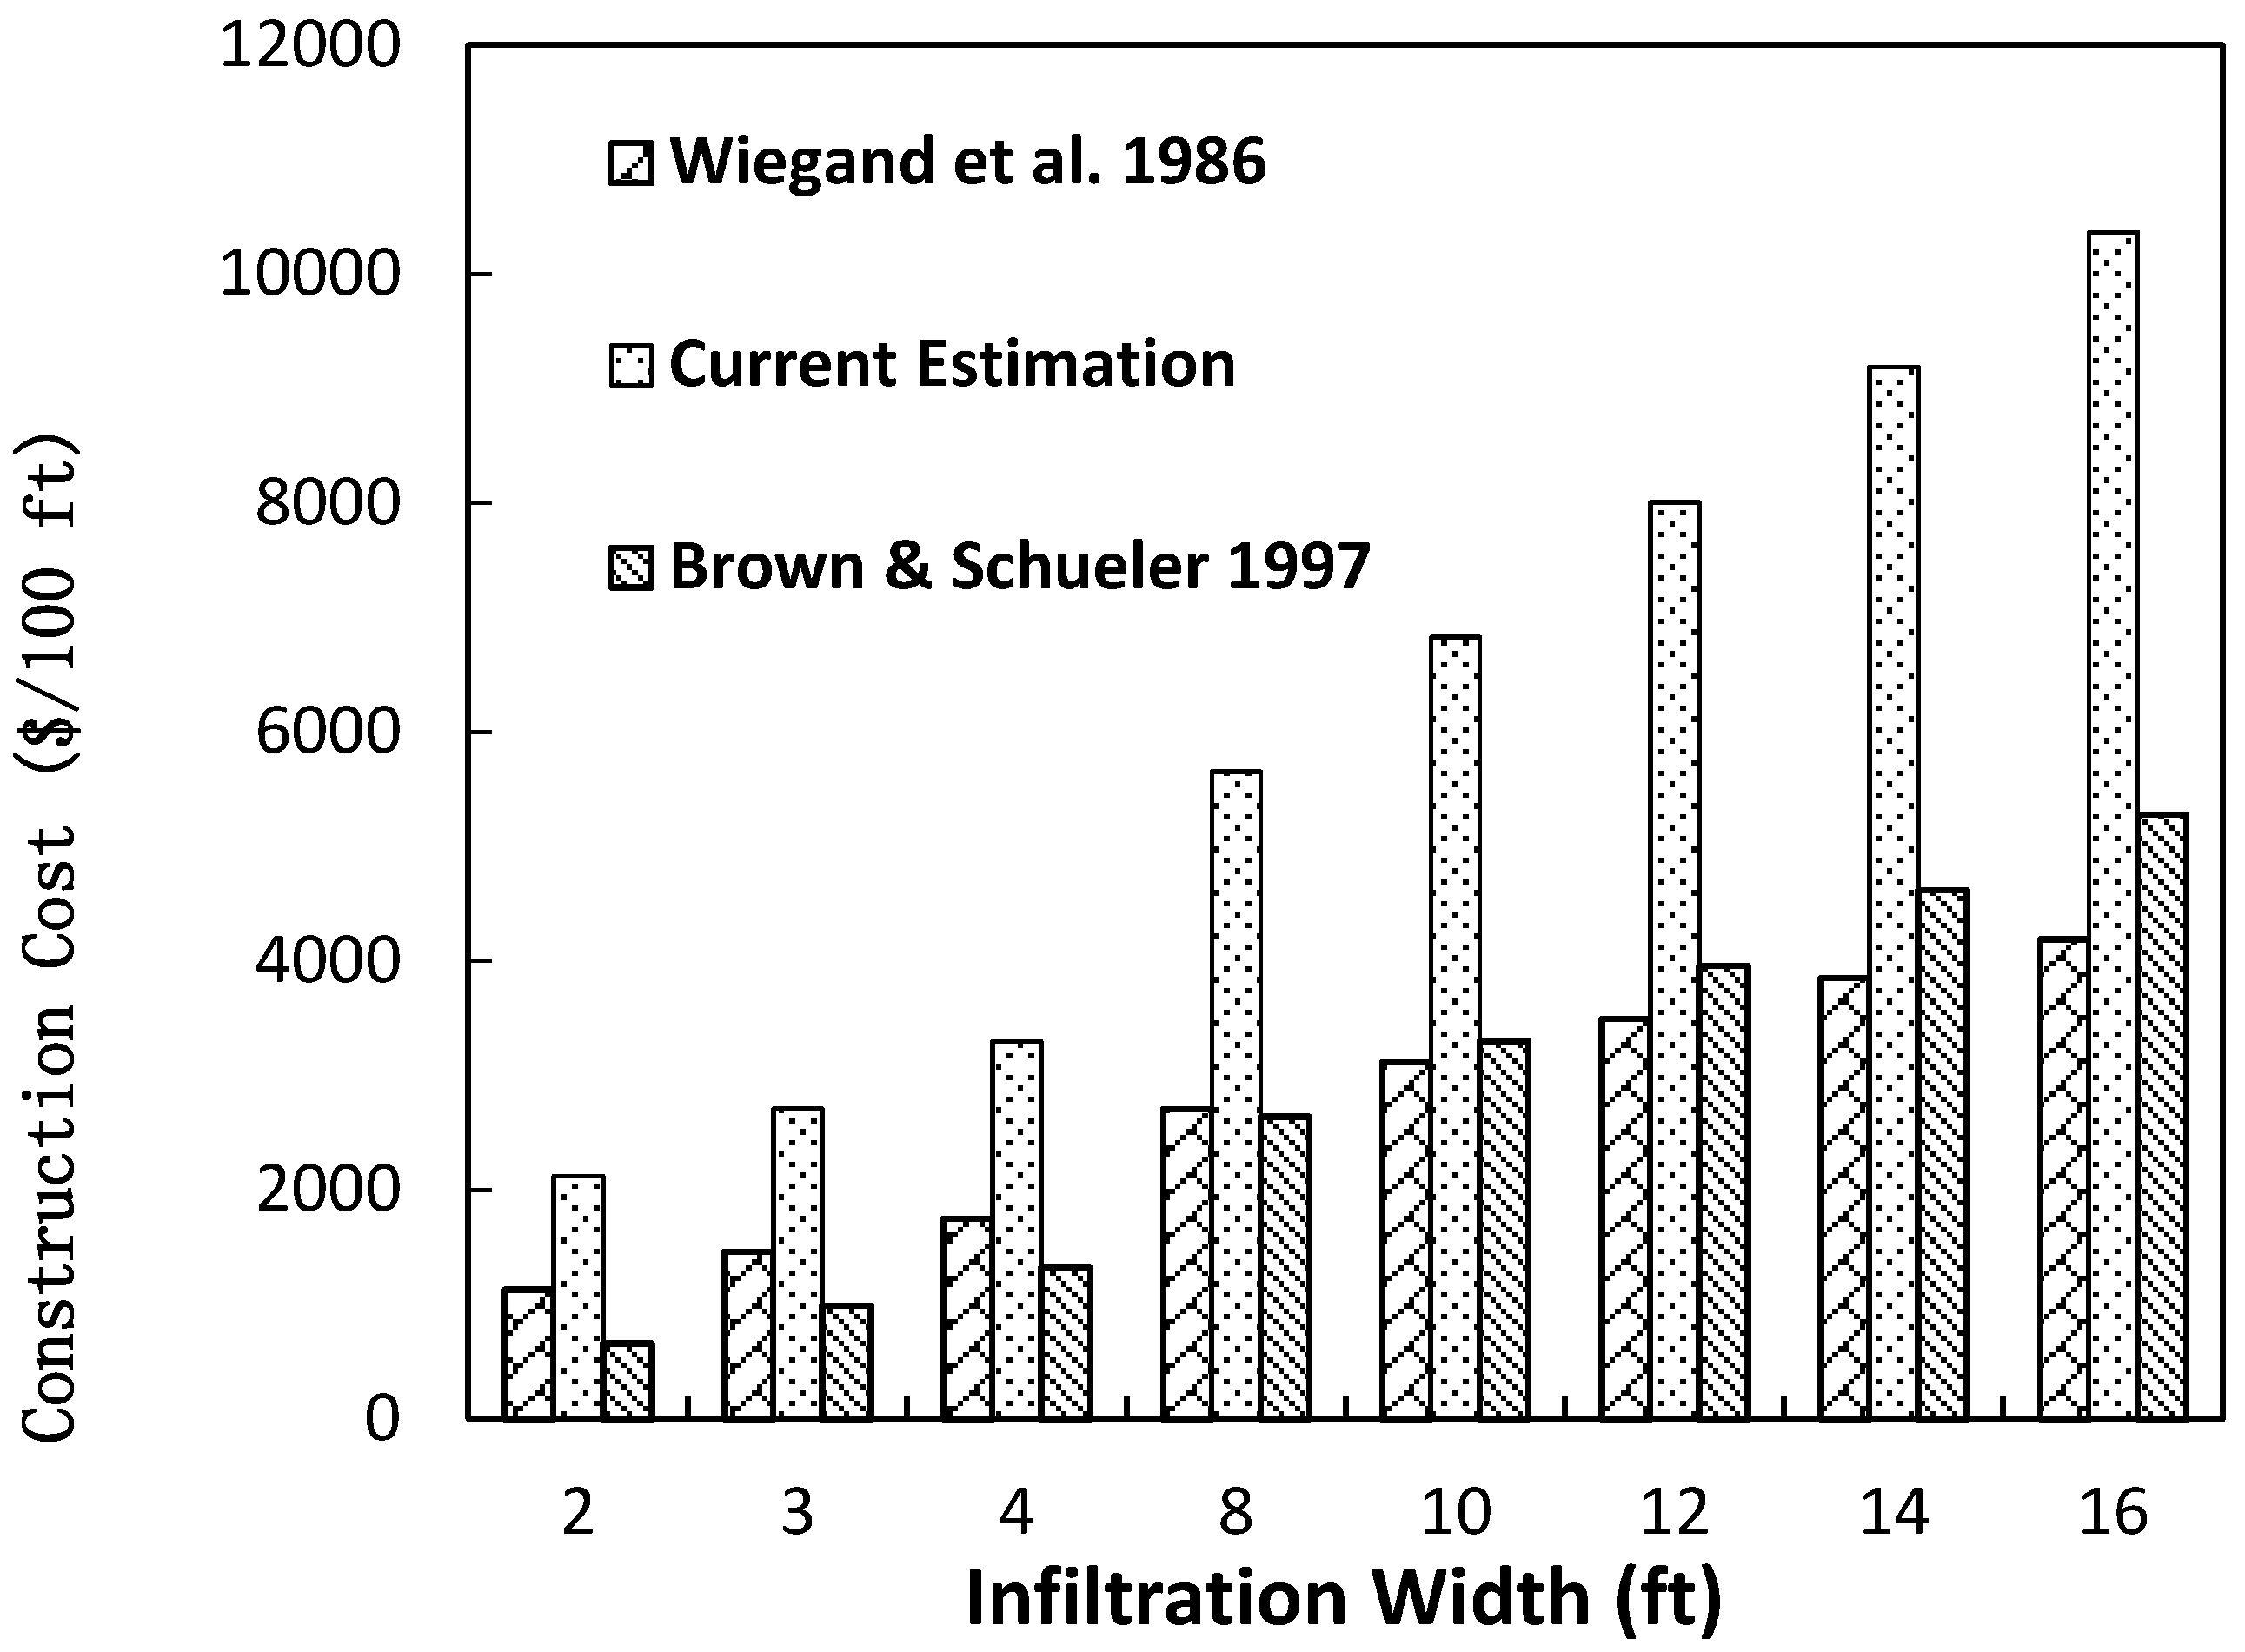
Following the methodology presented earlier, the construction and maintenance cost of the considered BMPs have been determined. The construction cost for a bioswale, infiltration trench, and vegetative filter strip to capture 25.4 mm (1 inch) rainfall per 30 m (100 ft) highway was $16,291, $4379, and $207, respectively. There are some other studies that evaluate the construction costs [2,28], however, any direct comparisons with those studies are difficult as the reported costs are based on volume of constructed BMP without providing detail for what locations and what specifications. Nevertheless, a comparison of the construction cost of infiltration trench in this study with other studies [29,30] is shown in Figure 6.
The maintenance costs of bioswales include mowing and cleanup tasks. A rate of $93 per kilometer for annual mowing costs for bioswale up to 2.7 m wide may be used for planning purposes. For bioswales between 2.7 m (9 ft) and 4.8 m (16 ft) wide mowing costs are estimated at $187 per kilometer. The cleanup task is estimated at $284 per 30 m for bioswales up to 2.4 m (8 ft) wide and $426 for bioswales between 2.7 m (9 ft) and 4.8 m (16 ft) wide. It should be noted that the grass clipping removal was not included in the quotes as this was not practiced for Illinois highways. Therefore, the annual maintenance cost for bioswales is $431 per 30 m of highway, which is about 2.6% of the construction costs.
The maintenance cost of the infiltration trench includes debris removal as well as herbicide applications to control vegetation and maintain the open nature of the infiltration trench surface. Herbicide application may be required up to three times annually to maintain a vegetation free surface. Each herbicide application will cost approximately $37 per kilometer length per 0.3 m width of infiltration trench. Therefore, the annual maintenance cost is about $290 per 30 m of highway, which is about 6.6% of the construction cost.
The maintenance costs of vegetative filter strips should include costs for mowing and inspections for rills and gullies annually to promote stand health, and exclude woody plants and sediment build-up. A side-mounted sickle type or spinning disc type mower is recommended for annual mowing operations. A rate of $137 per hectare may reliably be used for planning purposes for a VFS.
6. BMP Performance and Cost
Since both performance and cost of BMPs are significantly dependent on the magnitude of rainfall, it is very useful for decision makers to know the required sizes that can capture 100% runoff produced by 6.35, 12.7, 19.05, and 25.4 mm (0.25, 0.5, 0.75, and 1 inch) rainfalls. These analyses were conducted using the discussed idealized catchment with a single implemented BMP and assuming silt loam as the soil type and turf grass as surface cover. One of the main contributing parameters in performance of the bioswale and VFS is their widths which correspond to their coverage area for linear projects. For infiltration trenches, the depth of the BMP is considered most relevant. Therefore, the width variable for the bioswale and VFS and the depth variable for the infiltration trench is considered in determining the sizes required to capture all stormwater runoff produced by 6.35, 12.7, 19.05, and 25.4 mm (0.25, 0.5, 0.75, and 1 inch) rainfall from the idealized catchment. Then, the associated cost for construction and maintenance of these BMPs are assessed to allow decision makers and designers to optimally select the appropriate BMPs.
According to Figure 7, a bioswale with a width of 3.6 m (12 ft) to 8.5 m. (28 ft) can capture almost all the runoff produced from a 6.3 mm (0.25 inch) or 12.7 mm (0.5 inch) rainfall event. However, to capture more than 95% of stormwater runoff from 19.05 mm (0.75 inch) rainfall, a minimum top width of 5.5 m (18 ft) is required. Furthermore, to capture 95% of stormwater runoff from 25.4 mm (1 inch) of rainfall, the top width should be 7.9 m (26.3 ft).
As shown in Figure 8, any depth of infiltration trench can capture stormwater produced from 6.3 mm (0.25 inch) and 12.7 mm (0.5 inch) rainfall. However, in order to capture 95% of runoff from 25.4 mm (1 inch) of rainfall, a depth of 0.22 m (0.75 ft) is desired. The associated cost of construction for an infiltration trench is about 25 times less than that of a bioswale. For semiarid areas, the 90-percentile rainfall is less than 25.4 mm (1 inch), this information can be used to identify an optimized width and cost effective BMP. For example, if the target performance efficiency of 90% in 25.4 mm (1 inch) rainfall event is required, a bioswale width of at least 4.3 m (14.3 ft) or an infiltration trench with a depth of 0.15 m (0.5 ft) is required according to Figure 7 and Figure 8. The cost of constructing such a bioswale and infiltration trench is about $16000 and $1000 per 30 m of linear highway, respectively.
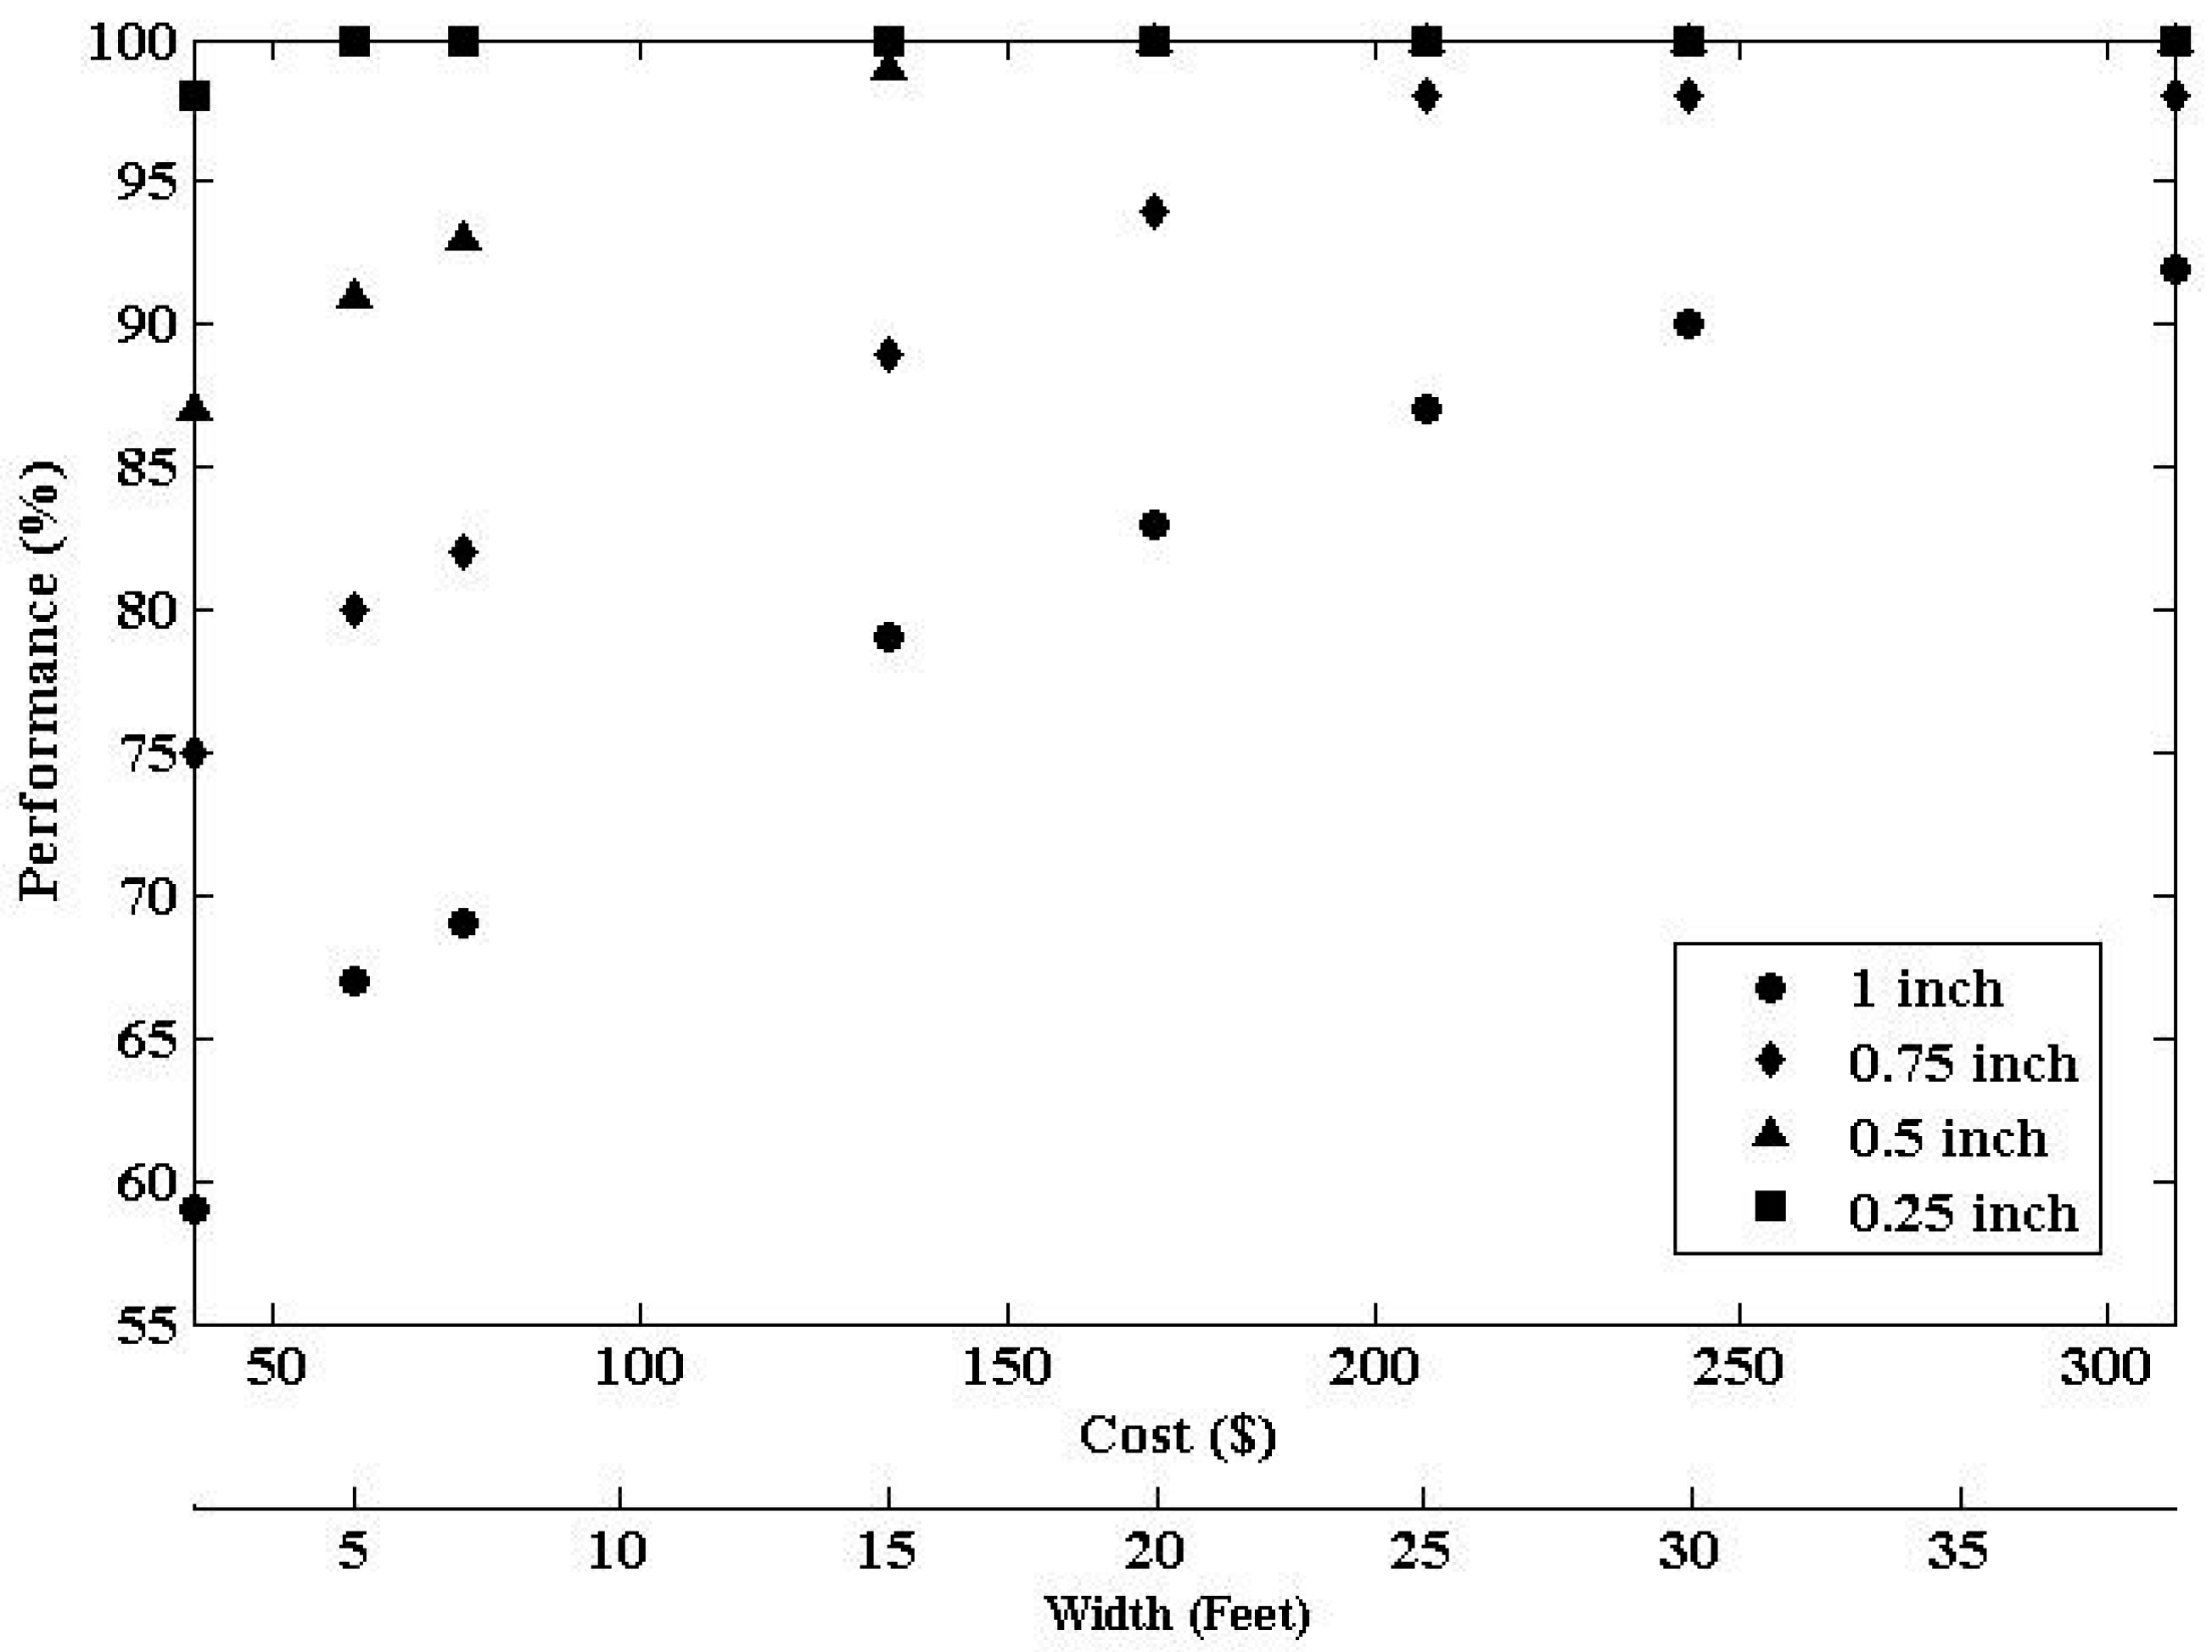
For VFS, as shown in Figure 9, the required width for capturing runoff produced by 6.35, 12.7, 19.05, and 25.4 mm (0.25, 0.5, 0.75, and 1 inch) rainfall are 1.5, 6.1, 9.1, and about 11.9 m (5, 20, 30, and about 39 ft), respectively. The cost of constructing a VFS to capture 95% of runoff produced by 25.4 mm (1 inch) rainfall is about 25% of that for an infiltration trench. The 10-year maintenance cost of a bioswale with 4.26 m (14 ft) top width, infiltration trench with 1 m (3 ft) width, and vegetative filter strip with 7.62 m (25 ft) width is estimated to be about $4000, $4000, and $200 per 30 m (100 ft) of linear of highway. Therefore, the maintenance cost of vegetated filter strips are almost 20 times less than the other two BMPs.
7. Conclusions
This study investigated BMP and vegetative cover performance in reducing stormwater runoff from highways in an urban environment. Three different BMPs (i.e., bioswale, infiltration trench, and vegetated filter strip) and three different vegetative surface cover conditions (i.e., no vegetative surface cover, turf grass, and prairie grass) were considered.
The results show that selection of appropriate vegetative cover even for sites with clays can reduce the stormwater runoff from 25.4 mm rainfall by up to 70%. The analysis showed that prairie grass would reduce more runoff than turf grass. The inclusion of BMPs allowed for more than 85% stormwater runoff reduction, especially for clayey sites. The results shown in this study may slightly overestimate the performance of the simulated BMPs when compared to field observations because factors such as aging and clogging were not considered.
The cost of retaining stormwater runoff produced by 12.7 mm to 25.4 mm rainfall in the considered idealized catchment is maximum and minimum with implementation of bioswales and vegetative filter strips, respectively. The maintenance cost of infiltration trenches and bioswales for the considered idealized catchment is about $4000 per 30 m of linear highway and it is negligible for vegetated filter strips. If sufficient land is available vegetative filter strips are preferred. Infiltration trenches provide the next most economical option because of their lower construction and maintenance cost, however, a very extensive and regular maintenance should be enforced.
Acknowledgments
The authors would like to acknowledge the Illinois Department of Transportation and Illinois Center for Transportation for the support provided for this project.
Author Contributions
Abdolreza Osouli was the lead in conducting research and preparing the manuscript, Azadeh Akhavan Bloorchian conducted the simulations, Mark Grinter oversaw the cost estimate analyses, Aneseh Alborzi conducted the cost estimates, Scott L. Marlow peer-reviewed the research, Laurent Ahiablame and Jianpeng Zhou advised on watershed modeling and storm water runoff modeling.
Conflicts of Interest
The authors declare no conflict of interest.
References
- Post-Development Storm water Runoff Standards (PDSWRS) Workgroup; Association of Illinois Soil and Water Conservation Districts (AISWCD). Stormwater Performance Standards Recommendations; IEPA: Springfield, IL, USA, 2013. [Google Scholar]
- United States Environmental Protection Agency. Preliminary Data Summary of Urban Storm Water Best Management Practices; EPA-821-R-99-012; USAEPA Office of Water: Washington, DC, USA, 1999.
- Strecker, E.; Poresky, A.; Roseen, R.; Soule, J.; Gummadi, V.; Dwivedi, R.; Littleton, C.O. Volume Reduction of Highway Runoff in Urban Areas; National Cooperative Highway Research Program (NCHRP) Report 802; Transportation Research Board (TRB): Washington, DC, USA, 2015. [Google Scholar]
- Hunt, W.; Hathaway, J.; Winston, R.; Jadlocki, S. Runoff Volume Reduction by a Level Spreader–Vegetated Filter Strip System in Suburban Charlotte, N.C. J. Hydrol. Eng. 2010, 15, 499–503. [Google Scholar] [CrossRef]
- Poresky, A.; Bracken, C.; Strecker, E.; Clary, J. International Stormwater Best Management Practices (BMP) Database, Technical Summary: Volume Reduction; GeoSyntec Consultants: Boca Raton, FL, USA; Wright Water Engineers, Inc.: Denver, CO, USA, 2011. [Google Scholar]
- Schmitt, T.J.; Dosskey, M.G.; Hoagland, K.D. Filter strip performance and processes for different vegetation, widths, and contaminants. J. Environ. Qual. 1999, 28, 1479–1489. [Google Scholar] [CrossRef]
- California Department of Transportation. BMP Retrofit Pilot Program Final Report; CTSW-RT 01-050; California Department of Transportation: Sacramento, CA, USA, 2004.
- GeoSyntec Consultant. Post-Construction BMP Technical Guidance Manual, Storm Water BMP Guidance Manual, City of Santa Barbara; GeoSyntec Consultant: Boca Raton, FL, USA, 2008. [Google Scholar]
- Clary, J.; Leisenring, M.; Quigley, M.; Jones, J.; Strecker, E. International Stormwater Best Management Practices (BMP) Database Narrative Overview of BMP Database Study Characteristics; Wright Water Engineers, Inc.: Denver, CO, USA; GeoSyntec Consultant: Boca Raton, FL, USA, 2012. [Google Scholar]
- Abi Aad, M.; Suidan, M.; Shuster, W. Modeling techniques of Best Management Practices: Rain barrels and rain gardens using EPA SWMM-5. J. Hydrol. Eng. 2010, 15, 434–443. [Google Scholar] [CrossRef]
- Ackerman, D.; Stein, E.D. Evaluating the effectiveness of best management practices using dynamic modeling. J. Environ. Eng. 2008, 134, 628–639. [Google Scholar] [CrossRef]
- Ahiablame, L.M.; Engel, B.A.; Chaubey, I. Representation and evaluation of low impact development practices with L-THIA-LID: An example for site planning. Environ. Pollut. 2012, 1, 1. [Google Scholar] [CrossRef]
- Liu, Y.; Ahiablame, L.M.; Bralts, V.F.; Engel, B.A. Enhancing a rainfall-runoff model to assess the impacts of BMPs and LID practices on storm runoff. J. Environ. Manag. 2015, 147, 12–23. [Google Scholar] [CrossRef] [PubMed]
- Sun, Y.W.; Li, Q.Y.; Liu, L.; Xu, C.D.; Liu, Z.P. Hydrological simulation approaches for BMPs and LID practices in highly urbanized area and development of hydrological performance indicator system. Water Sci. Eng. 2014, 7, 143–154. [Google Scholar]
- Zimmerman, M.J.; Barbaro, J.R.; Sorenson, J.R.; Waldron, M.C. Effects of Selected Low-Impact-Development (LID) Techniques on Water Quality and Quantity in the Ipswich River Basin, Massachusetts—Field and Modeling Studies; U.S. Geological Survey Scientific Investigations Report 2010-5007; U.S. Geological Survey: Reston, VA, USA, 2010; p. 113.
- American Association of State Highway and Transportation Officials (AASHTO). A Policy All Design Standards Interstate System; Standing Committee on Highways AASHTO Highway Subcommittee on Design Technical Committee on Geometric Design; AASHTO: Washington, DC, USA, 2005. [Google Scholar]
- Harwood, D.W.; Hutton, J.M.; Fees, C.; Bauer, K.M.; Glen, A.; Ouren, H. Evaluation of the 13 Controlling Criteria for Geometric Design; NCHRP 783, No. Project 17-53; NCHRP: Washington, DC, USA, 2014. [Google Scholar]
- Roess, R.P.; Prasses, E.S.; McShane, W.R. Traffic Engineering, 4th ed.; Prentice Hall: Upper Saddle River, NJ, USA, 2011. [Google Scholar]
- Pellant, M.; Shaver, P.; Pyke, D.A.; Herrick, J.E. Interpreting Indicators of Rangeland Health, Version 4. Technical Reference 1734-6; BLM/WO/ST-00/001+1734/REV05; U.S. Department of the Interior, Bureau of Land Mangement, National Science and Technology Center: Denver, CO, USA, 2005; p. 122.
- Lee, R. Modeling Infiltration in a Stormwater Control Measure Using Modified Green. Master’s Thesis, Villanova University, Villanova, PA, USA, 2011. [Google Scholar]
- McCuen, R. Hydralogic Analysis and Design, 3rd ed.; Pearson: London, UK, 2005. [Google Scholar]
- James, W.; Rossman, L.E.; James, W.R. User’s Guide to SWMM 5, 13th ed.; CHI Press Publication: Guelph, ON, Canada, 2010. [Google Scholar]
- Urban Drainage and Flood Control District (UDFCD). Urban Strom Drainage-Criteria Manual—Volume 1: Management, Hydrology, and Hydraulics; Urban Drainage and Flood Control District: Denver, CO, USA, 2008. [Google Scholar]
- 2IM Group, LLG. I-294 Tri-State Tollway Bioswale Stormwater/Water Quality Treatment from TOUHY Avenue to Sanders Road Overpass Contract Plans; The Illinois State Toll Highway Authority: Downers Grove, IL, USA, 2009; Volumes I and II. [Google Scholar]
- Department of Environmental Resources, Programs and Planning Division. Low-Impact Development Design Strategies: An Integrated Design Approach; Department of Environmental Resources, Programs and Planning Division: Prince George County, MD, USA, 1999.
- Southeast Michigan Council of Governments (SEMCOG). Low Impact Development Manual for Michigan, a Design Guide for Implementers and Reviewers; Southeast Michigan Council of Governments: Detroit, MI, USA, 2008.
- Illinois Environmental Protection Agency; US Department of Agriculture. Illinois Urban Manual: A Technical Manual Designed for Urban Ecosystem Protection and Enhancement; Illinois Environmental Protection Agency: Springfield, IL, USA, 2002.
- Weiss, P.T.; Gulliver, J.S.; Erickson, A.J. Cost and Pollutant Removal of Storm-Water Treatment Practices. J. Water Resour. Plan. Manag. 2007, 133, 218–229. [Google Scholar] [CrossRef]
- Wiegand, C.; Schueler, T.; Chittenden, W; Jellick, D. Cost of Urban Runoff Controls. Urban Runoff Quality Impact and Quality Enhancement Technology. In Proceedings of the Engineering Foundation Conference, Henniker, NH, USA, 22–27 June 1986. [Google Scholar]
- Brown, W.; Schueler, T. The Economics of Storm Water BMPs in the Mid-Atlantic Region; Center for Watershed Protection: Silver Spring, MD, USA, 1997.
Figure 1.
Idealized catchment for highway runoff modeling. The adjacent right-of-way area at the side of the idealized highway (S1) is divided into three subcatchments: foreslope (S2), level ground (S3), and backslope (S4).
Figure 1.
Idealized catchment for highway runoff modeling. The adjacent right-of-way area at the side of the idealized highway (S1) is divided into three subcatchments: foreslope (S2), level ground (S3), and backslope (S4).
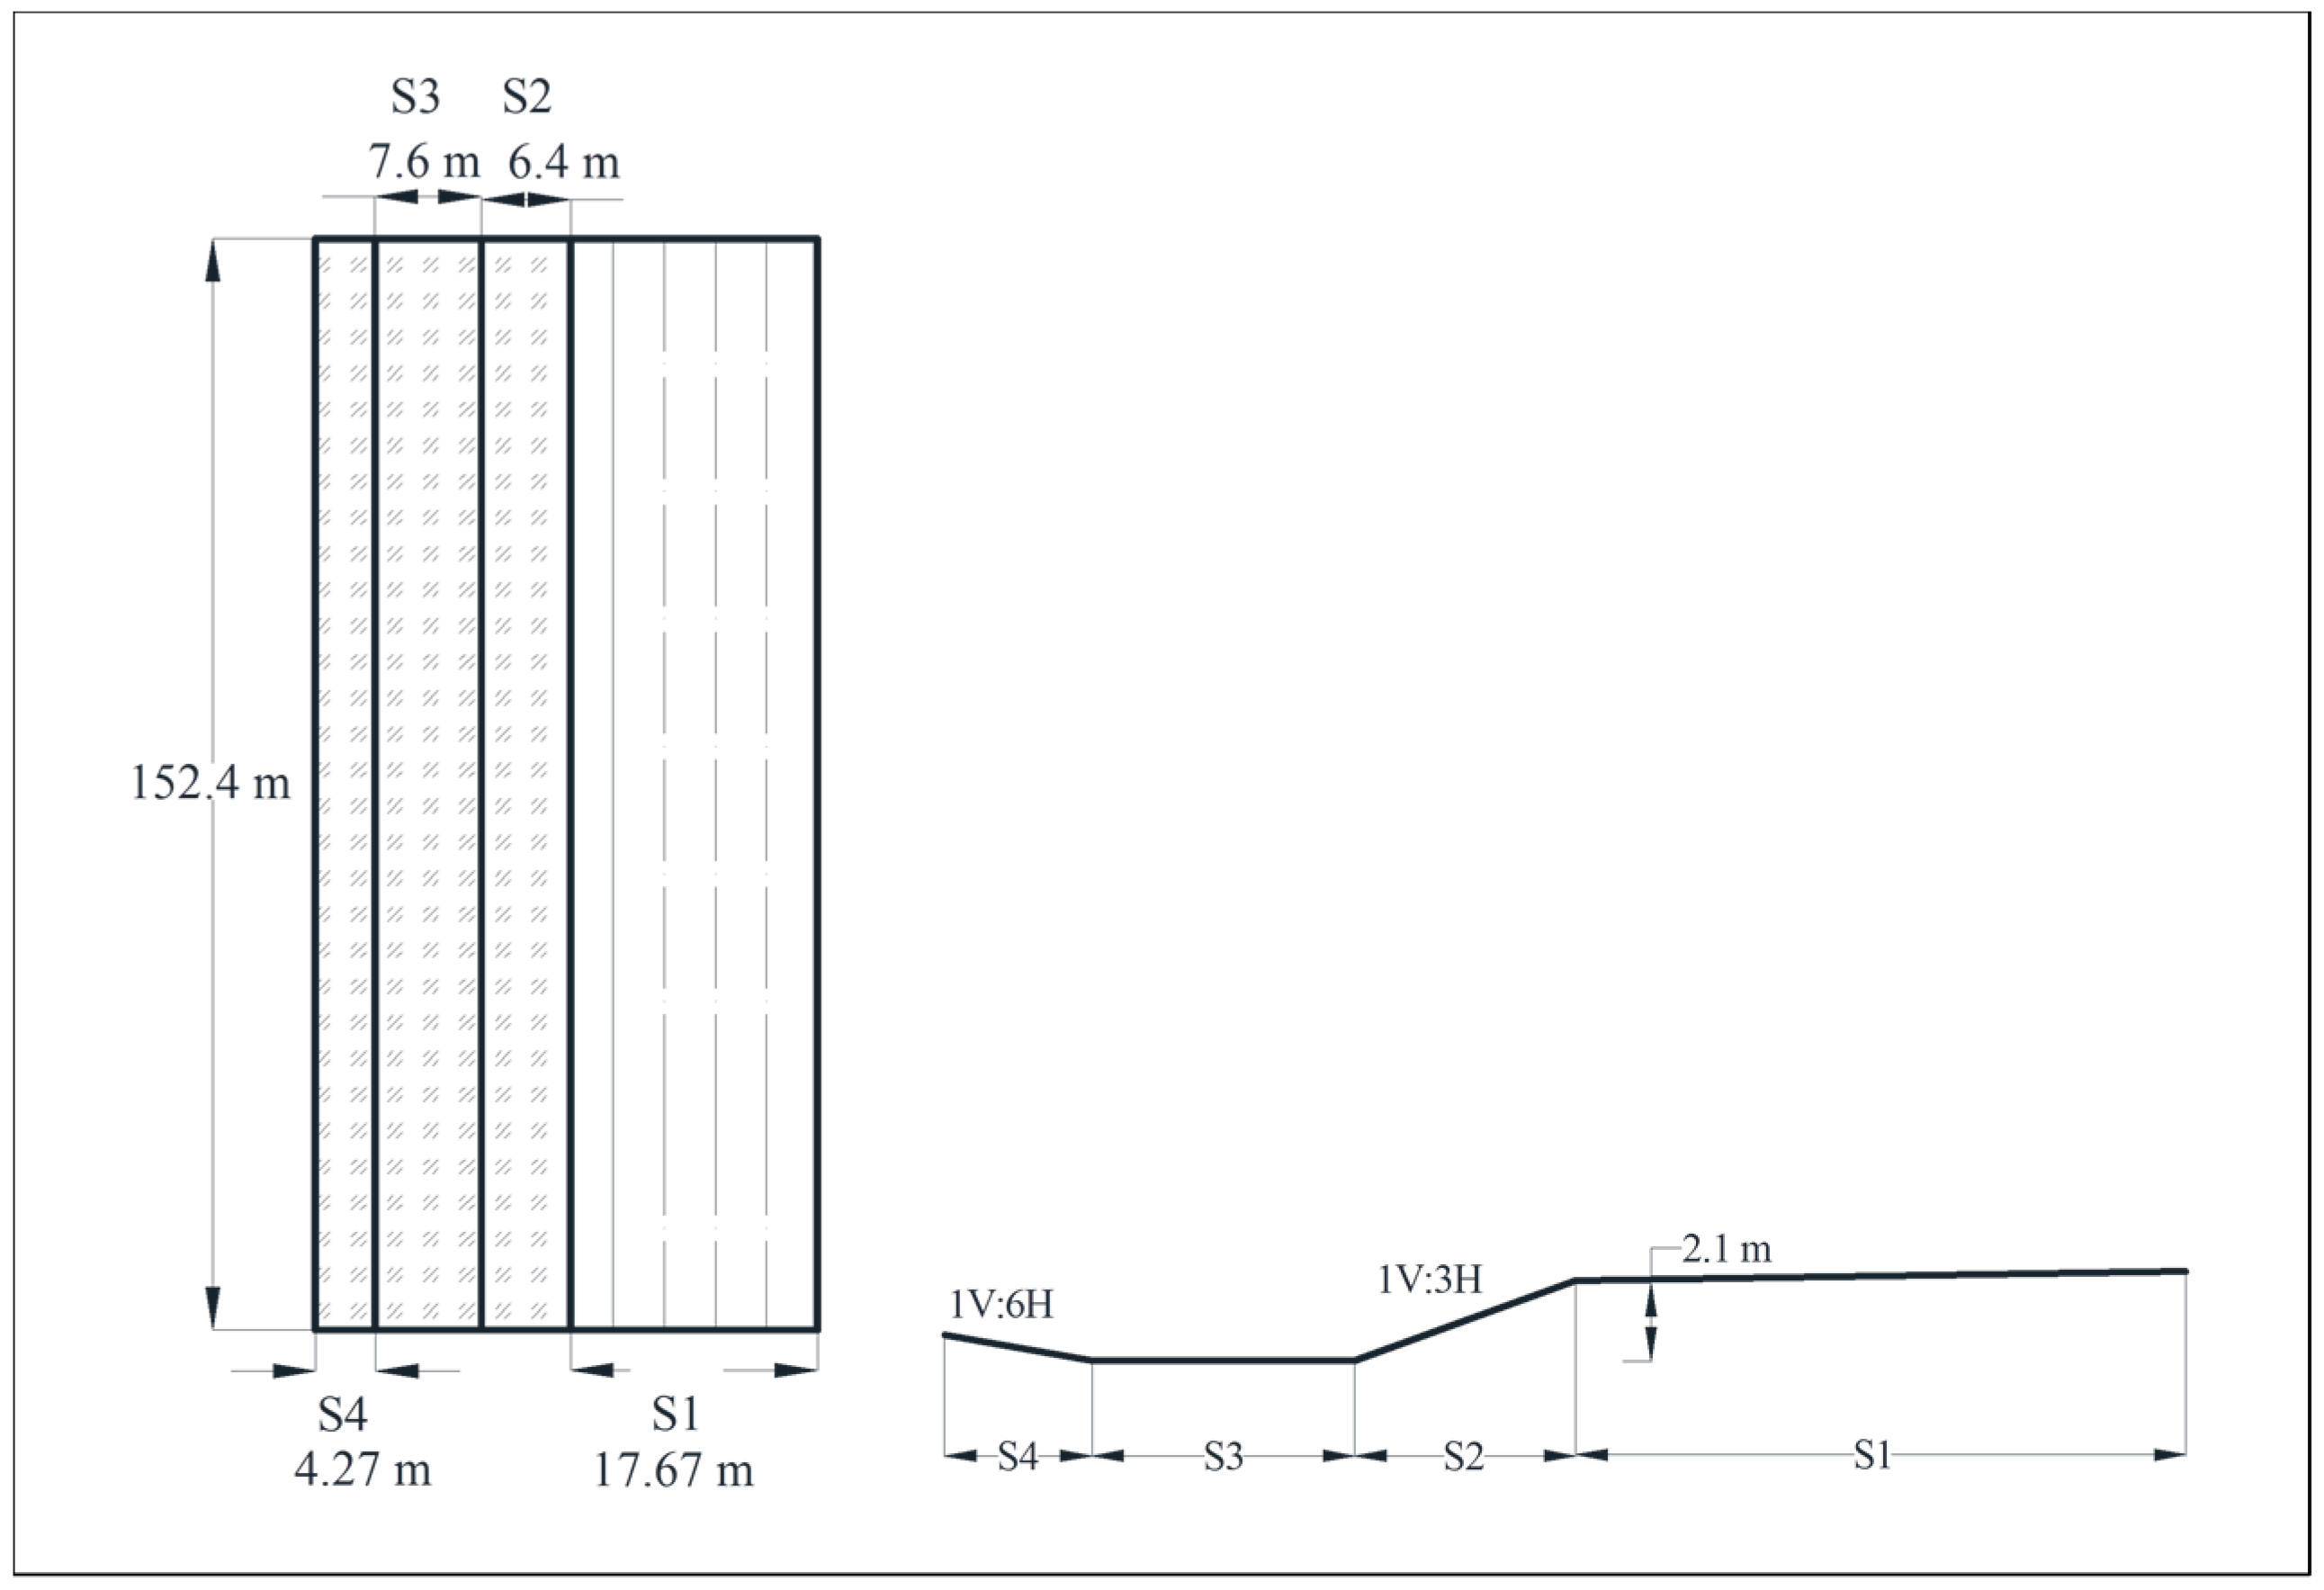
Figure 2.
Schematic cross-section of idealized catchment area with (a) bioswale, (b) vegetated filter strip (VFS), (c) 0.9 m (3 ft) wide infiltration trench as BMP.
Figure 2.
Schematic cross-section of idealized catchment area with (a) bioswale, (b) vegetated filter strip (VFS), (c) 0.9 m (3 ft) wide infiltration trench as BMP.


Figure 3.
Runoff volume reduction performance in pre-BMPcondition. ICPE, idealized catchment performance efficiency.
Figure 3.
Runoff volume reduction performance in pre-BMPcondition. ICPE, idealized catchment performance efficiency.

Figure 4.
The ICPE value for idealized catchment with bioswale and different soil surface covers on right-of-way.
Figure 4.
The ICPE value for idealized catchment with bioswale and different soil surface covers on right-of-way.
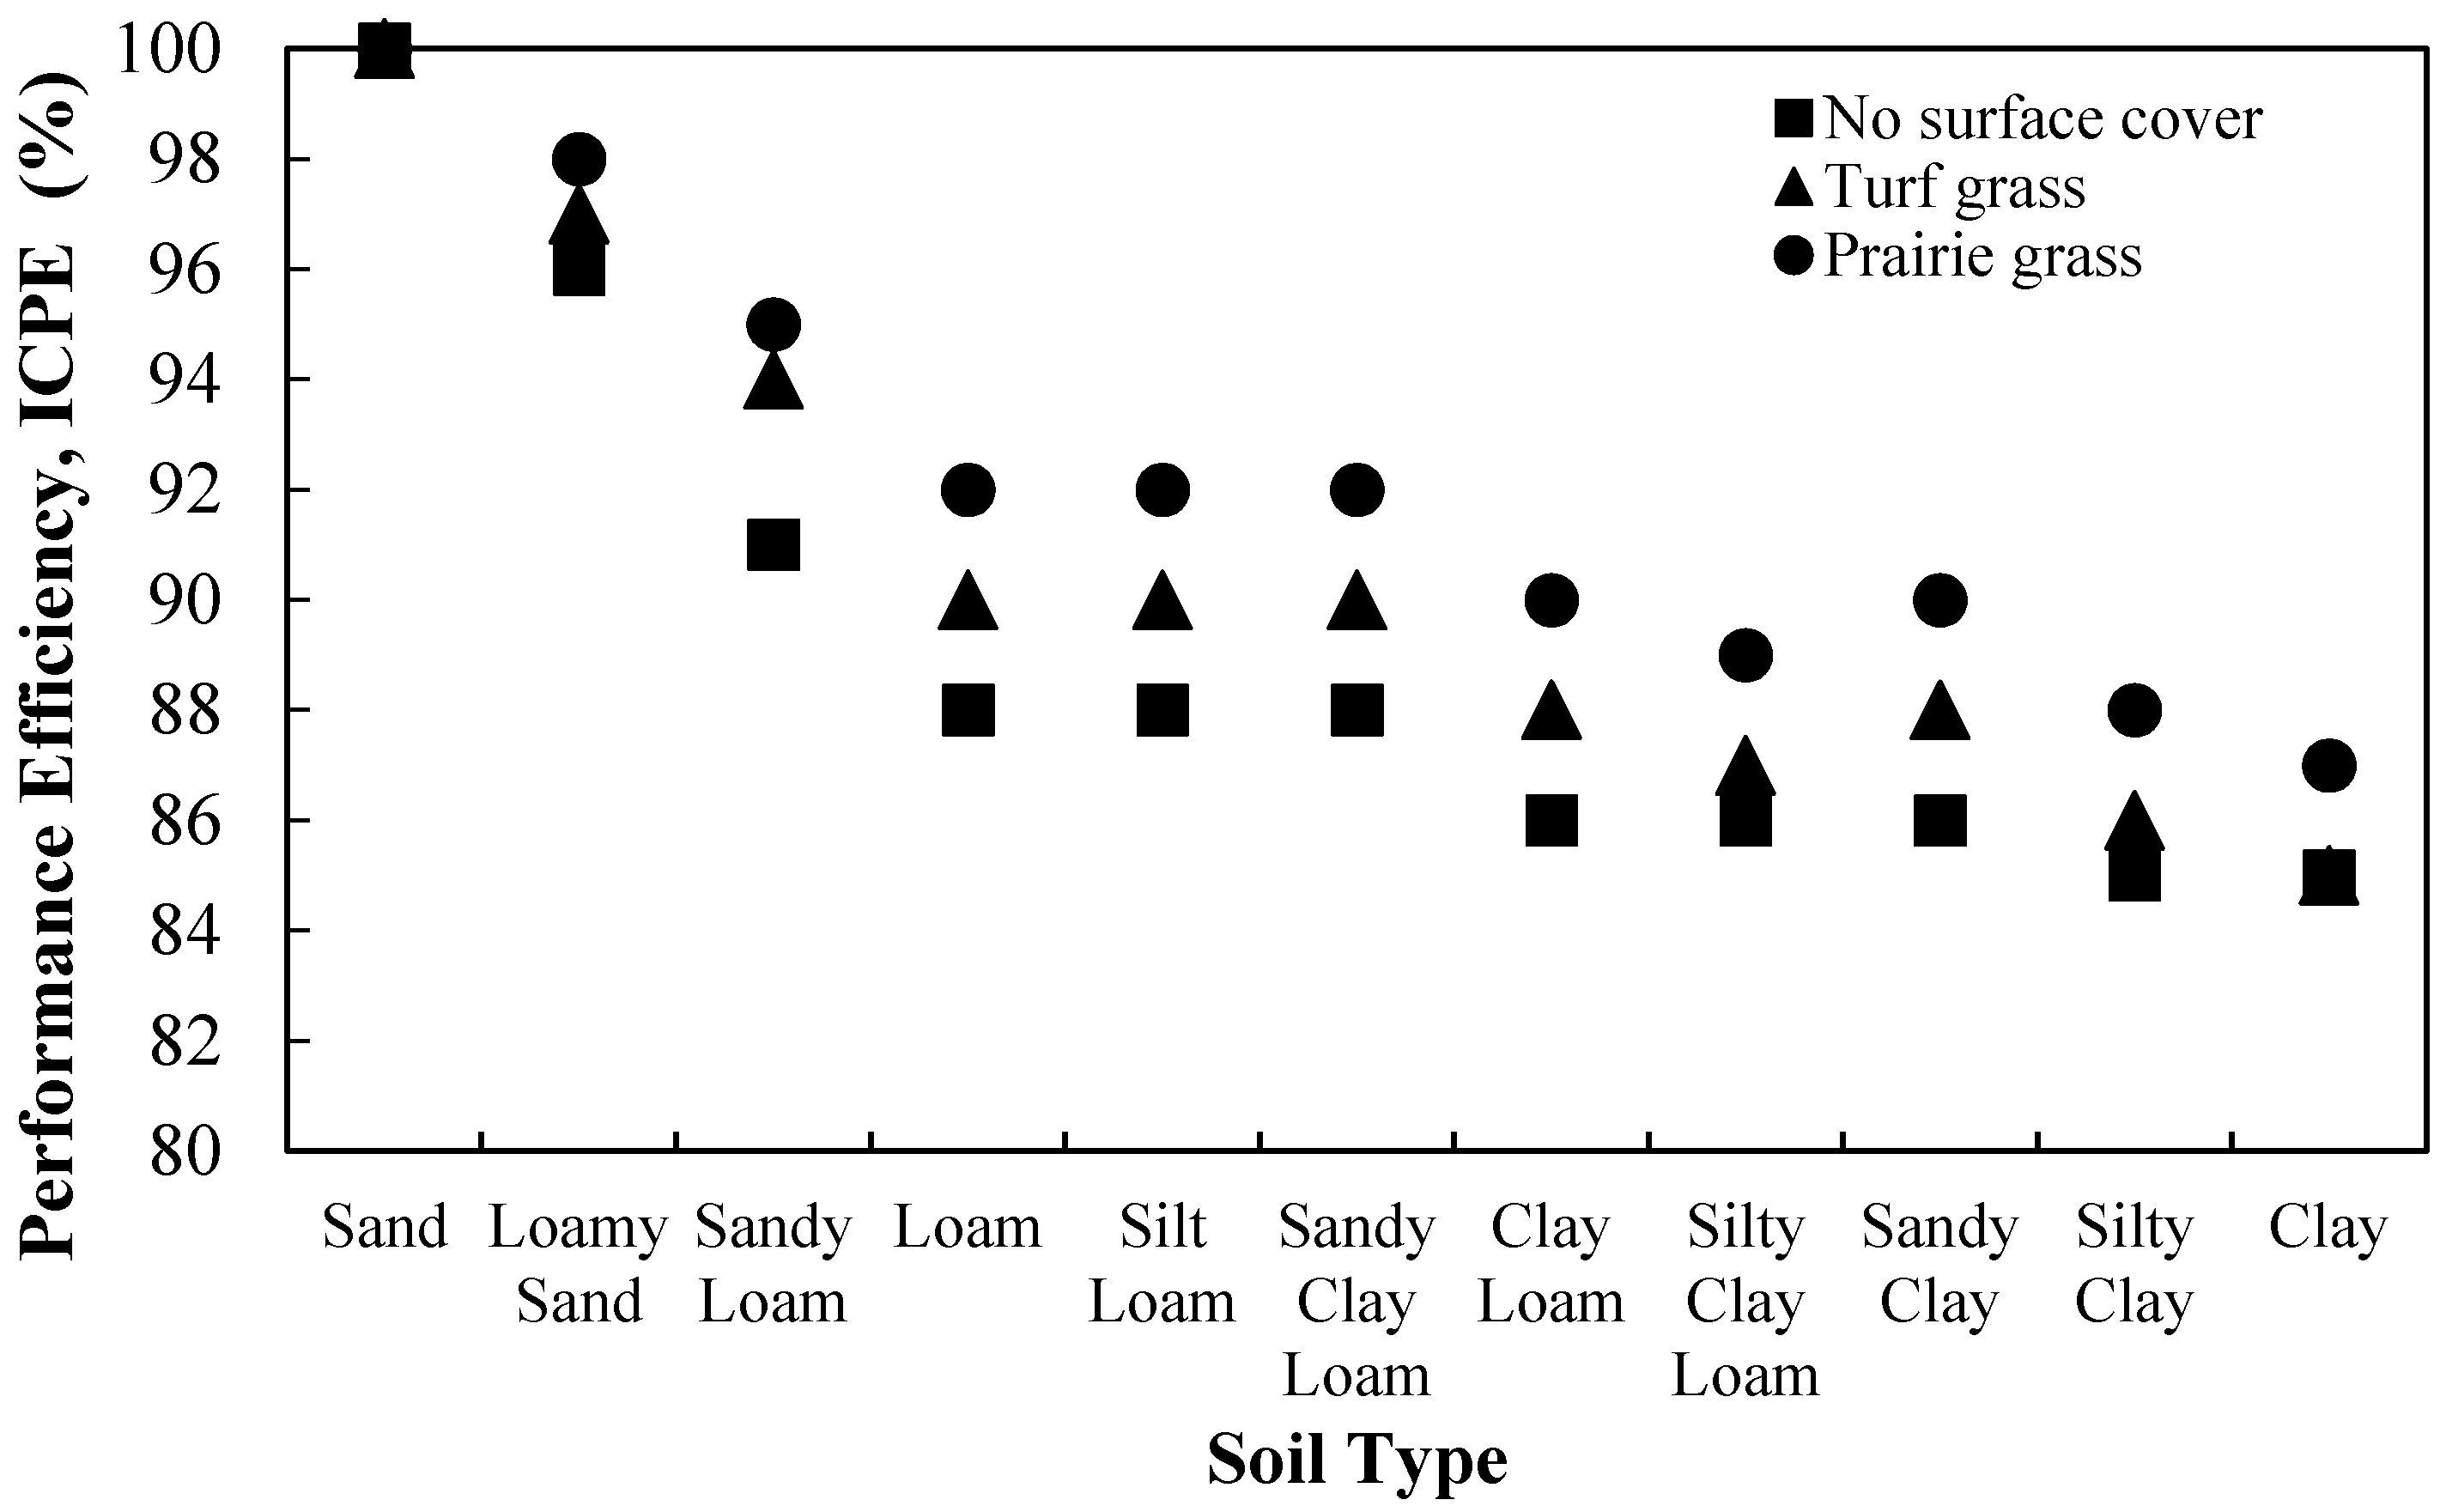
Figure 5.
The ICPE value for idealized catchment with vegetated filter strip and different soil surface covers on right-of-way.
Figure 5.
The ICPE value for idealized catchment with vegetated filter strip and different soil surface covers on right-of-way.
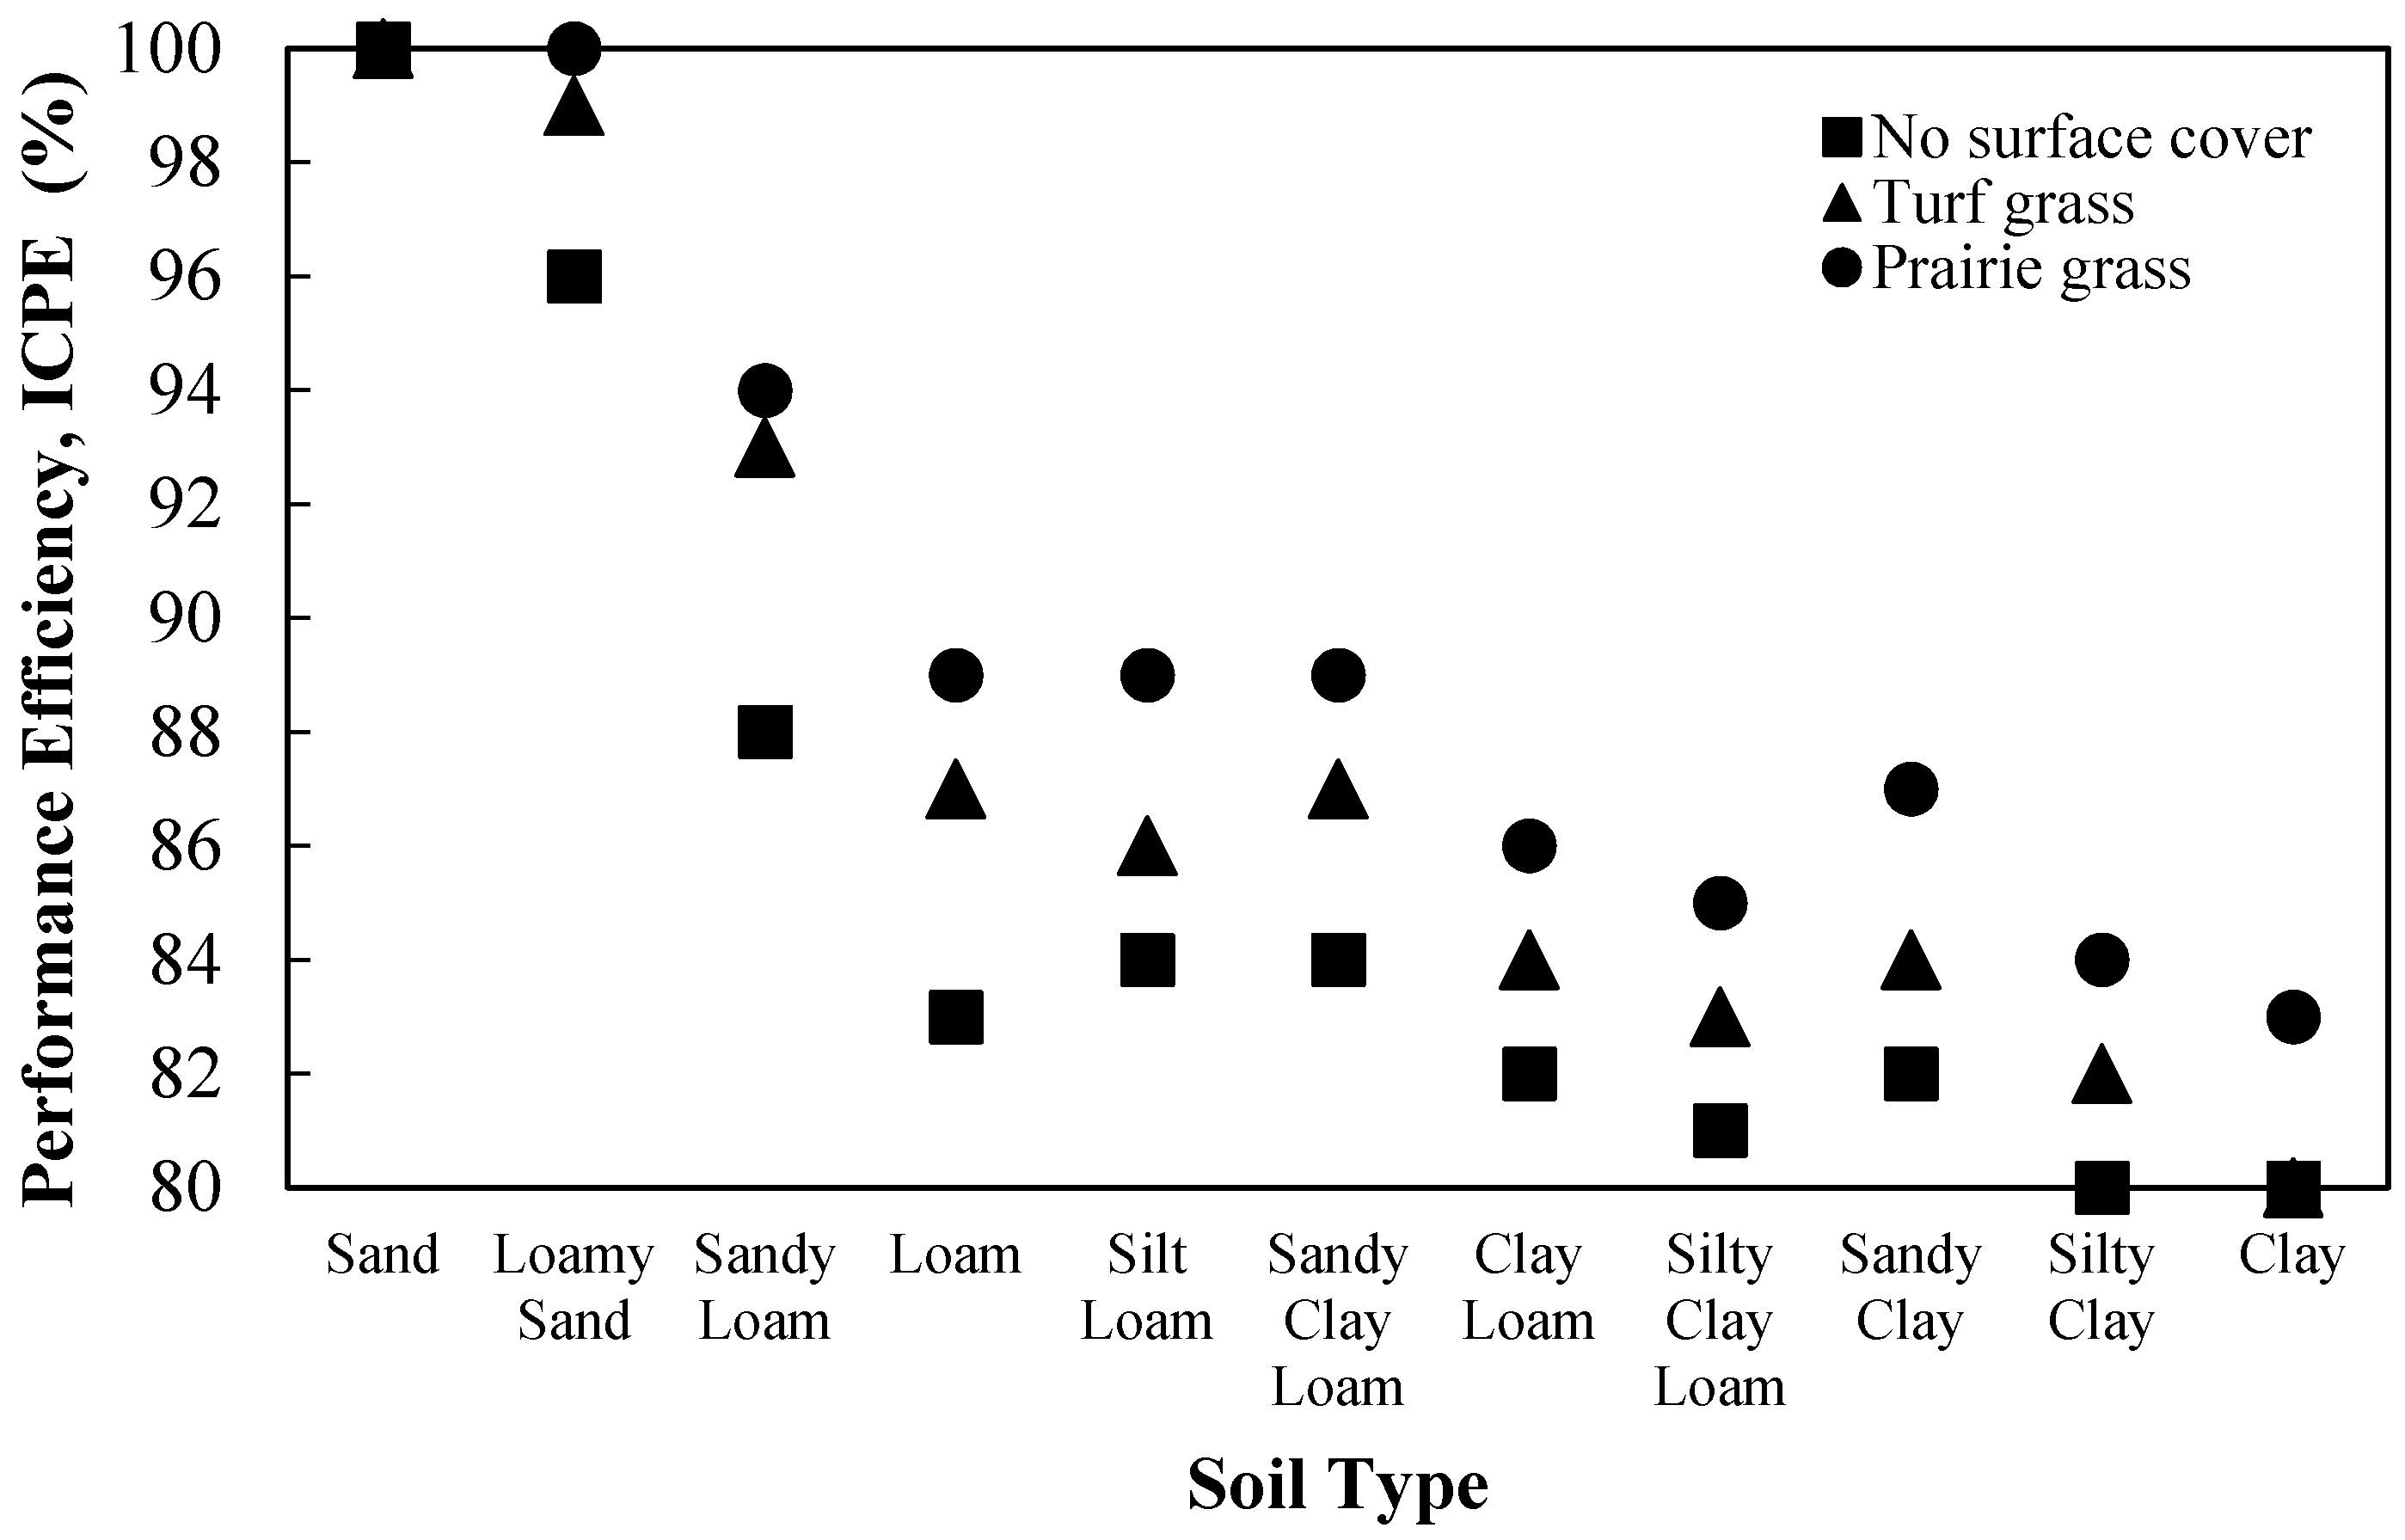
Figure 6.
Comparison of current construction cost estimation with typical methods in infiltration trench.
Figure 6.
Comparison of current construction cost estimation with typical methods in infiltration trench.

Figure 7.
Bioswale performance (i.e., ICPE) and cost per 30 m of linear highway with change in bottom width (1 ftft = 0.3 m, 1 inch = 25.4 mm).
Figure 7.
Bioswale performance (i.e., ICPE) and cost per 30 m of linear highway with change in bottom width (1 ftft = 0.3 m, 1 inch = 25.4 mm).
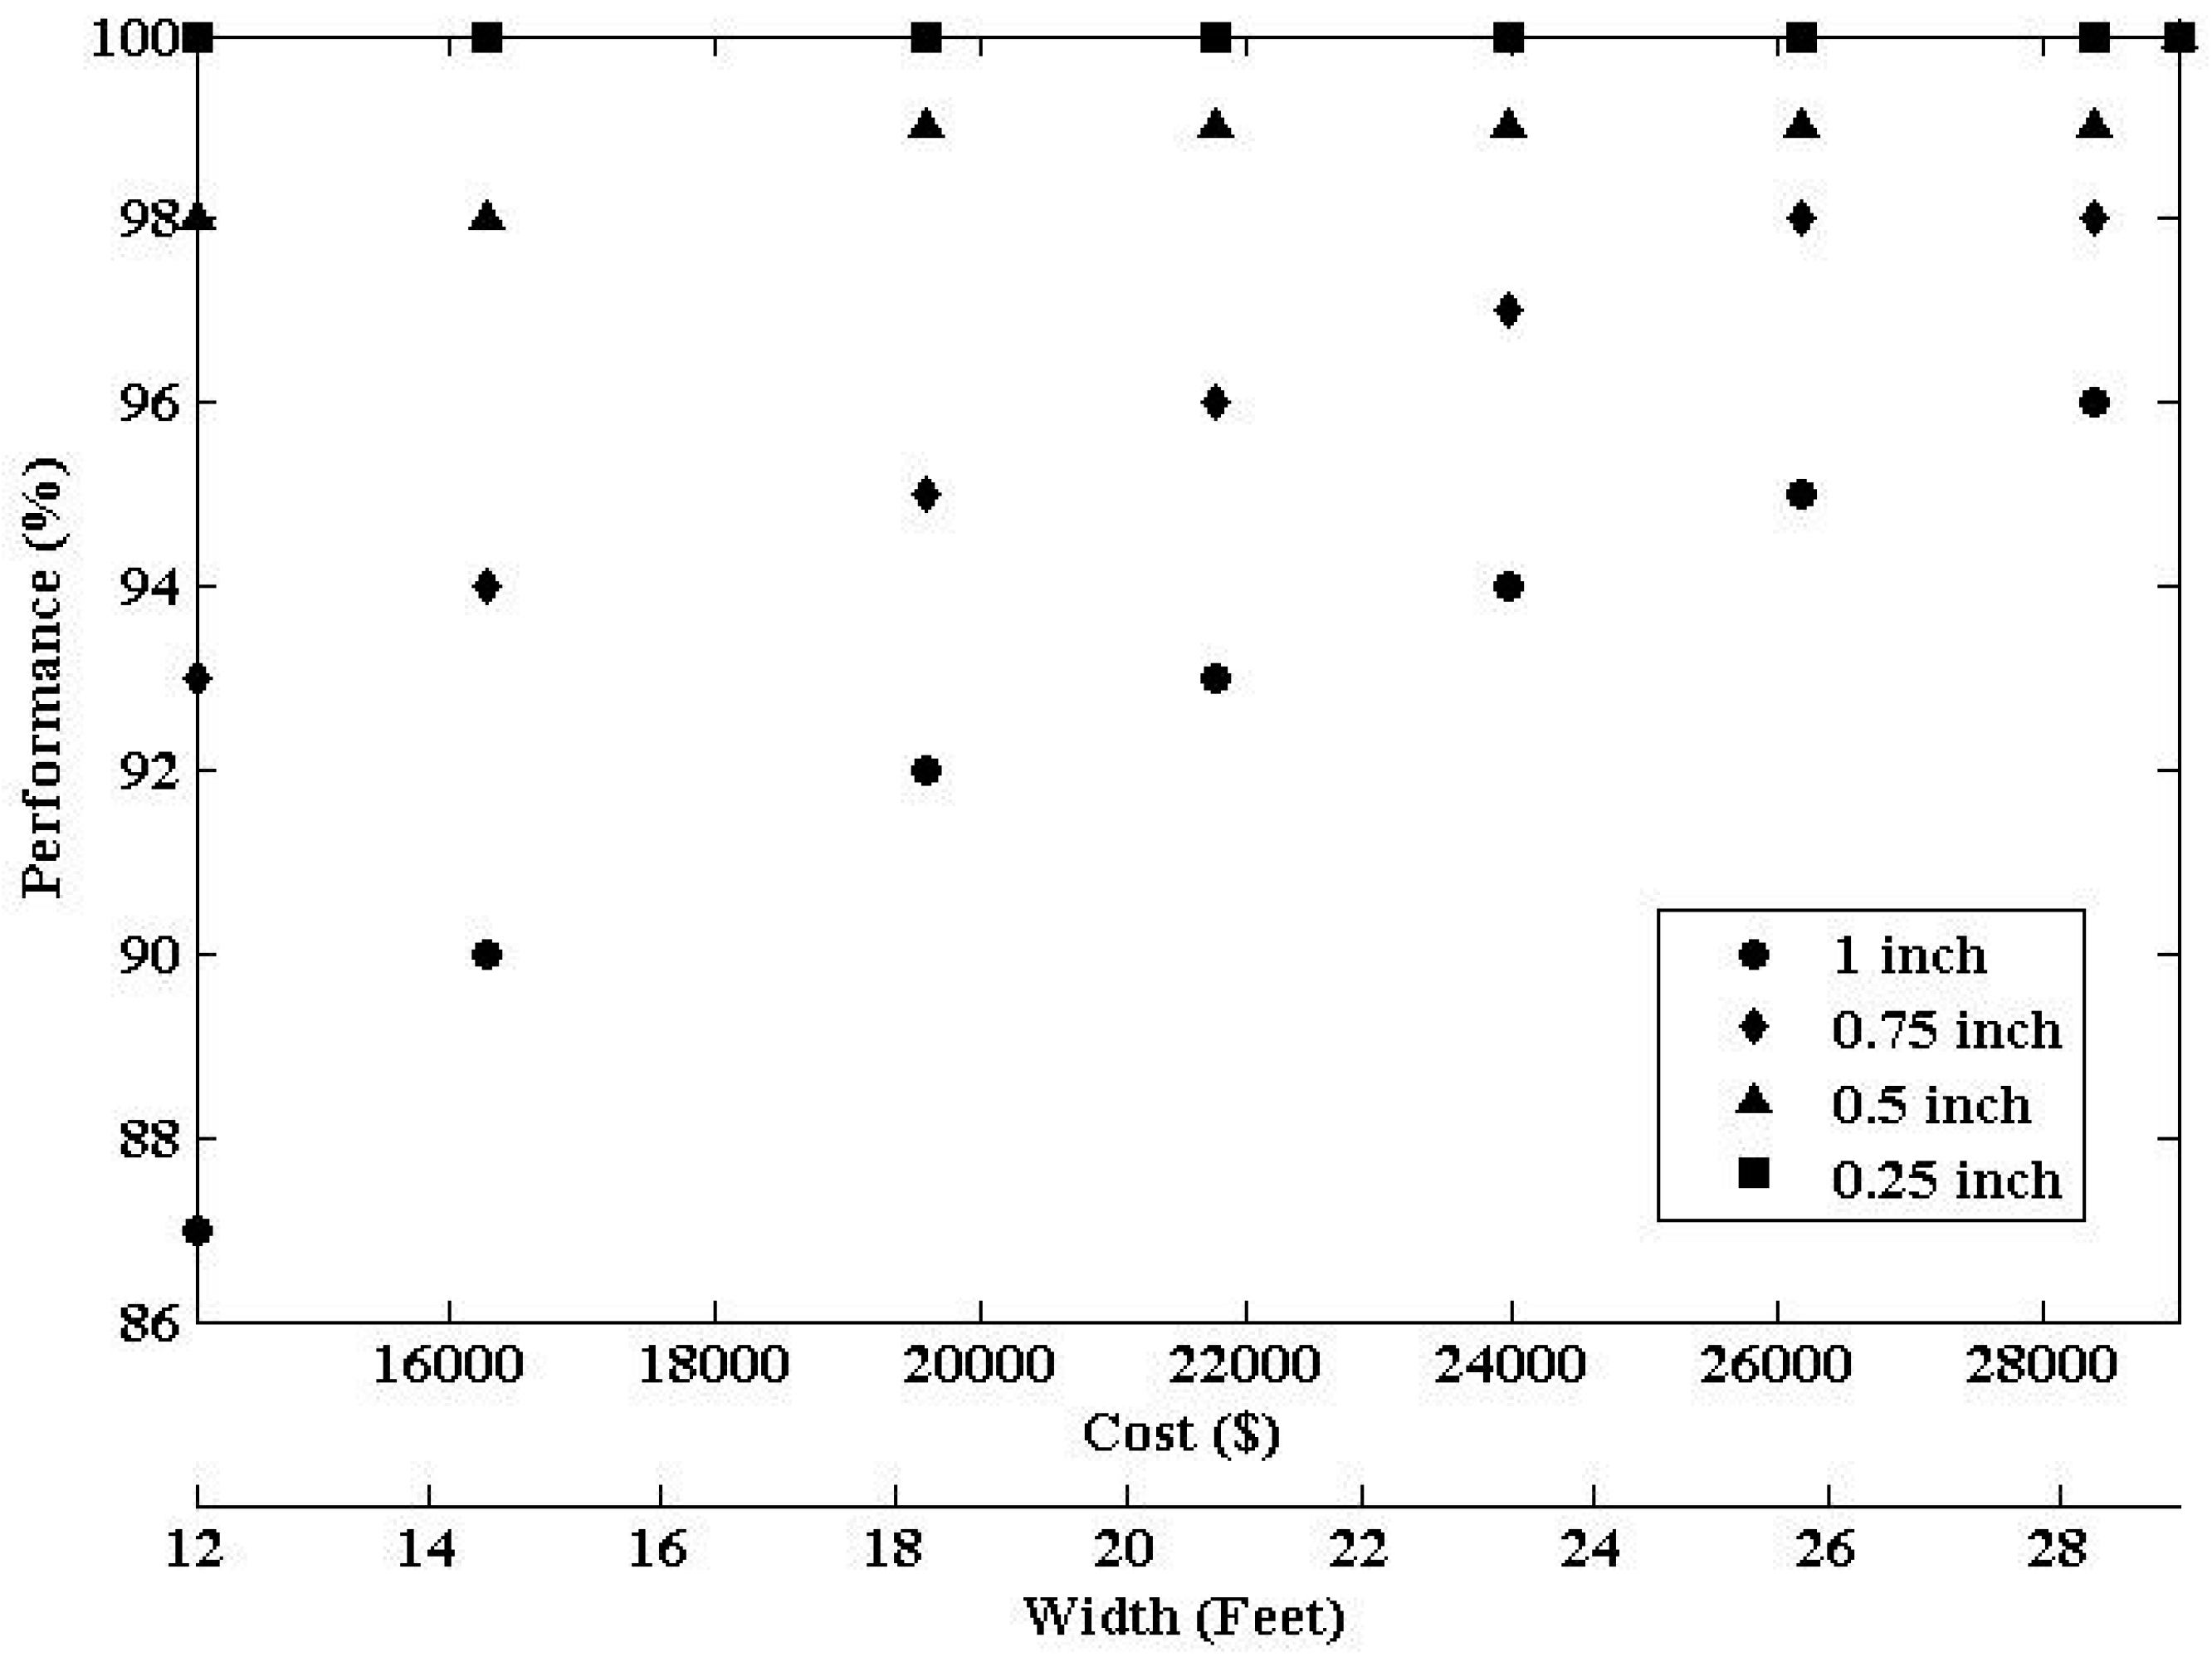
Figure 8.
Infiltration trench performance (i.e., ICPE) with change in storage thickness and associcated cost per 30 m of linear highway (1 ft = 0.3 m, 1 inch = 25.4 mm).
Figure 8.
Infiltration trench performance (i.e., ICPE) with change in storage thickness and associcated cost per 30 m of linear highway (1 ft = 0.3 m, 1 inch = 25.4 mm).

Figure 9.
VFS BMP performance (i.e., ICPE) and associcated cost per 30 m of linear highway (1 ft = 0.3 m, 1 inch = 25.4 mm).
Figure 9.
VFS BMP performance (i.e., ICPE) and associcated cost per 30 m of linear highway (1 ft = 0.3 m, 1 inch = 25.4 mm).


Table 1.
Percent Imperviousness for Each Soil Type.
| USDA * Soil Type | Bare Soil Imperviousness (%) | Turf Grass Imperviousness (%) | Prairie Grass Imperviousness (%) |
|---|---|---|---|
| Sand | 11 | 0 | 0 |
| Loamy Sand | 26 | 15 | 0 |
| Sandy Loam | 39 | 28 | 0 |
| Sandy Clay Loam | 42 | 31 | 0 |
| Sandy Clay | 58 | 47 | 0 |
| Loam | 60 | 49 | 2 |
| Silt Loam | 65 | 54 | 7 |
| Clay loam | 74 | 63 | 16 |
| Silty Clay Loam | 89 | 78 | 31 |
| Silty Clay | 94 | 83 | 36 |
| Clay | 100 | 100 | 53 |
Note: * United States Department of Agriculture.
Table 2.
Best Management Practices (BMPs) Subcatchment Parameters in Personal Computer Storm Water Management Model PCSWMM.
Table 2.
Best Management Practices (BMPs) Subcatchment Parameters in Personal Computer Storm Water Management Model PCSWMM.
| Parameters | Bioswale | Infiltration Trench | Vegetated Filter Strip | Source |
|---|---|---|---|---|
| Slope (%) | 0.5 | 0.5 | 0.5 | [17,18,22] |
| Imperviousness (%) | 0 | 0 | 0 | |
| Nimperv 1 | 0.011 | [21] | ||
| Nperv 2 | Turf Grass = 0.24 | 0.015 | Turf Grass = 0.24 | [21] |
| Dstore Imperv 3 | 1.3 mm (0.05 inch) | [22,23] | ||
| Dstore Perv 4 | Turf grass = 6.35 mm (0.25 inch) | Bare land= 2.5 mm (0.10 inch) | Turf grass = 6.35 mm (0.25 inch) | [22,23] |
| Soil | Sand parameters | Sand parameters | Sandy Loam Soil (Engineered Soil) | [22,23] |
Notes: 1 Manning’s n for overland flow over the impervious portion of the subcatchment; 2 Manning’s n for overland flow over the pervious portion of the subcatchment; 3 Depth of depression storage on the impervious portion of the subcatchment; 4 Depth of depression storage on the pervious portion of the subcatchment.
© 2017 by the authors. Licensee MDPI, Basel, Switzerland. This article is an open access article distributed under the terms and conditions of the Creative Commons Attribution (CC BY) license (http://creativecommons.org/licenses/by/4.0/).
Share and Cite
MDPI and ACS Style
Osouli, A.; Bloorchian, A.A.; Grinter, M.; Alborzi, A.; Marlow, S.L.; Ahiablame, L.; Zhou, J. Performance and Cost Perspective in Selecting BMPs for Linear Projects. Water 2017, 9, 302. https://doi.org/10.3390/w9050302
AMA Style
Osouli A, Bloorchian AA, Grinter M, Alborzi A, Marlow SL, Ahiablame L, Zhou J. Performance and Cost Perspective in Selecting BMPs for Linear Projects. Water. 2017; 9(5):302. https://doi.org/10.3390/w9050302
Chicago/Turabian StyleOsouli, Abdolreza, Azadeh Akhavan Bloorchian, Mark Grinter, Aneseh Alborzi, Scott L. Marlow, Laurent Ahiablame, and Jianpeng Zhou. 2017. "Performance and Cost Perspective in Selecting BMPs for Linear Projects" Water 9, no. 5: 302. https://doi.org/10.3390/w9050302
Note that from the first issue of 2016, this journal uses article numbers instead of page numbers. See further details here.