Article

A Simplified Simulation Method for Flood-Induced Bend Scour—A Case Study Near the Shuideliaw Embankment on the Cho-Shui River

1
Taiwan Typhoon and Flood Research Institute, National Applied Research Laboratories, 11 F., No. 97, Sec. 1, Roosevelt Rd., Taipei 10093, Taiwan
2
Department of Civil Engineering, National Chung Hsing University, Taichung 40227, Taiwan
*
Author to whom correspondence should be addressed.
Water 2017, 9(5), 324; https://doi.org/10.3390/w9050324
Submission received: 21 March 2017 / Revised: 30 April 2017 / Accepted: 2 May 2017 / Published: 5 May 2017

Abstract

:
The modeling of flood-induced bend scour near embankment toes can provide important information for river engineering, embankment safety warnings, and emergency action management. During the rainy seasons, short-term general scour and bend scour are the most common causes for the failure of reinforced concrete embankments in Taiwan. To gain a deeper understanding of the scouring process near embankment foundations, this study proposed a straightforward and practical method for bend scour simulation. The proposed simulation method is subdivided into three stages: two-dimensional flow simulation, general scour estimation, and bend scour estimation. A new bend scour computation equation is proposed and incorporated into a two-dimensional hydraulic finite-volume model for simulating the evolution of bend scour depth around embankment toes. The proposed method is applied to simulate the temporal evolution of bend scouring near the Shuideliaw Embankment on the Cho-Shui River in Taiwan, where serious failure occurred during the June 2012 monsoon. Field data were gathered using the numbered-brick technique at the Shuideliaw Embankment to demonstrate the accuracy of the proposed method. The results of the bend scour simulations compared reasonably well with field measurements, indicating close agreement in terms of water levels and bend scour depths near the Shuideliaw Embankment. The proposed method was found to quickly estimate the maximum short-term general scour and bend scour depths for further enhancement of the safety of the embankment toe.

1. Introduction

Embankments are natural or man-made hydraulic structures used to prevent inundation disasters in adjacent flood-prone areas. In general, embankment failure occurs during a flood as the result of several possible factors: (1) overtopping of the embankment crest; (2) scouring at the toe; (3) piping or internal erosion; and (4) toe or slope sliding of the embankment [1,2,3,4]. These potential mechanisms can result in the breaching or failure of embankments, which can occur as a single mechanism or a combination of different mechanisms. The failure of embankments due to multiple mechanisms may cause widespread flooding and result in significant loss of life. In Taiwan, the Water Resource Agency (WRA) [5] reported that approximately 43% of embankment failures are associated with scouring at the toe. On 8 August 2009, embankment failures due to Typhoon Morakot caused catastrophic inundation and serious property damage in Southern Taiwan. The Shuideliaw Embankment on the Cho-Shui River was damaged during the June 2012 monsoon and Typhoon Saola (August 2012), with peak discharges of 6120 and 10,600 m3/s, respectively. Moreover, the adjacent irrigation channels were damaged during these flood events.
To mitigate potential embankment hazards, the prediction of flood-induced embankment failure is a basic necessity. A number of numerical models have been developed over the past 50 years to predict the embankment erosion and failure process [6,7,8,9,10,11,12,13]. These models can be divided into two major categories: (1) parametric models and (2) physically based models. The parametric model uses regression analysis to establish statistically based equations that can be used to estimate embankment breaching width and discharge. The physically based model uses sediment transport formulas to estimate the rate of embankment erosion according to a reasonable approximation of the evolution of embankment breaching. According to a review of the literature, these models can be used to simulate embankment breach formation, growth, and closure. Although many published studies have investigated earthen embankment erosion and failure processes, there has been little focus on reinforced concrete embankments. In Taiwan, an extreme flood can erode the riverbed near embankment toes and result in their failure. Hence, scour has been the major safety concern for reinforced concrete embankment structures.
The more commonly used approach adopts numerical methods to simulate the scouring around cross-river structures. Several studies have adopted numerical methods to investigate the scour process around bridge piers [14,15,16,17,18] and spur dikes [19,20,21]. Time-consuming three-dimensional (3D) numerical models produce sharp resolutions of 3D flow fields and local scour around hydraulic structures under laboratory conditions. Moreover, these 3D models have not been as successful in practical applications, where more field data are required. By contrast, two-dimensional (2D) numerical models can provide accurate hydraulic characteristics at the locations far from the local structures. Additionally, from a practical perspective, 2D models can provide fundamental approach flow information to estimate both general and local scour depths. This enables the combination of 2D models with reliable scour-depth equations for the simulation of total scour processes [22].
As the majority of embankment failure in Taiwan is due to toe scouring, a new practical method is required that explicitly relates to embankment toe scour. The scouring process around the embankment toe in a river bend leads to bend scouring at the toe of the outer embankment, in which riverbed variation during typhoon periods results in the undermining of embankment structures [23]. Many researchers proposed formulas to calculate the bend scour depth [23]. However, when applied to a field river, these equations might not be suited because the sediment transport characteristics in an alluvial river are different from those in an experimental flume. Thus, a reliable method is needed for estimating the maximum scour depth in a river bend in order to design appropriate embankment protection or establish an embankment warning system. In addition, according to the literature review, most previous studies have focused on embankment erosion and earthen embankment failure. Few investigators have reported the simulations of embankment toe scour in a river bend, especially for reinforced concrete embankment structures.
Therefore, this paper follows the idea of Hong et al. [22] to propose a new modeling methodology for simulating the temporal evolution of scour depth at embankment toes in river bend reaches. The difference between the previous study [22] and the presented study is mainly in the investigated river structures. The previous study [22] investigated the bridge scour, and the present study focuses on the bend scour at the embankment toe. Due to the different physical mechanism of bridge and bend scours, a new bend scour computation equation is proposed and integrated with a 2D shallow water flow model based on the finite-volume model [24,25,26], leading to a new and reliable method, which is the main contribution of this paper. Its practical applicability is demonstrated by a case study of the Cho-Shui River, in which the Shuideliaw Embankment is located in a gravel-bed river bend. Due to river bend effects, bend scour occurs at the outer embankment, i.e., the riverside of the Shuideliaw Embankment. Hence, this paper investigates flood-induced embankment toe scour by using the field data collected with the numbered-brick method. The proposed model is then verified through simulations of bend scour depth at the Shuideliaw Embankment under two flood events. Comparisons with three existing bend scour equations [27,28,29] are made between the simulated and field-measured maximum scour depths [30,31]. The practicability of the method is further confirmed through its application to the embankment failure event that occurred during Typhoon Saola in 2012. Based on nine scenario simulations, a new practical embankment safety curve representing the scoured depth-discharge relationship is finally proposed for use in river management.

2. Field Data Collection and Formula Derivation

As described in Section 1, several bend scour equations [23] were proposed based on the experimental results in the bend flume. These equations might not be suited to estimating bend scour in a field river. Therefore, a reliable bend scour computation equation is needed for investigating the present study site. Field data collection and equation derivation for bend scour estimation are described in this section.
Field measurement of embankment erosion or scour is very difficult, especially during high flow conditions. Flow conditions during floods are extremely dangerous, complicating the measurement of riverbed variation such as riverbed scour. In this study, 12 sets of bend scour data were collected to develop a new bend scour computation equation for rivers in Taiwan. Specifically, 10 and two sets of scour data were collected from the basins of the Cho-Shui and Da-Chia Rivers, respectively, for the database. Two sets of data collected in the Cho-Shui River basin were near the Shuideliaw Embankment and an irrigation channel directly behind the embankment. Therefore, the scour data collected near the Shuideliaw Embankment can be used to accurately evaluate the performance of the proposed method.

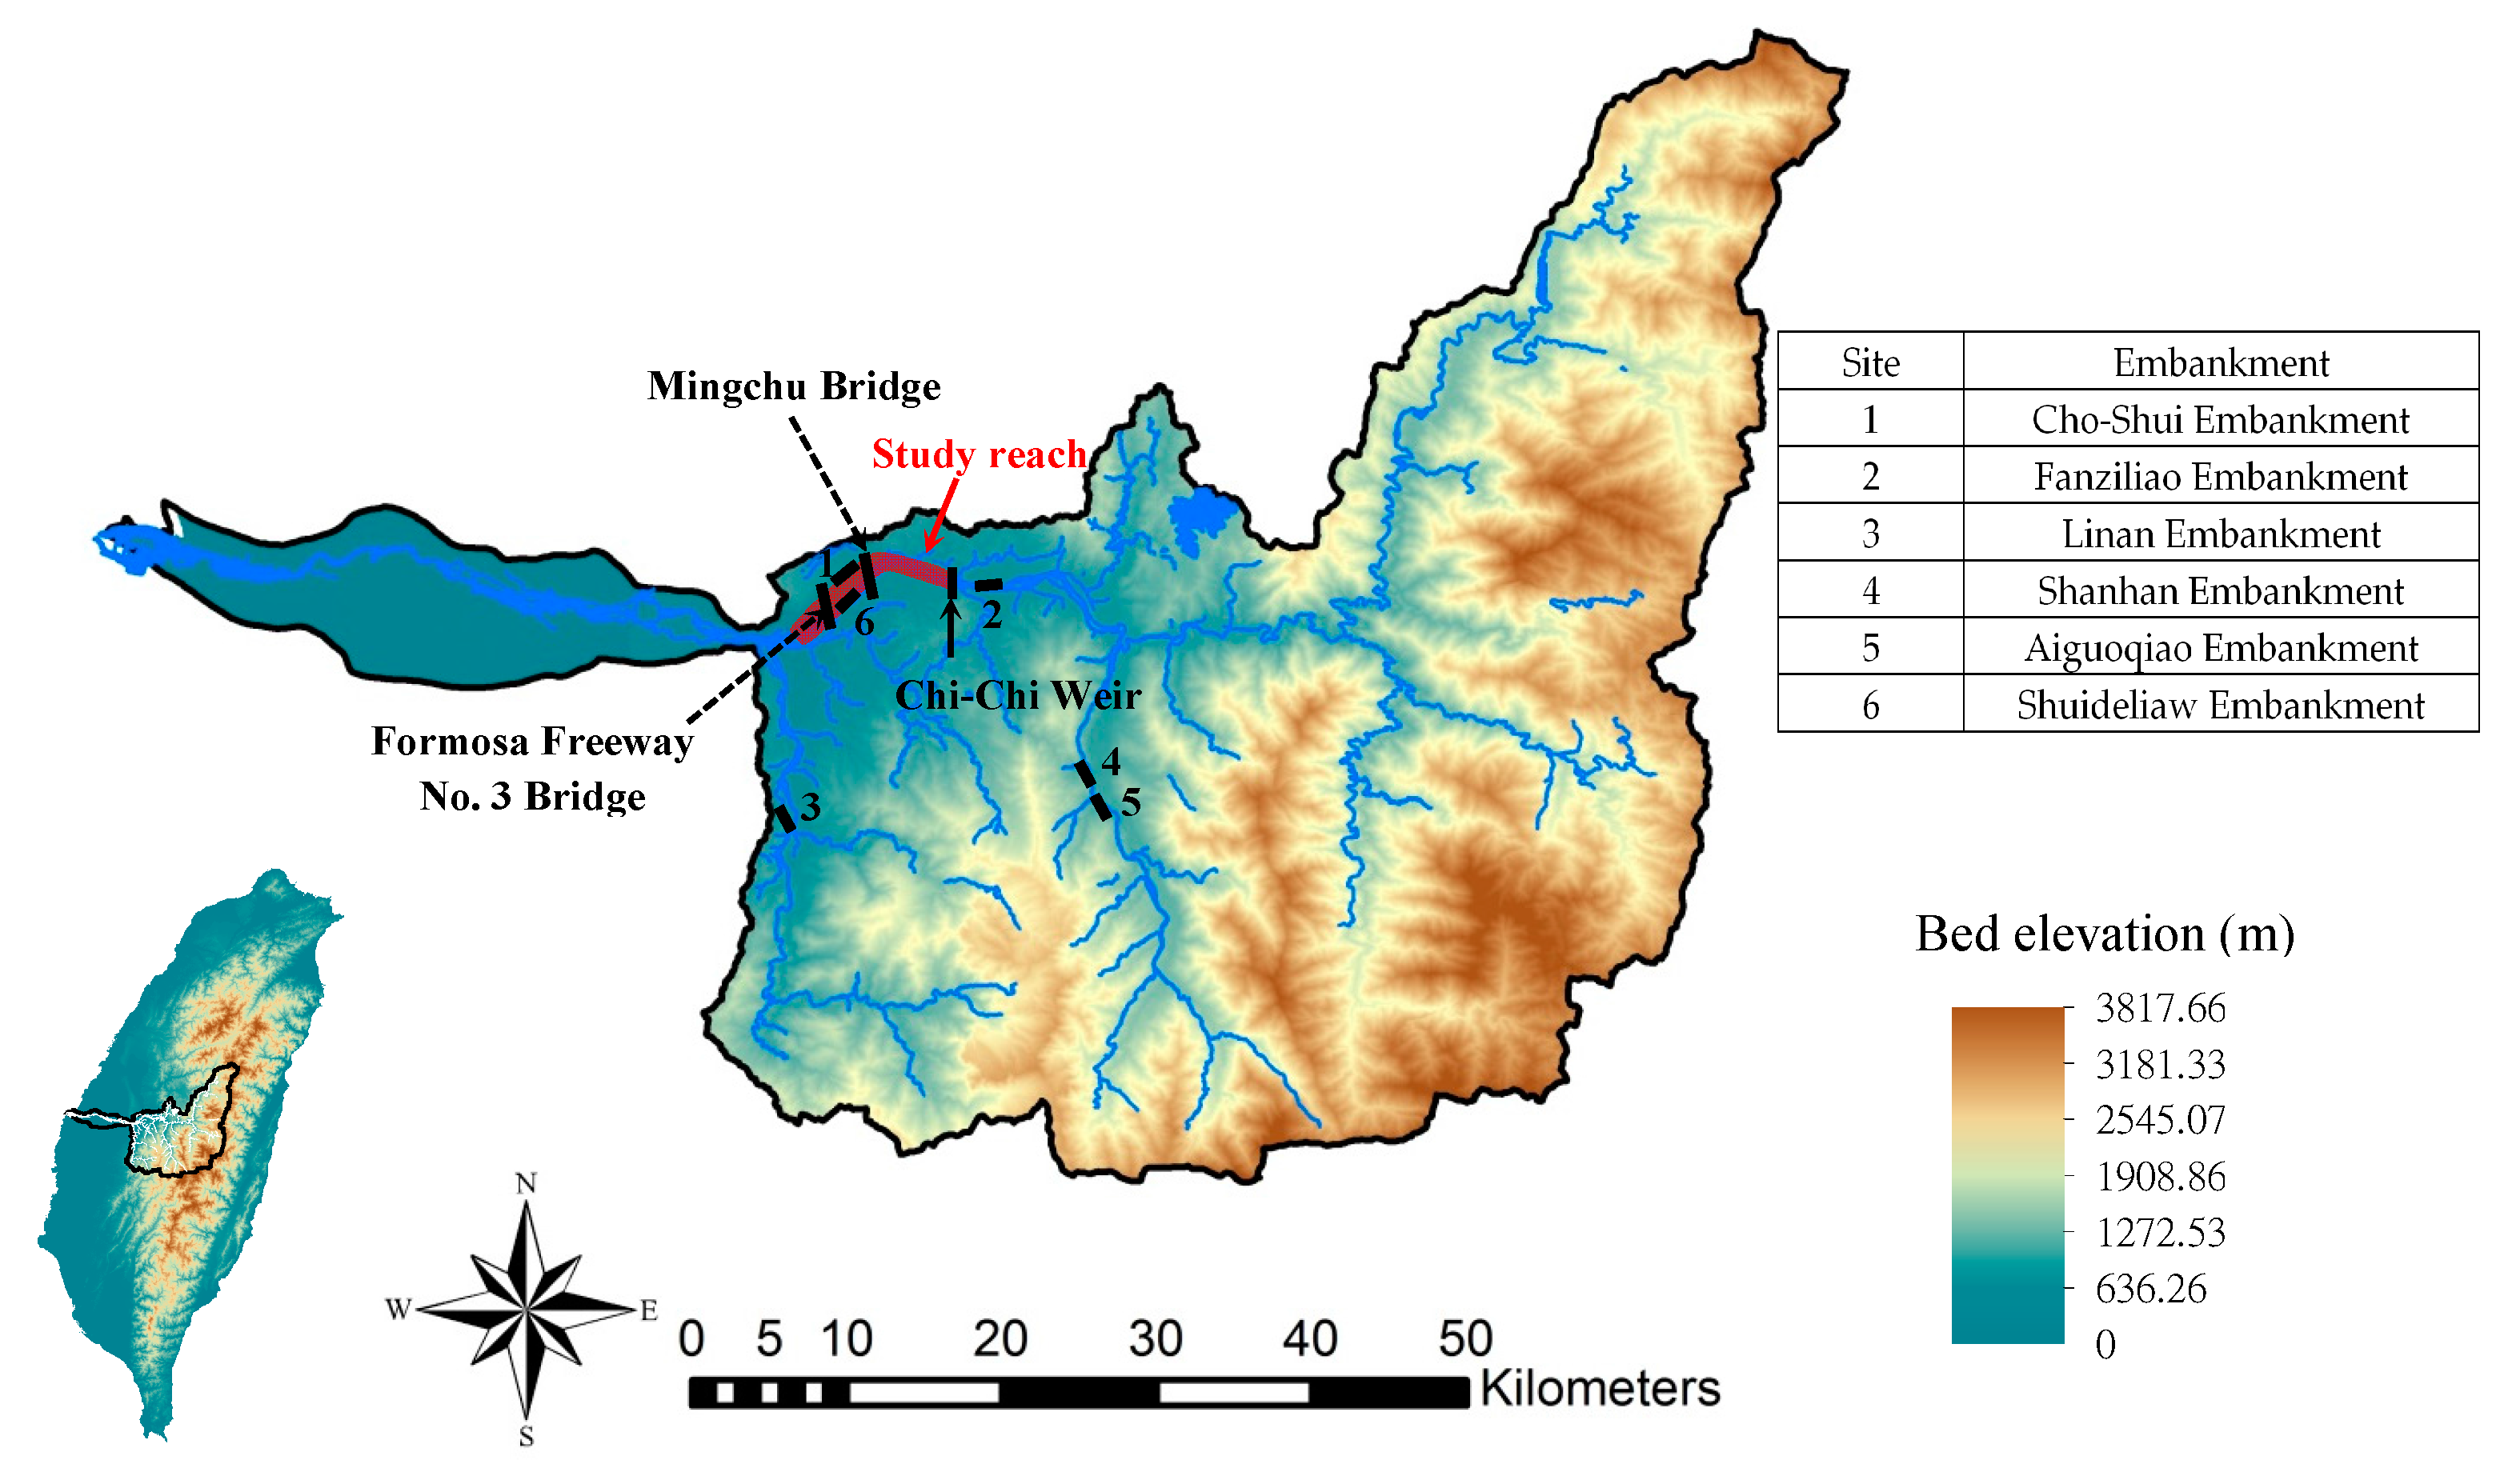
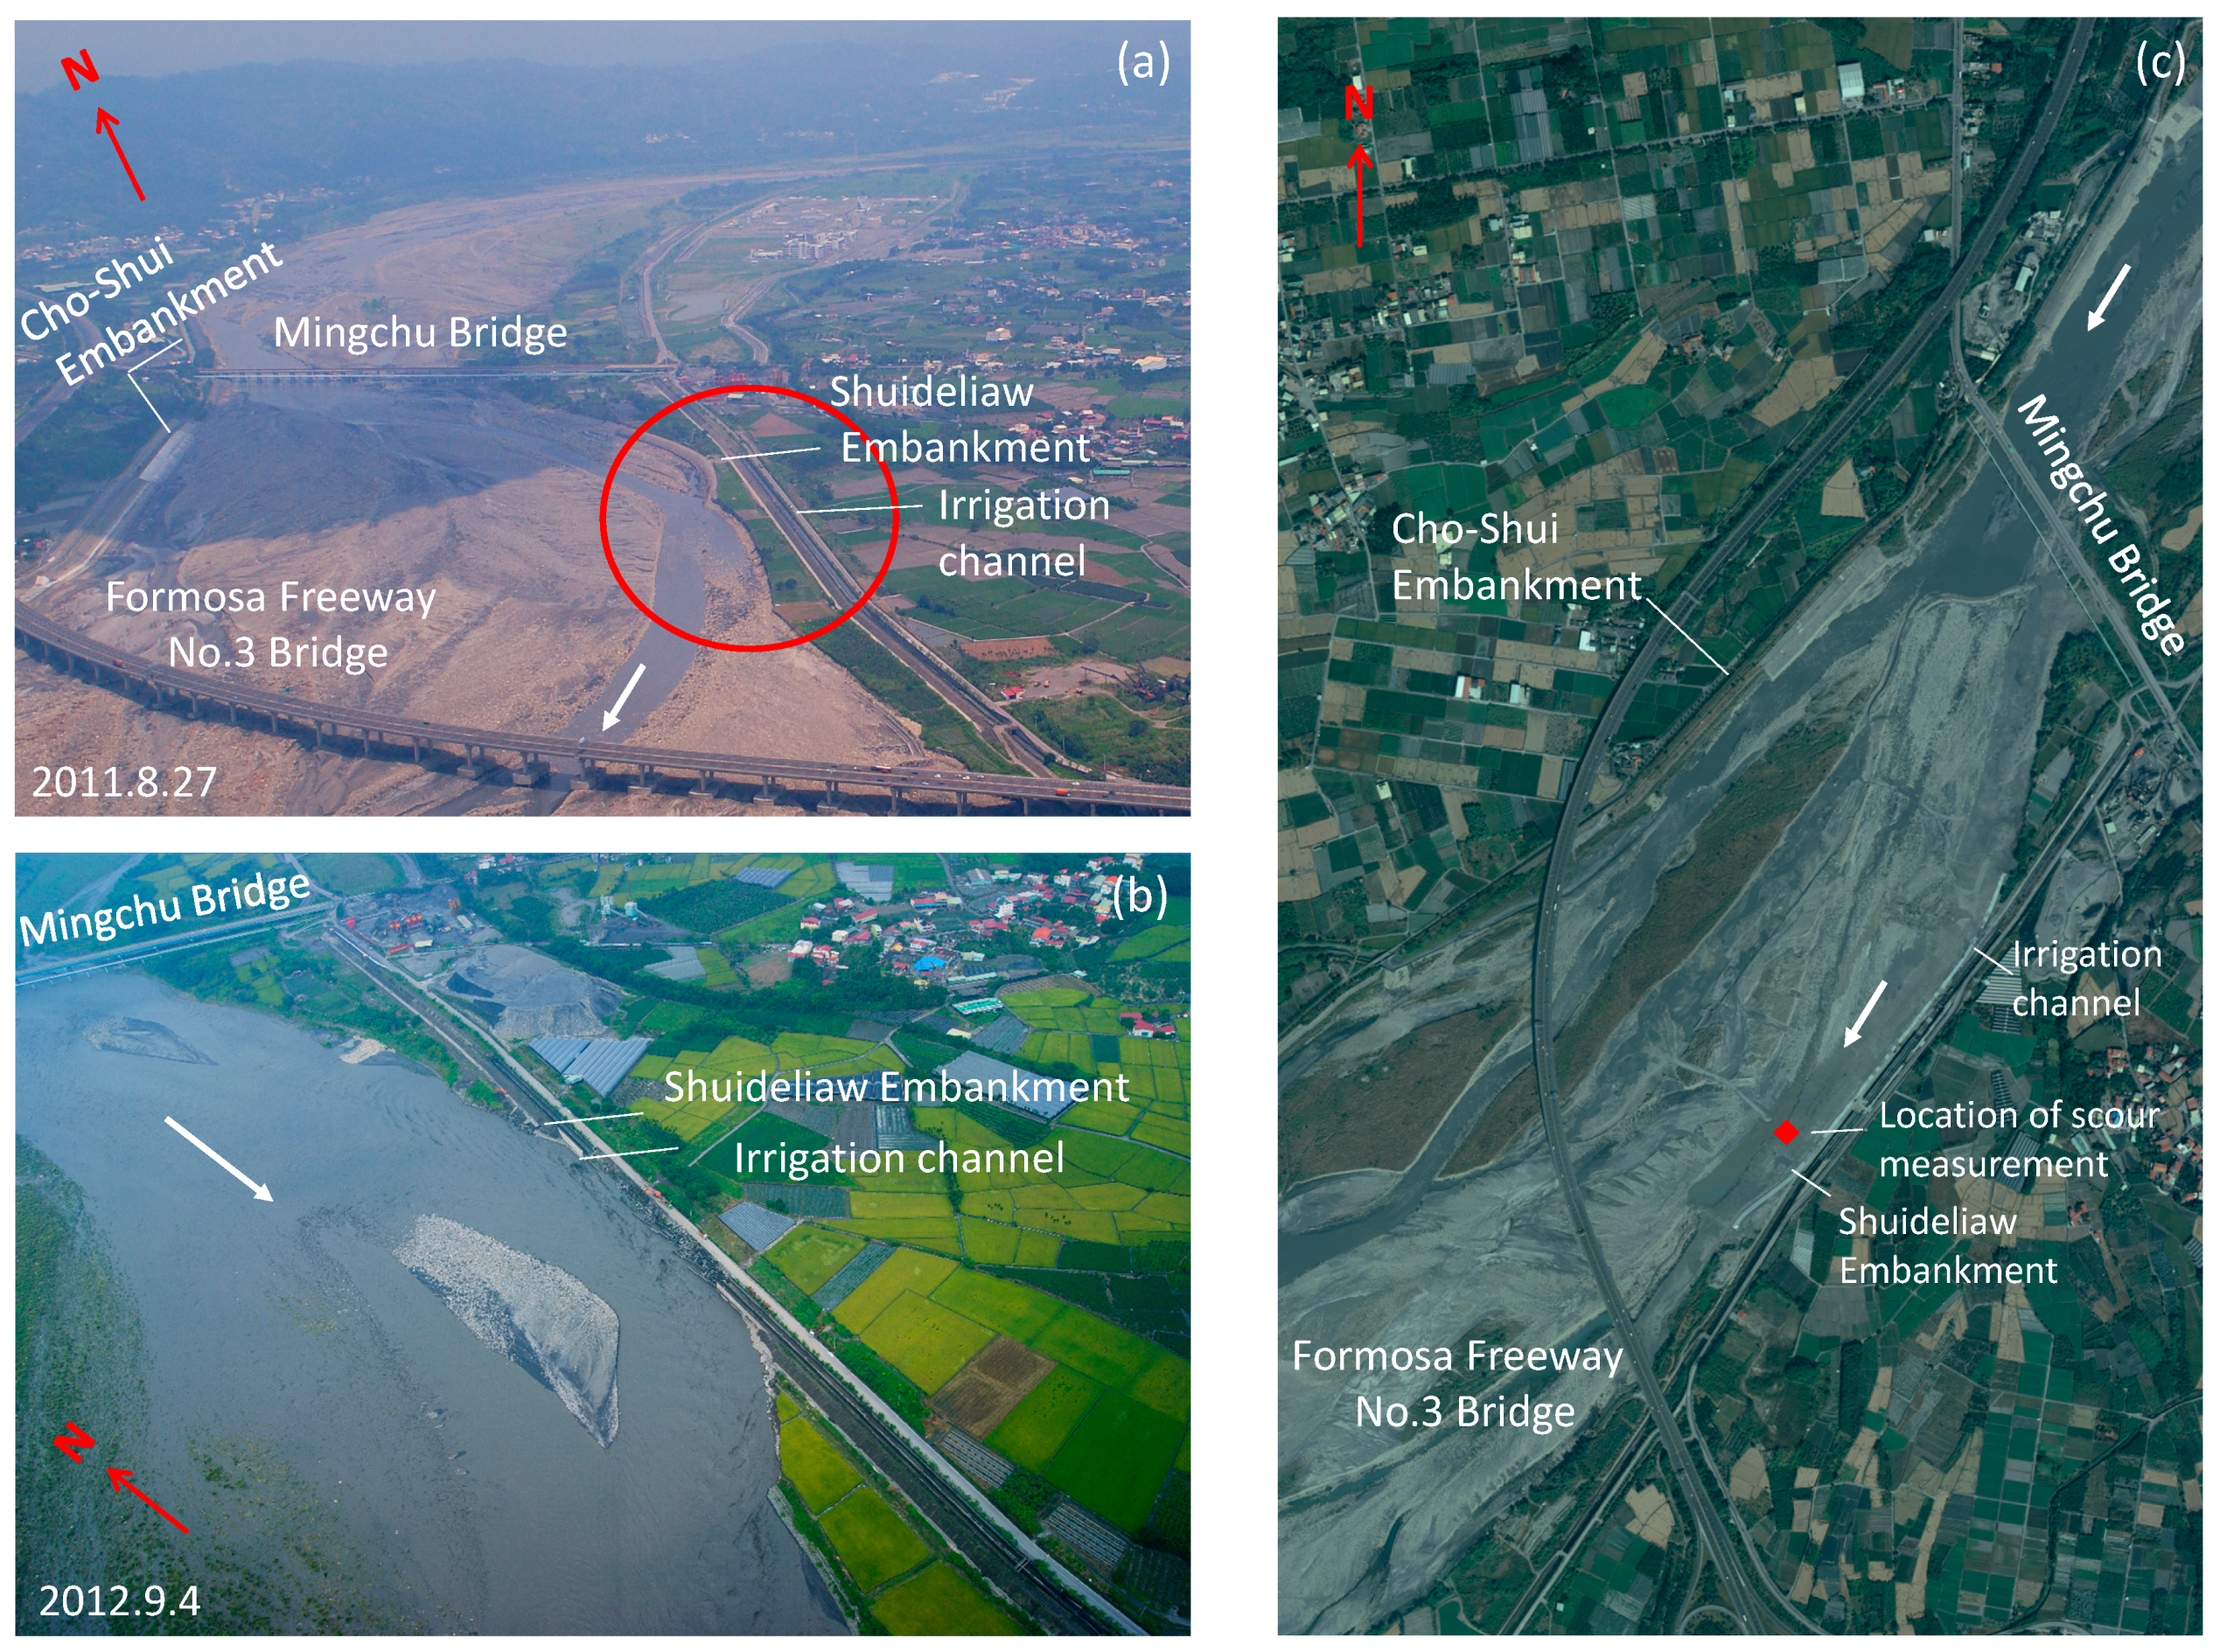
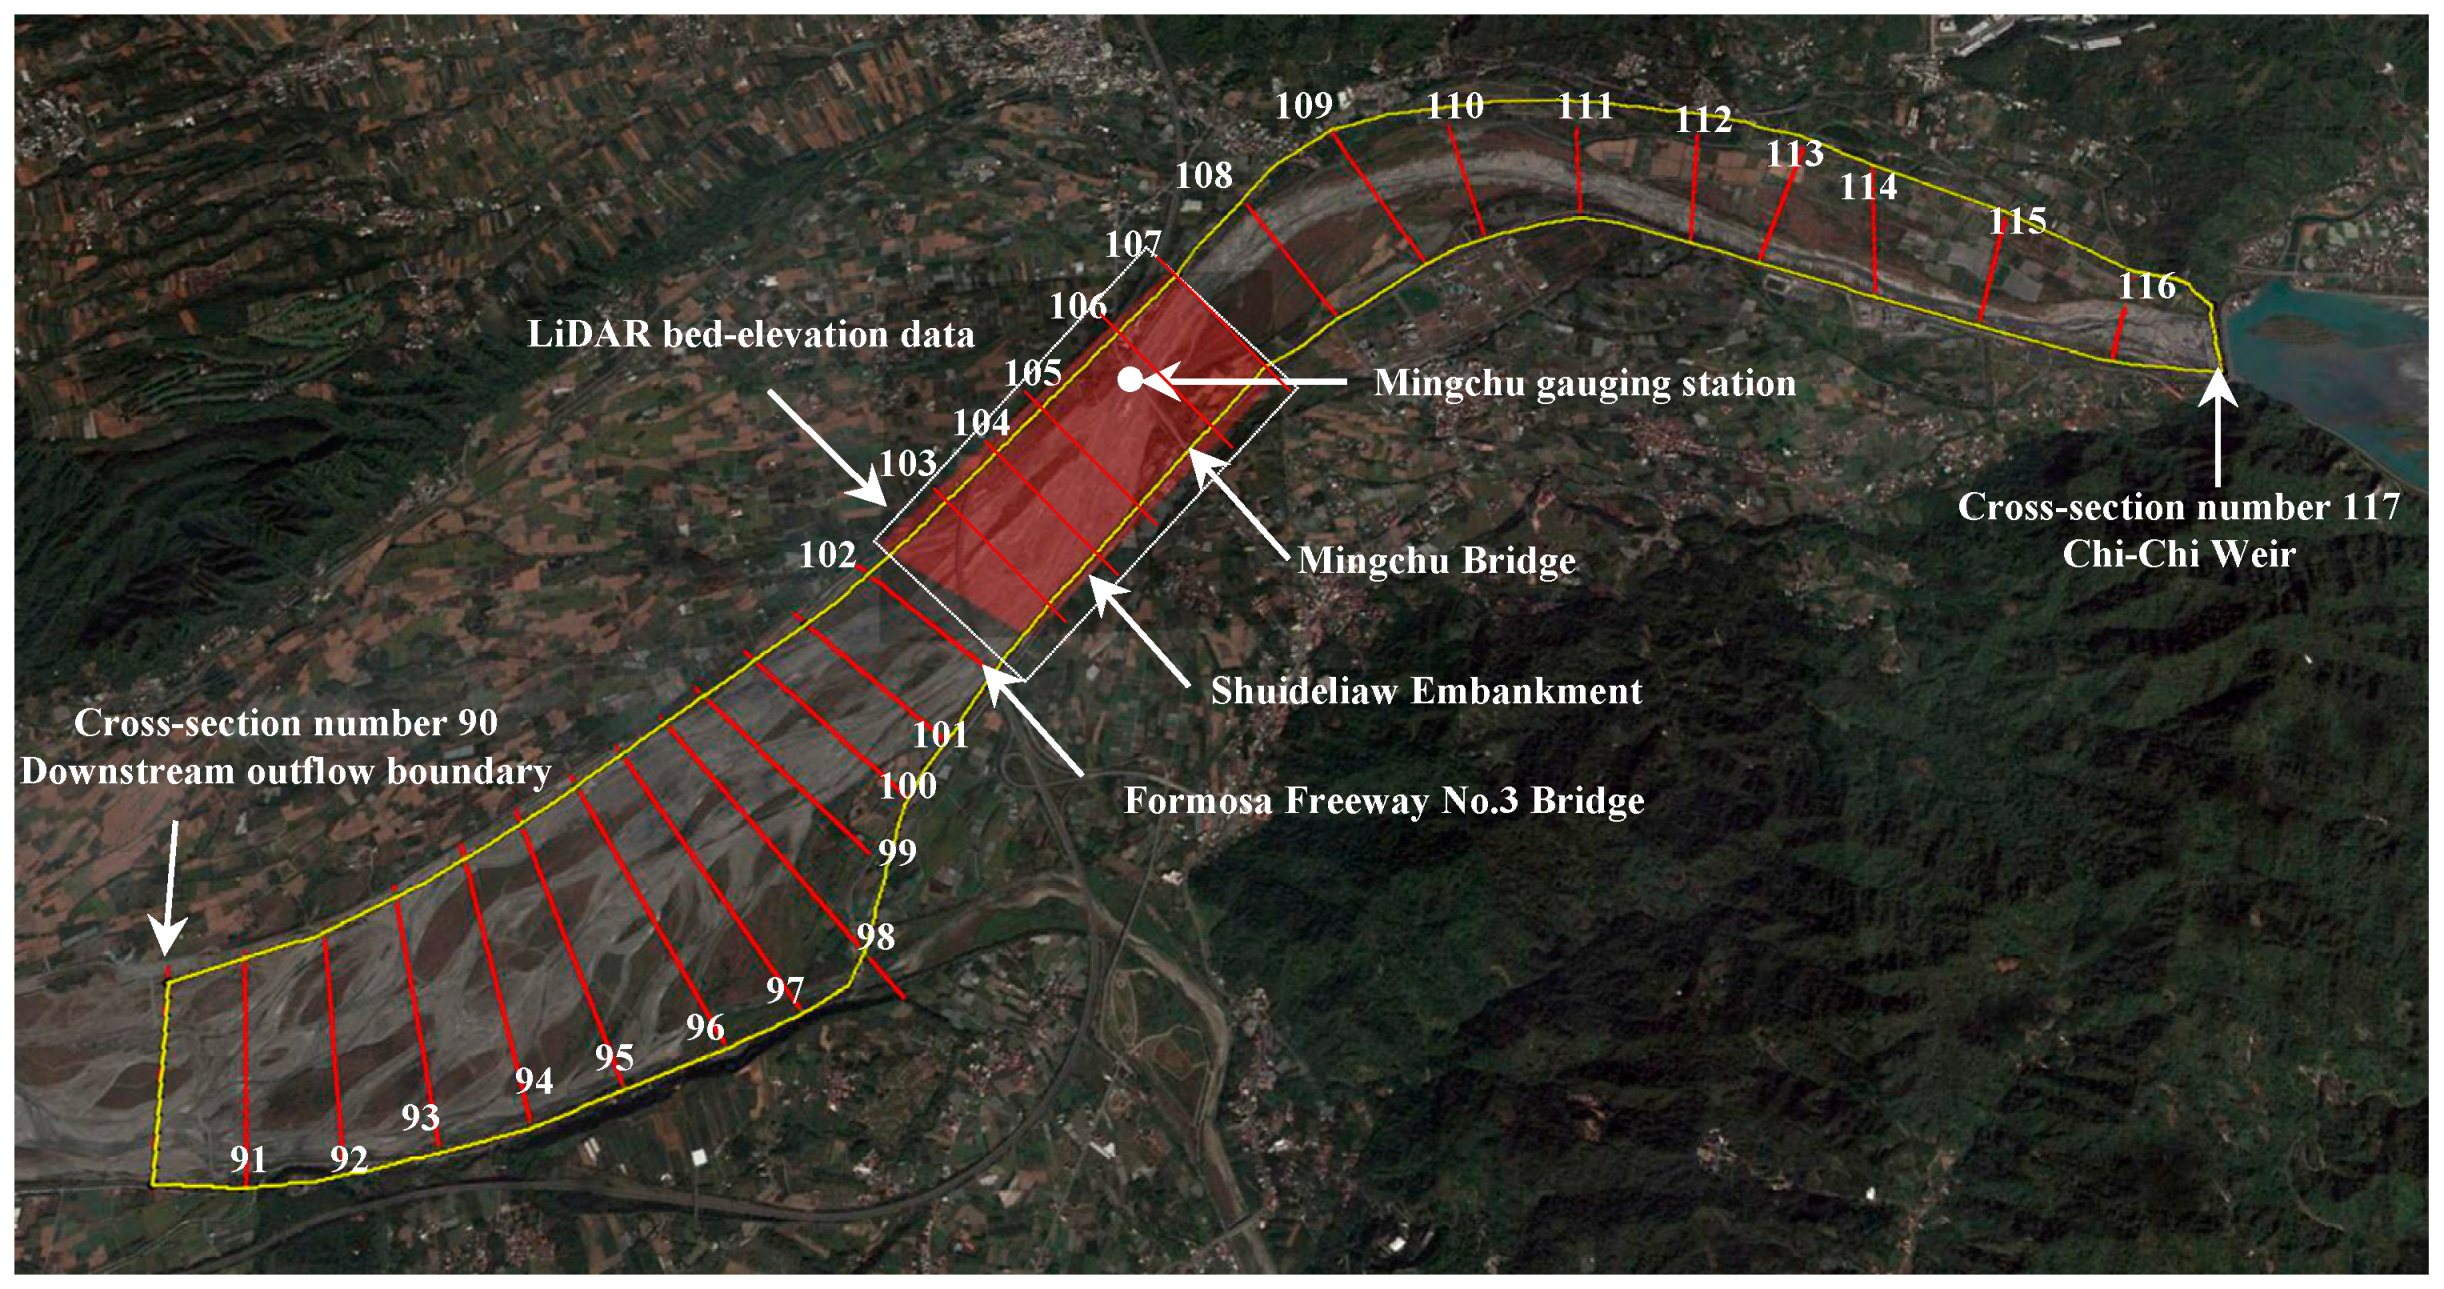
2.1. Site Description
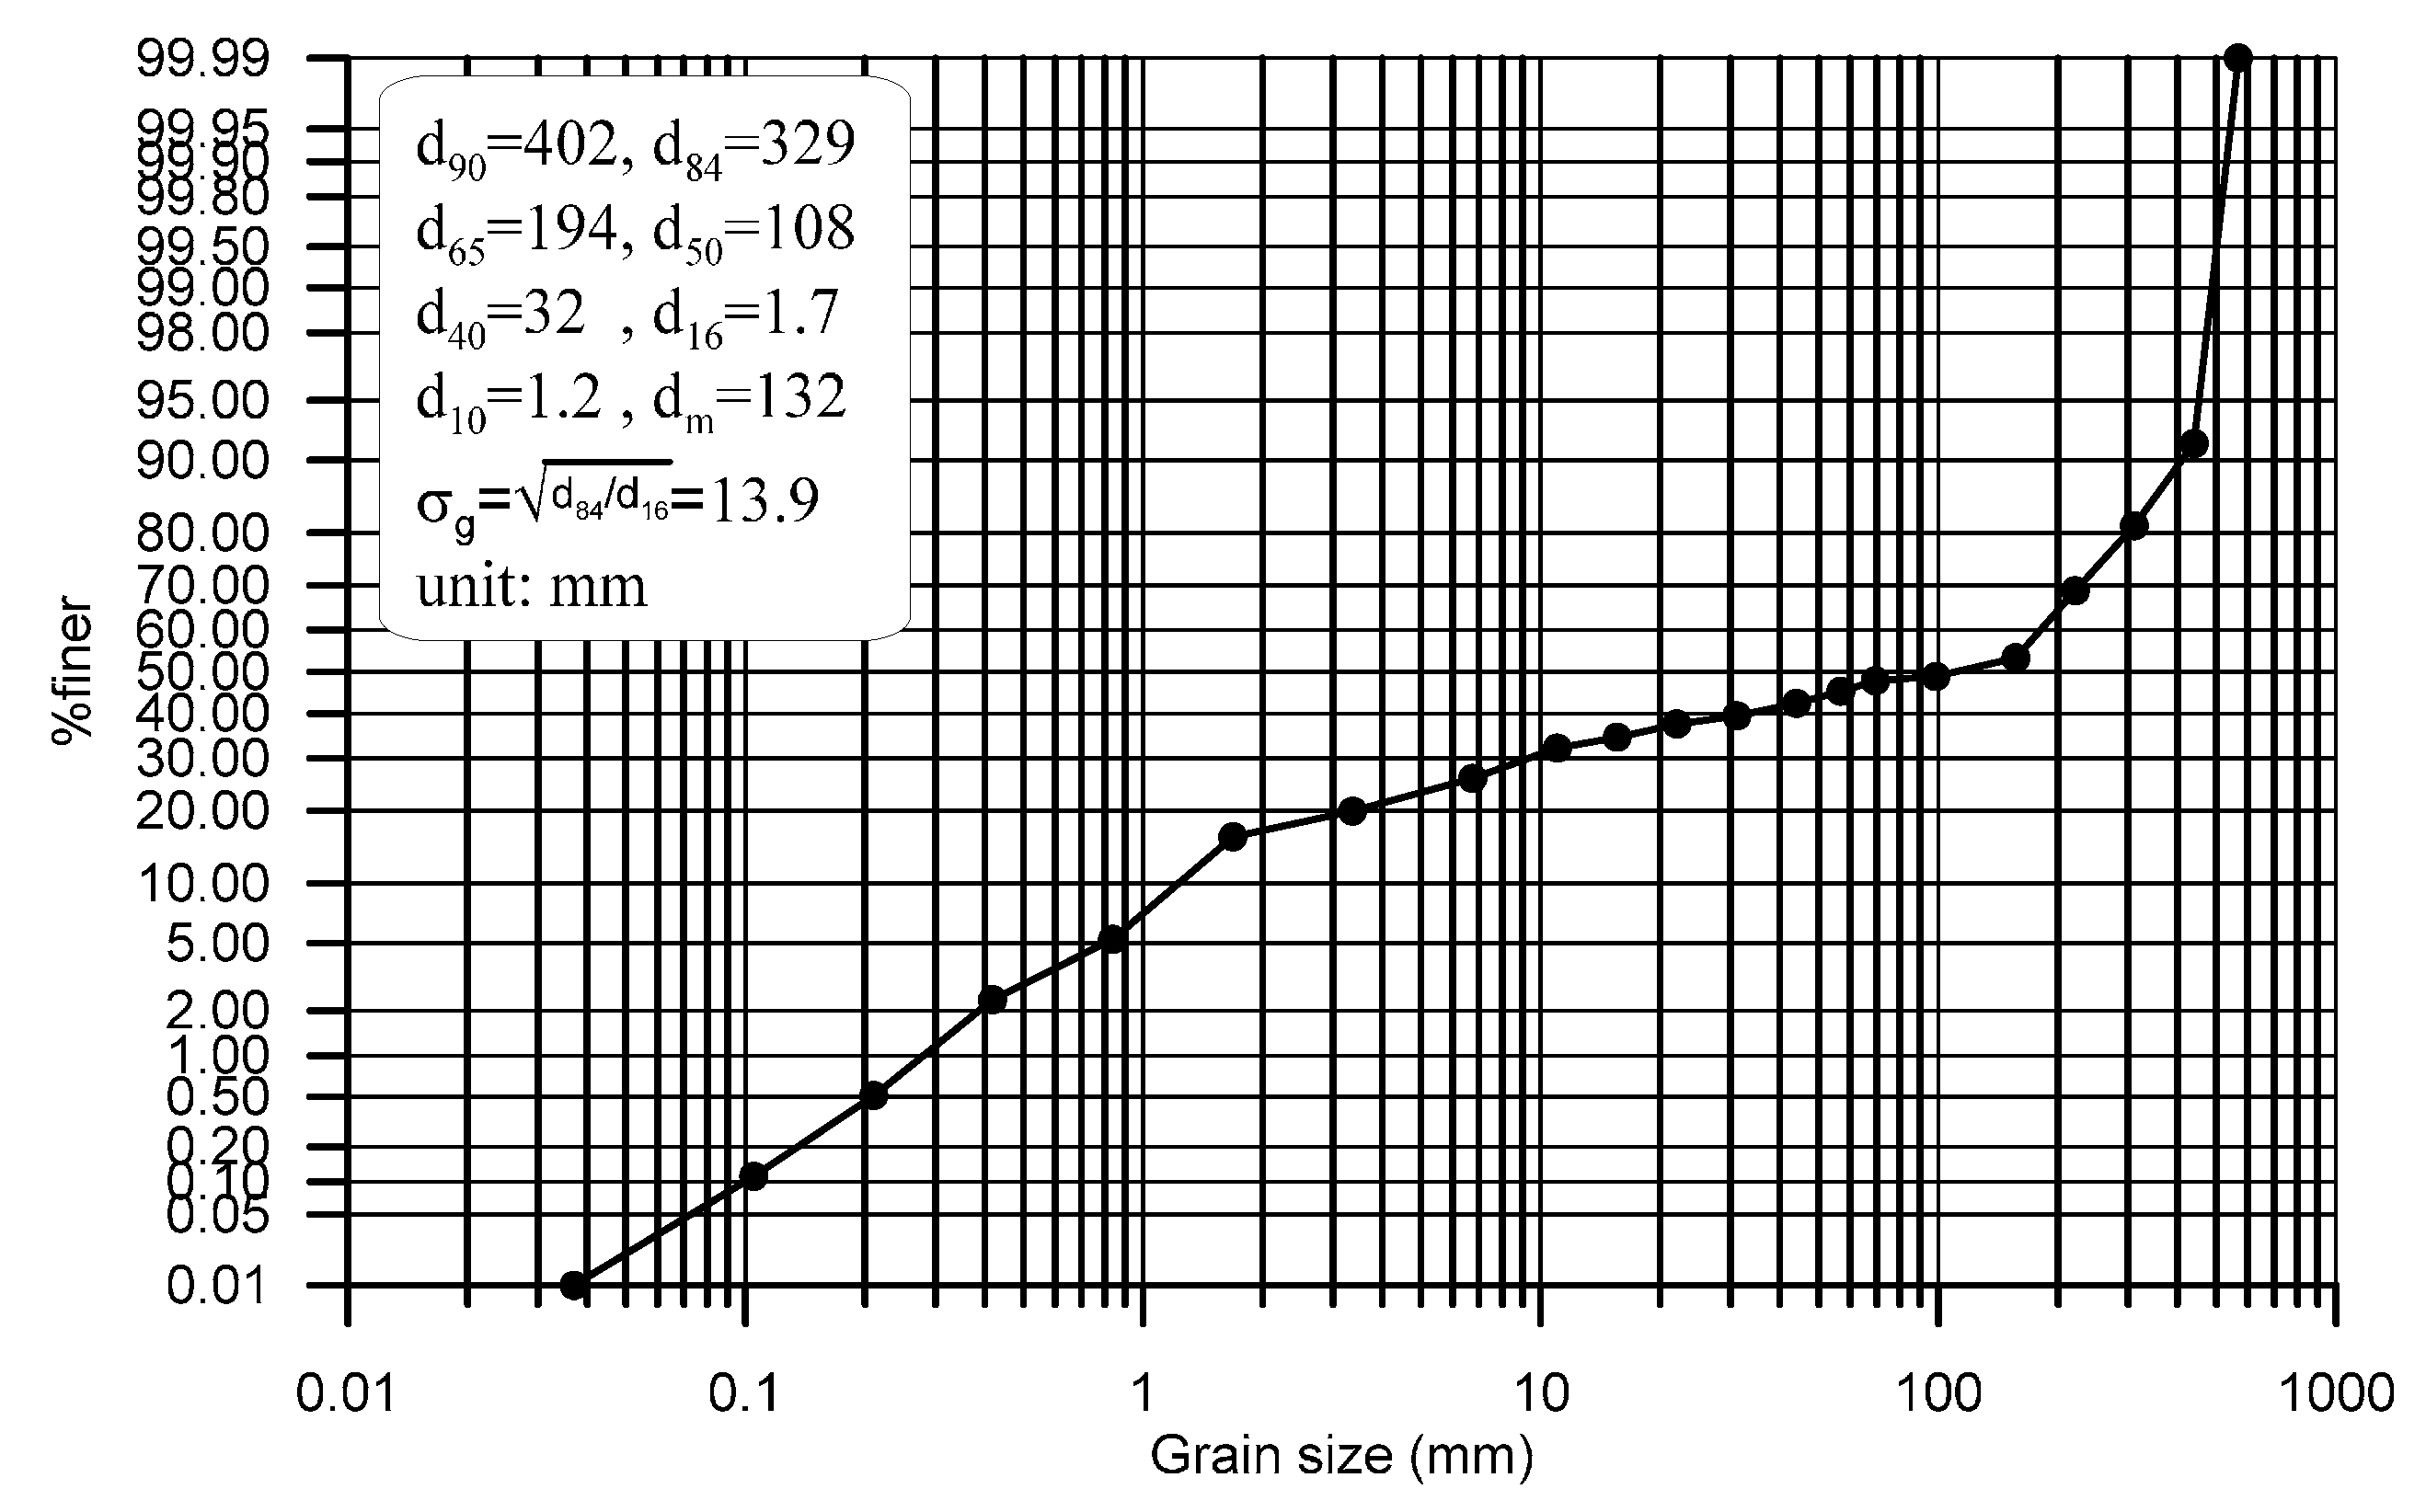
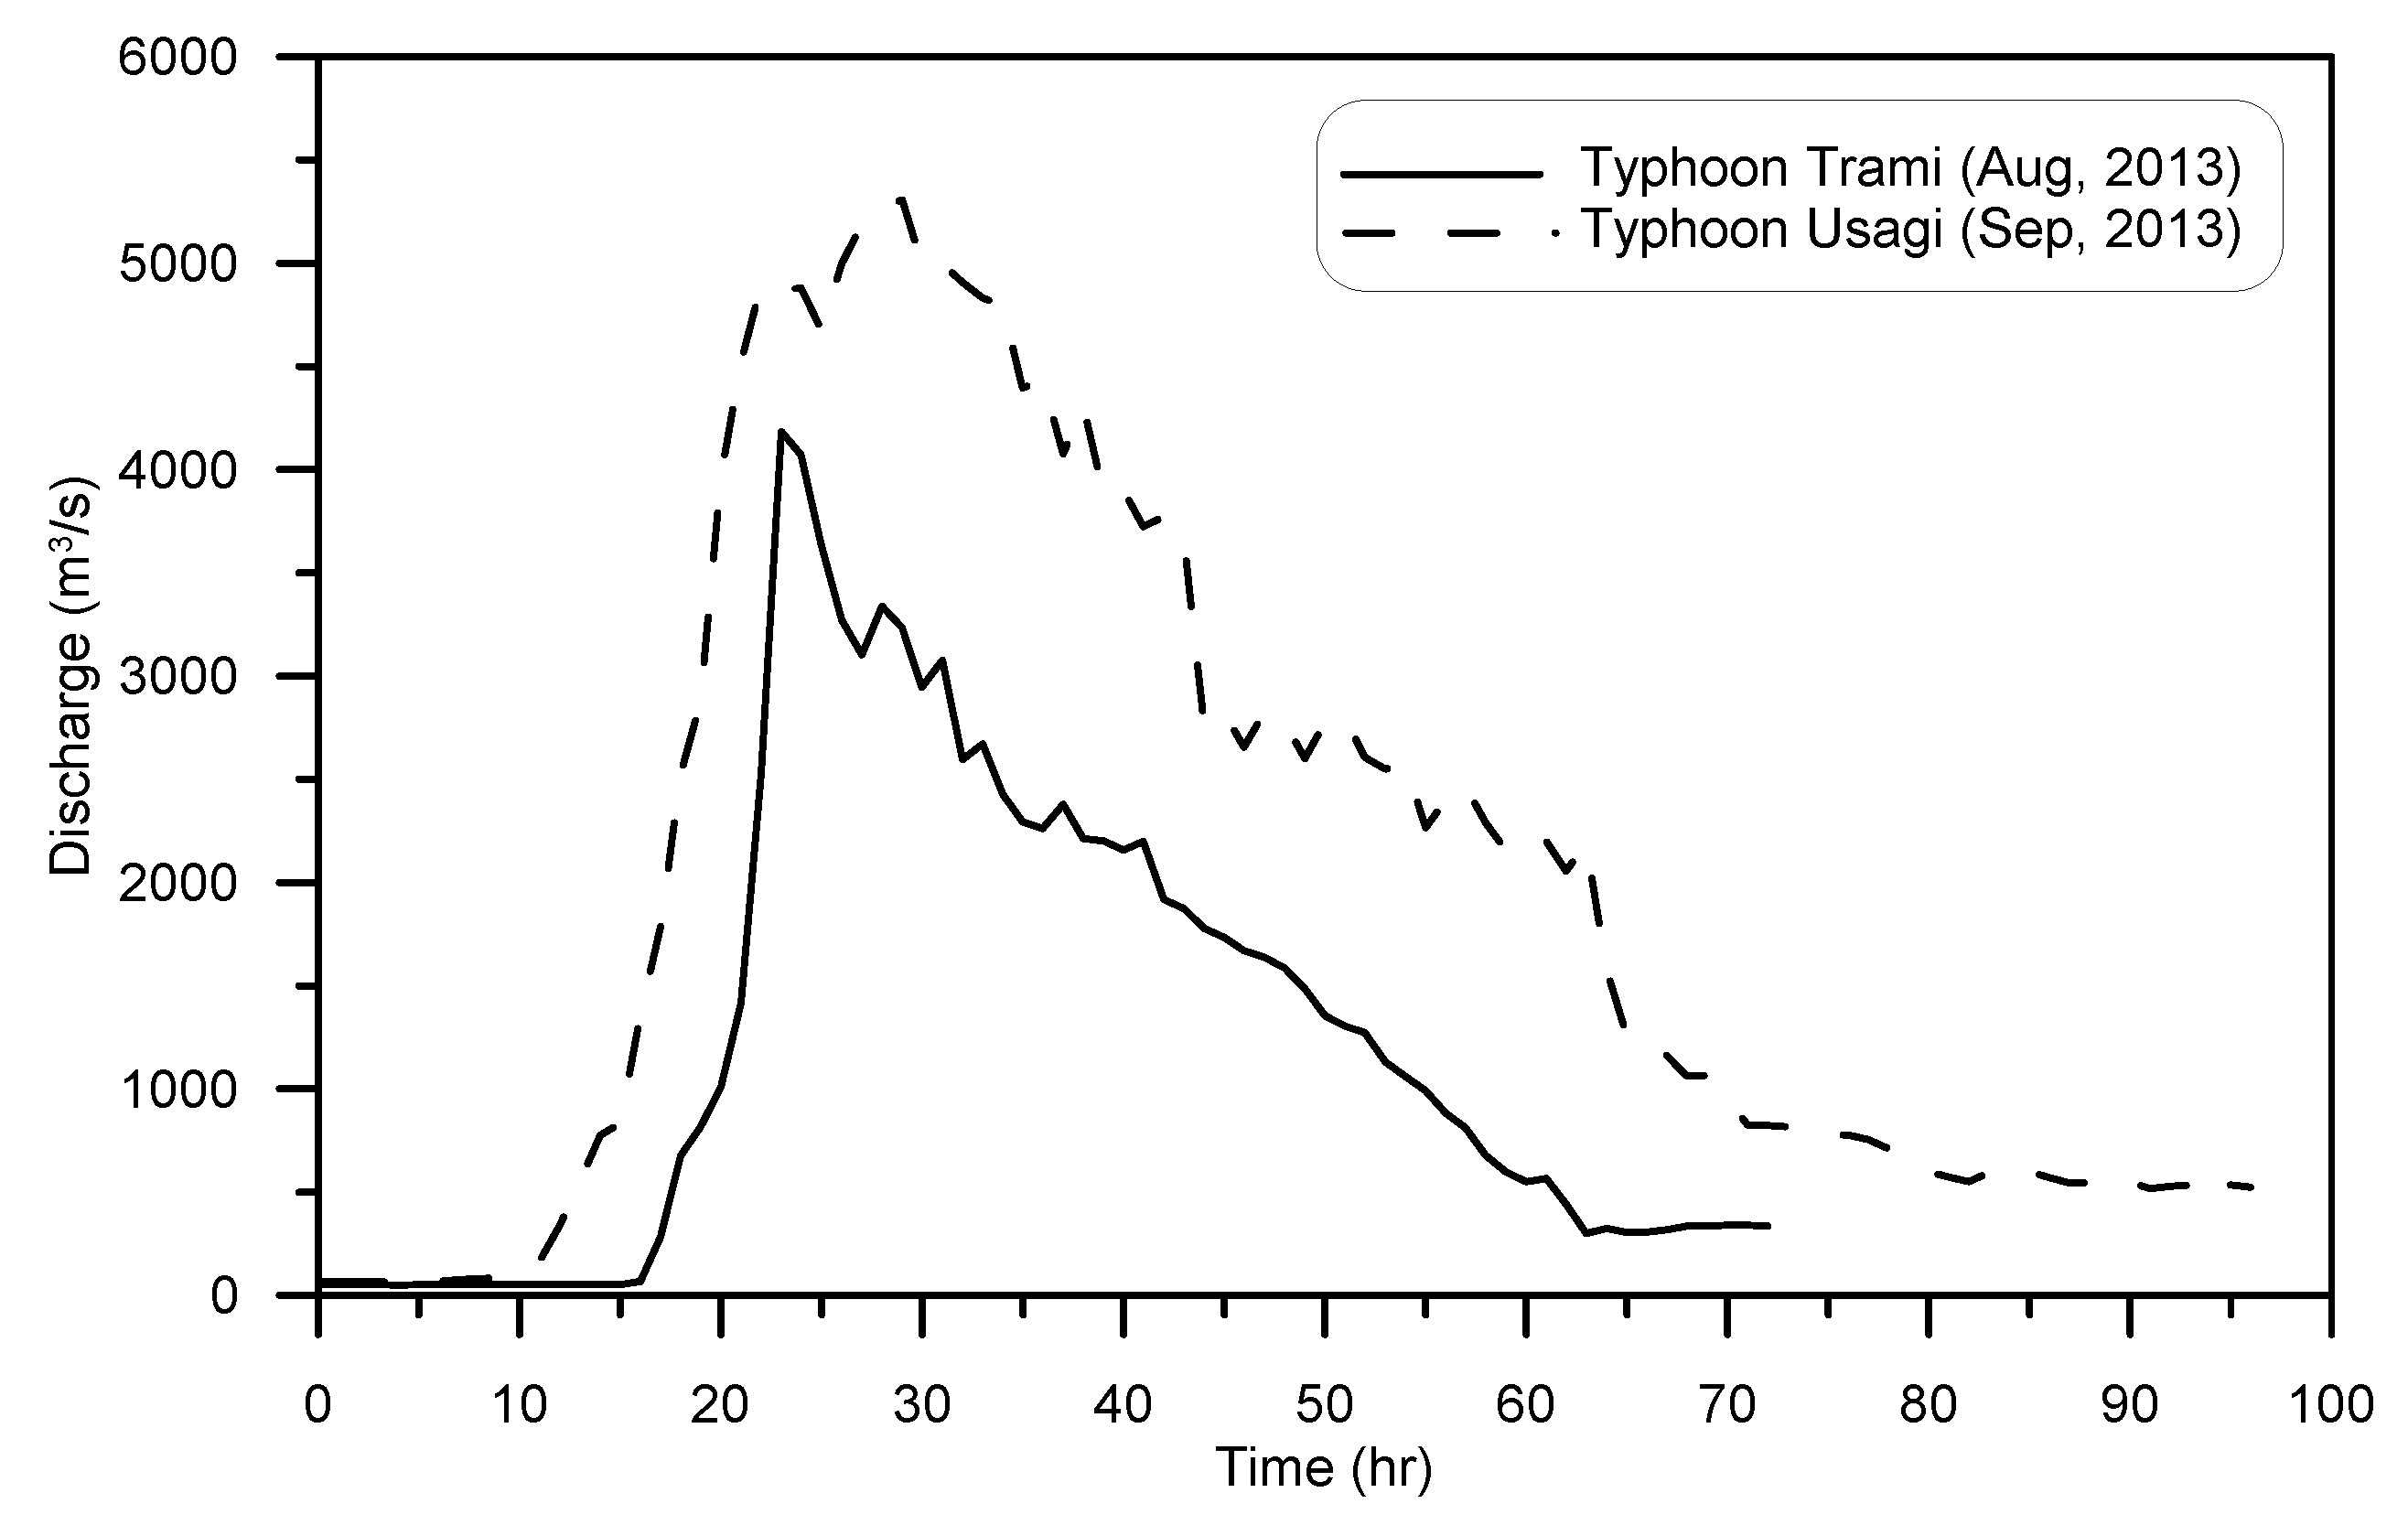
The field study site was chosen at the middle reach of the longest river in Taiwan, Cho-Shui River, from Chi-Chi Weir to Formosa Freeway No. 3 Bridge on the Cho-Shui River. A map of the Cho-Shui River basin and an aerial photograph near the Shuideliaw Embankment are shown in Figure 1 and Figure 2, respectively. The Cho-Shui River upstream of the Chi-Chi Weir, which was constructed to provide water for irrigation and industrial consumption, has a watershed area of 2034 km2. The aerial photograph in Figure 2a shows two concave embankments located near the Mingchu Bridge: one on the right-hand side upstream (but facing downstream) of the Mingchu Bridge, and the other on the left-hand side downstream of the bridge, where the Shuideliaw Embankment is located.
To prevent embankment erosion, the Fourth River Management Office constructed the Cho-Shui and Shuideliaw Embankments on the right-and left-hand sides (facing downstream) near the Mingchu Bridge, respectively. The Mingchu Bridge and Formosa Freeway No. 3 Bridge are 6.5 and 8.5 km, respectively, downstream of the Chi-Chi Weir. According to a field survey by the Water Resources Agency, the mean channel slope in the middle reach of the Cho-Shui River is 0.006, and there is no tributary between the Chi-Chi Weir and the Formosa Freeway No. 3 Bridge; therefore, the flow discharge at Mingchu Bridge and Shuideliaw Embankment was assumed to be the flow released from the Chi-Chi Weir. Because the distance between the field site and the river mouth is more than 45 km, the tidal effect does not influence the flows at the Mingchu Bridge and Shuideliaw Embankment.
Bed samples obtained in 2013 in the vicinity of the Shuideliaw Embankment show that the sediment was composed of non-cohesive alluvial gravels with various sands. Figure 3 shows the sediment particle size distribution near the Shuideliaw Embankment, clearly demonstrating that the distribution of particle size is bimodal. A survey of the bed materials revealed that the returned sediment sizes are of approximately d16 = 1.7 mm, median size d50 = 108 mm, and d84 = 329 mm.

2.2. Field Data

Su and Lu [32] proposed a highly efficient numbered-brick method to measure the general scour in natural channels. Lu [31] adopted this direct observation method for measuring the maximum bend scour depth near the Shuideliaw Embankment. In the present study, bend scour field data were collected as listed in Table 1. All of the study sites were associated with the scour measurements near the embankment toe and all of the scour depths were measured using the same numbered-brick method. The peak flow discharge Qp ranged from 164 to 5309 m3/s and the flow intensity (unit peak flow discharge qp) ranged from 1.31 to 25.37 m2/s. The channel slope s0 was also an important factor, with a range from 0.0063 to 0.0153, and the median particle size d50 of the bed materials was from 3.43 to 168 mm. The characteristic parameter for bend scour is the outer radius of the bend R0, which was recorded to range from 169 to 800 m. Finally, the measured maximum scour depth in a river bend was from 0.22 to 5.23 m. With these measured data, a reliable bend scour computation equation was developed, as described in Section 2.3. Furthermore, the measured data for two flood events, Typhoon Trami and Typhoon Usagi, were adopted in the present study to verify the accuracy of the proposed method, as described in Section 4.2. Figure 4 shows the flow hydrographs released from the Chi-Chi Weir for Typhoon Trami (August 2013) and Typhoon Usagi (September 2013).

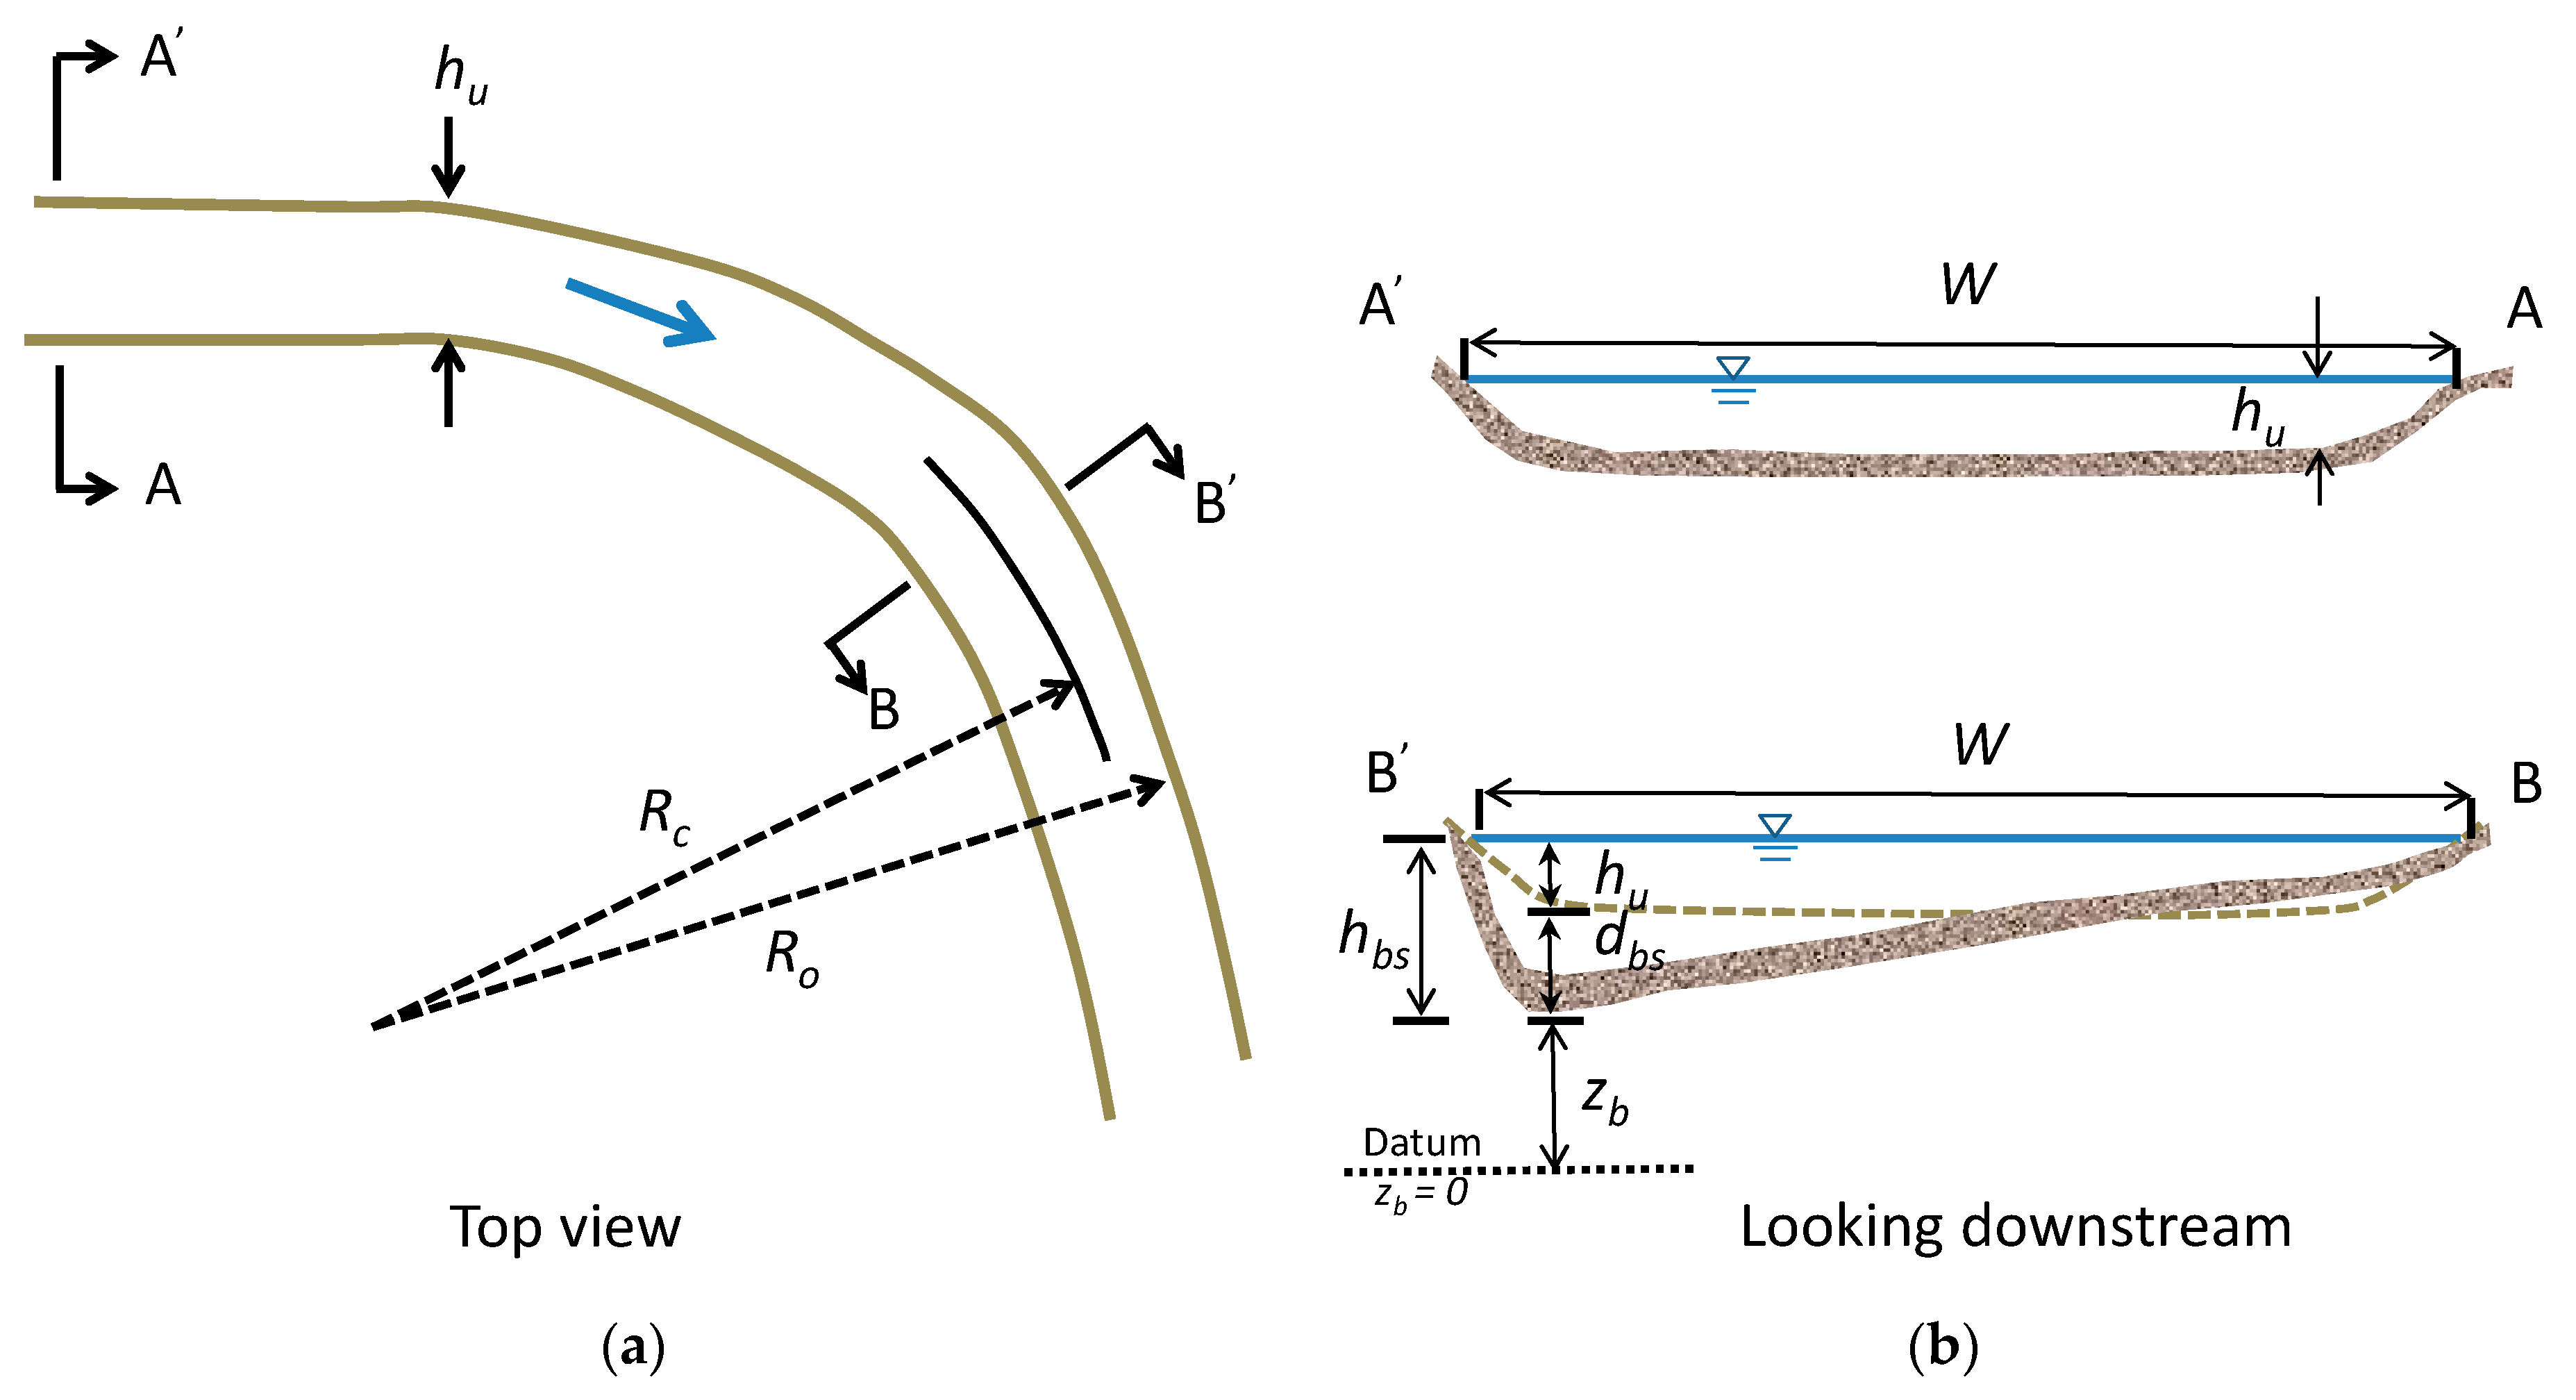
2.3. Proposed Bend Scour Computation Equation

According to Melville and Coleman [23], bend scour may occur in bend reaches and is categorized as short-term general scour. Several empirical equations for estimating bend scour have been developed in the literature [23]. Three previous empirical equations are used in this study, and the corresponding schematic definition terms are shown in Figure 5.
First, Galay et al. [27] developed an empirical equation for rigid (non-eroding outer bank) bend of 60° in a gravel-bed river reach:
h b s h u = 1.2 + W R c ,
where h b s denotes the maximum flow depth in the bend cross-section B’B, h u is the water depth in the upstream straight reach A’A, W denotes the water surface width, and R c is the centerline radius of the bend. Next, using the scour data from 70 bends in a reach of the Red River between Arkansas and Louisiana in the USA, Thorne [28] developed the following regression equation:
h b s h u = 2.07 0.19 ln ( R c W 2 ) .
Notably, Equation (2) is limited to R c / W greater than 2.0 based on the scour dataset. However, a best-fit regression equation was found by the U.S. Army Corps of Engineering [29]:
h b s h u = 2.57 0.36 ln ( R c W ) .
These three equations were developed using the bend factors R c and W as the primary parameters. However, on the basis of the bend scour data collected in this study, the sediment size as well as the standard deviation of particle size distribution was found to significantly affect the bend scour depth. Moreover, the composite of the sediment around the embankment toe also affects the scouring processes. For example, the scouring process would be different under the same approach flow conditions with non-cohesive or cohesive sediments. In this study, the field data collected in Table 1 were non-cohesive sediments. To focus on the field site we investigated, only non-cohesive sediments were considered in developing bend scour formula. Therefore, this study proposes a new computation equation. The characteristic parameters of bend scour estimation can be defined as:
ϕ ( d b s , q , ρ , s 0 , g , flow d 50 , σ g , ρ s , sediment W , R 0 bend ) ,
where dbs is the bend scour depth; q is the unit discharge; ρ is the density of fluid; g is the gravitational acceleration; s 0 is the channel slope; d50 is the median particle diameter; σg is the geometric standard deviation of the particle size distribution; ρs is the density of sediment particles; and R0 (= Rc + 0.5 W) is the outer radius of the bend. Based on Buckingham’s π theorem, bend scour depth can be written in the following dimensionless form:
d b s d 50 = ϕ ( q ( ρ s / ρ 1 ) g d 50 3 , s 0 , σ g , W R 0 ) .
In the present study, multiple regression analysis is then conducted with the measured field data listed in Table 1:
d b s d 50 = 0.187 ( q ( ρ s / ρ 1 ) g d 50 3 ) 0.93 s 0 0.191 σ g 0.382 ( W R c + 0.5 W ) 0.1 ,
which has a coefficient (R-squared value) of 0.924, indicating that the short-term bend scour depths computed by Equation (6) fit the measured data well, as shown in Figure 6. It should be noted that only 10 sets of data were used for calibration, while the remaining two sets of data were used for verification, as indicated in Figure 6. Bend scour depth was found to be directly proportional to unit discharge, channel slope, and water surface width, and inversely proportional to the centerline radius of the bend.

3. Method for Embankment Toe Scour Simulation

For an embankment located on a river bend, bend scour can lead to increased scour at the embankment toe. The physically based numerical models of bend scour simulation, as discussed in Section 1, present too much uncertainty due to the many parameters used in modeling. Therefore, a simple method with few parameters is most appropriate. Following the numerical framework proposed by Hong et al. [22], a new composite method based on the combination of flow, general, and bend scour computation equations is proposed herein to estimate the evolution of scour depth at an embankment toe on a river bend. Overall, the first step is to estimate the evolution of general scour depth by combining a 2D finite-volume model with a general scour computation equation. The next step is to modify the approach flow depth and velocity upstream of the embankment toe. The last step is to use the revised approach flow conditions for determining the bend scour depth evolution. The simulation procedure for embankment toe scour is presented in detail in Section 3.3.

3.1. 2D Finite-Volume Hydraulic Model

The 2D model [24,25,26] is based on a finite-volume model in the unstructured arbitrarily shaped mesh system. The governing equations for 2D shallow water flow, including the continuity and momentum equations, can be expressed as:
Q t + F I x + G I y = F V x + G V y + S ,
in which
Q = [ h , h u , h v ] T
F I = [ h u , h u 2 + 1 / 2 g h 2 , h u v ] T ; G I = [ h v , h u v , h v 2 + 1 / 2 g h 2 ] T
F V = [ 0 , h T x x / ρ , h T x y / ρ ] T ; G V = [ 0 , h T x y / ρ , h T y y / ρ ] T
S = [ 0 , g h ( s 0 x s f x ) , g h ( s 0 y s f y ) ] T ,
where Q is the vector of conserved variables; FI and GI are the inviscid flux vectors in the x- and y-directions, respectively; FV and GV are the viscous flux vectors in the x- and y-directions, respectively; S is the source term; h is the water depth; u and v are the depth-averaged velocity components in the x- and y-directions, respectively; ρ is the density of flow; Txx, Txy, and Tyy are the depth-averaged turbulent stresses; g is the gravitational acceleration; s0x and s0y are the bed slopes in the x- and y-directions, respectively; and sfx and sfy are the friction slopes in the x- and y-directions, respectively.
The finite-volume model was adopted to solve the 2D governing equations, leading to the following basic vector equation:
A d Q d t + m = 1 M T ( θ ) 1 F ( Q ¯ ) L m = S ˜ ,
in which A is the area of the cell; m is the index that represents the side of the cell; M is the total number of the sides for the cell; T(θ)−1 is the inverse of the rotation matrix corresponding to the m side; θ is the angle between the outward unit vector n and the x-axis; n is the outward unit vector normal to the boundary of the control volume; Lm is the length of the m side for the cell; F ( Q ¯ ) = F I ( Q ¯ ) F V ( Q ¯ ) is the numerical flux; F I ( Q ¯ ) represents the inviscid numerical flux; F V ( Q ¯ ) denotes the viscous numerical flux; and S ˜ is the integral form of the source terms. To resolve discontinuous shock waves or hydraulic jumps, many different types of approximate Riemann solvers have been developed for estimating the inviscid numerical flux F I ( Q ¯ ) . This paper employs an upstream flux-splitting finite-volume scheme [24] to obtain the inviscid numerical flux. In addition, the Jacobian transformation method [25] is used to estimate the viscous numerical flux.
To avoid the generation of numerical errors due to unphysical high velocities at wet/dry fronts, the wet/dry boundary treatment of the model is improved herein. This paper introduces a positive tolerance depth h t o l to deal with wet/dry boundary tracking:
  • The cell interface is the dry edge, when h L h t o l and h R h t o l , in which h L and h R are the left and right water depths at the center of the cell interface, respectively. There is no flux estimation.
  • The cell interface is the wet edge, when h L > h t o l and h R > h t o l . The upstream flux-splitting finite-volume scheme coupled with the hydrostatic reconstruction method [24] is adopted to estimate the well-balanced numerical fluxes.
  • The cell interface is the partially wet edge with flux, when h L > h t o l , h R h t o l , and h L + ( z b ) L > h R + ( z b ) R , where zb is the bed elevation. The momentum flux is set at 0 and the mass flux (hu)LR at cell interface LR is estimated as:
    δ η = h L + ( z b ) L h R ( z b ) R
    ( h u ) L R = 1.42 δ η | δ η | .
  • The cell interface is the partially wet edge without flux, when h L > h t o l , h R h t o l , and h L + ( z b ) L h R + ( z b ) R . According to the bed elevation condition, there is no flux across the cell interface. Thus, no flux estimation is required.
A detailed description of the model can be found in the literature [24,25,26]. In practice, the presented 2D model adopts a well-balanced upwind numerical scheme coupled with a robust wet/dry algorithm. Hence, the model is a useful hydraulic modeling tool to simulate 2D hydraulic flows involving irregular bed topography.

3.2. General Scour Computation Equation

Many of the equations for scour estimation (general, contraction, or local scour) were developed according to the analysis of data from laboratory research. However, these equations derived from laboratory studies may not be suitable for field application of scouring. To overcome this problem, Hong et al. [22] proposed a general scour computation equation. This reliable equation is based on the results of general scour depth measurements through the numbered-brick method. The dimensionless equation can be expressed as:
d g s d 50 = 7.271 ( q ( ρ s / ρ 1 ) g d 50 3 ) 0.514 s o 0.071 ( σ g ) 0.014 ,
in which dgs denotes the short-term general scour depth. The accuracy of Equation (15) has been verified to give satisfactory results when estimating the short-term general scour depth in the Cho-Shui River [22].

3.3. Method for Simulating Bend Scour Depth Evolution

For sediment transport modeling, the type of soil is important, as discussed in Abou-Seida et al. [33]. However, the study site is located in a gravel river with non-cohesive size classes, as shown in Figure 3. Therefore, the effect of cohesive sediment transport on bend scour is not considered herein. Consequently, the proposed Equations (6) and (15) are only suitable for general and bend scour estimation of non-cohesive sediment, respectively.
As shown in Figure 7, the algorithm for estimating bend scour depth evolution is summarized as follows:
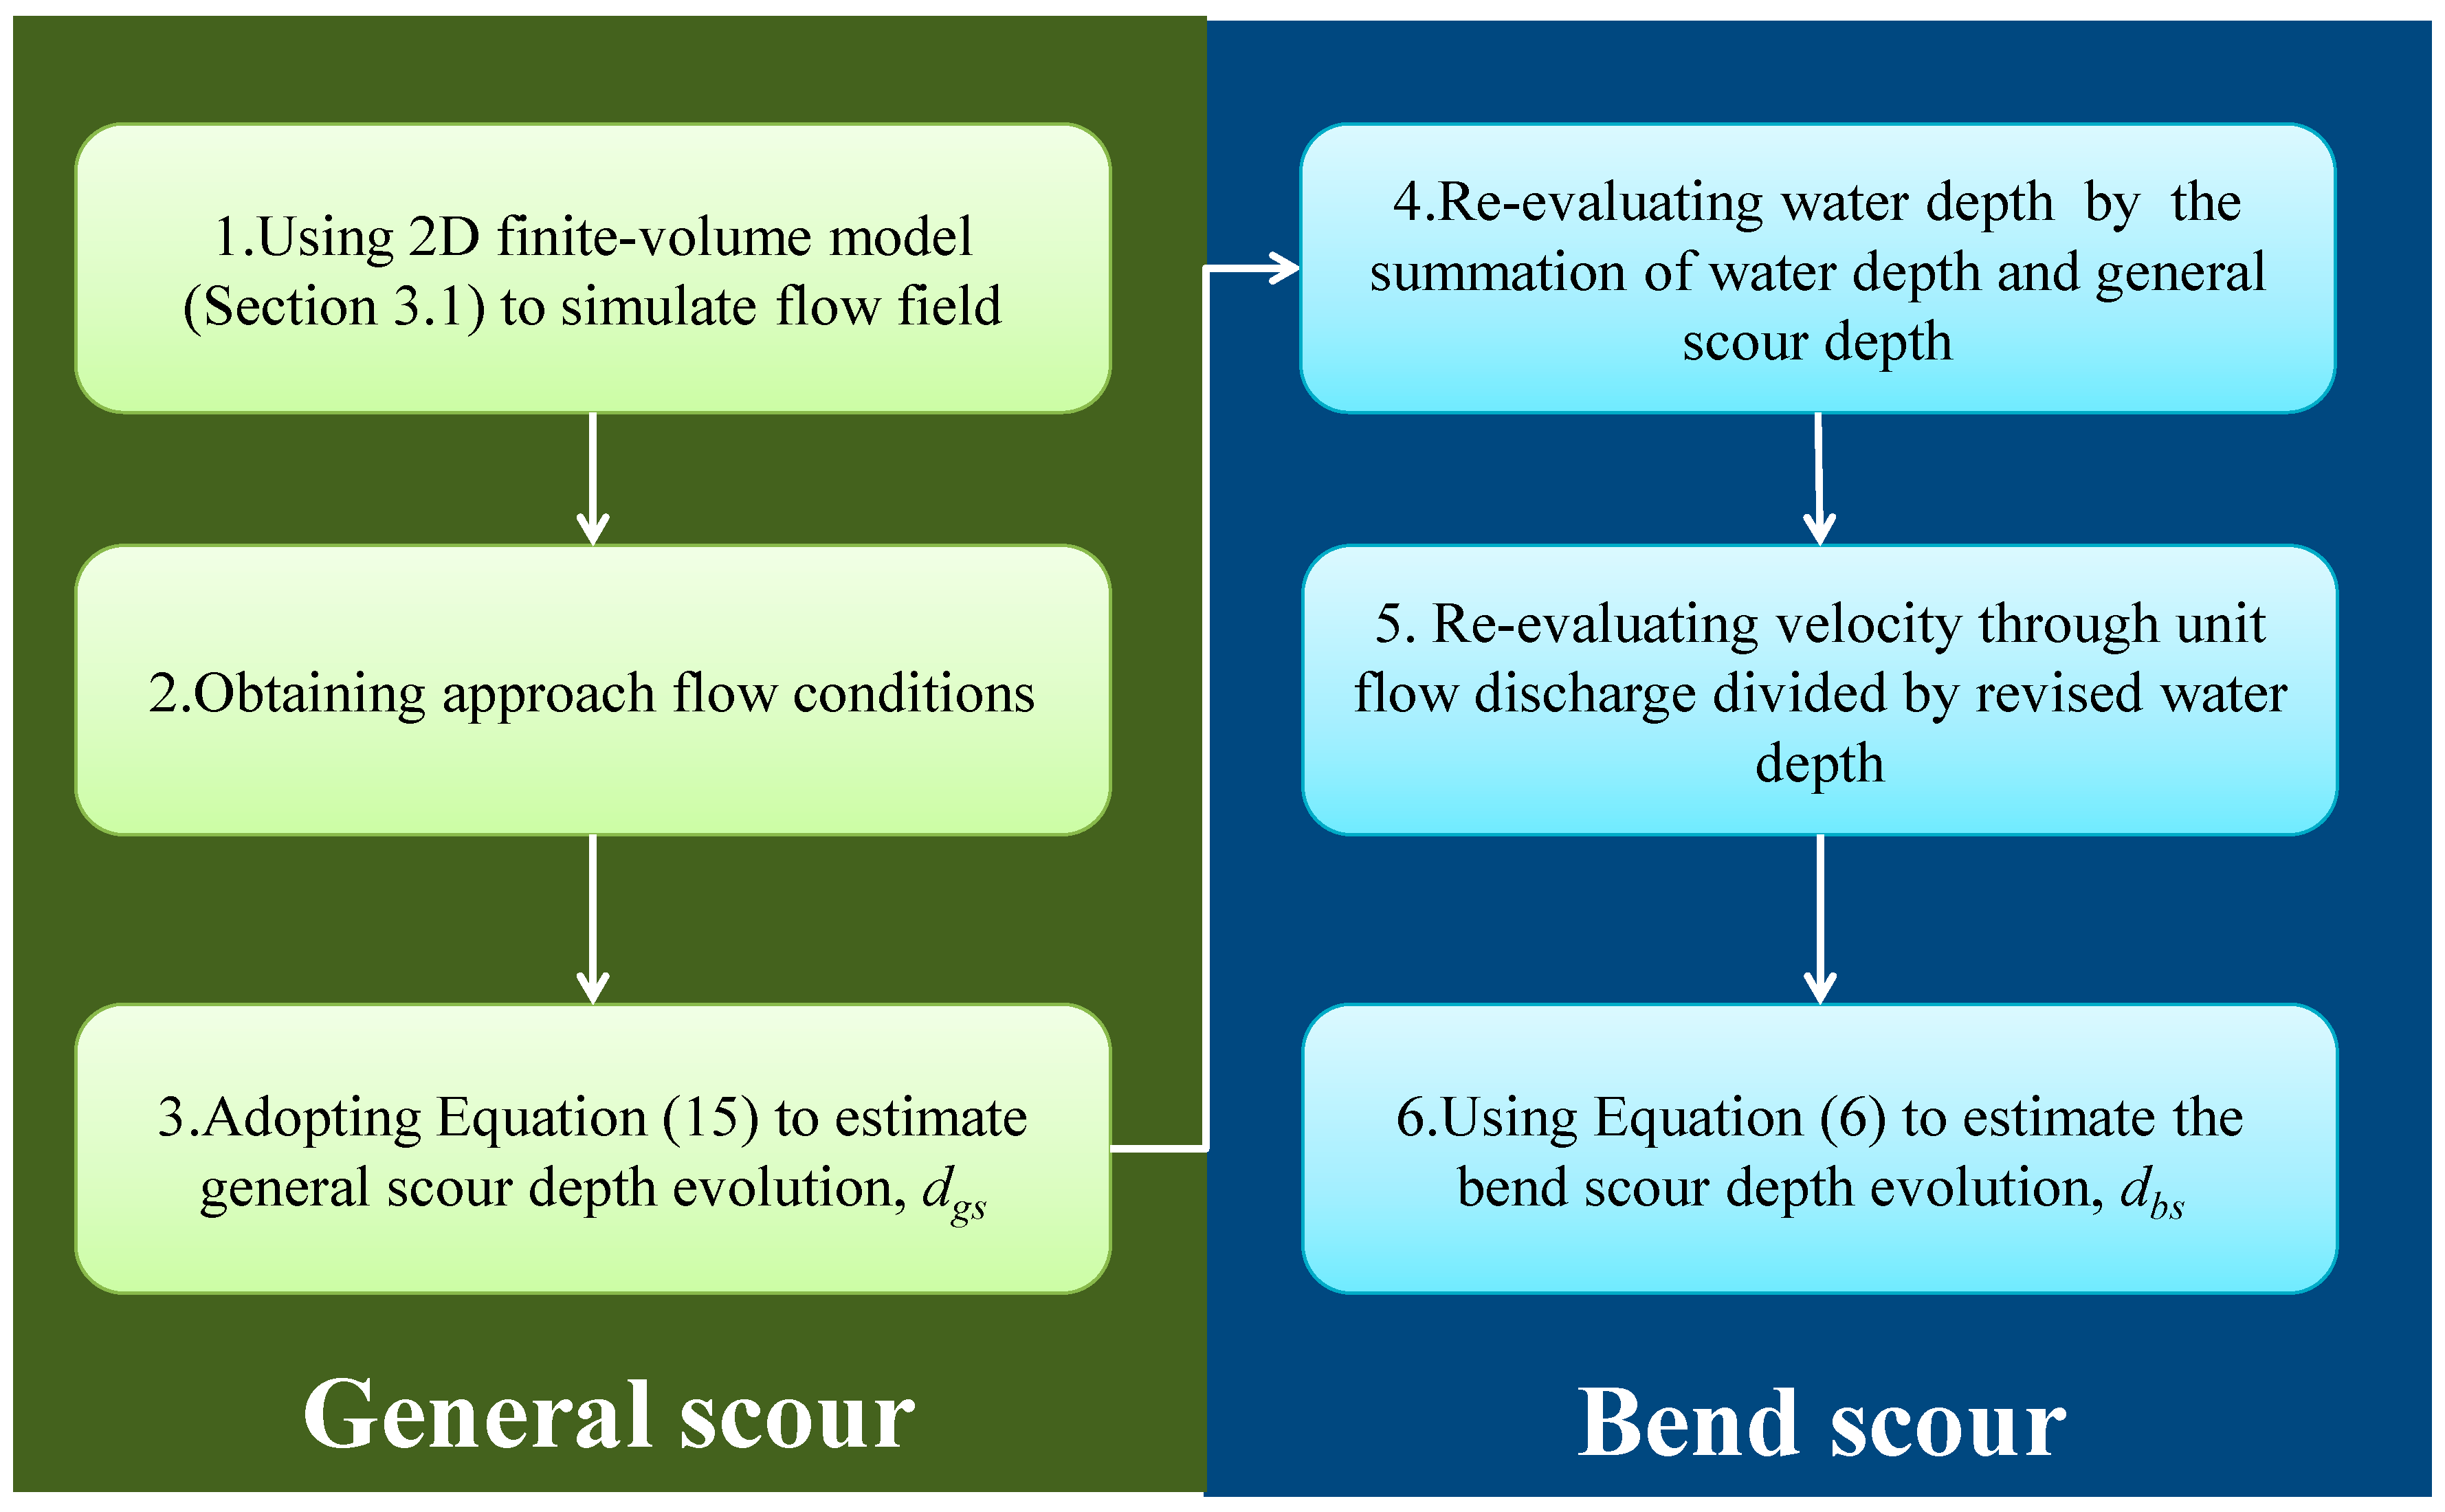
  • Inputting flow hydrographs (simulation time step is 1 h), setting model parameters (i.e., numerical time step and Manning roughness coefficients), and then simulating the 2D flow field in the bend reach through the proposed 2D finite-volume hydraulic model (Section 3.1). At the end of each simulation time step, the water depth and velocity in each computational cell are outputted.
  • After 2D flow simulation, one obtains the approach flow conditions (i.e., entire hydrographs) at the specific computational cell, including water depth, velocities, water surface width, and the centerline radius of the bend.
  • For each simulation time step (1 h), one substitutes the approach flow conditions into the general scour computation equation (i.e., Equation (15)) to achieve the estimated general scour depth. After the entire general scour simulation, the evolution of the estimated general scour depth is thus obtained.
  • For each simulation time step (1 h), one re-evaluates the water depth by adding the water depth and the estimated general scour depth to obtain the revised water depth: h ˜ = h + d g s .
  • For each simulation time step (1 h), one re-evaluates velocity through unit flow discharge divided by revised water depth and obtains the revised velocity as v ˜ = q / h ˜ .
  • For each simulation time step (1 h), one substitutes the revised flow conditions (i.e., h u = h ˜ ) into Equations (1)–(3) and (6) to obtain the bend scour depth. After entire bend scour simulation, the evolution of the estimated bend scour depth is thus obtained.
The output variable of Equations (1)–(3) is the maximum flow depth (i.e., h b s ), whereas the output estimated value of Equation (6) is the bend scour depth (i.e., d b s ). In this paper, the bend scour depth is selected to be a common basis for comparison. As shown in Figure 5, the bend scour depth equals maximum flow depth minus revised water depth. Based on this relationship ( d b s = h b s h ˜ ), the maximum flow depths estimated by the three equations were transferred to the bend scour depths. Then, the transferred bend scour depths were compared with the bend scour depths estimated by the proposed method. Consequently, the results discussed in Section 4.2 are on the basis of the same physical variables (i.e., computed and measured bend scour depths).

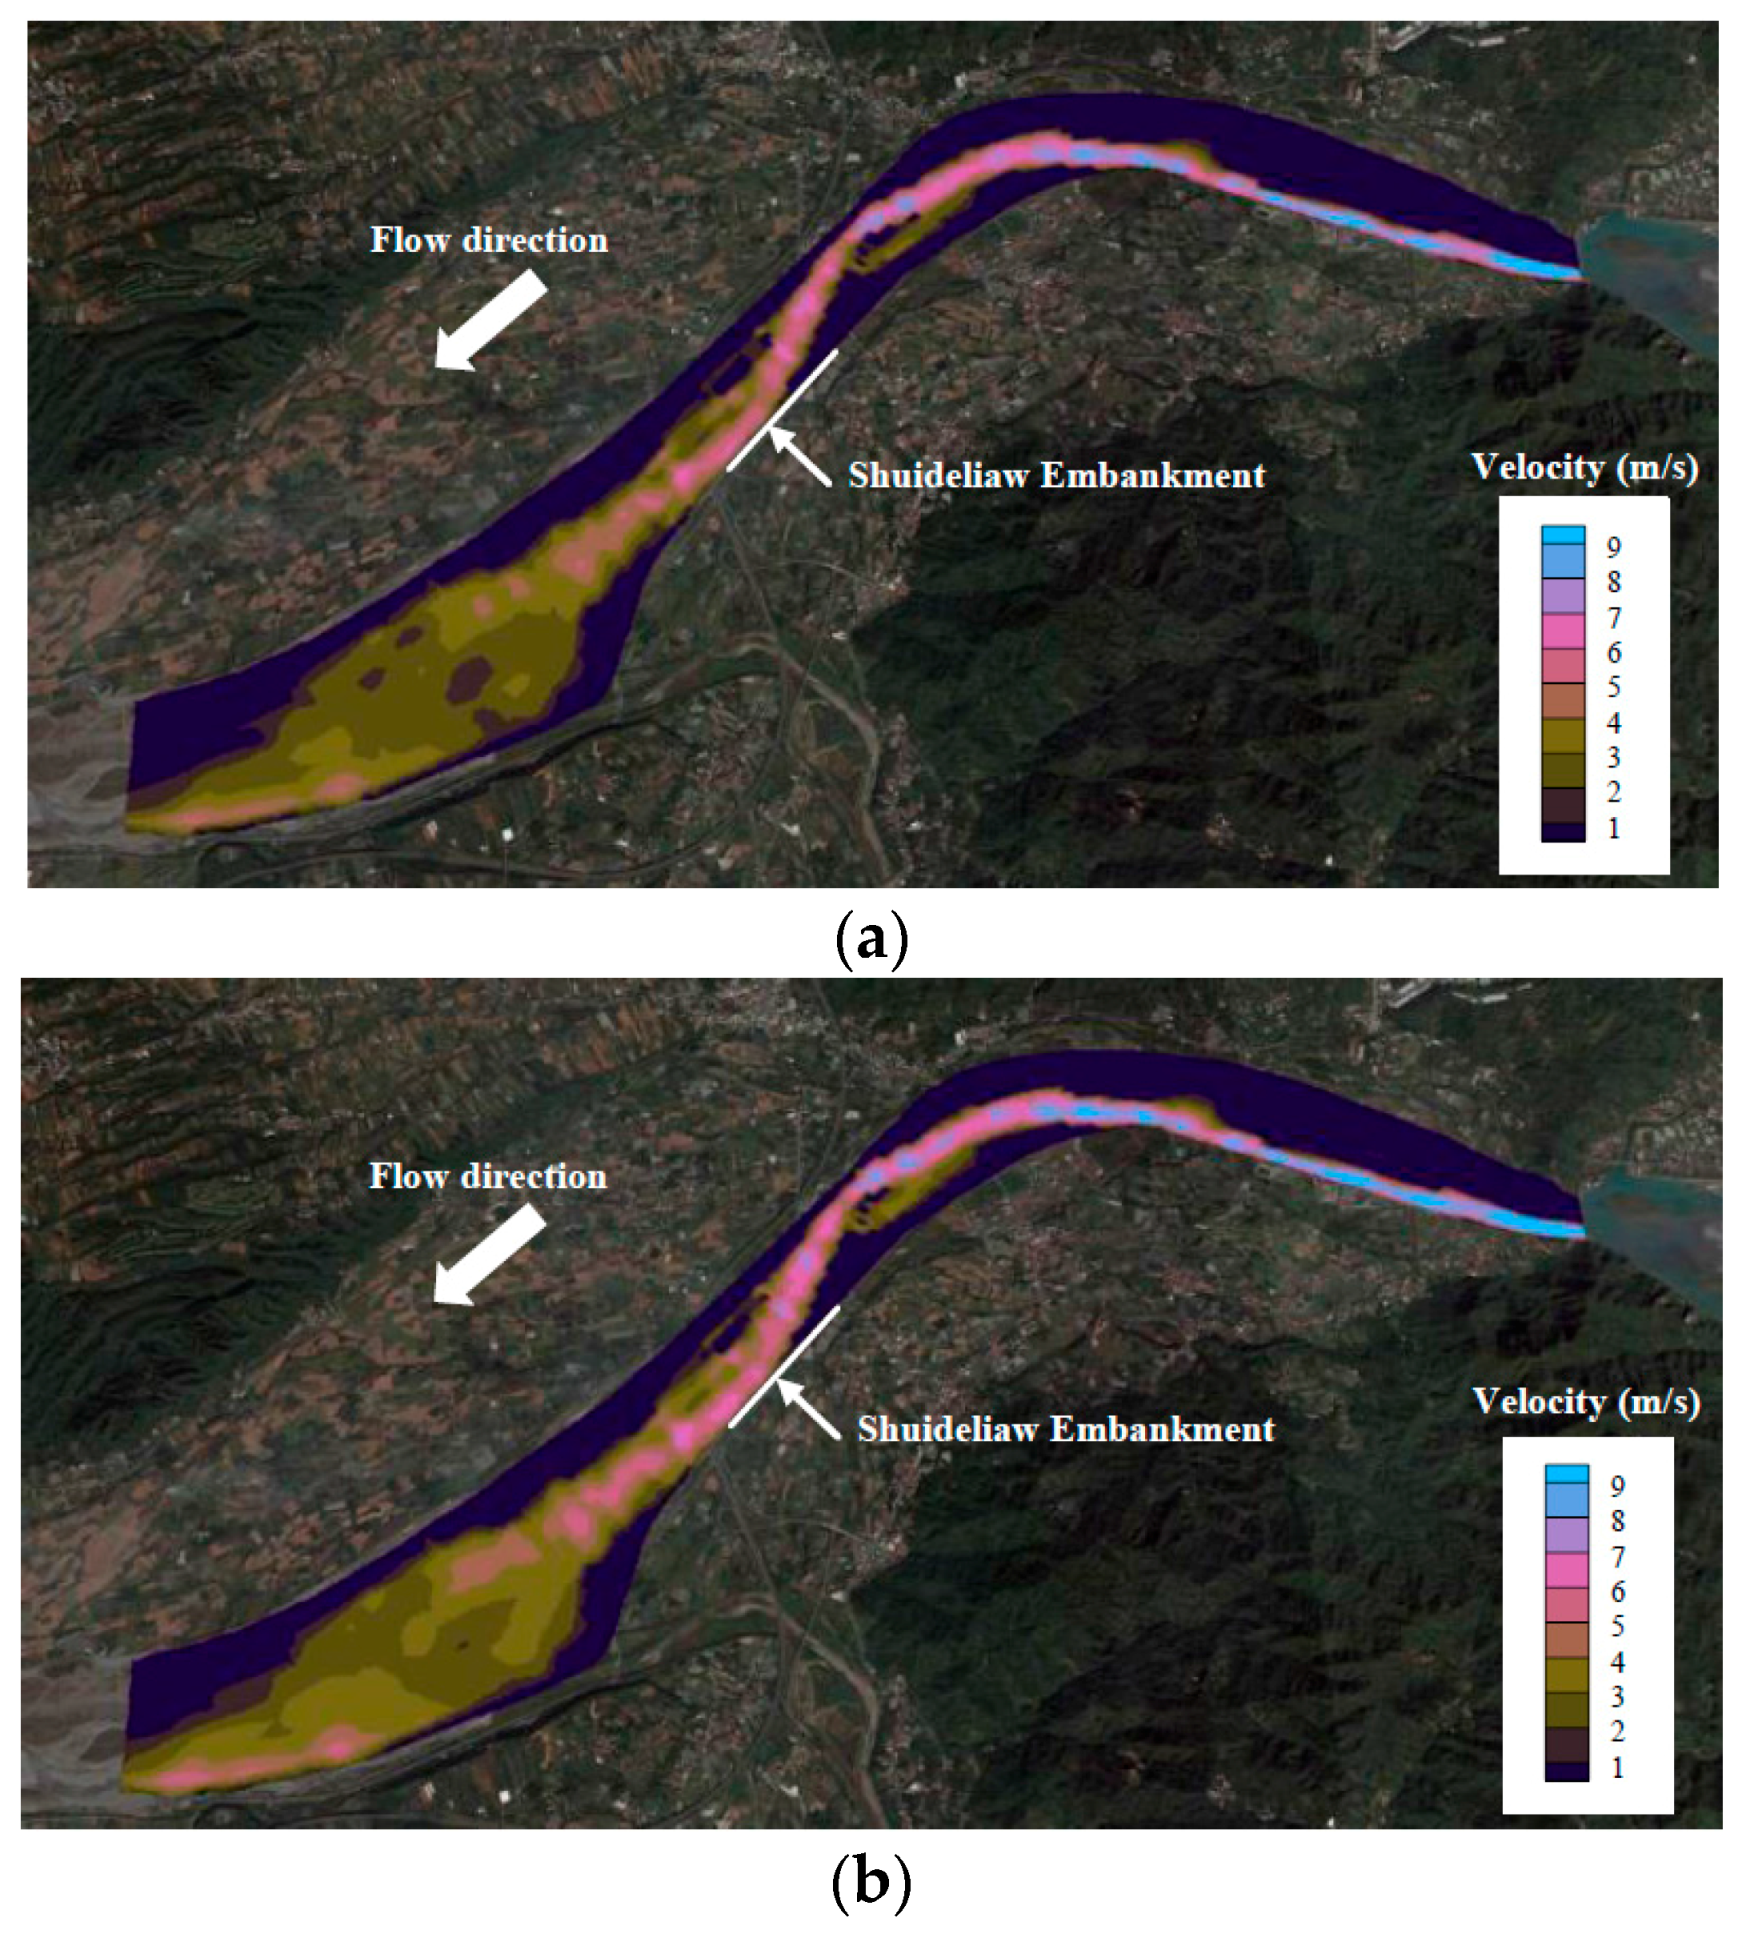
4. Flow Field and Embankment Toe Scour Simulations

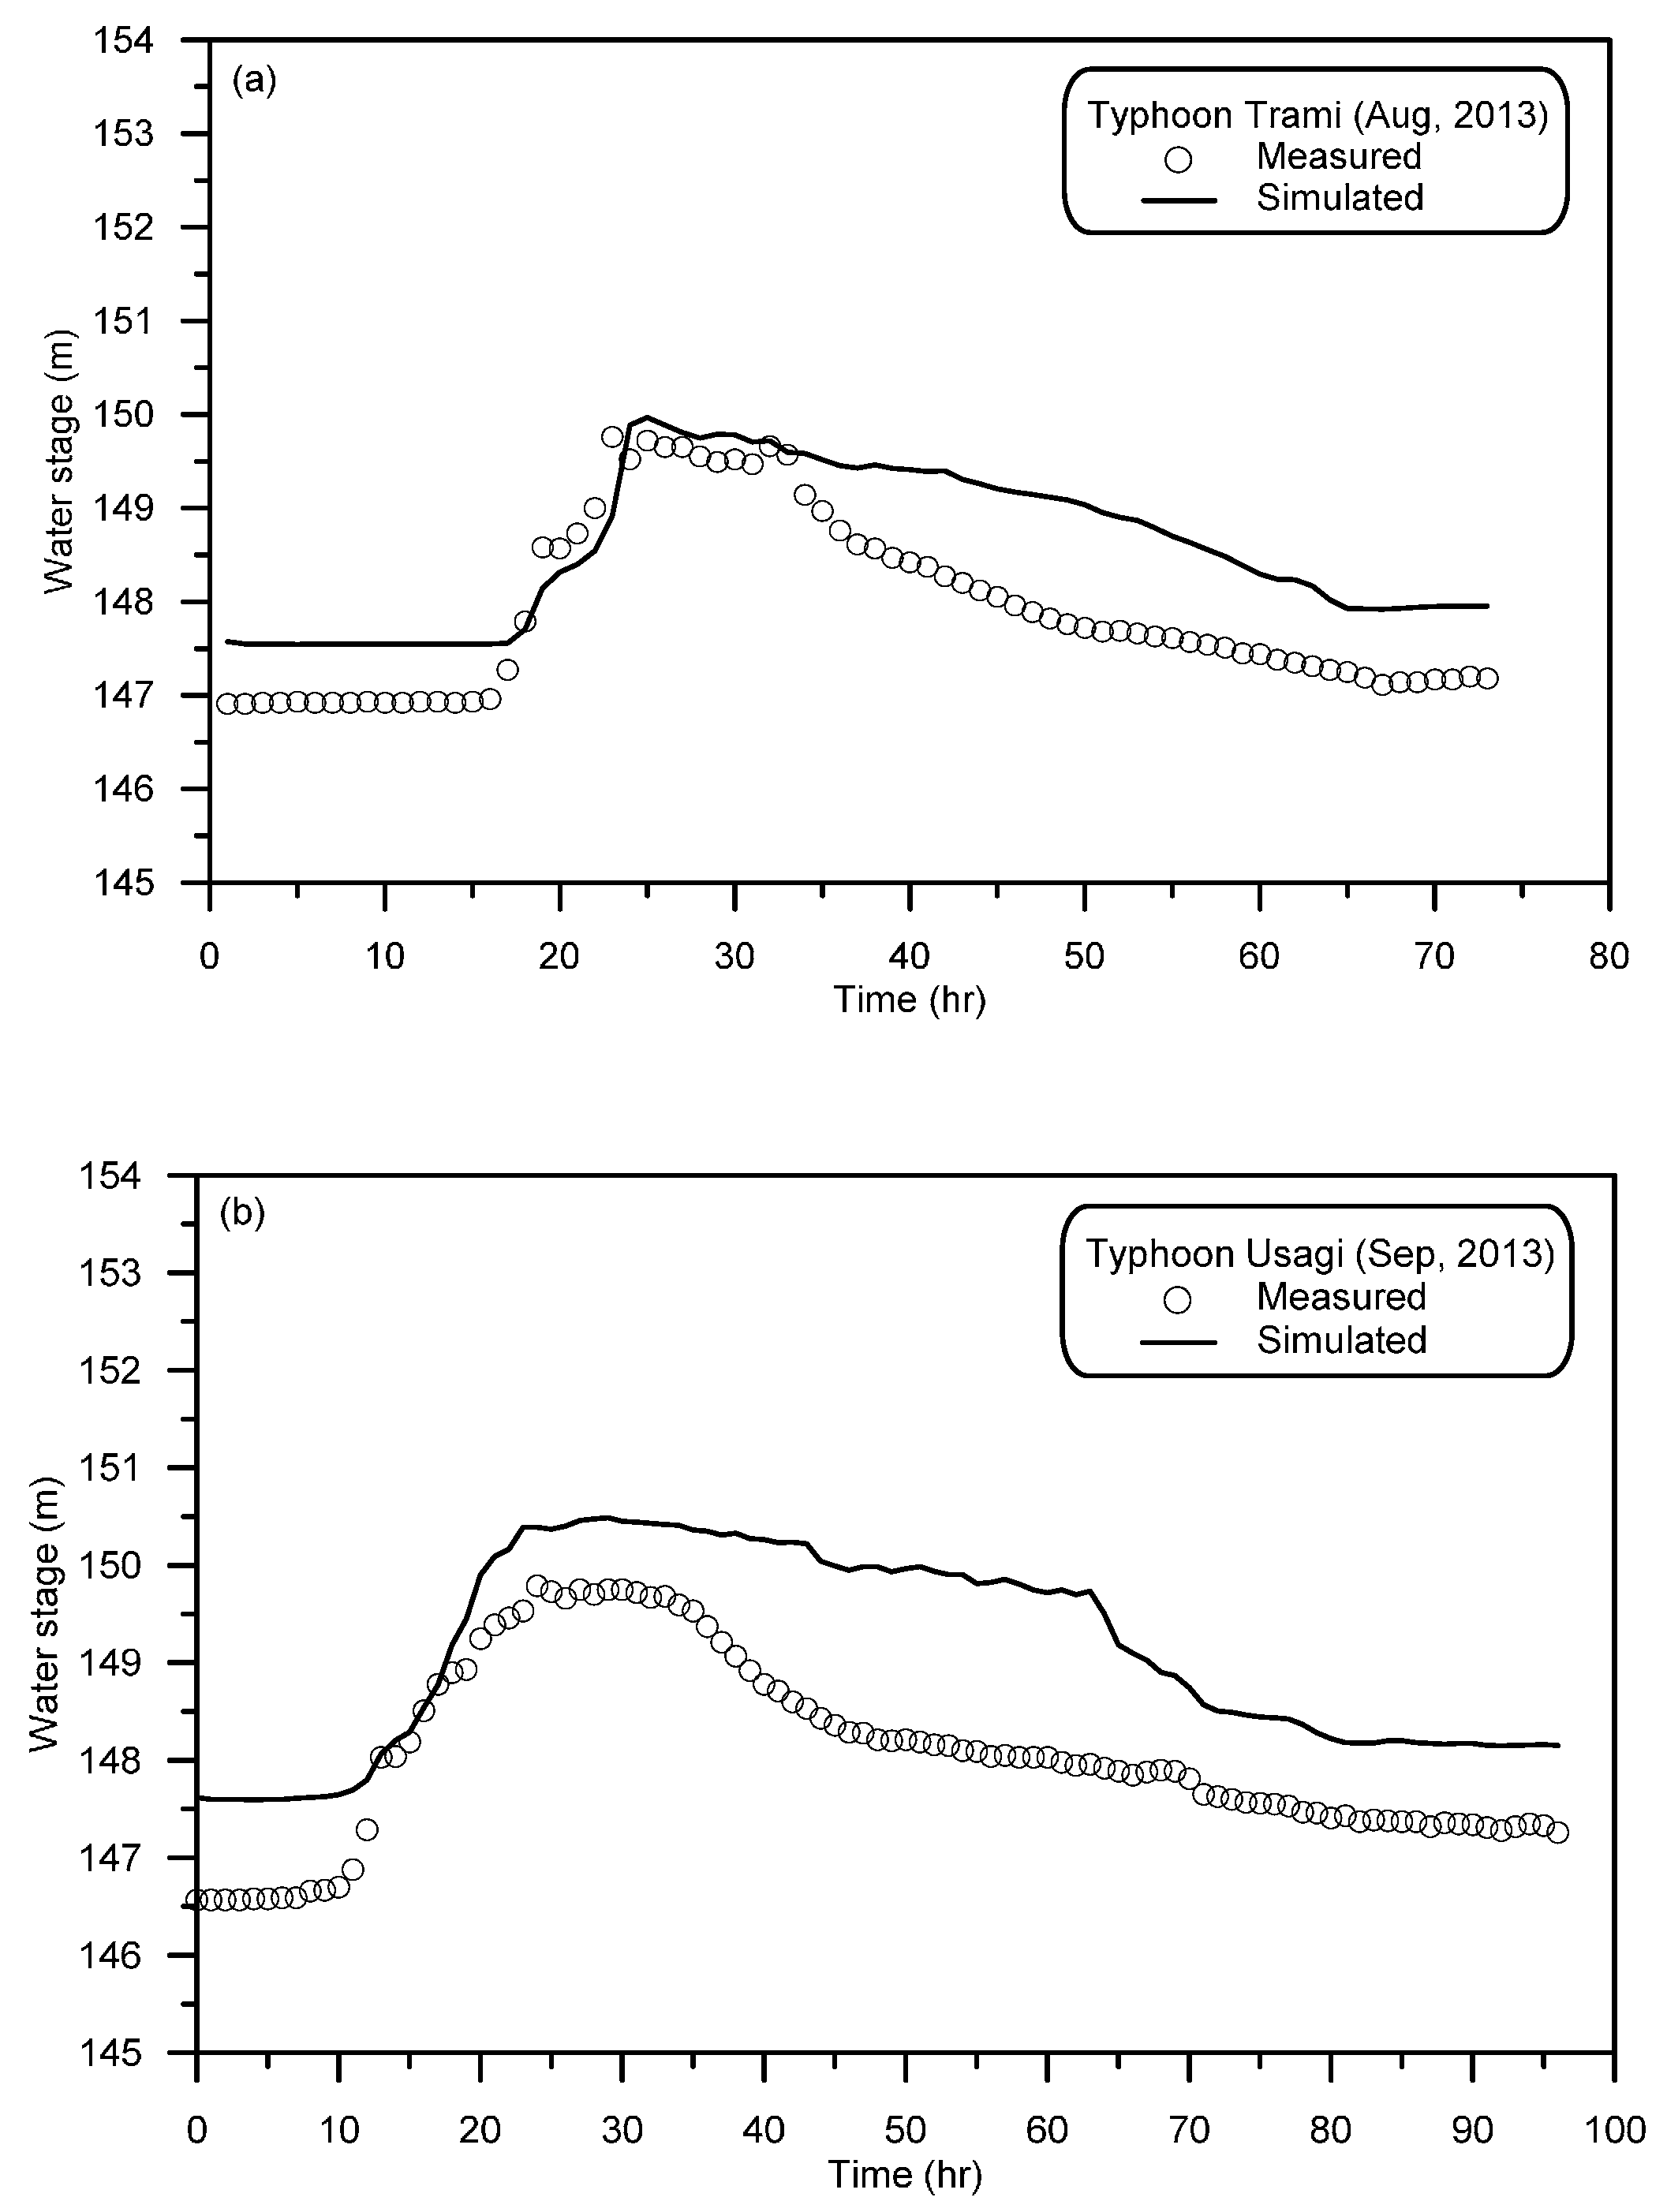
4.1. Verifications of 2D Finite-Volume Model

This section verifies the accuracy of the finite-volume model for 2D flow field simulations. Figure 8 shows the simulation domain of the study channel bend, namely a cross-section and LiDAR (0.5 m × 0.5 m) bed elevation data. The study reach was approximately 12 km long between cross section 117 (the upstream inflow boundary) and cross section 90 (the downstream outflow boundary). The field-measured water level data at the Mingchu gauging station was used for Manning roughness coefficient calibration and model verification. Toe scouring at the Shuideliaw Embankment usually results from heavy rainfall during typhoon events, and two such flood events are analyzed herein: Typhoon Trami (August 2013) and Typhoon Usagi (September 2013).
The Manning roughness coefficient has a significant effect on flow and scour modeling. For the commonly used approach, the Manning roughness coefficient was initially given in the entire simulation domain and should be calibrated based on a reasonable range. According to Chow [34], the range of Manning roughness coefficient in a natural river is from 0.025 to 0.055. Then, a reasonable value must be initially given. In this paper, the Manning roughness coefficient was initially estimated following the method in [35]. As described in [35], an averaged value of the Manning roughness coefficients estimated from three formulas (Lane formula by n = 0.015 d 75 1 / 6 , Einstein formula by n = 0.0132 d 65 1 / 6 , Strickler formula by n = 0.015 d m 1 / 6 ) is suggested for use in a gravel-bed river. The unit of sediment particle size in these three formulas is millimeters. Accordingly, using these three formulas one obtains 0.038, 0.032, and 0.034, respectively. Then, an average value of 0.035 was achieved and was initially given in the entire simulation domain. For Typhoon Trami, the overestimated error of water-level hydrograph was obtained using the value of 0.035. Thus, a further adjustment of value of Manning roughness coefficient is needed. The purpose of the adjustment is to make a reasonable match between the simulated and measured water-level hydrographs. After several adjustments, the best choice for calibration of Manning roughness coefficient was finally determined at a value of 0.025 and this value is used to simulate 2D flow field for Typhoon Usagi.
The flow discharge hydrographs released from Chi-Chi Weir, as shown in Figure 4, were used for the subcritical inflow boundary conditions. The left and right sides along the simulation domain were considered the land boundaries and the time step was 0.5 s. The numerical accuracy of the 2D model was evaluated by comparing the simulated results with the measured water levels using the following three criteria:
E η p ( % ) = | η p s i m η p m e a | η p m e a × 100 , E T p = T p s i m T p m e a T p m e a × 100 , R 2 = [ i = 1 N ( η i s i m η ¯ s i m ) ( η i m e a η ¯ m e a ) i = 1 N ( η i s i m η ¯ s i m ) 2 i = 1 N ( η i m e a η ¯ m e a ) 2 ] ,
in which p is the peak water level error; ETp represents the error of time to peak water level; R2 denotes the coefficient of determination; η p s i m and η p m e a denote the simulated and measured peak water levels, respectively; T p s i m and T p m e a are the simulated and measured time to peak water level, respectively; η i s i m and η i m e a are the simulated and measured water levels at each time; and η ¯ s i m and η ¯ m e a denote the average simulated and measured water levels. The results for the two examined flood events, for which the p results were 0.13% and 0.46%, respectively, are provided in Table 2. Because the overall performance of p is less than 0.5%, the results demonstrate that the model can provide high numerical accuracy for the peak water level in modeling 2D flow with variable bed topography. In addition, the average value of R2 coefficient for two flood events is 0.88, close to the best value of 1.0, indicating that the proposed 2D model can achieve reasonable performance for water-level hydrograph.
Figure 9 depicts the simulated and the measured water levels at Mingchu gauging station, which are compared by calibrating the Manning roughness coefficients (0.025). The simulated results reveal close agreement with the measured data at the peak flow. For the periods before and after the peak flow, the model overestimates the water level. The error between the simulated and measured data may be due to the adopted assumptions of a “fixed” bed and the constant given value of Manning roughness coefficient. Careful attention should be paid to the resolution of the entire bend scour depth evolution, and the relevant uncertainty of Manning roughness coefficient should be considered in future studies. In the present study, these assumptions do not affect the maximum bend scour depths based on the acceptable results listed in Table 3. In addition, Figure 10 displays the simulated results for velocity contours under peak flood conditions. Reasonable results are obtained using the 2D model, indicating that the velocities adjacent to the outer Shuideliaw Embankment increase significantly with peak discharge. Due to the river bend effects, high-velocity floods can attack and erode the riverbank, meaning that the outer embankment is the most vulnerable area. The results also show that the proposed 2D model is accurate for modeling flood flow with the irregular bed topography and complex geometry in a channel bend.

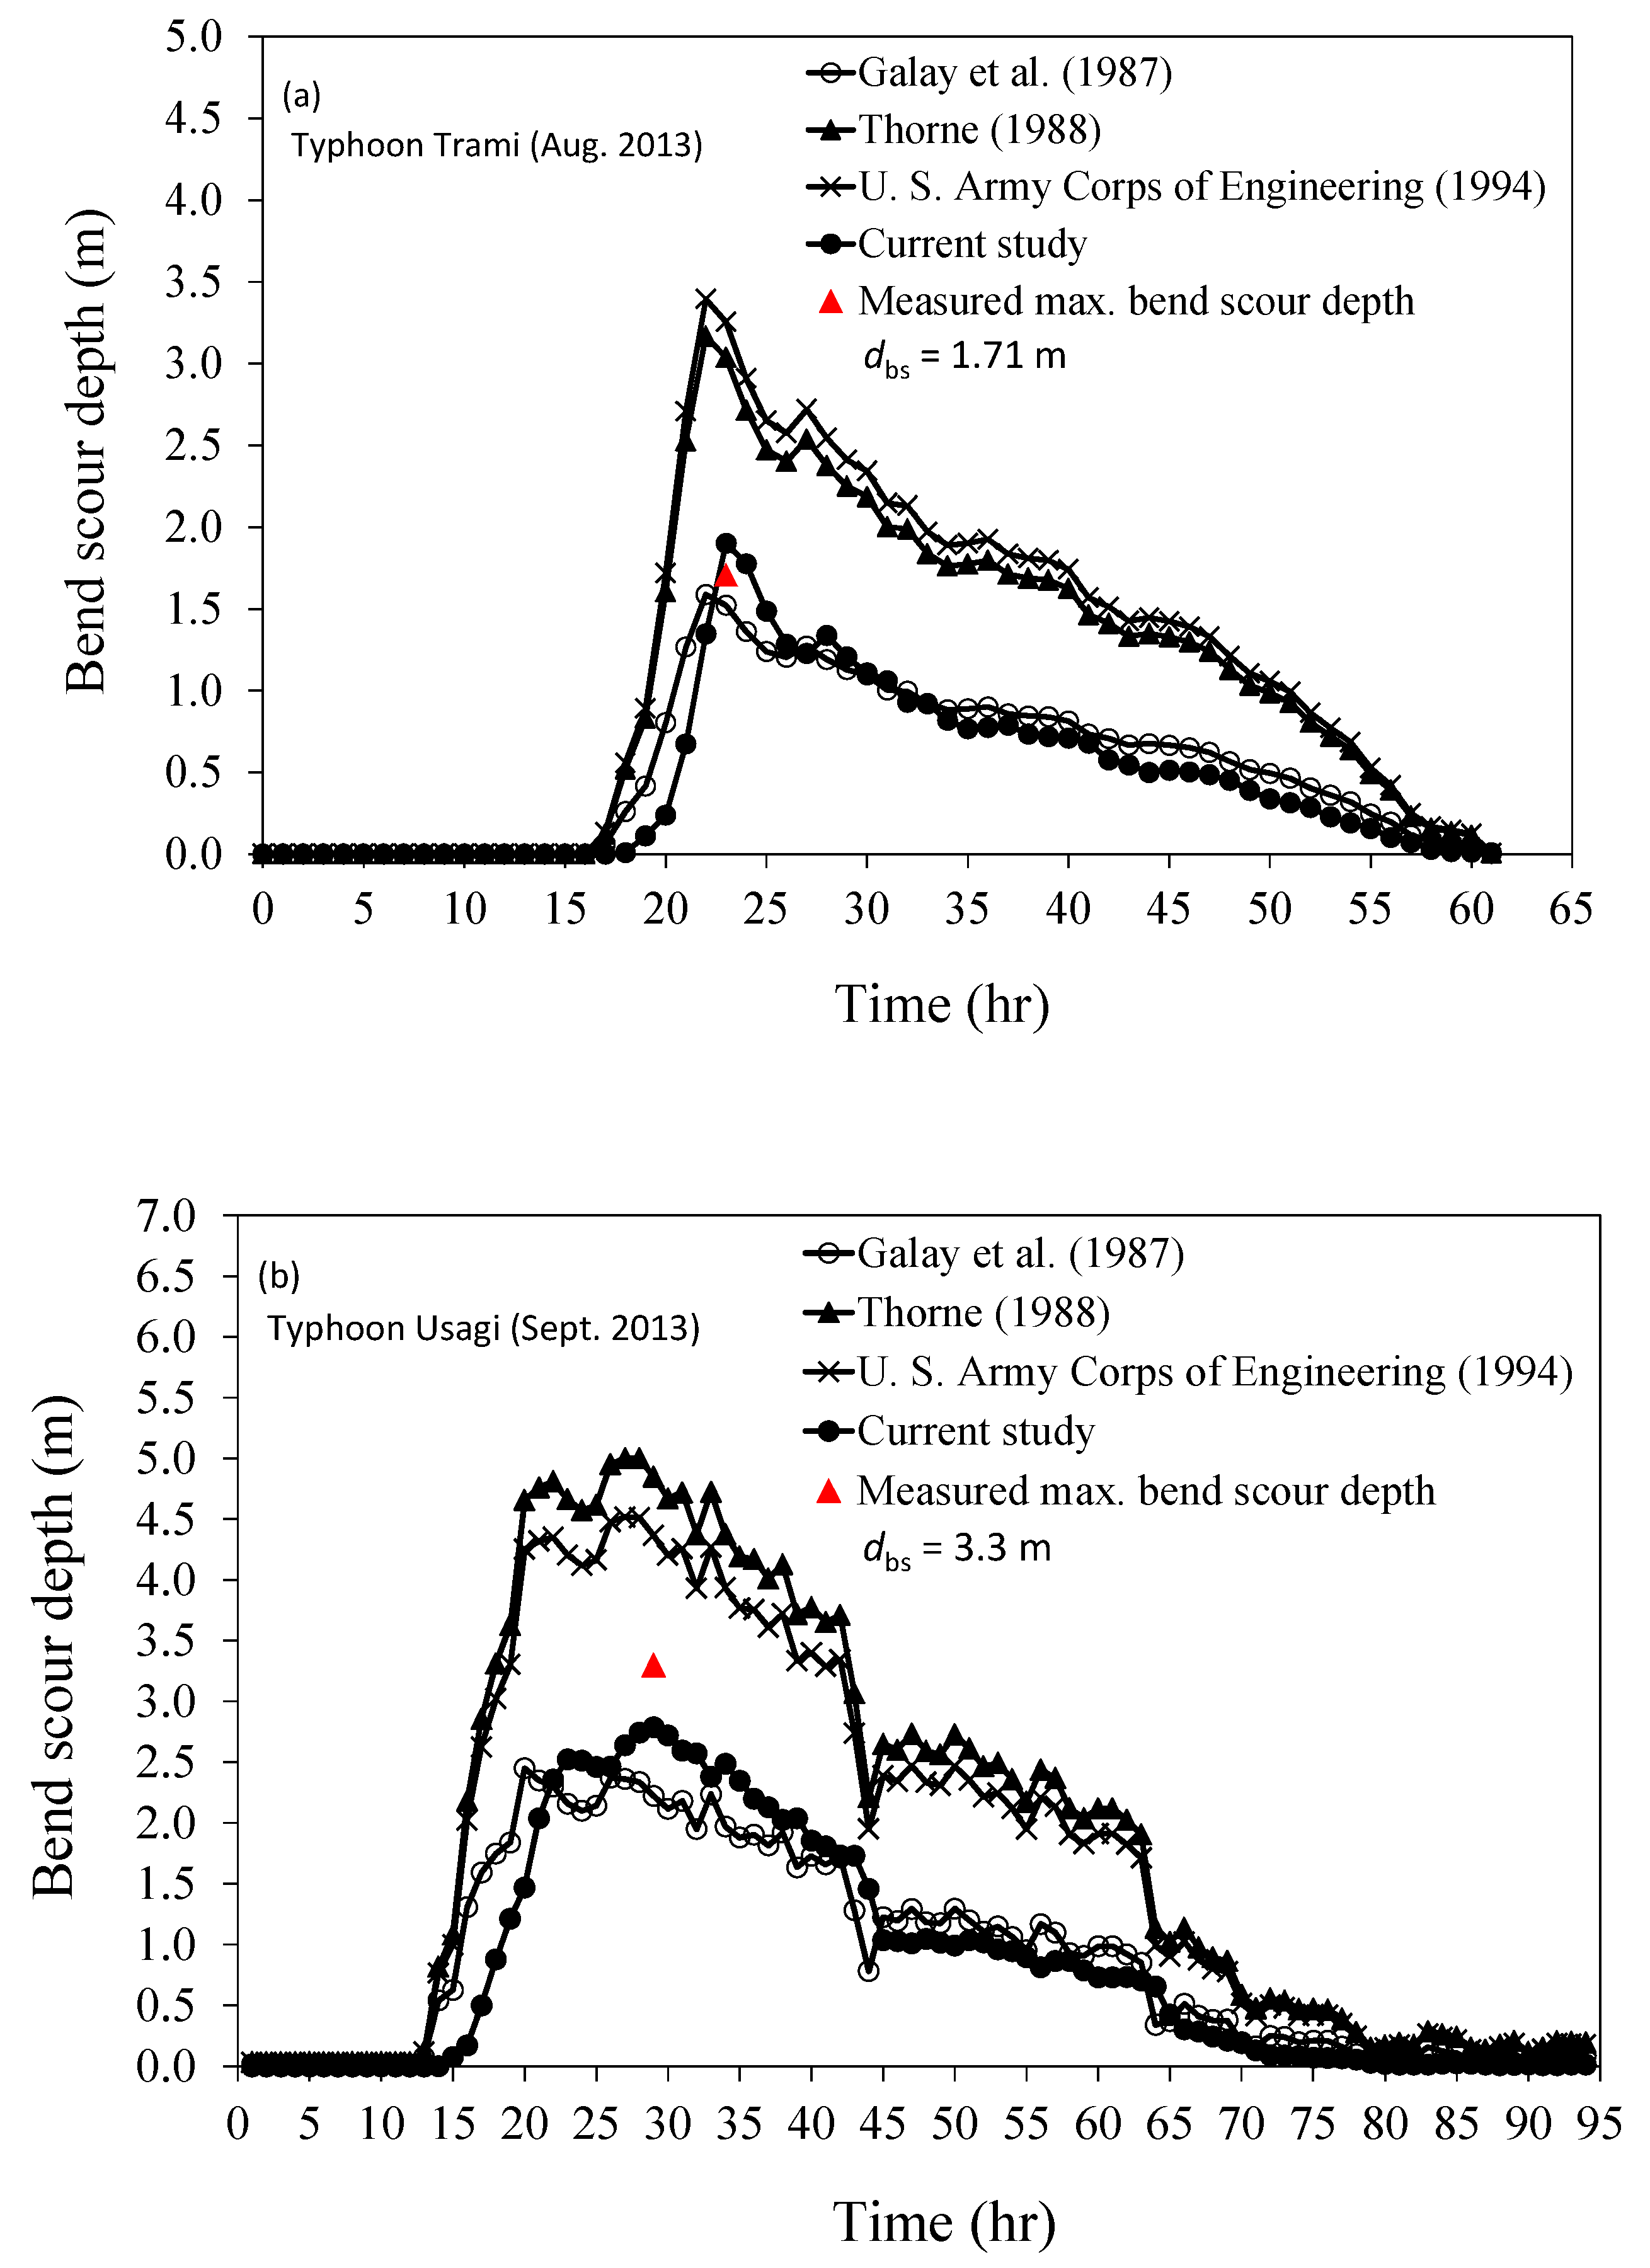
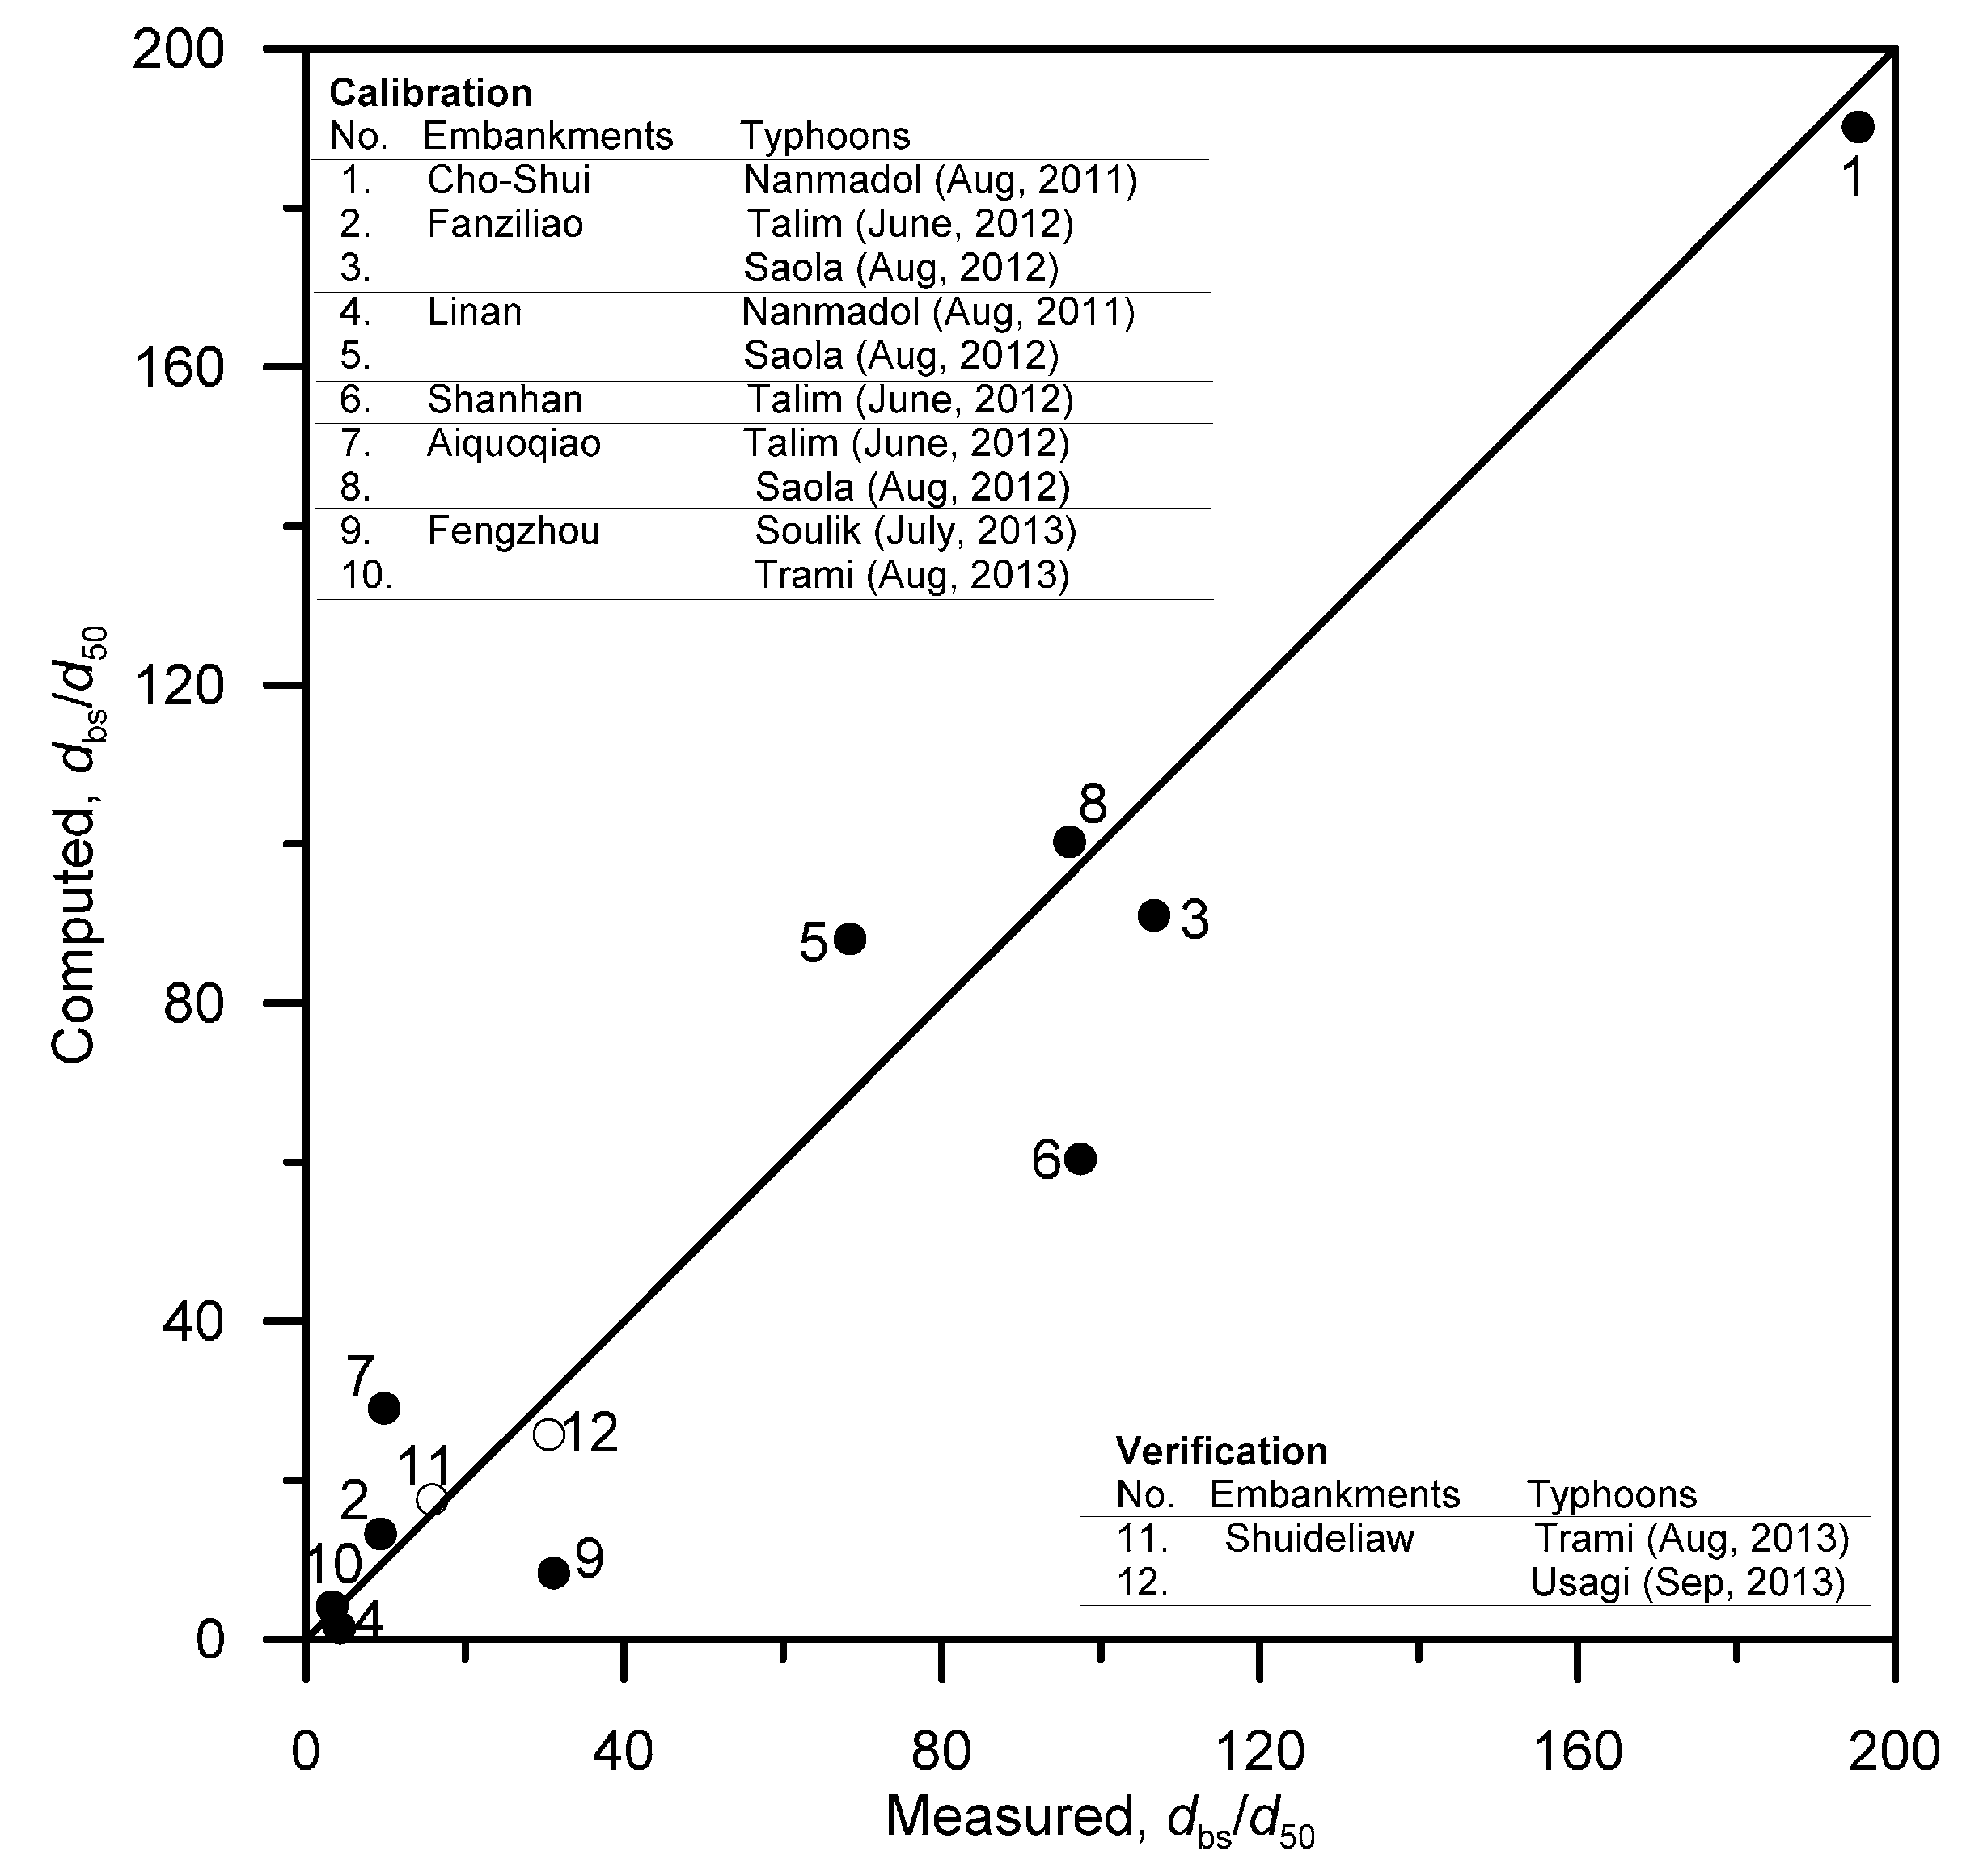
4.2. Verifications of Proposed Method for Bend Scour Depth

The results presented in Section 4.1 demonstrate that the proposed finite-volume hydraulic model determines accurate approach flow conditions. In this section, the evolution simulations of the bend scour depth obtained through the proposed approach are presented.
The approach flow conditions for the estimation of bend scour depth include the water depth, velocity, water surface width, and centerline radius of the bend. The proposed finite-volume hydraulic model was adopted to compute the required approach flow conditions for two typhoon events. The evolution of bend scour depth was then computed using the proposed method as well as the three existing equations (Galay et al. [27], Thorne [28], and U.S. Army Corps of Engineering [29]) identified earlier. Comparisons between the measured data and the computed results are displayed in Figure 11. Globally, all simulated scour depth variations yield the proper rising and falling limbs of the hydrograph, which are similar to those displaying in flow hydrographs, as shown in Figure 4. To further discuss the differences among the four methods, the relative error is used and defined as:
E d b s ( % ) = d b s s i m d b s m e a d b s m e a × 100 ,
where d b s s i m and d b s m e a represent the simulated and measured maximum bend scour depth, respectively. Table 3 compares the simulated results with the measured data, including the maximum bend scour depth and the relative error. The results indicate that the existing empirical equations by Thorne and the U.S. Army Corps of Engineering tend to overestimate scour depth. However, the proposed method herein provides a good fit compared with the measured maximum bend scour depth, and is thus the most accurate of all the tested methods.

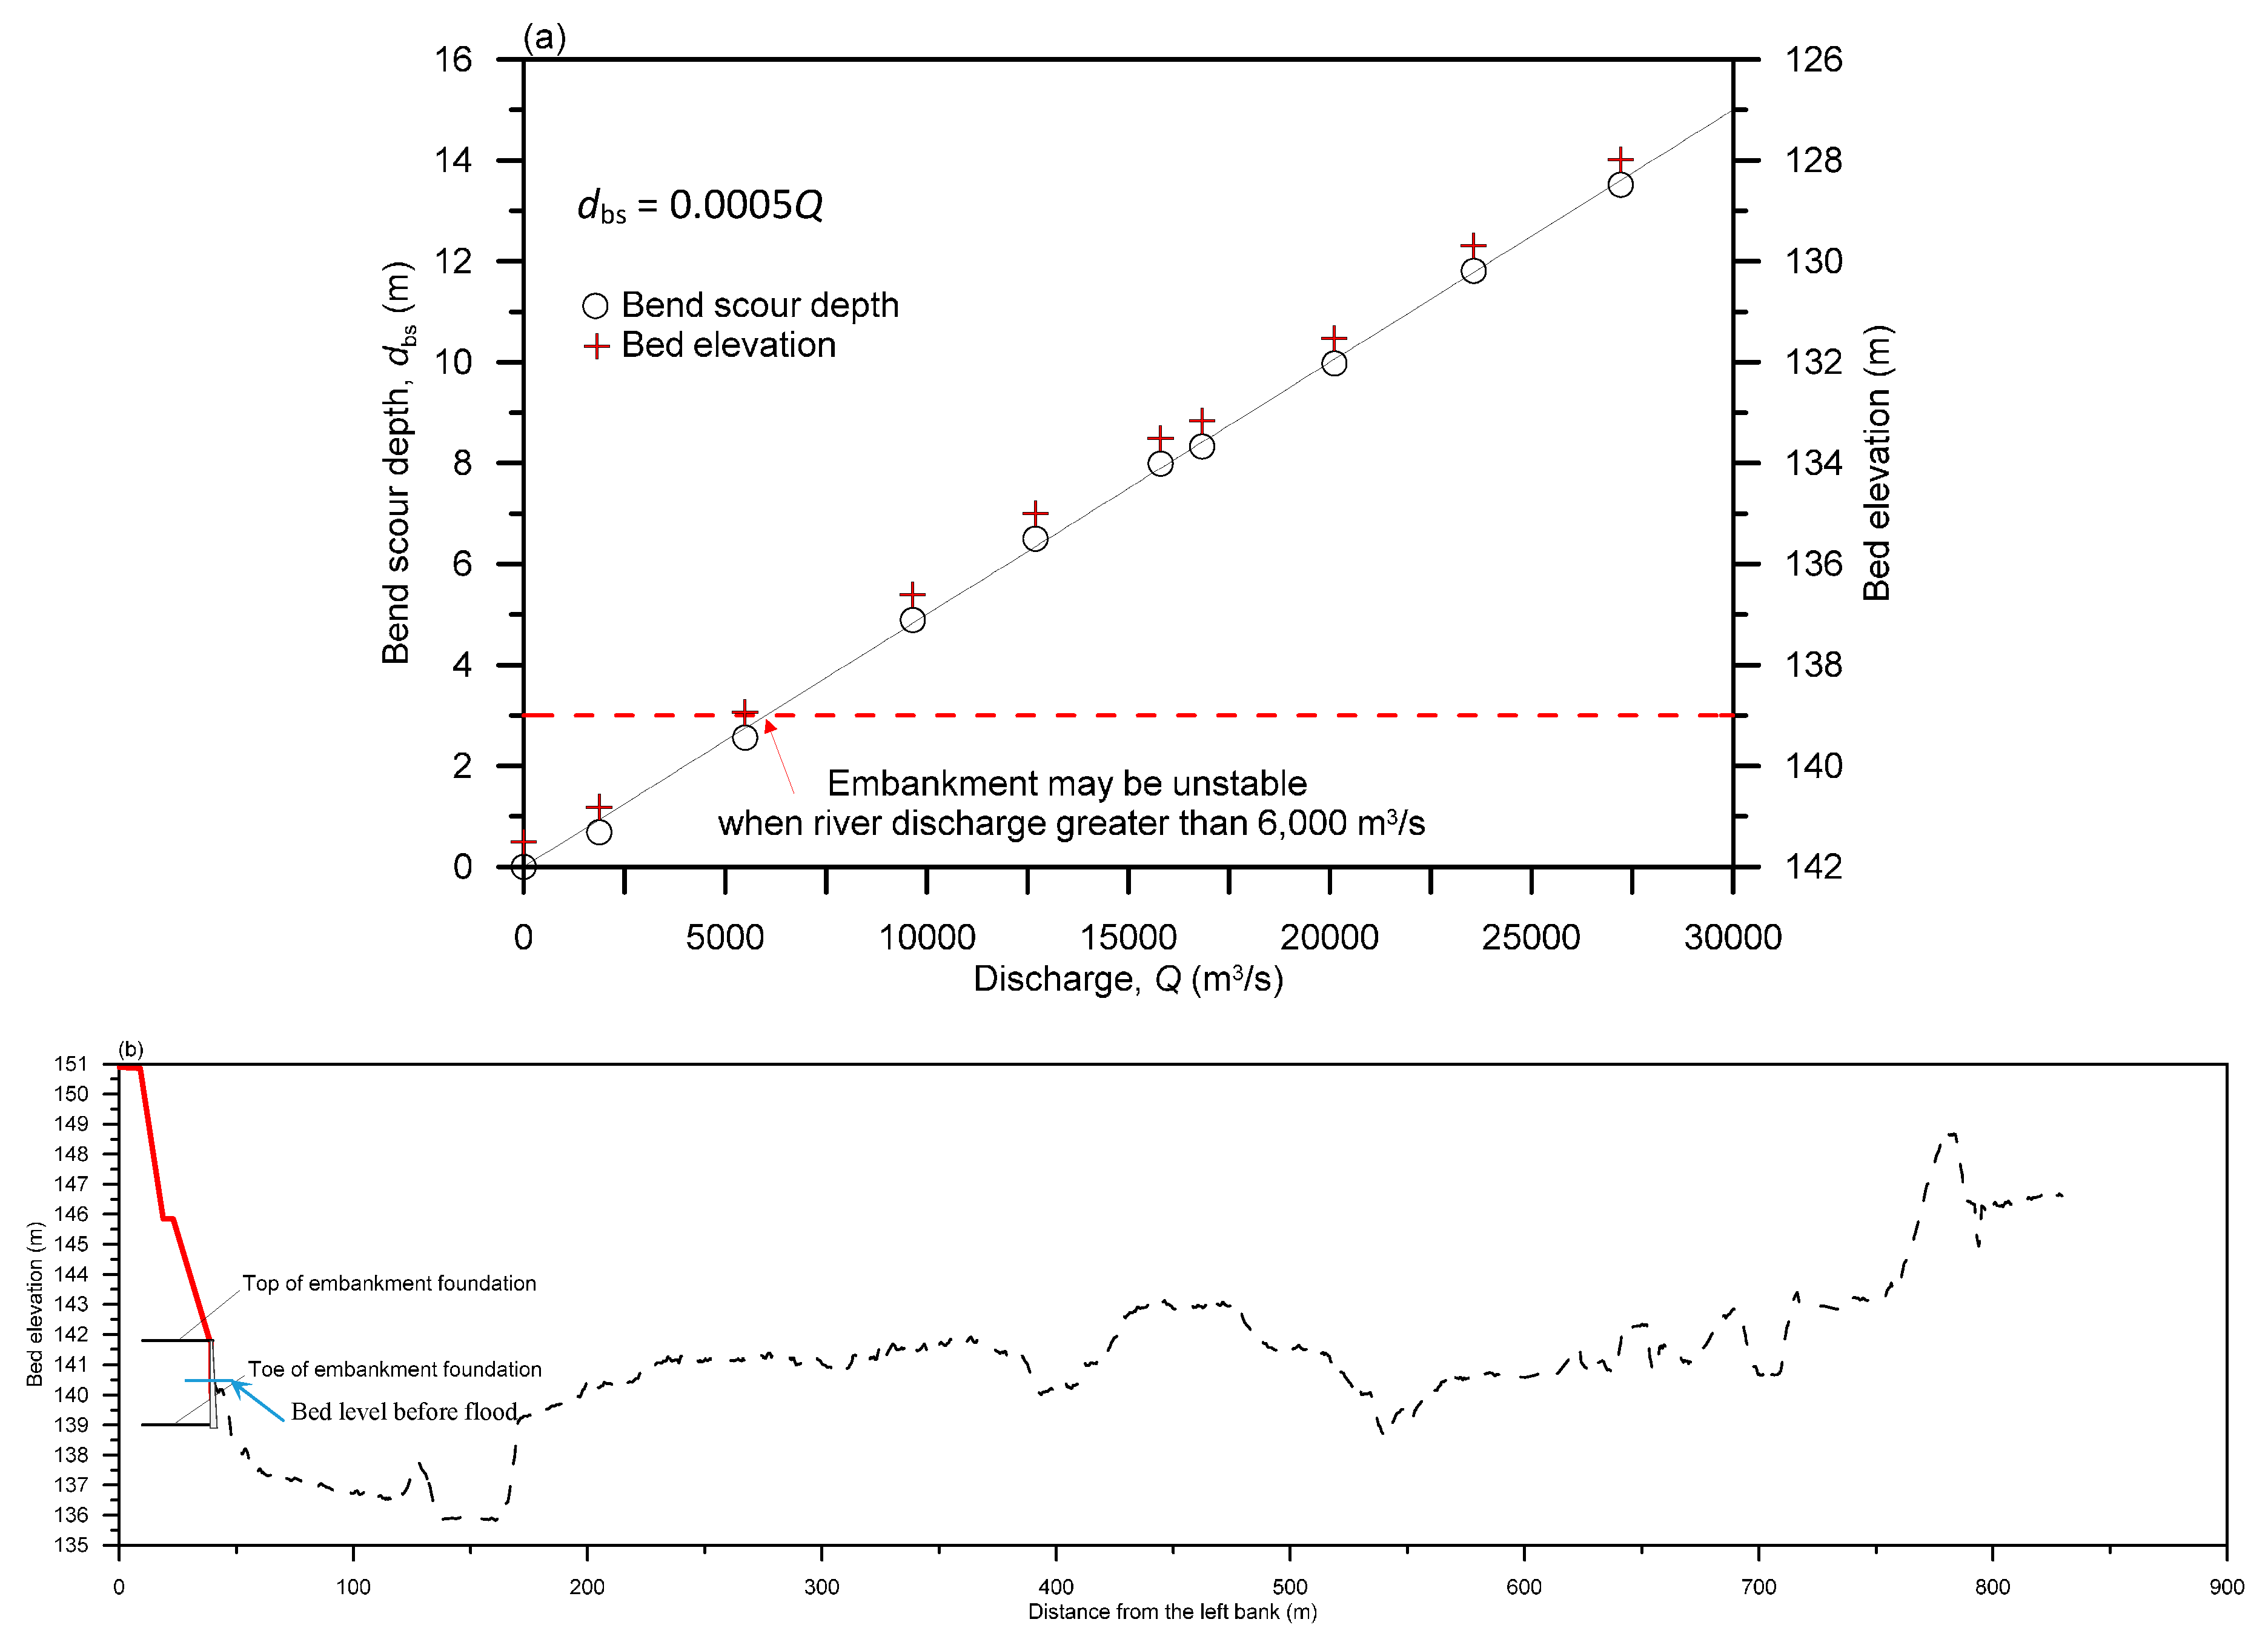
4.3. Practical Embankment Safety Curve

A rational and practical tool to determine embankment safety in real time is of great importance for decisions made during typhoon periods. Based on the proposed method, this study attempts to provide a quantitative curve to evaluate the influence of discharge on bend scour depth at the embankment toe. The numerical simulations are performed with nine different discharges of 1.11-, 2-, 5-, 10-, 20-, 25-, 50-, 100-, and 200-year return period floods. According to the results described in the previous section, the proposed bend scour computation equation was verified to be suitable for simulating embankment toe scour in this case study. Thus, the bend scour depth at the peak flow condition obtained from the proposed equation is utilized to develop the embankment safety curve. Figure 12a shows the results of numerical experiments, indicating that the bend scour depth increases significantly with an increase in the discharge. Using statistical regression analysis results in the following regression equation: d b s = 0.0005 Q . On the basis of this equation, the bend scour depth at the embankment toe downstream of the Chi-Chi Weir in Cho-Shui River can be easily estimated in real time for a given flow discharge. In addition, the relationship between the scoured bed level and the corresponding flow discharge is added to Figure 12a. Moreover, the location of Shuideliaw Embankment and adjacent bed change at cross section 105 are presented in Figure 12b. Figure 12b indicates that the toe of embankment foundation is 139.0 m and the bed level before the flood at Shuideliaw Embankment is 140.5 m. During typhoon periods, the bed level is eroded due to bend scour. Based on the proposed embankment safety curve, river managers can easily know whether the scoured bed level is smaller than the toe of the embankment foundation or not.
After the embankment safety curve is established, its accuracy must be verified. From a process standpoint, the safety of an embankment is controlled by the relationship between the resisting and driving forces of the embankment. For reinforced concrete embankments, the driving forces can represent the hydraulic scouring around the embankment toe, and the resisting force can stand for the depth of the embankment foundation. During the flood induced by a monsoon in June 2012, the bend scour depth near Shuideliaw Embankment was larger than the depth of the embankment foundation. Hence, the embankment failed due to the embankment toe erosion caused by flooding with a peak discharge of 6122 m3/s. By using the proposed equation d b s = 0.0005 Q , when discharge is equal to 6122 m3/s, the total bend scour depth is estimated at 3.06 m, which is larger than the depth of the embankment foundation (3.0 m). Therefore, the results demonstrate that the proposed simplified equation could be used to correctly assess embankment toe safety. To further provide advantageous assessment information, the discharge warning value can be achieved from this equation fairly simply. Moreover, the depth of the embankment foundation can be substituted into this equation, resulting in 6000 m3/s waring discharge. The results herein suggest that the study embankment will be unstable and may further fail if discharge from the Chi-Chi Weir is greater than 6000 m3/s. By contrast, the numerical experiments demonstrated that the maximum bend scour depth near the Shuideliaw Embankment is greater than the designed foundation depth, because the flow discharge is greater than 6000 m3/s (which is between the flood discharges for the two- and five-year return periods, similar to the bankfull discharge). This similarity between the flow and bankfull discharge denotes a significant change in the river bed, and indicates why embankment failure usually occurs during bankfull discharge.
In summary, the proposed embankment safety curve provides a quick and advantageous assessment for river managers to use when making management decisions associated with embankment stability or safety warning.

5. Conclusions

Scour at the embankment toe is a complex fluvial process, especially in bend reaches. A new composite method for simulating general and bend scour depths was therefore proposed in this paper. This composite method consists of three components: a 2D finite-volume model, a general scour computation equation, and a new bend scour computation equation. An assumption linking the flow and bend scour evolutions has been presented, and it allows the proposed method to simulate both general and bend scour evolutions in a river bend with complex bed topography under typhoon-induced flood conditions. The 2D flow fields and the temporal evolutions of bend scour depths in a bend reach of the Cho-Shui River were simulated in detail for two typhoon flood events, and the simulated results were compared to field data measured using the numbered-brick method.
The primary conclusions of this study are as follows: (1) the new practical method is capable of simulating the temporal evolution process caused by the development of bend scour at embankment toes; (2) the simulated results are generally in agreement with the field-measured data, including water level data at the Mingchu gauging station and maximum bend scour depths at Shuideliaw Embankment; (3) the proposed embankment safety curve enables river managers to make rational decisions when responding to embankment emergencies during the typhoon season.
The new method has been demonstrated to accurately simulate bend scour evolution based on the separating assumption of scour components. However, further testing must be conducted in comparison with more field-measured evolution of embankment toes, specifically considering the uncertainty of the sediment deposition process and the Manning roughness coefficient. In addition, our method can be integrated into a flood warning system that can be used for automated real-time forecasts of water levels and embankment toe scouring. The system provides information for effective and timely decision-making on hazard mitigation action prior to expected critical situations.

Acknowledgments

The authors would like to thank the Fourth River Management Office, Water Resources Agency, and Ministry of Economic Affairs for providing flow discharge hydrographs at Chi-Chi Weir on the Cho-Shui River.

Author Contributions

Wen-Dar Guo and Jian-Hao Hong performed the scour modeling and wrote the paper. Cheng-Hsin Chen and Chih-Chiang Su collected the relevant data and reviewed the manuscript critically. Jihn-Sung Lai provided suggestions for improvements to the manuscript.

Conflicts of Interest

The authors declare no conflict of interest.

References

  1. Ojha, C.; Singh, V.; Adrian, D. Influence of porosity on piping models of levee failure. J. Geotech. Geoenviron. Eng. 2001, 127, 1071–1074. [Google Scholar] [CrossRef]
  2. Vrijling, J.K.; Schweckendiek, T.; Kanning, W. Safety standards of flood defenses. In Proceedings of the 3rd International Symposium on Geotechnical Safety and Risk, Munich, Germany, 2–3 June 2011. [Google Scholar]
  3. Dos Santos, R.N.C.; Caldeira, L.M.M.S.; Serra, J.P.B. FMEA of a tailings dam. Georisk 2012, 6, 89–104. [Google Scholar] [CrossRef]
  4. Zhang, L.M.; Xu, Y.; Liu, Y.; Peng, M. Assessment of flood risks in Pearl River Delta due to levee breaching. Georisk 2013, 7, 122–133. [Google Scholar] [CrossRef]
  5. Lin, C. Study on Related Countermeasures of Scour Vulnerable Levees along Cho-Shui River; Fourth River Management Office, Water Resources Agency, Ministry of Economic Affairs: Changhua County, Taiwan, 2007.
  6. Wahl, T.L. Prediction of Embankment Dam Breach Parameters: A Literature Review and Needs Assessment; Dam Safety Research Report DSO-98-004; US Department of the Interior, Bureau of Reclamation: Denver, CO, USA, 1998.
  7. Morris, M.; Kortenhaus, A.; Visser, P.J.; Hassan, M. Breaching Processes: A State of the Art Review; FLOODsite Report T06-06-03; FLOODsite Consortium: Wallingford, UK, 2009. [Google Scholar]
  8. Morris, M.W.; Kortenhaus, A.; Visser, P.J. Modeling Breach Initiation and Growth; FLOODsite Report T06-08-02; FLOODsite Consortium: Wallingford, UK, 2009. [Google Scholar]
  9. Jia, D.D.; Shao, X.; Wang, H.; Zhou, G. Three-dimensional modeling of bank erosion and morphological changes in the Shishou bend of the middle Yangtze River. Adv. Water Resour. 2010, 33, 348–360. [Google Scholar] [CrossRef]
  10. ASCE/EWRI Task Committee on Dam/Levee Breaching. Earthen embankment breaching. J. Hydraul. Eng. 2011, 137, 1549–1564. [Google Scholar]
  11. Motta, D.; Abad, J.D.; Langendoen, E.J.; Garcia, M.H. A simplified 2D model for meander migration with physically-based bank evolution. Geomorphology 2012, 163–164, 10–25. [Google Scholar] [CrossRef]
  12. Viero, D.P.; D’Alpaos, A.; Carniello, L.; Defina, A. Mathematical modeling of flooding due to river bank failure. Adv. Water Resour. 2013, 59, 82–94. [Google Scholar] [CrossRef]
  13. Langendoen, E.J.; Mendoza, A.; Abad, J.D.; Tassi, P.; Wang, D.C.; Ata, R.; Abderrezzak, K.E.K.; Hervouet, J.M. Improved numerical modeling of morphodynamics of rivers with steep banks. Adv. Water Resour. 2016, 93, 4–14. [Google Scholar] [CrossRef]
  14. Dodaro, G.; Tafarojnoruz, A.; Stefanucci, F.; Adduce, C.; Calomino, F.; Gaudio, R.; Sciortino, G. An experimental and numerical study on the spatial and temporal evolution of a scour hole downstream of a rigid bed. In Proceedings of the International Conference on Fluvial Hydraulics, River Flow, Lausanne, Switzerland, 3–5 September 2014; pp. 1415–1422. [Google Scholar]
  15. Yen, C.L.; Lai, J.S.; Chang, W.Y. Modeling of 3D flow and scouring around circular piers. Proc. Natl. Sci. Counc. A Phys. Sci. Eng. 2001, 25, 17–26. [Google Scholar]
  16. Nagata, N.; Hosoda, T.; Nakato, T.; Muramoto, Y. Three-dimensional numerical model for flow and bed deformation around river hydraulic structures. J. Hydraul. Eng. 2005, 131, 1074–1087. [Google Scholar] [CrossRef]
  17. Roulund, A.; Sumer, B.M.; Fredsoe, J.; Michelsen, J. Numerical and experimental investigation of flow and scour around a circular pile. J. Fluid Mech. 2005, 534, 351–401. [Google Scholar] [CrossRef]
  18. Guo, W.D.; Hong, J.H.; Lee, F.Z.; Lai, J.S. Bridge scour prediction using 2D hydraulic model with empirical equations—A case study of Shuangyuan Bridge piers on the Kao-Ping River. In Proceedings of the 6th World Conference on Structural Control and Monitoring, Barcelona, Spain, 15–17 July 2014. [Google Scholar]
  19. Li, Z.W.; Yu, M.H. Numerical simulation of local flow field around spur dike. Wuhan Univ. J. Hydraul. Electr. Eng. 2000, 33, 18–22. [Google Scholar]
  20. Zhang, H.; Nakagawa, H.; Ishigaki, T.; Muto, Y. Prediction of 3D flow field and local scouring around spur dikes. J. Hydraul. Eng. 2005, 49, 1003–1008. [Google Scholar] [CrossRef]
  21. Zhang, H.; Nakagawa, H.; Kawaike, Y.B.; Baba, Y. Experimental and simulation of turbulent flow in local scour around a spur dyke. Int. J. Sediment Res. 2009, 24, 33–45. [Google Scholar] [CrossRef]
  22. Hong, J.H.; Guo, W.D.; Chiew, Y.M.; Chen, C.H. A new practical method to simulate flood-induced bridge pier scour—A case study of Mingchu Bridge piers on the Cho-Shui River. Water 2016, 8, 238. [Google Scholar] [CrossRef]
  23. Melville, B.W.; Coleman, S.E. Bridge Scour; Water Resources Publications: Highlands Ranch, CO, USA, 2000. [Google Scholar]
  24. Lai, J.S.; Guo, W.D.; Lin, G.F.; Tan, Y.C. A well-balanced upstream flux-splitting finite-volume scheme for shallow-water flow simulations with irregular bed topography. Int. J. Numer. Methods Fluids 2010, 62, 927–944. [Google Scholar] [CrossRef]
  25. Guo, W.D.; Lai, J.S.; Lin, G.F.; Lee, F.Z.; Tan, Y.C. Finite volume multi-stage scheme for advection-diffusion modeling in shallow water flow. J. Mech. 2011, 27, 415–430. [Google Scholar] [CrossRef]
  26. Guo, W.D.; Yang, T.H.; Chang, Y.C.; Shih, D.S.; Chen, C.H.; Ho, J.Y.; Lee, K.T.; Lin, G.F.; Hsiao, L.F.; Lee, C.S. Real-time scour depth predicting system based on ensemble quantitative precipitation forecast. In Proceedings of the 35th IAHR World Congress, Chengdu, China, 8–13 September 2013. [Google Scholar]
  27. Galay, V.J.; Yaremko, E.K.; Quazi, M.E. River Bed Scour and Construction of Stone Riprap Protection in Sediment Transport Gravel Bed Rivers; John Wiley and Sons, Ltd.: New York, NY, USA, 1987. [Google Scholar]
  28. Thorne, C.R. Bank Processes on the Red River between Index, Arkansas and Shreveport, Louisiana; Final Report to the US Army European Research Office, contract number DAJA45-88-C-0018; Department of Geography, Queen Mary College: London, UK, 1988. [Google Scholar]
  29. USA Army Corps of Engineering (USACE). Hydraulic Design of Flood Control Channels; Engineering Manual 1110-2-1601; Department of the Army, Corps of Engineers, Office of the Chief of Engineers: Washington, DC, USA, 1994. [Google Scholar]
  30. Lin, G.H.; Lin, C. Research in Foundation Erosion of Hazard Potential Levees in Jhuoshuei River; Fourth River Management Office, Water Resources Agency, Ministry of Economic Affairs: Changhua County, Taiwan, 2013.
  31. Lu, J.Y. Field Study of Short-Term Riverbed General Scour for Typhoon-Induced Floods; Water Resources Planning Institute, Water Resources Agency, Ministry of Economic Affairs: Taichung, Taiwan, 2014.
  32. Su, C.C.; Lu, J.Y. Measurements and prediction of typhoon-induced short-term general scours in intermittent rivers. Nat. Hazards 2013, 66, 671–687. [Google Scholar] [CrossRef]
  33. Abou-Seida, M.M.; Elsaeed, G.H.; Mostafa, T.M.; Elzahry, E.F. Local scour at bridge abutments in cohesive soil. J. Hydraul. Res. 2012, 50, 171–180. [Google Scholar] [CrossRef]
  34. Chow, V.T. Open-Channel Hydraulics; McGraw-Hill: New York, NY, USA, 1959. [Google Scholar]
  35. Lai, J.S. Implementation and Application Study of the Achievements between WRA and USBR Cooperation (2/4); Water Resources Planning Institute, Water Resources Agency, Ministry of Economic Affairs: Taichung, Taiwan, 2010. (In Chinese)
Figure 1. Topographic map of study site in the Cho-Shui River basin.
Water 09 00324 g001
Figure 2. Aerial view of the study site before (a) and after (b) Typhoon Saoloa. The location of the scour measurement is also illustrated (c).
Water 09 00324 g002
Figure 3. Size distribution of sediment particles at the study site where the survey was conducted in 2013.
Water 09 00324 g003
Figure 4. Flow hydrographs for Typhoons Trami (August 2013) and Usagi (September 2013).
Water 09 00324 g004
Figure 5. Definition sketch showing the bend scour: (a) top view; (b) cross-sections looking downstream.
Water 09 00324 g005
Figure 6. Measured versus computed bend scour depth using Equation (6).
Water 09 00324 g006
Figure 7. The algorithm of the proposed method for estimating the evolution of bend scour depth.
Water 09 00324 g007
Figure 8. The simulation domain in a gravel-bed bend river reach of the Cho-Shui River
Water 09 00324 g008
Figure 9. Comparisons of simulated and measured water level hydrographs for (a) Typhoon Trami and (b) Typhoon Usagi.
Water 09 00324 g009
Figure 10. 2D contours showing simulated velocities under peak flood condition for (a) Typhoon Trami (Qp = 4186 m3/s) and (b) Typhoon Usagi (Qp = 5309 m3/s).
Water 09 00324 g010
Figure 11. The simulated time variations of bend scour depths using four approaches for (a) Typhoon Trami and (b) Typhoon Usagi.
Water 09 00324 g011
Figure 12. The relationship between the bend scoured depth, scoured bed level, and flow discharge at Chi-Chi Weir (a). The location of Shuideliaw Embankment and adjacent bed change at cross section 105 are also illustrated (b).
Water 09 00324 g012
Table 1. Field data collection for short-term bend scour induced by floods.
RiverSiteFlood EventQp (m3/s)qp (m2/s)s0d50 (mm)R0 (m)dbs (m)Remark
Cho-Shui RiverCho-Shui Embankment1. Typhoon Nanmadol (August 2011)1641.480.00633.436050.67Lin and Lin [30]
Fanziliao Embankment2. Typhoon Talim (June 2012)3461.860.007123.54180.22
3. Typhoon Saola (August 2012)4752.970.00577.54180.8
Linan Embankment4. Typhoon Nanmadol (August 2011)1861.310.0066855580.36
5. Typhoon Saola (August 2012)227913.210.006634.55582.36
Shanhan Embankment6. Typhoon Talim (June 2012)5624.440.015319.54711.9
Aiguoqiao Embankment7. Typhoon Talim (June 2012)118211.870.0112481690.47
8. Typhoon Saola (August 2012)183714.940.014825.51692.45
Shuideliaw Embankment9. Typhoon Trami (August 2013)418625.370.005271088001.71Lu [31]
10. Typhoon Usagi (September 2013)530918.310.005271088003.30
Da-Chia RiverFengzhou Embankment11. Typhoon Soulik (July 2013)669222.010.007551685005.23
12. Typhoon Trami (August 2013)239310.640.007551685000.55
Table 2. Simulated results for two flood events using three criteria.
EventsThree Criteria
p (%)ETp (%)R2
Typhoon Trami (August 2013)0.13358.690.874
Typhoon Usagi (September 2013)0.46008.330.889
Table 3. The simulated maximum bend scour depths and the relative errors by four approaches for Typhoon Trami and Typhoon Usagi.
MethodsTyphoon Trami (Measured = 1.71 m)Typhoon Usagi (Measured = 3.3 m)
Simulated E d b s ( % ) Simulated E d b s ( % )
Galay et al. [27]1.52−11.112.22−32.73
Thorne [28]3.0477.784.8546.97
U.S. Army Corps of Engineering [29]3.2590.064.3732.42
Proposed method1.9011.112.78−15.76

