Article

Hydrologic Controls and Water Vulnerabilities in the Naryn River Basin, Kyrgyzstan: A Socio-Hydro Case Study of Water Stressors in Central Asia

1
Geography department, University of Colorado-Boulder, Boulder, CO 80309, USA
2
Cooperative Institute for Research in Environmental Sciences (CIRES), Boulder, CO 80309, USA
3
Kyrgyz Institute of Water Problems and Hydropower, Bishkek 720033, Kyrgyzstan
*
Author to whom correspondence should be addressed.
Water 2017, 9(5), 325; https://doi.org/10.3390/w9050325
Submission received: 16 March 2017 / Revised: 28 April 2017 / Accepted: 3 May 2017 / Published: 5 May 2017
(This article belongs to the Special Issue Global Warming Impacts on Mountain Glaciers and Communities)

Abstract

:
Water vulnerabilities in Central Asia are affected by a complex combination of climate-sensitive water sources, trans-boundary political tensions, infrastructure deficiencies and a lack of water management organization from community to federal levels. This study aims to clarify the drivers of water stress across the 440 km Naryn River basin, headwater stem to the Syr Darya and the disappearing North Aral Sea. We use a combination of human and physical geography approaches to understand the meltwater-controlled hydrology of the system (using hydrochemical mixing models) as well as the human-water experience (via community surveys). Surveys indicate that current water stress is primarily a function of water management and access issues resulting from the clunky transition from Soviet era large-scale agriculture to post-Soviet small-plot farming. Snow and ice meltwaters play a dominant role in the surface and ground water supplies to downstream communities across the study’s 4220 m elevation gradient, so future increases to water stress due to changes in volume and timing of water supply is likely given frozen waters’ high sensitivities to warming temperatures. The combined influence of social, political and climate-induced pressures on water supplies in the Naryn basin suggest the need for proactive planning and adaptation strategies, and warrant concern for similar melt-sourced Central Asian watersheds.

1. Introduction

Meltwater from snow and glaciers feeds downstream rivers and is a critical part of water supplies around the world [1]. Peak meltwater flows, in the spring and summer, coincide with increased demand from human users for irrigation and hydropower. Rising temperatures associated with climate change will influence the timing and magnitude of this annual cycle [2]. The uncertainties associated with climate change translate to uncertainties about the timing and volume of meltwater contributions to river discharge [3].
In eastern Kyrgyzstan, the glaciers and snowpack of the Tien Shan Mountains form the headwaters of the Naryn River Basin. The Naryn flows westward across Kyrgyzstan before crossing the border into Uzbekistan where it joins the Kara Darya (River) to create the Syr Darya, central source to the disappearing North Aral Sea. The trans-boundary nature of the Syr Darya river basin and its tributaries, such as the Naryn, mean that there is an overtly political dimension to their flows. In a semi-arid region already facing water stress, the development of new infrastructure such as dams or diversions have the potential to create tension with downstream neighbors [4]. This will play out in yet to be determined ways in the Naryn River Basin, as Russian financing for the Upper Naryn cascade and Kambarata-1 hydropower projects is in limbo [5]. Similar examples of competing water demands as a conflict spark can be found across the trans-boundary mountain sourced rivers of Central Asia [6,7].
With the myriad of demands on melt sourced rivers in Central Asia, clarification of the stressors on these system—in terms of both water quantity as well as infrastructure issues—can provide a basis for water management planning and adaptation across sectors. With this study we present water chemistry data from the Naryn River Basin as a method for identifying changing source water contributions to river discharge from the mountain headwaters downstream to agricultural areas serving larger populations. In addition to collecting water samples, our field work included community surveys along the river in order to understand how water availability and access has changed over time, and to understand what challenges the people of the Naryn basin face in obtaining adequate water supplies. Our unique combination of data sets allows us to address the following objectives: (1) Utilize geochemical and isotopic hydrochemistry data to clarify the role that melt water plays in summer water supplies from mountain headwaters to downstream agricultural areas; and (2) present a narrative of community water issues observed along a 440 km stretch of the Naryn River.
The summer timing of our data collection is particularly valuable as a contribution to understanding the partition of river water between meltwater and other sources (e.g., groundwater and rain) during the irrigation season. Water issues for communities in the basin range from irrigation infrastructure and water availability that became problematic after the fall of the Soviet Union to the long-lasting impacts of relocation due to construction of the Toktogul Dam when many communities were moved to new sites in the 1960s.
The human relationship with water in the Naryn River basin is multi-faceted and is influenced by water quality, water volume, access to water and varying degrees of reliance on water for livelihoods. In the headwaters the Kumtor Gold Mine, which has been in operation since 1997, has accounted for up to 12% of Kyrgyzstan’s GDP and half of its exports in a given year [8], adding a unique but complex facet touching many factors that define the human-water relationship. All of these factors are in turn impacted by local, regional, and national government management approaches.
Analysis of our coupled hydrologic and socio-hydro datasets responds to recent calls for interdisciplinary consideration of “the glacier run off problem” [9]—how glacier recession affects downstream populations, acknowledging the sometimes disproportionate impacts that socio-political factors may have on melt water access. We incorporate both the physical context for water resource management and the socio-political dimensions of water availability and use at the community level. Thus, our work is able to more realistically evaluate and uniquely inform the need for adaptive planning and resiliency strategies for the Naryn River basin and basins with similar characteristics across Central Asia.

2. Materials and Methods

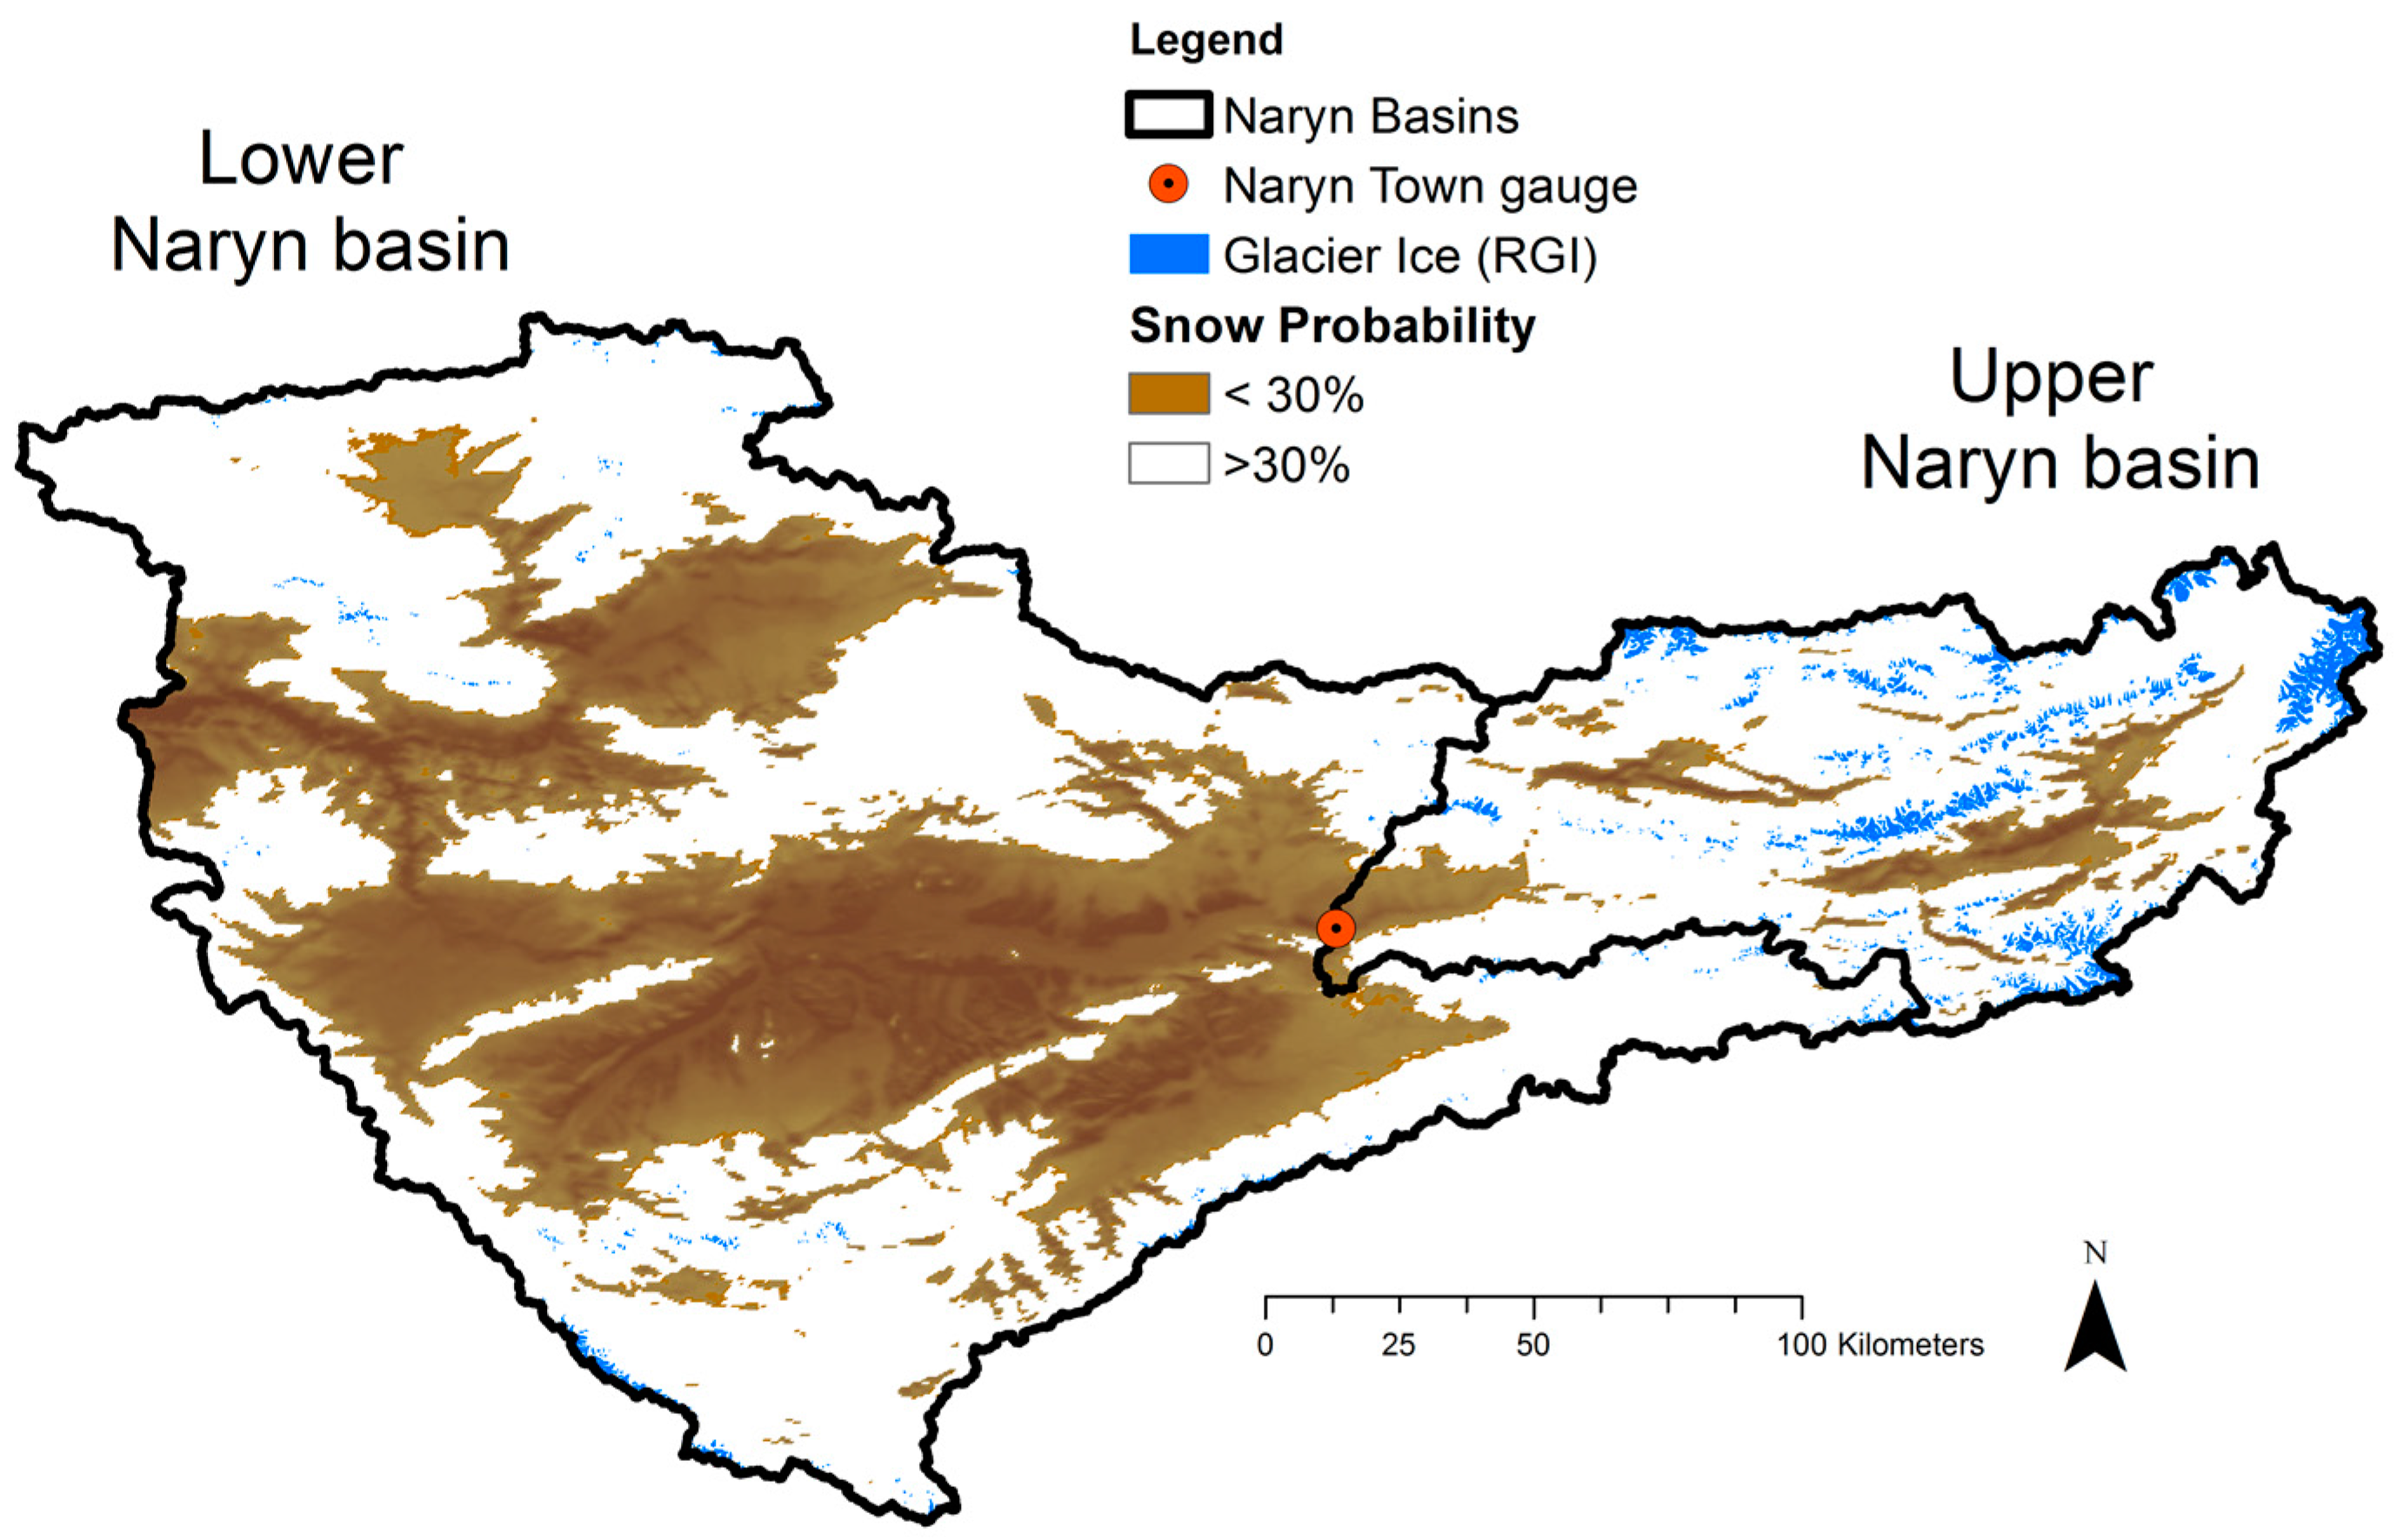
2.1. Quantifying the Hydrologic Setting

Hydrologic inputs to the system include rain, seasonal snow and glacial melt. Remotely sensed products were utilized to quantify these inputs due to the dearth of in situ data available for the basin. The MODIS (Moderate Resolution Imaging Spectroradiometer) Snow Covered Area and Grain Size (MODSCAG) algorithm [10] was utilized to develop a snow probability map using snow cover fraction. Compared to traditional MODIS maps, this approach results in increased accuracy particularly amidst complex land cover types [11]. Snow cover probability for a pixel represents the chance on any given day that the pixel was snow covered, and it is calculated based on clear sky acquisitions by MODIS satellites from 2001 to 2014. Snow probabilities less than 30% are ignored and re-set to 0 given the difficulties of differentiating clouds from snow cover. Glacier surfaces are mapped using the Randolph Glacier Inventory (RGI) [12], a product of the Global Land Ice Measurements from Space (GLIMS) glacier monitoring project [13]. Precipitation across the basin was calculated using downscaled 2001–2014 MERRA (Modern-Era Retrospective Analysis for Research and Applications) reanalysis data.
River discharge records are available at three locations within the study domain. While historical records are more extensive for some gauges, records overlap at all gauges for the four-year period between 2012 and 2015.

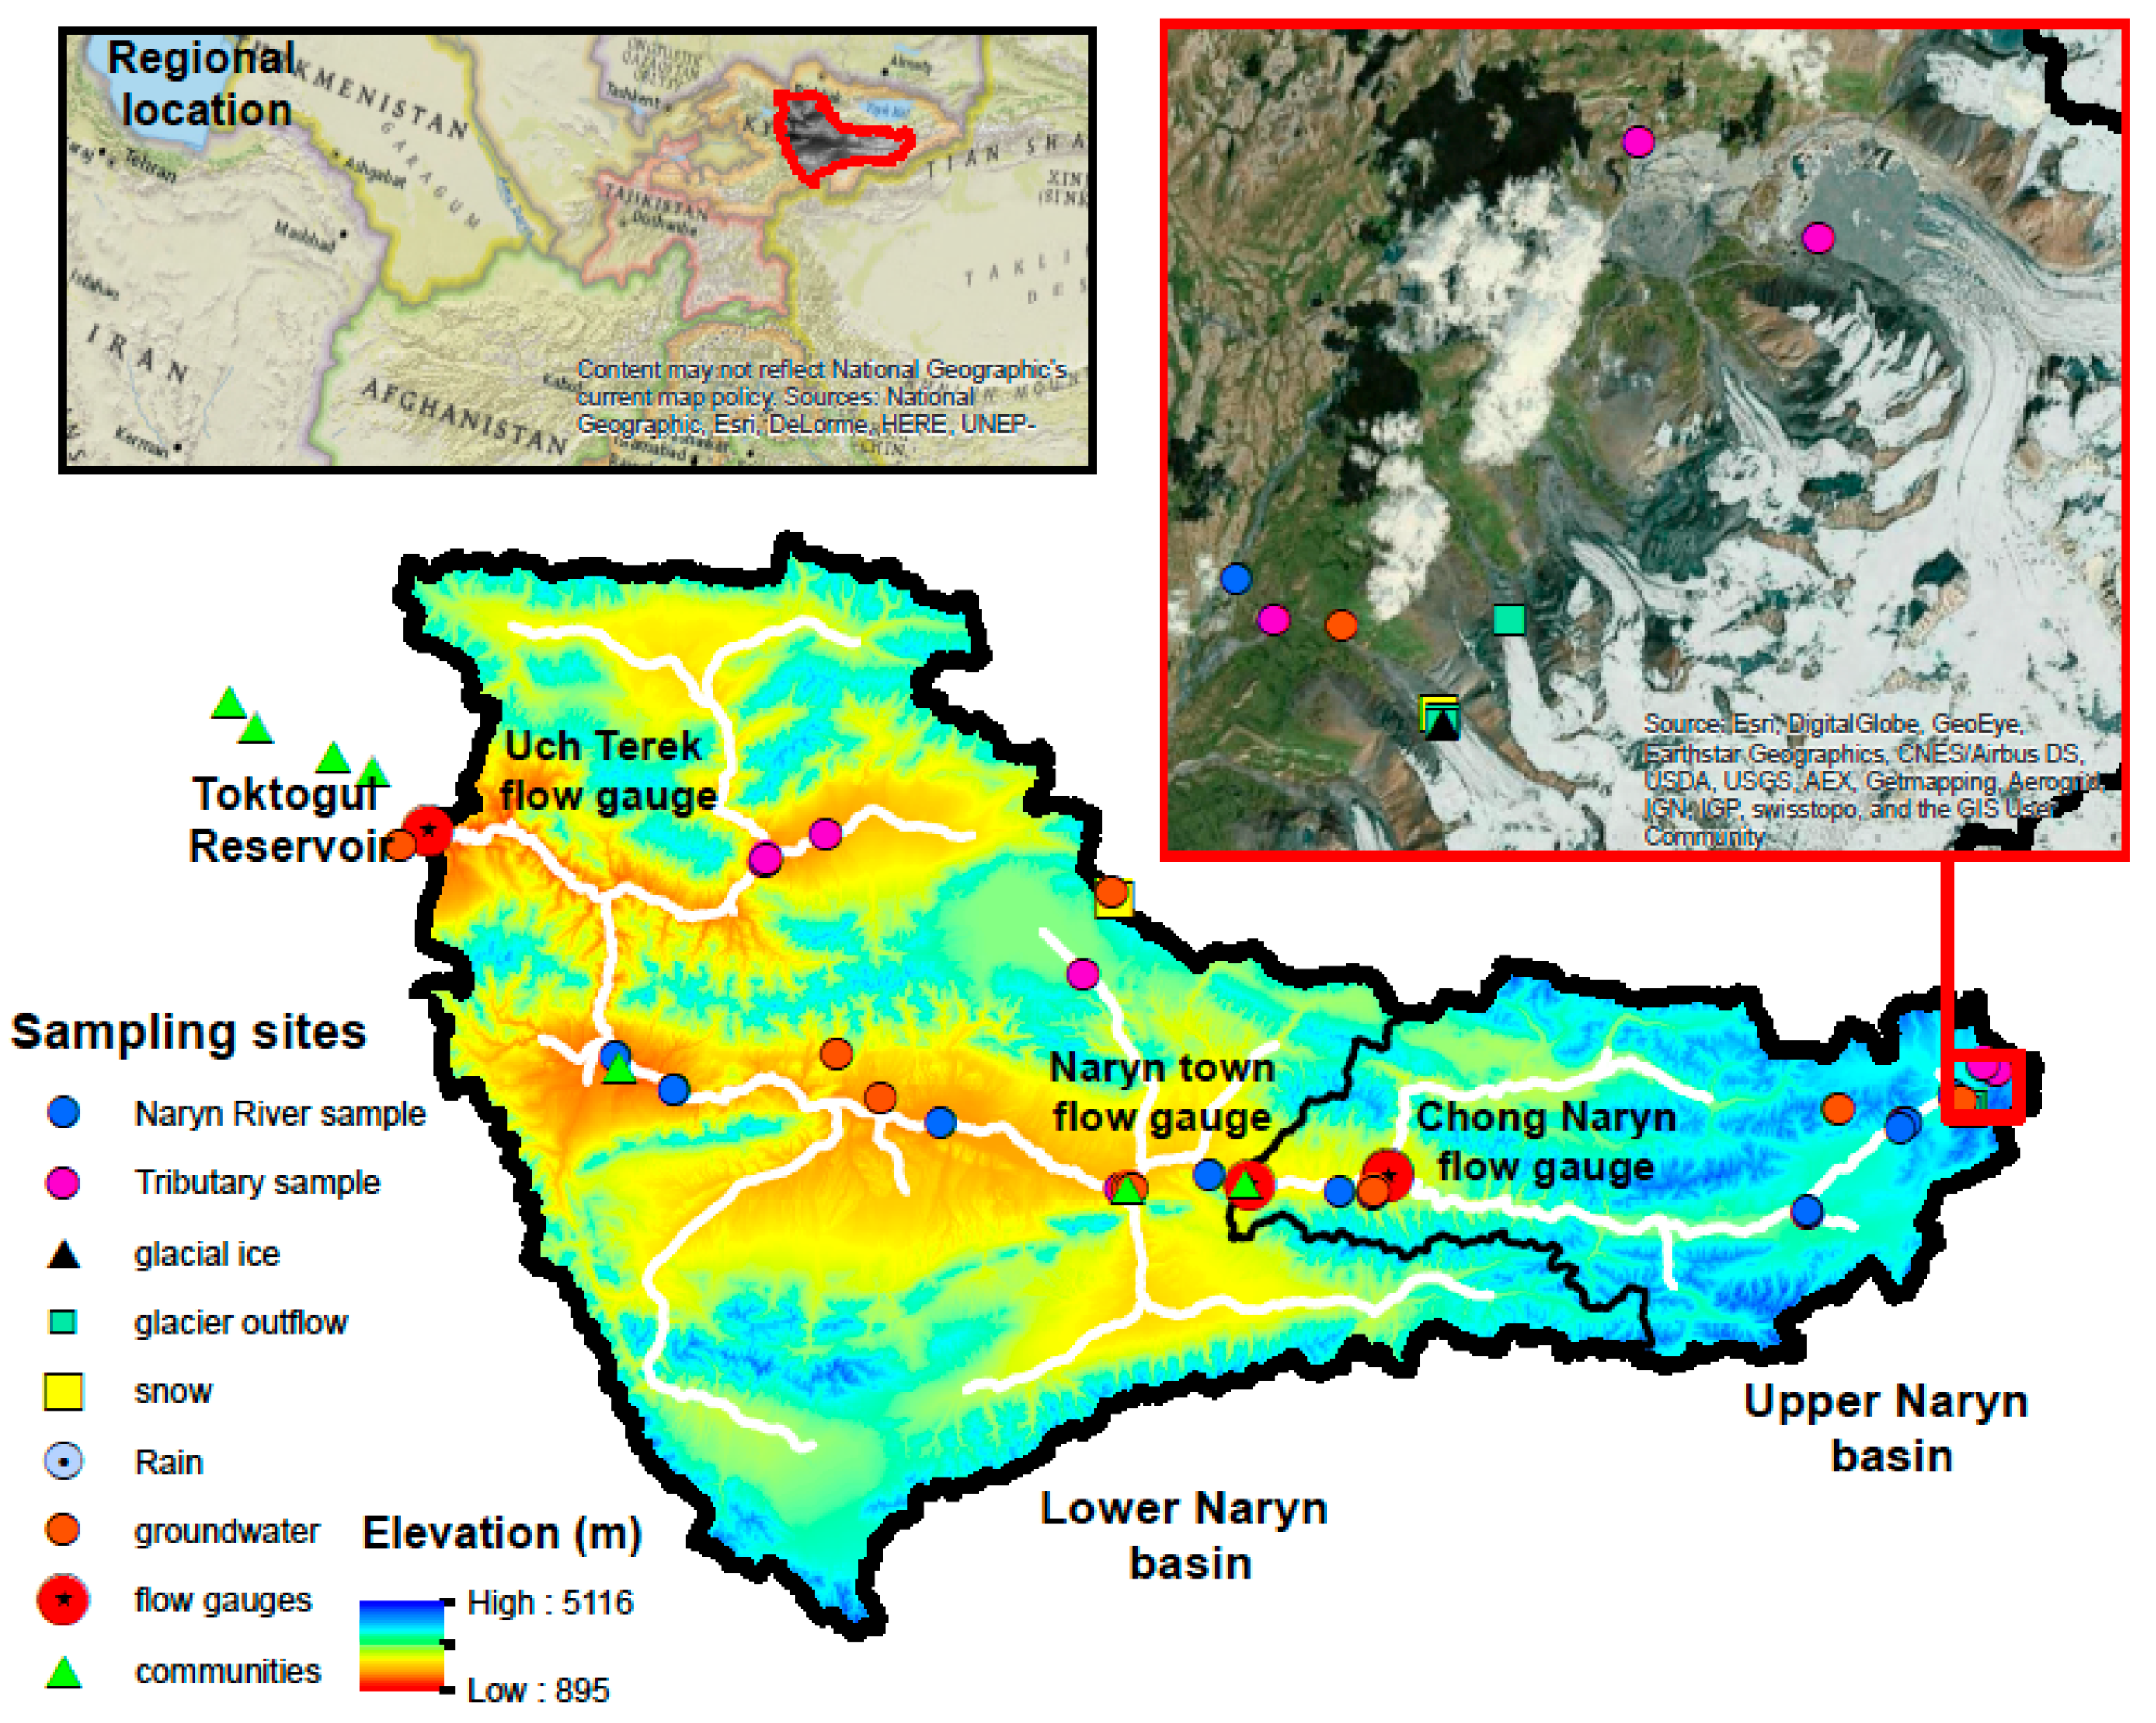
2.2. Synoptic Sample Design

A central challenge of conducting field work at regional scales in austere mountain environments is finding the balance between achievable sample numbers given challenging terrain and access, and sufficient variety to characterize change throughout the basin. The study domain includes an upstream glaciated alpine region that transitions through to plains over 440 river kilometers.
Our study area captures a diverse spectrum of characteristics and is defined as the Naryn River basin upstream of Uch Terek, at the head of Toktugul Reservoir. This catchment covers an area of 48,085 km2 and spans an elevation range between 898 m and 5116 m. Ecosystems transition from a semi-desert classification at the lowest elevations, up through steppe, sub-alpine meadow, alpine meadow, and culminating in a glacial environment. Vegetation is predominantly grass, shrubs, with a sparse presence of small trees. The Naryn River basin has a severe continental climate, with temperatures below −50 °C in winter and exceeding 40 °C in the summer. The geologic setting is primarily metamorphic, with the Naryn-Sonkul fault zone of the Northern Tien Shan stretching approximately 200 km in a general east-west trend along the river basin.
Our sampling design aimed to target water chemistry information to capture key hydrologic transitions over this diverse domain resulting in low sample numbers but highly explanatory data. This is in contrast to a sample design based on sampling at a pre-determined distance interval or site selection triggered by any tributary input.
Surface water sampling sites in this study initially focused on tributaries that either drained a significant sub-basin, thereby providing an integrated chemistry snapshot of a substantial drainage area, or tributaries with unusual landscape features that were hypothesized to have an impact on water chemistry. In total 23 surface water samples were collected including 13 mainstem and 10 tributary samples (Figure 1) with a synoptic Lagrangian approach, a sampling scheme that aims to follow roughly the same plug of water as it moves downstream.
We utilize End Member Mixing Analysis (EMMA) to distill multi-variate water chemistry data from samples to quantify the contributions of river source waters to flow [14]. To do this effectively, it is important to have a chemical fingerprint of possible end members contributing to river flow. In the case of the Naryn River, much of the water inputs to the system occur at higher elevations in the form of snow (Figure 3). Accordingly, end member samples collected for this study include glacial ice (n = 2, duplicate), snow (n = 2, one snow on glacier, one snow on land), and glacial outflow (n = 3). Glacial outflow is a conglomerate of individual water sources originating on or adjacent to glaciers. These waters access and are routed through glacial plumbing, eventually discharging at the glacier snout. Glacial outflow components include ice melt, snow melt, groundwater and rain, but are dominated in the Naryn basin during the study period by the cryospheric contributions. We experienced no rain while conducting fieldwork in the Naryn but rainwater was acquired in the adjacent Kyzyl Suu basin (n = 1).
Due to the importance for acquiring spatial representation of groundwater throughout the domain, groundwater sites were sought across the elevation gradient from a high elevation spring adjacent to Bordu glacier (3707 m) and at a high headwater pass (4005 m) to a low lying spring adjacent to Toktogul Reservoir (1036 m). Samples were collected at both naturally exiting groundwater springs and hand-pumped wells established for community water supplies. Depending on the site (well versus spring) and the level of ion concentrations in the waters, groundwaters are classified into three categories: reacted deep (wells), reacted shallow (high elevation springs), and unreacted shallow (interpreted as lateral “quickflow”) groundwater. Higher ion concentrations in groundwater suggest longer flow paths, longer residence times, or tortuous paths across reactable substrate (i.e., talus fields, rock glaciers), whereas low concentrations imply rapid movement at shallow depths [15].

2.3. Water Sample Collection and Analysis

Samples for geochemical and isotopic analysis were collected and analyzed following the protocols and methods described in Wilson et al. [16] with analysis performed at the Arikaree Water Chemistry Laboratory (ions) and the Ecohydrology Laboratory (isotopes) at the University of Colorado-Boulder. Stable water isotopes are reported as a ratio of the sample to the Vienna Standard Mean Ocean Water (VSMOW):
δ O 18 ,   δ D = [ ( R s a m p l e R V S M O W ) 1 ] × 10 3
where R is the ratio of 18O/16O or 2H/1H. Results are reported as δ (per mil, or ‰).

2.4. Mixing Models and Source Water Separations

EMMA is traditionally employed with a time series of data to calculate the hysteresis of source waters over a relatively small spatial domain, e.g., [15,17,18]. These studies generally anticipate a set pool of end members that are consistent throughout the time series. In this study, we utilize a synoptic survey in July and August 2016 to evaluate changes in water sources to river flow over space, not time. End member options for river water sources continually change throughout the catchment due to the availability of new inputs and as the nature of groundwater evolves.
To apply EMMA to this unique study, we divide the basin into two sub-regions that we hypothesize are controlled by separate but related source waters and processes: the headwaters (Upper Naryn) and the plains (Lower Naryn). This allows for the outflow river composition at the lower headwater boundary to feed the inflow river composition at the upstream extremity of the plains, and recognizes that there are discrete differences to possible inputs (i.e., melt inputs) between the headwaters and plains that warrant the systems to be considered separately.
The headwaters (Upper Naryn) start as the Kumtor River and is fed initially by the Petrova glacier’s terminal lake, Petrov Lake. The Kumtor River and the Kichi Naryn River come together 32 km upstream of Naryn town and collectively make up the headwater sources to the larger Naryn River. The Lower Naryn sub-region spans from Naryn town to Toktogul reservoir over 255 km.
End-member mixing analysis was employed separately for the Upper Naryn and Lower Naryn. Following Hooper [12], the dimensionality of the mixing space and identification of conservative tracers was determined. Conservative tracers were utilized to distill the multi-variate chemistry dataset into two principal components for a 3-member mixing space. The two principal components serve as the basis for axes in a “U-space” plot (a mixing diagram) where all end members and surface water samples are projected [14].
End member selection is derived using several diagnostics [19]. Triangles formed by three end members will ideally encapsulate all river samples in the mixing diagram. To further evaluate end member fit the distance between the projected point and the actual point, the so-called Euclidean distance, is calculated as a percent of the original tracer concentration. Ideally the Euclidean distance is minimized for selected end members [20]. Percent contributions of each selected end member are then quantified for each surface water sample. To evaluate the model performance and confirm end member selection, tracer concentrations were re-constructed using end member concentrations and the percent contribution results from EMMA. Poor concentration reconstructions for any tracer may prompt further consideration such as testing use of different conservative tracers or different end members in the mixing model.

2.5. Socio-Hydro Surveys

Depending on the total population of communities located in the vicinity of the water chemistry sampling locations along the Naryn River, we used two techniques for socio-hydro data collection: (1) interviewing local government, district and provincial water managers as well as local data management department staff in larger communities such as Naryn and Toktogul; and (2) door-to-door surveys in small communities with an average of 300 households and total population up to 2000. Door-to-door surveys included an initial step of identifying communities’ informal leaders (e.g., elders, teachers) to find local community experts with 4 to 5 mixed-gender, multi-generational households surveyed per community. Across large and small communities more than 40 survey participants took part in a total of 17 interviews. Overall, the two approaches assessed current, local water supply dependencies as well as socio-economic changes within communities over the last 15 years as a result of modified water flow, hydropower and irrigation projects.
The emphasis of the questionnaire was to assess the “resiliency” of communities to changing water supplies with respect to both consumption and production. Topics included changes in river services for irrigation, food, flood, recreation, and water access, as well as changes in household activities, estimated income, and income structure over the last 15 years. An example of survey questions and responses is provided in the Supplementary Material.
Community selection aimed to capture the difference between communities living adjacent to natural river flow versus a regulated reservoir. Naryn, Dostuk and Kazarman communities are situated upstream of Toktogul reservoir and were chosen to represent unregulated river basin communities. In contrast, the downstream river basin communities surveyed in this study (Toktogul, Kotormo, Terek Suu and Cholpon Ata) experience regulated water management impacts due to village relocation in the 1960s as a result of the reservoir construction. Toktogul and Kotormo lie adjacent to Toktogul reservoir, so their current interaction with the Naryn generally relates to the reservoir itself. Terek Suu and Cholpon Ata villages were relocated to a tributary that flows into Toktogul Reservoir. None of the downstream communities surveyed are affected by regulated flows downstream of Toktogul reservoir per se, but dam construction has disrupted their historical approach to water access.

3. Results

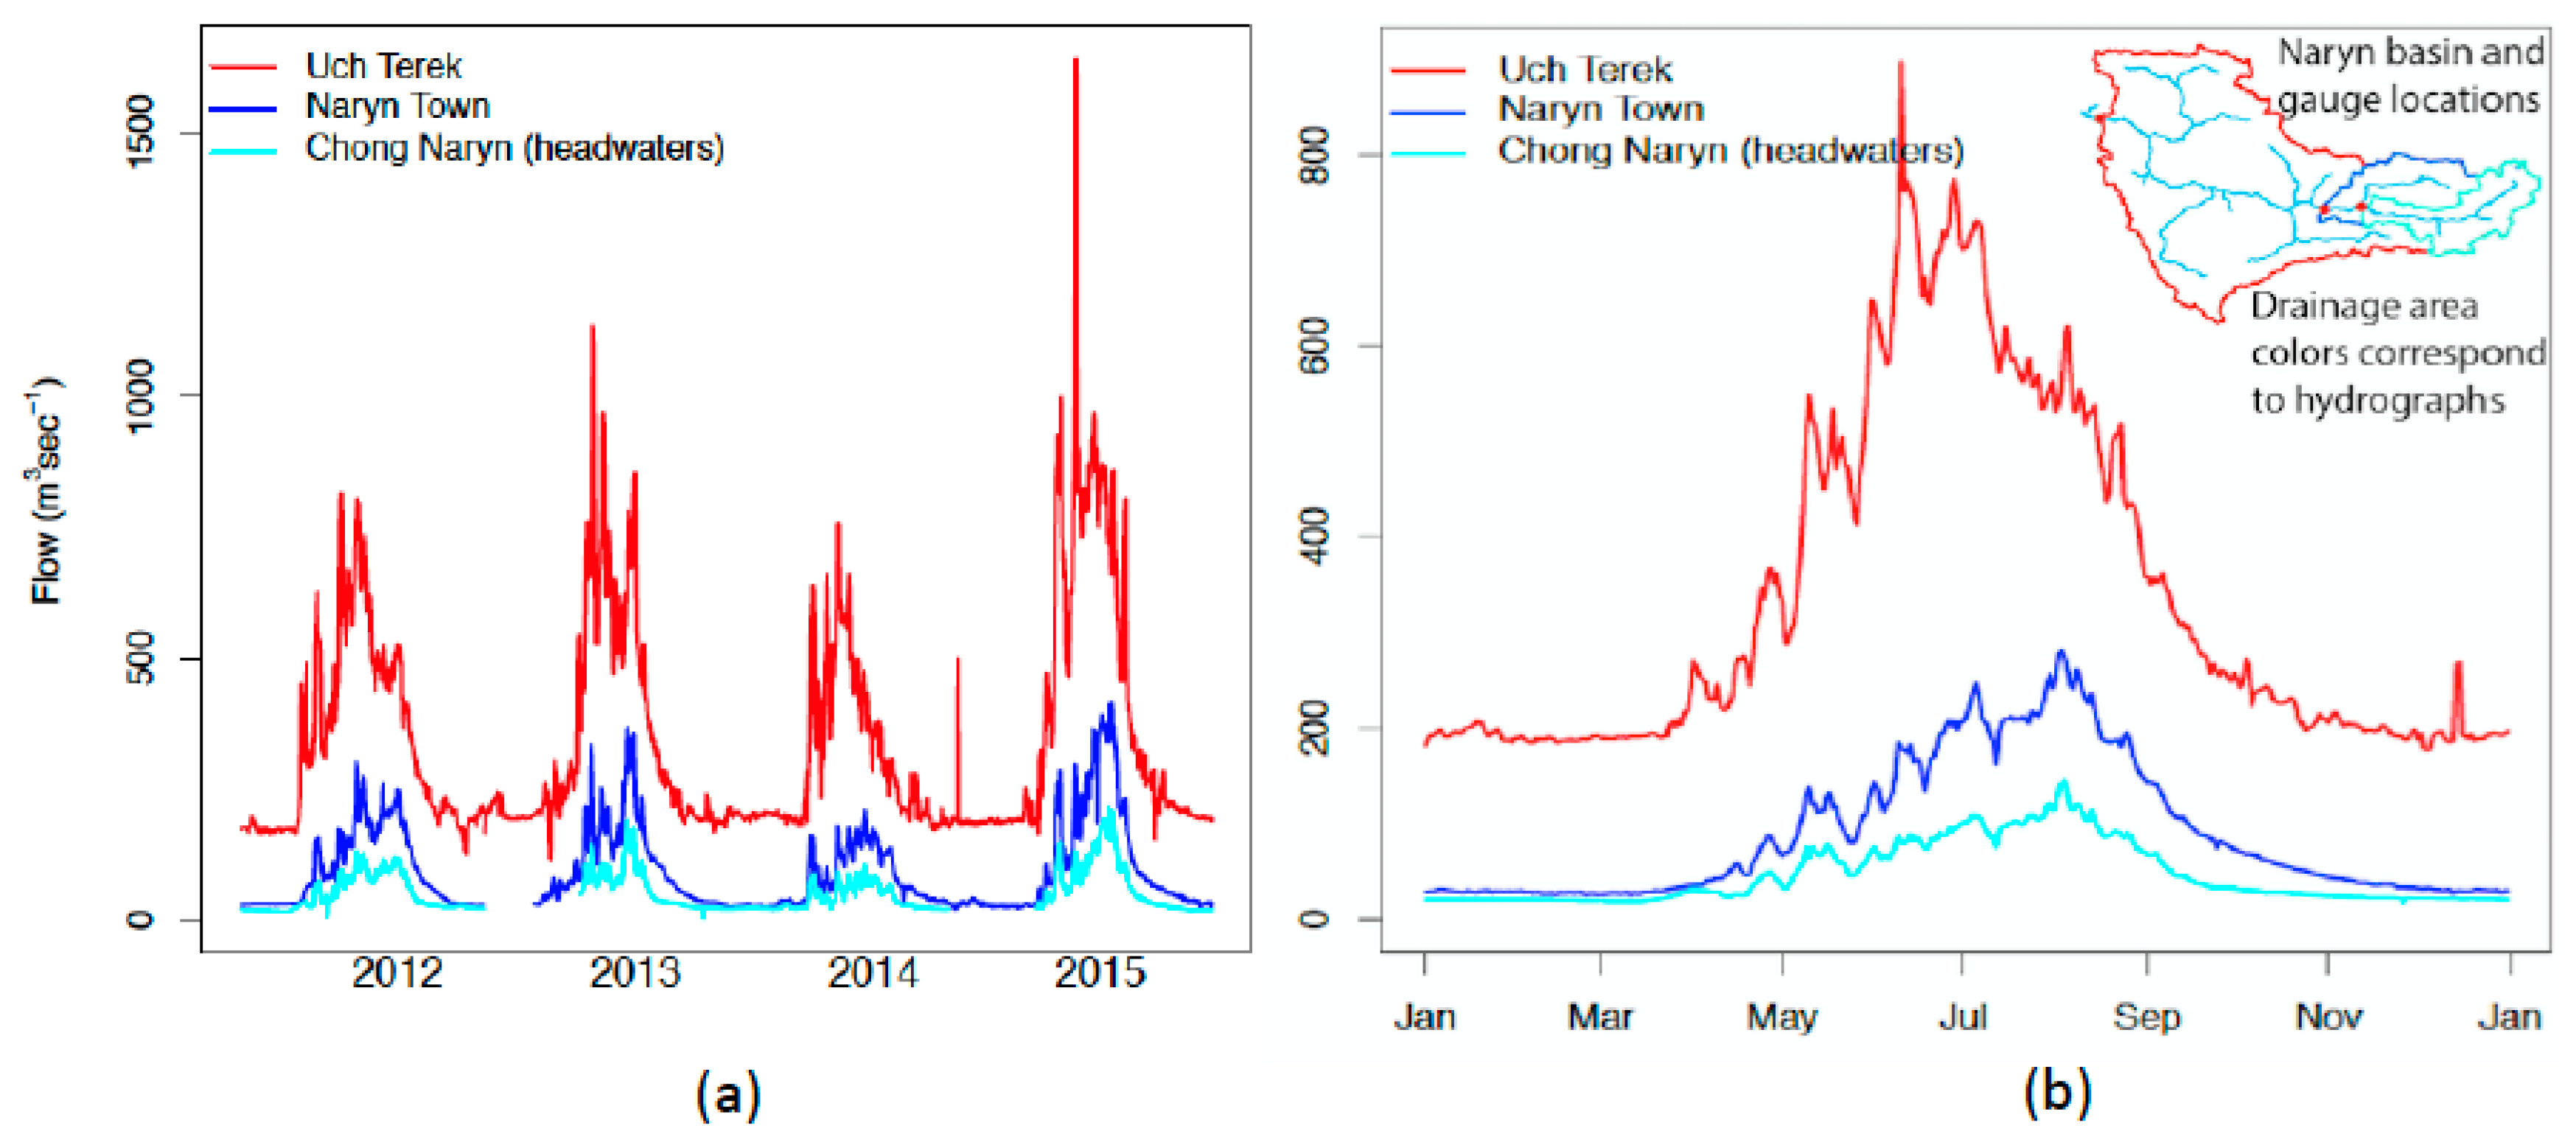
3.1. Hydrologic Setting

Peak flow in the Upper Naryn occurs in late July or early August, while the Lower Naryn experiences an earlier peak in late May or early June. The Naryn River hydrograph shape across elevations demonstrates the transition from ice to snow melt sourced waters as the river progresses downstream. The upper gauge (Chong Naryn) exhibits a typical sustained late summer flow shape of a glacier sourced system, while the lower elevation gauge at Uch Terek shows more water mass and higher flows earlier in the year coincident with the spring snow melt season (Figure 2). The “flashy” character of the annual hydrograph’s rising limb suggests a river system that is fairly responsive to the highly variable precipitation inputs over the course of the year (Figure 2a).
Rain during the drier months almost always comes in multi-day storms, and in the rainy months the intensity can vary by an order of magnitude from day to day. Based on the 14 years of MERRA precipitation data across nine 500 m elevation bands (500 m to 4500 m), 70% of the months record both rain and snow event within the same elevation band. This suggests rain-on-snow events may exacerbate the high magnitude response of stream flow to new precipitation inputs across elevations. Since glaciers play a role reducing both intra- and inter-annual flow variability by providing a consistent ice melt supplied baseflow through the melt (summer) season that is independent from storm spikes, depletion of ice mass in glacier systems will lessen the water they supply to river systems over the long term and may impose a hydrograph that is even more responsive to changes in weather.
A substantial baseflow of approximately 200 m3 s−1 is observed outside of the melt season at the regional basin scale shown at the Uch Terek gauge, while consistent but smaller baseflows are present in the Upper Naryn. A small run-of-river reservoir is located immediately upstream of Uch Terek flow gauge and may account for the highly consistent winter flow recorded at this point.
Precipitation across the basin averages 27.13 cm per year, with 63% falling as rain and 27% falling as snow, however above 3000 m the total precipitation inputs are approximately half rain and half snow. In relation to the way the basin is split in this paper for analysis, approximately 40% of precipitation in the Upper Naryn falls as snow. Within the Lower Naryn Basin, annual precipitation inputs are comprised on average of 89% rain.
In the Upper Naryn basin, 84% of the area (8632 km2) has snow probability >30% while this figure applies to 54% (20,424 km2) of the Lower Naryn basin area (Figure 3). Glaciers are present at the headwaters and provide melt inputs to both headwater stems as well as to the Ak-Tal, a major tributary joining the Naryn River at Dostuk. Glacier ice covers 994 km2, or 2% of the entire study domain.

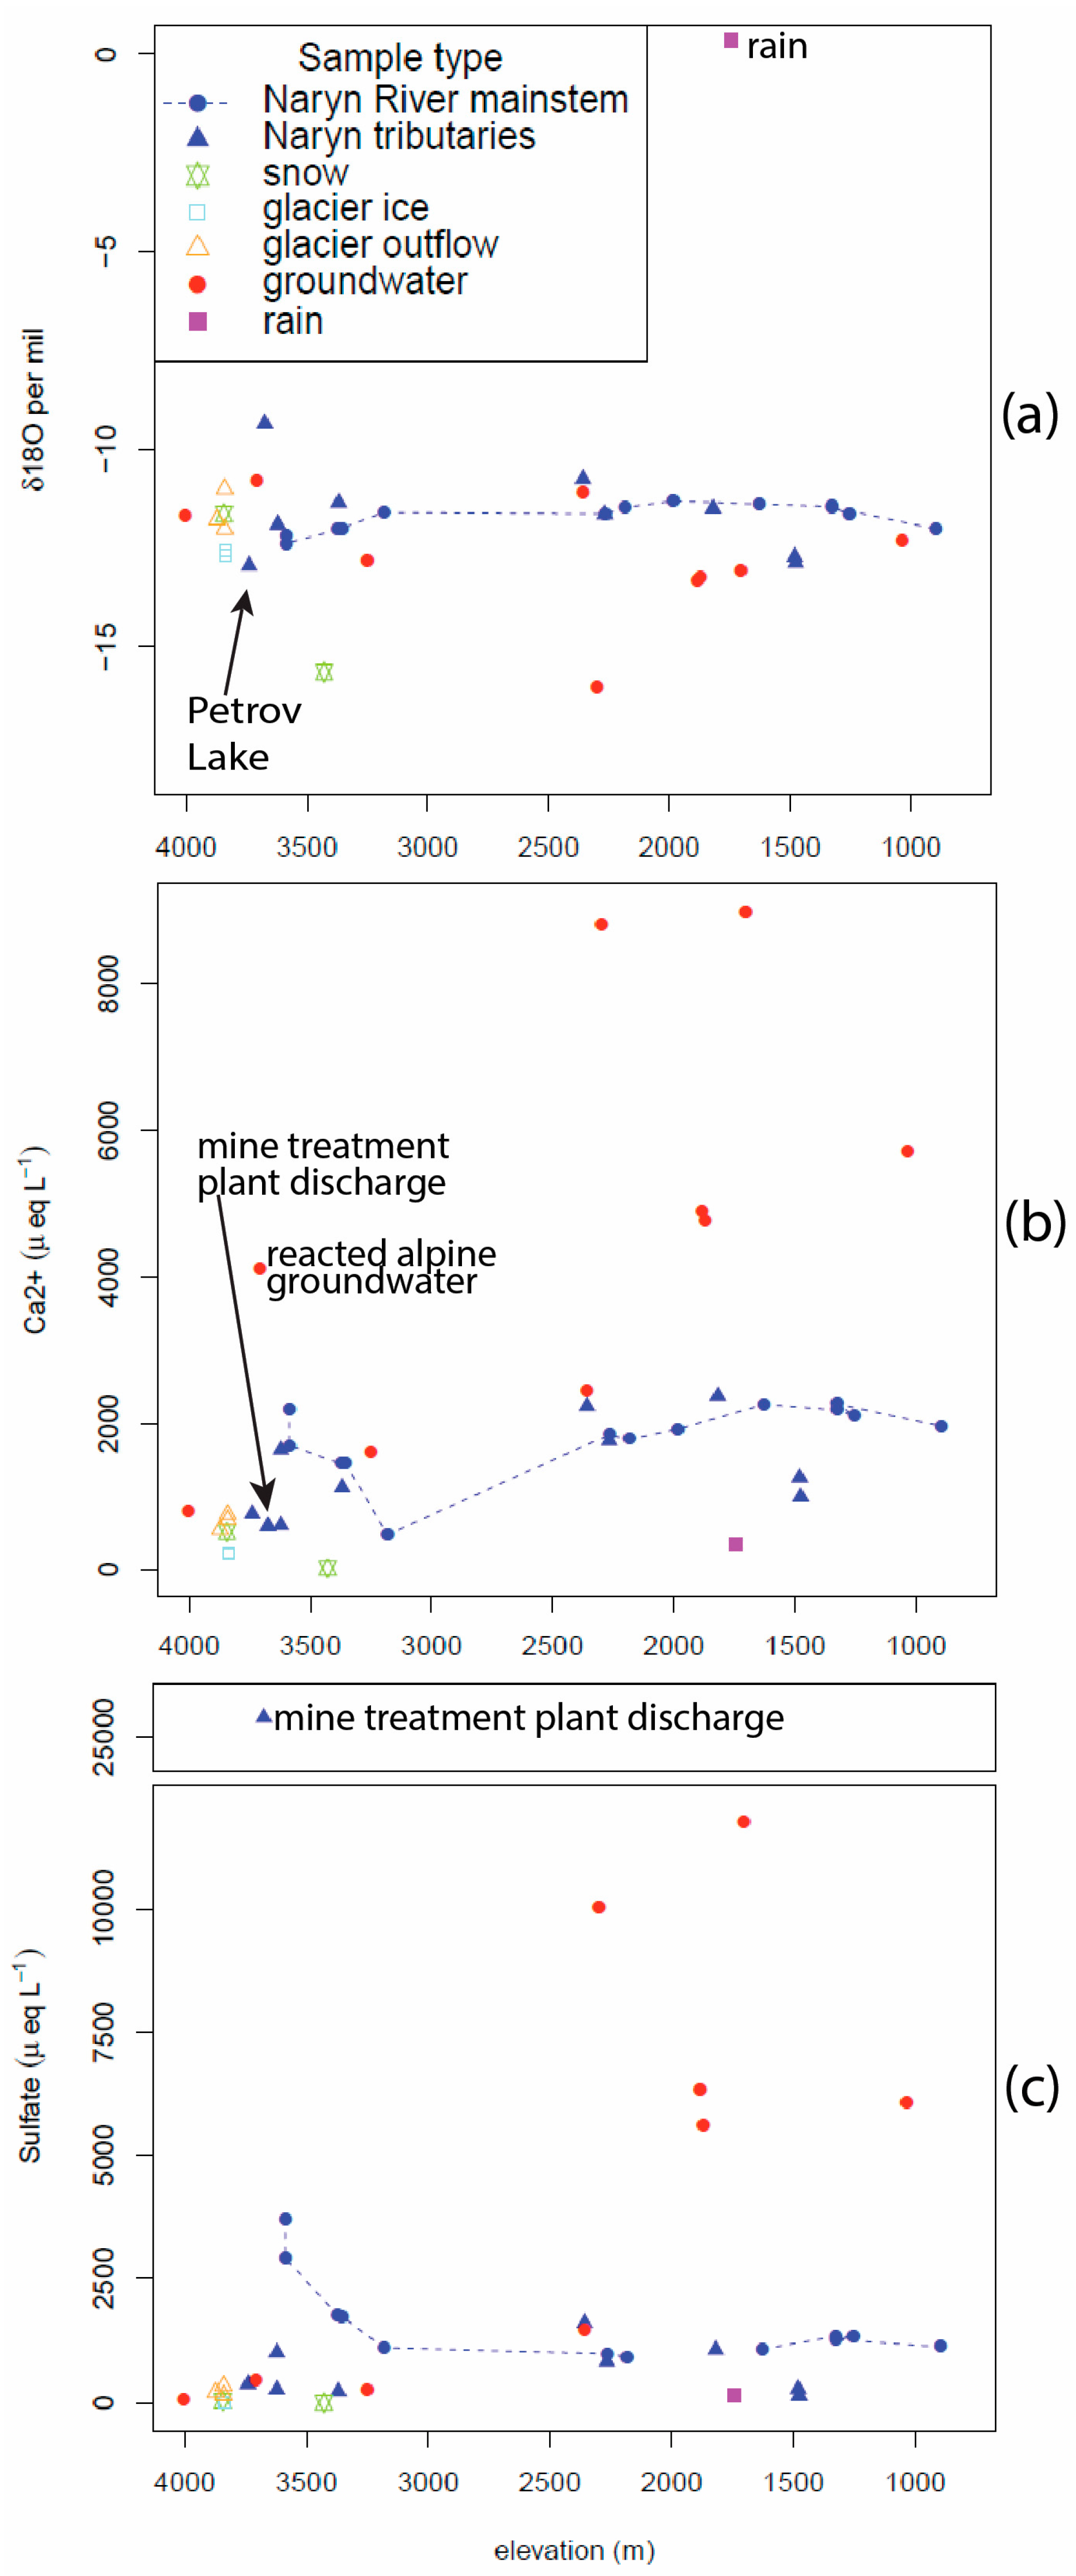
3.2. Hydro Chemistry Elevation Gradient

Isotope variation of Naryn River waters across the elevation gradient show a strikingly consistent isotope value throughout the basin (Figure 4a). δ18O values for mainstem waters hover around −12‰ from the highest elevation sample all the way through to Toktogul Reservoir. Tributary sample δ18O values vary more than the mainstem ranging from −13‰ to −9‰. Notably, crysopheric end member samples—Snow, ice, glacial outflow and high elevation groundwater—bracket the isotope values found in the Naryn River. In contrast, the rain sample acquired in the adjacent Kyzyl Suu basin has a δ18O value of 0‰, suggesting that surface waters in the Naryn basin are dominated by melt water sources. With the exception of the groundwater spring at Kazarman Pass (2299 m, −16‰), groundwater isotopes throughout the basin (−13‰ to −11‰) also hover near the isotopic values of the high elevation melt water group and are discretely different than rain.
The ion concentration progression demonstrates the combined influence of groundwater contributions and mine discharge on the chemical signature of mainstem waters (Figure 4b,c). The mine discharge sample provides exceptionally high levels of SO42− (25,387 μeq L−1) and Na+ (24,596 μeq L−1) to the mainstem waters. However, it is Ca2+ poor (599 μeq L−1) and does not account for the high Ca2+ values observed in both mainstem waters and tributaries that are hydrologically disconnected from the mine discharge waters (e.g., Bordu Stream and Arabel River). Extremely elevated levels of Ca2+ (4116 μeq/L, twice the level of Ca2+ in the mainstem) were found in the Bordu alpine groundwater sample that logically also contributes to high elevation river flow. These groundwaters are SO42− and Na+ poor (453 μeq L−1 and 238 μeq L−1, respectively), and so there is intuitively a joint contribution from mine discharge waters and groundwater that accounts for the elevated ion profile of the Kumtor (Upper Naryn) River.
Dilution of ions with decreasing elevation likely result from added ion-poor snowmelt contributions as the catchment expands to include major additional sub-basins adding significant alpine areas and snow cover to the basin. This dilution trend is observed until 3182 m in the Ca2+ profile (Figure 4b), then reverses towards an increasing concentration pattern likely a result of groundwater contributing increasing proportions to the river flow.

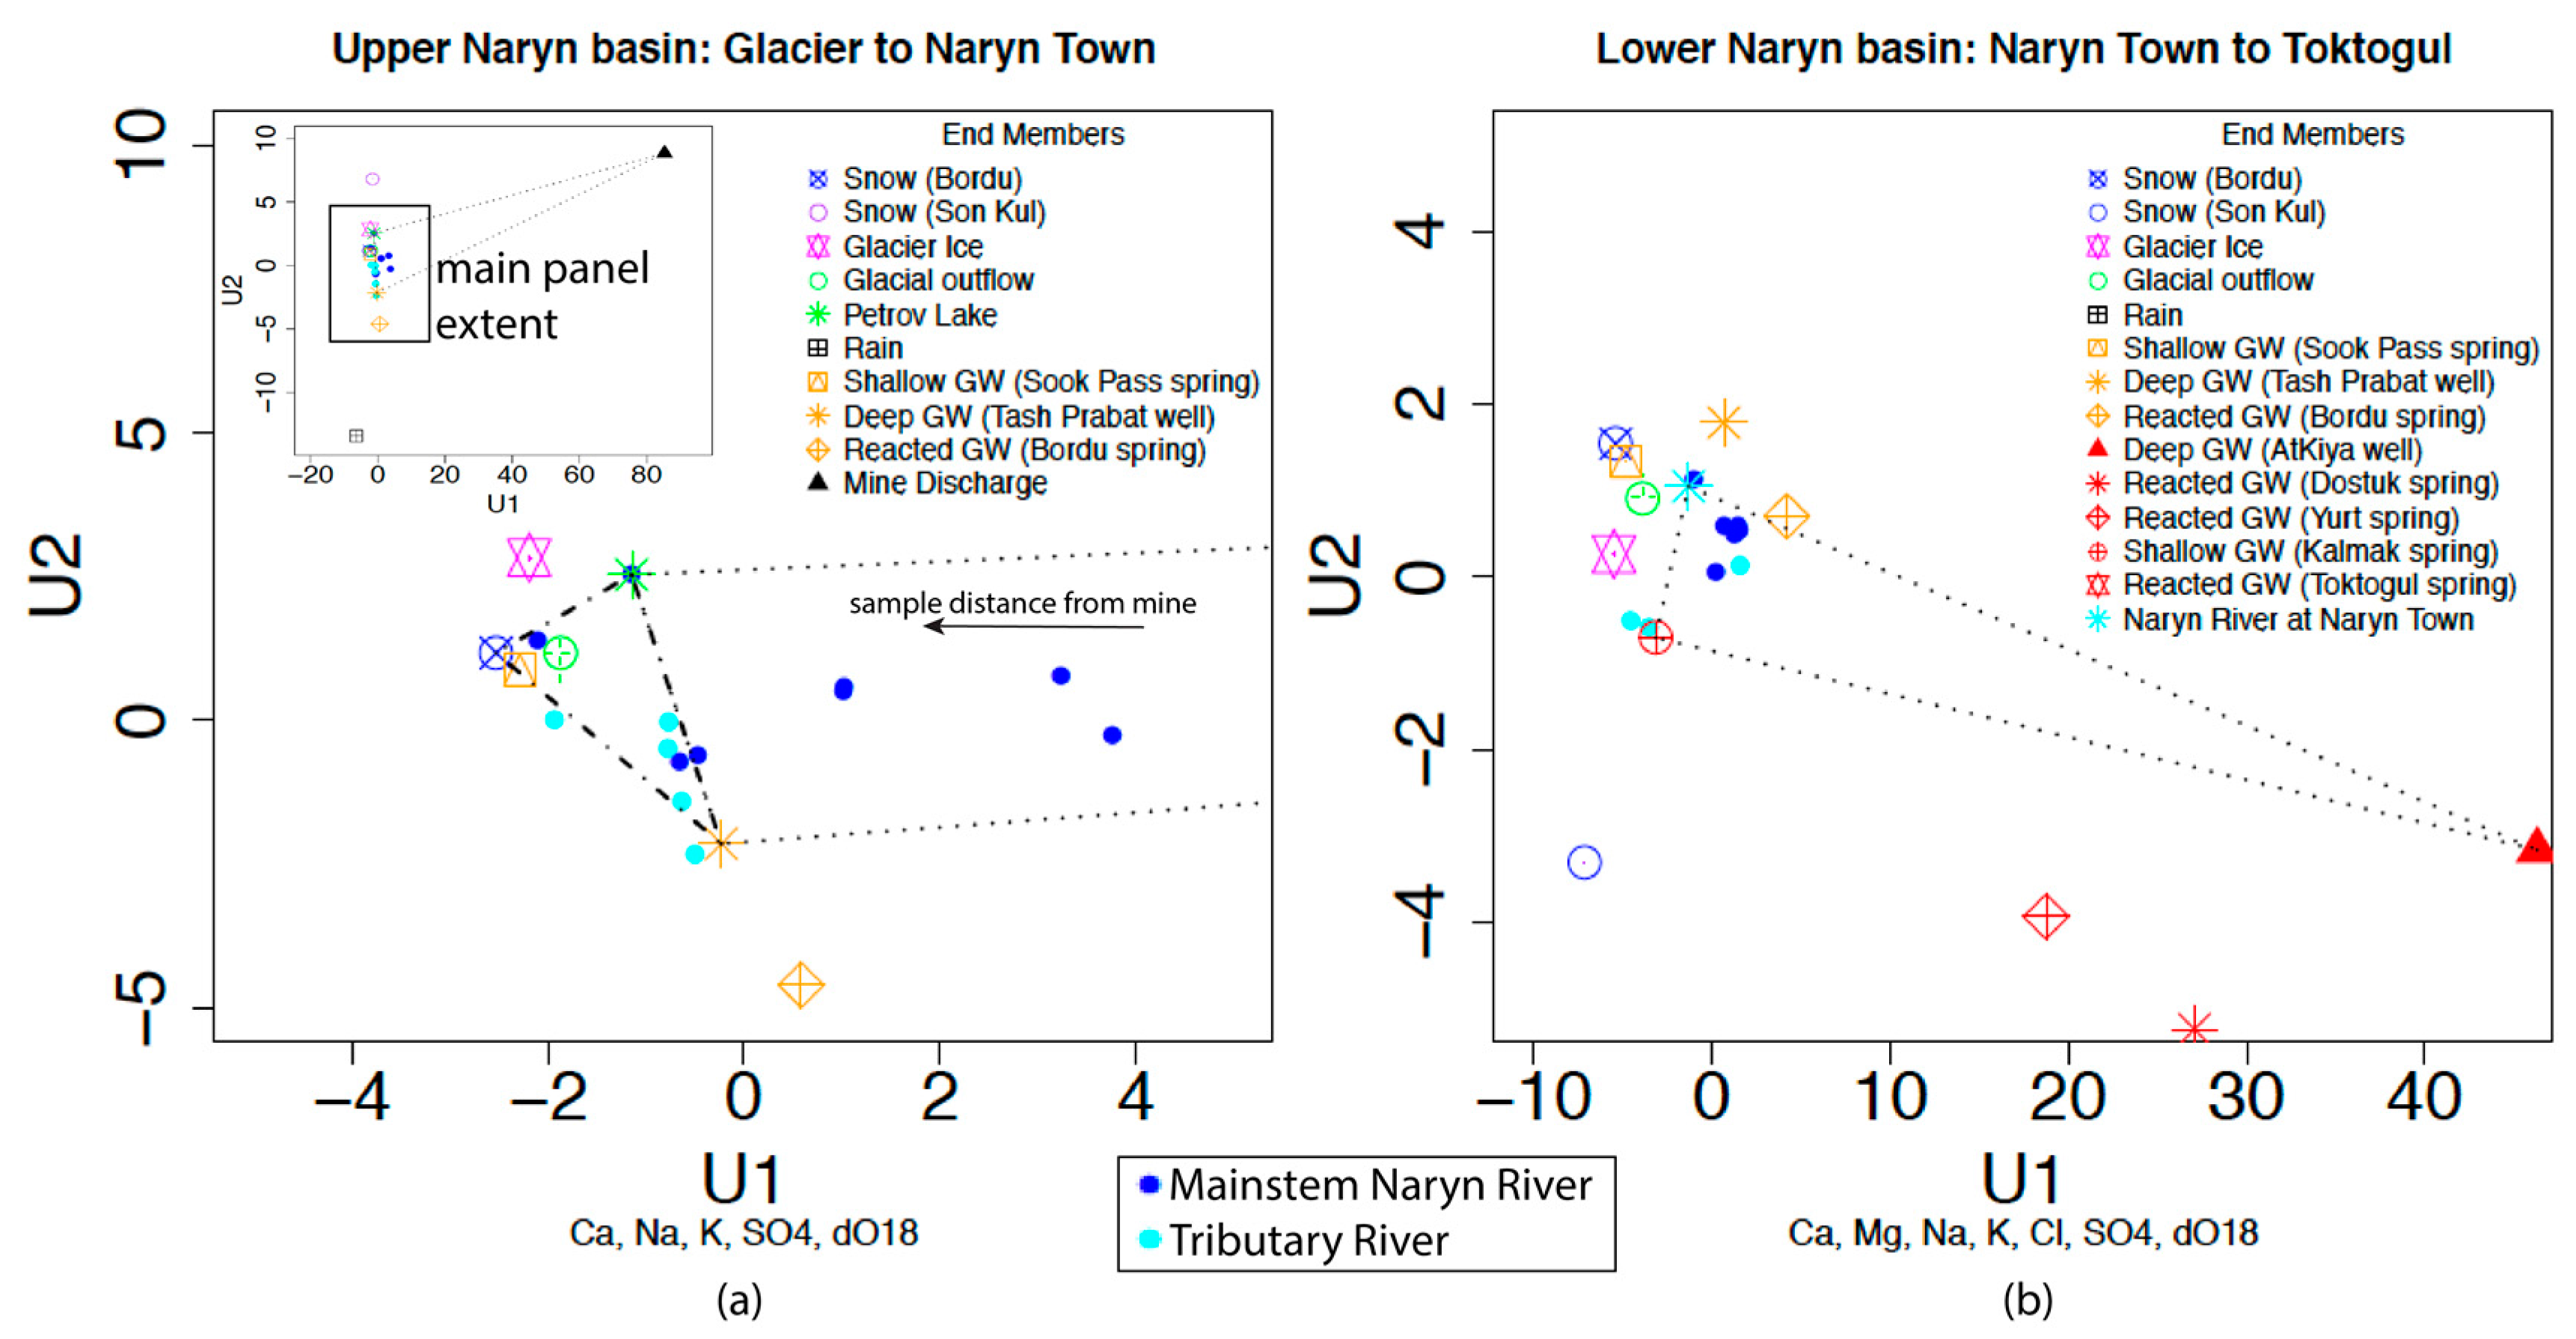
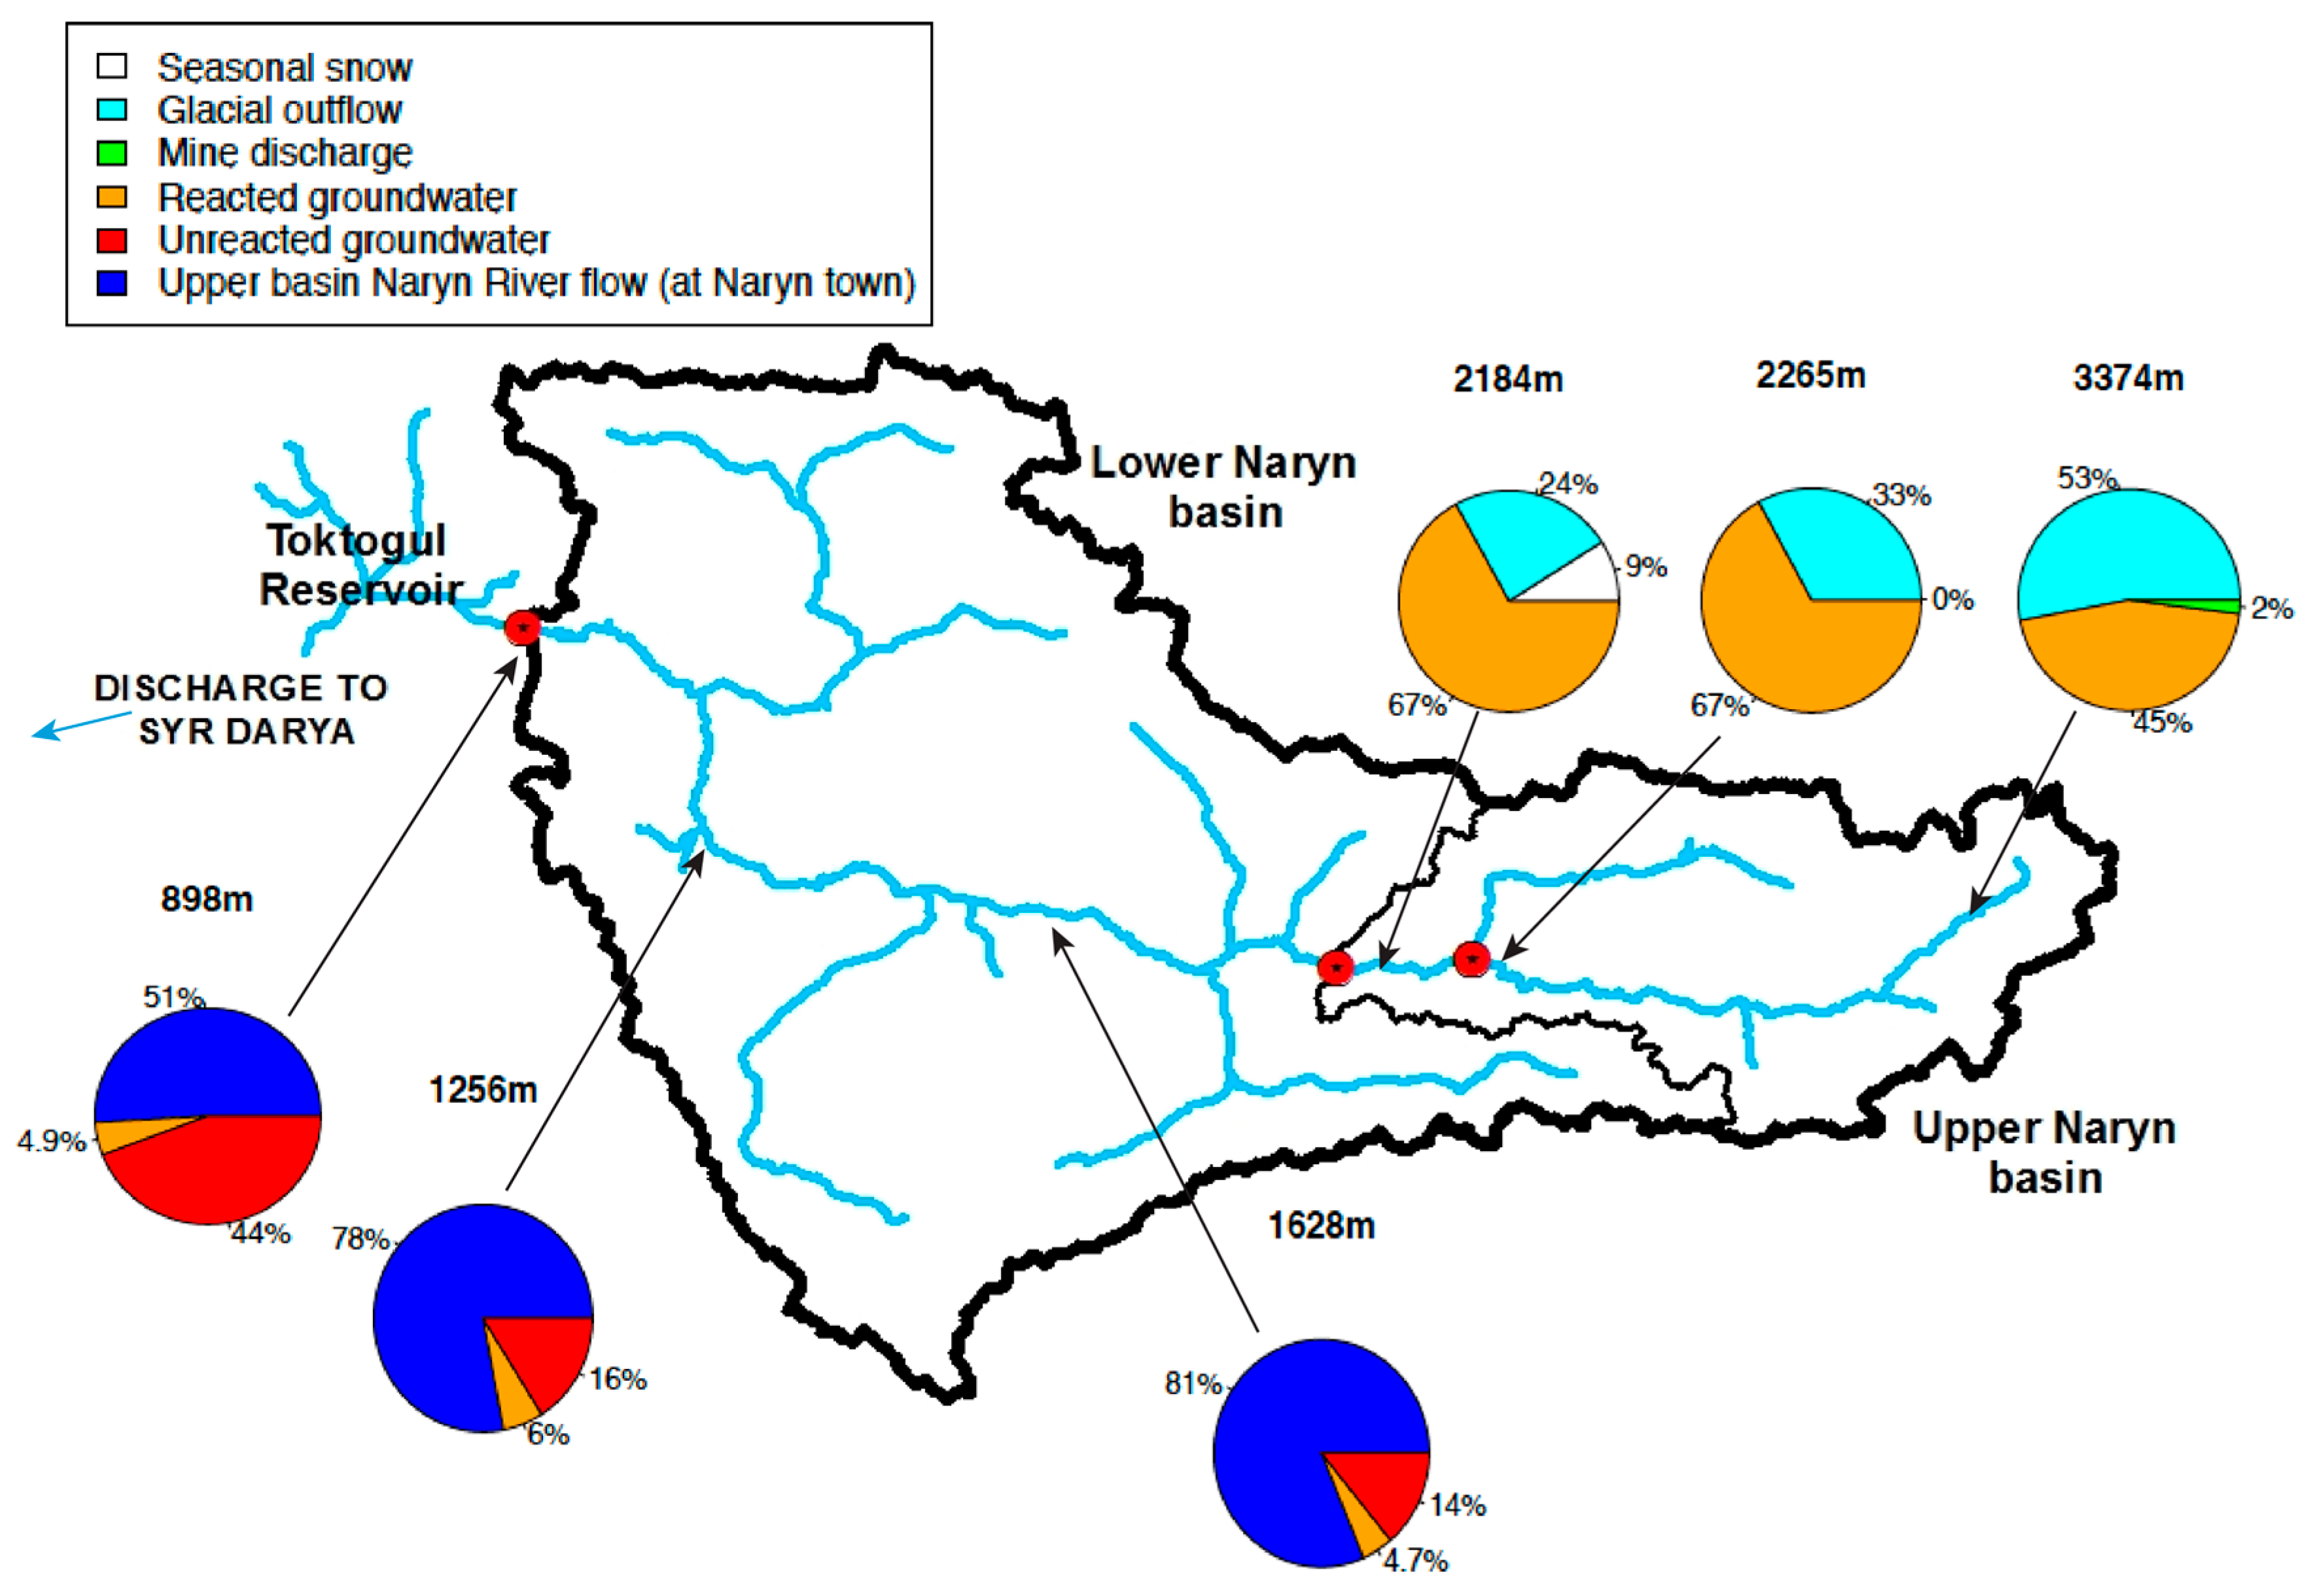
3.3. EMMA Diagnostics and Mixing Model Results

3.3.1. Upper Naryn

Diagnostic tests for conservative tracers examining the randomness of residuals between actual and projected tracers suggest that the following tracers are conservative for the Upper Naryn: Ca2+, Na+, Mg2+, K+, Cl, SO42−, δ18O [20]. Solute concentration reconstructions using all of the tracers and two principal components rendered poor concentration reconstructions for Mg2+ and Cl so these tracers were dropped from the model and re-run with only Ca2+, Na+, K+, SO42−, δ18O. With this combination of tracers, 1 dimensional space (two end members explains only 64% of the variance in the data. Two principal components (three end members) explain 94% of the chemistry variation indicating three dimensions is a more appropriate model space (Figure 5).
In the Upper Naryn, three end members were used to describe stream flow compositions for all samples, however a change in end member selection from mine discharge waters to snow is due to dilution of river water with downstream distance from the mine. Note that for the three samples influenced by the mine discharge, snow is not considered an end member. Conversely, for all other surface water samples in the Upper Naryn, mine discharge is not considered an end member.
End members were selected based on the quantitative tests described in Section 2 above. Decision-making rationale for end member selection is shown in Table 1. Percent contributions of end members to river flow across the elevation gradient are shown in Figure 6. The headwater reach is fed by Petrov Lake and deep upstream groundwater, with an influence from the mine discharge. Petrov Lake is in essence a modified version of glacial outflow because some combination of snow and ice melt, groundwater and rain—the same combination expected to produce glacial outflow—combine to run-off and fill Petrov Lake. While in Petrov Lake, ponded water has the potential to fractionate via evaporation, somewhat modifying the isotopic character of Petrov Lake as compared to glacial outflow samples that do not experience prolonged exposure to surface fluxes in an arid climate. Petrov Lake is considered a proxy to glacial outflow in the realm of source waters while acknowledging some difference between the two end members’ isotopic signatures.
Mine discharge and Upper Naryn groundwater sources are high in some ions but not in others. While these end members have relatively higher ion concentrations, meltwaters that do not travel through the subsurface have relatively lower ion concentrations. The source waters of the most upstream site (3587 m) are dominated by reacted upstream ground water and glacial outflow, with mine discharge contributions to river flow calculated to be 5% or less at all headwater sites (Figure 6).
The gradual ion dilution effect observed across the elevation gradient is echoed by the gradual movement of the more downstream river samples in the EMMA diagram away from the mine discharge position (Figure 5). After the confluence of the Chong Naryn and Kichi Naryn, river samples are sourced by snow, reacted upstream groundwater and Petrov Lake/glacial outflow. The rise of snow as an end member supports the idea of low-ion concentration dilution waters as the basin expands to include more snow covered area through to the confluence of the Chong Naryn and Kichi Naryn at the Chong Naryn gauge site (Figure 1 and Figure 3). The inflow of the more reacted Kichi Naryn tributary waters mixes with the Chong Naryn and increases some ion concentrations once again. With decreasing elevation, river sources transition from being majorly sourced by glacial outflow with groundwater as a subsidiary contributor, to the inverse just above Naryn town (Figure 6). Logically, the importance of glacial waters wanes with distance from the glacier.
Of note, the shallow “quickflow” groundwater appears to be a similarly good fit as an end member as snow in both Euclidean distances and EMMA diagrams (Figure 5). Utilizing shallow groundwater instead of snow as an end member yields a much poorer reconstruction, including an inverse relationship between modeled versus observed isotopes. Snow as an end member appears indispensable for the mainstem above Naryn town. Tracer concentration reconstructions show significant linear fits (p < 0.01 for all tracers, R2 > 0.9 except for Cl and isotopes) (Table 2), but there are some biases in the model with both under and over prediction of concentrations across tracers.

3.3.2. Lower Naryn

As with the upper basin, Ca2+, Na+, Mg2+, K+, Cl, SO42−, δ18O were deemed to be conservative as per the diagnostic tests from Hooper [10]. Also as with the Upper Naryn, two principal components were selected for analysis as they explain 94% of the data as compared to 78% variance explanation with 2 end members (1 dimension) (Figure 5).
Naturally, the Naryn River inflow from the Upper basin feeds the downstream reach and is an obvious end member selection for the Lower Naryn. While we treat the Naryn River inflow as an end member in and of itself, it is important to recall the composition of these waters derived from the Upper Naryn mixing model: 67% reacted groundwater, 24% glacial outflow and 9% snow. Meltwater plays an inherent role in this end member. Along with Naryn River inflow, deep reacted downstream groundwater and shallow lateral flow groundwater are the other end members. While we acknowledge that the deep groundwater point does not appear to be a geometrically tight fit to the EMMA diagram, the Euclidean distances for other end members ruled them out as compared to the selected point (Table 1).
The Naryn River immediately below Naryn town is naturally dominated by the Upper Naryn inflow end member at Naryn town. The system progresses to a river flow roughly equally partitioned into water coming from the Upper Naryn (51%) and downstream groundwater sources (49%) just above Toktogul Reservoir (Figure 6).
Concentration reconstructions perform soundly for the Lower Naryn samples (p < 0.01 for all tracers, R2 > 0.84 except for NO3) (Table 2) however under prediction and some minor over prediction of solutes/isotopes is observed.

3.3.3. Mixing Model Validation

Primarily mixing model validation was performed via concentration reconstructions to assess adequate performance by comparing the modeled concentrations to the observed values (Table 2).
Model validation was also afforded on a conceptual basis by contrasting model results between diurnal samples collected at (1) the Bordu River tributary site adjacent to Bordu glacier and (2) on the mainstem Naryn above Kazarman. On the Bordu River samples were collected at 6 p.m. and 6 a.m. at a site 3622 m in elevation. While isotope values are similar during both times, lower ion concentrations in the evening support the notion of the afternoon being a time when higher melt rates contribute more snow and ice melt transferred directly to the river composition relative to other times. The 6 a.m. sample has ion higher concentrations by a factor of 3–4 as compared to the 6 p.m. sample. This agrees with our general understanding of diurnal fluctuations in glacial systems where melt-sourced groundwater makes up a larger portion of river flow in the early morning, after cold nights mitigate overland flow melt inputs to the channel.
Similarly, at 1328 m in the Lower Naryn basin, samples were collected at 6 p.m. and 10 a.m. on the Naryn River upstream of Kazarman town. In contrast to the diurnal hydrologic behavior of Bordu glacial stream, the Naryn River near Kazarman shows no significant variation in chemistry between early evening and mid-morning. This is an expected result given the groundwater dominated source waters of the mainstem Naryn River at this location. The agreement between these results and what we know about glacial melt patterns and larger river systems contributes to validation of Upper and Lower Naryn mixing models.
Further validation of our two-regime hypothesis is provided by poor model performance when using all samples to derive a single source water separation for the entire glacier-to-plains study domain.

3.4. Socio-Hydro Results

Survey results indicate a common response across all communities relating to an overall decrease in water access over the last 15 years. Survey participants stated that water availability depends not on the physical water supplies but primarily on water management and infrastructure investment for both municipal and irrigation systems. Much of the water stress stems from agricultural reorganization after the Soviet collapse from large collective farm structures to individual, small private farms. This transition lies at the root of many factors contributing to current water stress across Naryn River basin communities. The deputy water manager in Naryn province summarized several factors, including:
  • Gaps in knowledge. Farmers accustomed to single task jobs associated with large scale farming practices lacked knowledge about crop rotation, irrigation techniques suitable for the climate and soils of the Naryn basin, and the complete cycle of agricultural production needed for productive small-plot farming.
  • A lack of agricultural, economic, educational and hydrologic infrastructure needed to service small-plot farmers. Farmers were ill-equipped without financing options, reliable irrigation and water distribution, and appropriate machinery. As a result, yields declined and irrigation systems deteriorated leading to greater inefficiencies.
  • Complete absence of new irrigation technologies.
  • Inadequate government support for struggling farmers due to understaffed water management offices in the region. A shortage of qualified specialists was largely attributed to low compensation.
The impacts to the agricultural sector due to the transition between large-to-small scale farming demonstrates a shift in water-human experiences from one that was nationally regulated to one where communities are largely responsible for addressing water needs. Some communities responded to water supply stress by installing groundwater wells, especially for drinking water. The survey results show that changes to water supply sources (surface water versus groundwater well) are not dependent on water availability or location within the basin. For example 2 out of 6 surveyed communities with heavier reliance on groundwater are unregulated upstream communities, Naryn and Kazarman, communities one may expect to be more heavily tied to the surface flows of the Naryn River. Water quality—not quantity—motivated the increase in groundwater use.
In contrast to these two communities’ adaptive responses, the regulated downstream communities near Toktogul preferred tributary surface water sources and traditional Soviet community based water systems such as gravity fed canals and water storage. Despite these preferences, upon relocation reservoir communities were provided with electric pumps to extract lower-lying water to service the village. These pumps were a common gripe among survey respondents, as they require continual maintenance and are notoriously prone to failure, decreasing overall reliable access to water.
A comparison of survey results shows that source of income was one of the most obvious differences over time in unregulated upstream versus regulated downstream communities. Income shifted from salaries paid by state run organizations in 2000 to small businesses, water-efficient crops and livestock in unregulated upstream communities while in regulated downstream communities income increasingly comes from labor migration and associated remittances. Downstream survey participants indicated that factors contributing to this difference include smaller land plots per household and less water supplies in regulated downstream communities, which are not enough to provide food for households.
Apart from these changes, it was obvious that even though the price of water increases in downstream communities, at some point the price of water does not really matter in light of much bigger issues faced by regulated river basin communities near Toktogul reservoir. The biggest issues in the Toktogul district are limited water availability, land and funds scarcity, and lack of trust in government, all of which were being perceived by the local communities as a direct result of communities’ relocation and hydropower development in the region in 1960s. As a result, survey respondents in regulated river basin communities indicated that there were no positive socio-economic changes within their communities in the last 15 years.
This observation is strikingly different from the survey replies in the upstream communities where survey respondents were much more optimistic in their ability to change things, turn things around, or earn enough income with existing resources. One survey response summarizes the general attitude in the upstream communities: “If there will be another dry season (no rain and less water flow in the river), we will farm a different crop, like wheat, that requires less water.” Indeed, respondents in all communities noted that the majority of farmers shifted agricultural production from water-intensive crops grown under Soviet rule (e.g., vegetables and fruits), to less water-intensive crops such as alfalfa and barley to feed livestock.
Survey respondents in all communities brought up the topic of climate change, albeit with different emphasis. Upstream communities are aware that warmer temperatures may threaten their normal agricultural production cycle, including an observed shift in peak flows that they attribute to climate changes now misaligns water arrival with the height of the growing season. The survey respondents in regulated downstream communities acknowledged climate change but it was a lesser focus as compared to their counterparts in upstream communities.
In summary the survey found that Naryn basin communities responded to changes in water supplies, water flow, hydropower and irrigation projects at various levels. The responses suggest that the overall impact in communities is a mixture of actions on mainly household, farm, private firm and organization levels. These actions include a heavier reliance of some municipalities on groundwater, shifting to less water-intensive crops and/or livestock, and transitioning from agricultural sources of income to labor migration and associated remittances.

4. Discussion

4.1. Use of EMMA over Regional Scales

Use of EMMA over a regional domain, especially in data-poor mountain environments, appears to be a useful first and best shot at hydrologic characterization in areas that we currently know little (or nothing) about. Due to the large spatial domain, there are likely many small contributions from sources that are not captured in mixing models with 3—or even 4 or 5—end members. The imperfect reconstruction of concentrations from model results implies this is the case, with under and over estimates of recreated concentrations. A perfect fit is unreasonable given that only major end members are represented in the model calculations [21]. For these types of austere environments and large-scale study domains, we can improve our understanding of major water sources to the river system by using sound methods with the little data we have. Unlike the melt dominated Naryn basin, systems with more complex hydrologic inputs may not be well suited to this approach.

4.2. Hydrologic Controls on River Flow

The physical hydrologic results suggest that the hydrology of the Naryn basin is a headwater controlled system where both snow and glacial melt waters are an important element of sustaining river flows through direct (overland flow) and indirect (groundwater recharge) channels. As compared to the more heavily studied Eastern Himalaya where monsoon rains can supply upwards of 50% of the precipitation inputs to a basin [22] the Naryn watershed and the larger Syr Darya appear especially vulnerable to climate-induced changes to snow and ice.
In the Upper Naryn, melt inputs directly contribute to surface water flows by way of both glacial outflow and snowmelt. The isotopic values for groundwater suggest that it, too, is dependent on meltwater sources for recharge, compounding meltwater’s dominance in the Upper Naryn basin. In the Lower Naryn basin, meltwater likely plays a similarly prominent role albeit indirectly. While river flow at Naryn town is an end member for the Lower Naryn mixing model, embedded in this end member is an inherent combination of melt-sourced snow, glacial outflow and groundwater. At lower elevations we observe increasing ion concentrations but similarly depleted isotopic values in groundwater, suggesting that melt-sourced groundwater may be recharged at higher elevations requiring longer, more tortuous flow paths to reach lower lying elevations.
These melt-controlled results bring to bear important questions about compounding water vulnerabilities to downstream supplies. As observed in survey responses, local awareness of shifting melt timing suggests changes to amount and timing of melt sources to river flow will affect the livelihood of agricultural workers in the Naryn basin. Forecasts for continued shifts towards earlier melt, more precipitation falling as rain than snow, and higher glacial melt rates suggest that historical patterns in melt-dominated river basins are unreliable. Indications that groundwater recharge also relies on meltwaters may exacerbate water vulnerability.
Groundwater has often been viewed as a buffer to water stress in times of drought, but what happens if this buffer wanes because it, too, is sourced by melting snow and glaciers? A time lag between changes to melt patterns/volumes and groundwater supplies will depend on residence times but may afford additional time to adapt to altered hydrologic norms. Awareness of these difficult-to-observe subsurface groundwater changes during the time lag could lead to detrimental groundwater drawdowns before effects are realized, and a precautionary approach to groundwater management is recommended. Ultimately, in a melt-dominated catchment such as the Naryn, climate change will inevitably induce changes in the timing and volume of river discharge and groundwater supplies.

4.3. Social Implications

While the physical hydrology suggests high future water vulnerability due to the dominance of melt-sourced supply, our survey findings suggest that current water stressors are mostly tied to a failed water management transition after the Soviet collapse due to either short sighted or under-resourced water management approaches. The ability for community resilience amidst water stress differs between upstream and downstream communities, both in the context of changing water regulation and climate-induced hydrologic patterns.
The unregulated communities appear to be more readily adaptable to the changes in water supplies with socio-economic adaptation including use of groundwater for municipal supplies and a shift to less water-intensive crops and/or livestock. There is a general sentiment among upstream communities that the migration to Russia and other countries is not a preferable option as a response to water stress, and many are optimistic about finding other approaches to overcome water shortage.
In contrast, regulated downstream communities look to labor migration as a greater means of income, and this is a primary adaptation strategy to the water shortage. Nonetheless, they are also pursuing some adaptation approaches including replacement of expensive and high maintenance electric water pumps with traditional gravity fed water canals. This reiterates the need for water resource infrastructure improvements to mitigate water stress mandating collaboration between local and national government programs.
On a more philosophical level, a central difference of the approach to water stress and resiliency between upstream and downstream communities based on survey responses is related to their experience and history with hydropower development. In general the “can do” approach observed in surveys of upstream communities to combat water stress through their own vision and actions is in contrast to a much less proactive mentality documented in the relocated communities around Toktogul Reservoir. A sense of victim-hood incurred during relocation can be inferred from some survey responses, which could influence is a perception that water access is owed to them by the larger organization; this mentality may impede creativity and proactivity for independently problem solving water access issues, ultimately exacerbating water vulnerabilities and mitigating resilience in the downstream communities.

5. Conclusions

Current water stress for communities in the study domain is closely linked to water management practices and distribution infrastructure. The clumsy transition from large-scale agricultural practices during the Soviet era to individualized small-plot farming now in place has led to unreliable water access in the region despite current sufficient supply. The importance of melt water supplies to both surface and groundwater suggests increased future water stress across the region. Over reliance on groundwater given the uncertain buffer provided by groundwater reserves brings about additional water vulnerability and risk, especially given the area’s reliance on agriculture for human livelihood. Adaptation strategies will likely require a two-pronged approach addressing both infrastructure and management as well as increasing community resilience by diversifying income sources and farming practices in light of long term forecasts for changes to melt inputs in the context of a changing climate.

Supplementary Materials

The following are available online at www.mdpi.com/2073-4441/9/5/325/s1; Figure S1: Modeled vs. observed concentration reconstruction plots for hydrochemical variables; Table S1: Example community survey questions and responses.

Acknowledgments

This research, including publishing costs, was supported by the United States Agency for International Development (USAID) funded Contributions to High Asia Runoff from Ice and Snow (CHARIS) project housed at the National Snow and Ice Data Center and the University of Colorado-Boulder.

Author Contributions

Alice F. Hill and Alana M. Wilson conceived, designed, conducted and analyzed the physical hydrology aspects of this research; Cholpon K. Minbaeva conceived, designed, conducted and analyzed the socio-hydro aspects of this research; Rysbek Satylkanov organized and facilitated all field work, and contributed background site information summarized in this paper. Alice F. Hill, Alana M. Wilson and Cholpon K. Minbaeva wrote the paper.

Conflicts of Interest

The authors declare no conflict of interest. The founding sponsors had no role in the design of the study; in the collection, analyses, or interpretation of data; in the writing of the manuscript, and in the decision to publish the results.

References

  1. Barnett, T.P.; Adam, J.C.; Lettenmaier, D.P. Potential impacts of a warming climate on water availability in snow-dominated regions. Nature 2005, 438, 303–309. [Google Scholar] [CrossRef] [PubMed]
  2. Hennessy, K.B.; Fitzharris, B.; Bates, B.C.; Harvey, N.; Howden, M.; Hughes, L.; Salinger, J.; Warrick, R. Contribution of Working Group II to the Fourth Assessment Report of the Intergovernmental Panel on Climate Change. In Climate Change 2007: Impacts, Adaptation and Vulnerability; Parry, M., Canziani, O., Palutikof, J., van der Linden, P., Hanson, C., Eds.; Cambridge University Press: Cambridge, UK, 2007. [Google Scholar]
  3. Immerzeel, W.W.; van Beek, L.P.H.; Bierkens, M.F.P. Climate Change Will Affect the Asian Water Towers. Science 2010, 328, 1382. [Google Scholar] [CrossRef] [PubMed]
  4. Wilson, A.M.; Gladfelter, S.; Williams, M.W.; Shahi, S.; Baral, P.; Armstrong, R.; Racoviteanu, A. High Asia: The International Dynamics of Climate Change and Water Security. J. Asian Stud. 2017. [Google Scholar] [CrossRef]
  5. EurasiaNet. Kyrgyzstan: Russia Pushing to Get Dam Money Back. Available online: http://www.eurasianet.org/node/80181 (accessed on 17 August 2016).
  6. Gleick, P.H.; Heberger, M. Water Conflict Chronology. In The World’s Water; Gleick, P.H., Ed.; Island Press: Washington, DC, USA, 2014; pp. 173–219. [Google Scholar]
  7. The Economist. Mi CASA no es tu CASA. Available online: http://www.economist.com/news/asia/21608806-plan-export-electricity-looks-cursed-mi-casa-no-es-tu-casa (accessed on 26 June 2014).
  8. The Economist. Gold in the Hills: Attitudes towards Foreign Investors Hold a Troubled Country Back. Available online: http://www.economist.com/news/asia/21573615-attitudes-towards-foreign-investors-hold-troubled-country-back-gold-hills (accessed on 16 May 2013).
  9. Carey, M.; Molden, O.C.; Rasmussen, M.B.; Jackson, M.; Nolin, A.W.; Mark, B.G. Impacts of Glacier Recession and Declining Meltwater on Mountain Societies. Ann. Am. Assoc. Geogr. 2017, 107, 350–359. [Google Scholar] [CrossRef]
  10. Painter, T.H.; Rittger, K.; McKenzie, C.; Slaughter, P.; Davis, R.E.; Dozier, J. Retrieval of subpixel snow covered area, grain size, and albedo from MODIS. Remote Sens. Environ. 2009, 113, 868–879. [Google Scholar] [CrossRef]
  11. Rittger, K.; Painter, T.H.; Dozier, J. Assessment of methods for mapping snow cover from MODIS. Adv. Water Resour. 2013, 51, 367–380. [Google Scholar] [CrossRef]
  12. Pfeffer, W.T.; Arendt, A.A.; Bliss, A.; Bolch, T.; Cogley, J.G.; Gardner, A.S.; Sharp, M.J. The Randolph Glacier Inventory: A globally complete inventory of glaciers. J. Glaciol. 2014, 60, 537–552. [Google Scholar] [CrossRef]
  13. Raup, B.; Racoviteanu, A.; Khalsa, S.J.S.; Helm, C.; Armstrong, R.; Arnaud, Y. The GLIMS geospatial glacier database: A new tool for studying glacier change. Glob. Planet. Chang. 2007, 56, 101–110. [Google Scholar] [CrossRef]
  14. Christophersen, N.; Hooper, R.P. Multivariate analysis of stream water chemical data: The use of principal components analysis for the end-member mixing problem. Water Resour. Res. 1992, 28, 99–107. [Google Scholar] [CrossRef]
  15. Liu, F.J.; Williams, M.W.; Caine, N. Source Waters and Flow Paths in Alpine Catchment, Colorado Front Range, United States. Water Resour. Res. 2004, 40. [Google Scholar] [CrossRef]
  16. Wilson, A.; Williams, M.W.; Kayastha, R.B.; Racoviteanu, A. Use of a hydrologic mixing model to examine the roles of meltwater, precipitation and groundwater in the Langtang River basin, Nepal. Ann. Glaciol. 2016. [Google Scholar] [CrossRef]
  17. Cowie, R.M.; Knowles, J.F.; Dailey, K.R.; Williams, M.W.; Mills, T.J.; Molotch, N.P. Sources of streamflow along a headwater catchment elevational gradient. J. Hydrol. 2017. [Google Scholar] [CrossRef]
  18. Hooper, R.P.; Christophersen, N.; Peters, N.E. Modelling Streamwater Chemistry as a Mixture of Soilwater End-Members—An Application to the Panola Mountain Catchment, Georgia, USA. J. Hydrol. 1990, 116, 321–343. [Google Scholar] [CrossRef]
  19. Hooper, R.P. Diagnostic Tools for Mixing Models of Stream Water Chemistry. Water Resour. Res. 2003, 39. [Google Scholar] [CrossRef]
  20. Liu, F.; Parmenter, R.; Brooks, P.D.; Conklin, M.H.; Bales, R.C. Seasonal and interannual variation of streamflow pathways and biogeochemical implications in semi-arid, forested catchments in Valles Caldera, New Mexico. Ecohydrology 2008, 1, 239–252. [Google Scholar] [CrossRef]
  21. Liu, F.; Conklin, M.H.; Shaw, G.D. Insights into hydrologic and hydrochemical processes based on concentration-discharge and end-member mixing analyses in the mid-Merced River Basin, Sierra Nevada, California. Water Resour. Res. 2017, 53, 832–850. [Google Scholar] [CrossRef]
  22. Kundzewicz, Z.W.; Nohara, D.; Tong, J.; Oki, T.; Buda, S.; Takeuchi, K. Discharge of large Asian rivers—Observations and projections. Quat. Int. 2009, 208, 4–10. [Google Scholar] [CrossRef]
Figure 1. Water sampling, surveyed communities and stream gauge locations across the glacier-to-plains study domain. The Upper Naryn basin is defined upstream of the Naryn town gauge, and the Naryn River and major tributary alignments are shown (white line). Top right inset: Glacial headwater source water sampling locations. Top left inset: Naryn basin study domain location within the Central Asian region.
Water 09 00325 g001
Figure 2. Melt-dominated hydrographs at the three gauge locations in the study domain. (a) Time series of flow record demonstrating inter-annual variability and (b) the daily average of the four-year flow record over 2012–2015. Top right inset: drainage area outlines correspond to the color of each hydrograph.
Water 09 00325 g002
Figure 3. The Upper Naryn basin receives substantial snow cover and houses the vast majority of glaciated systems in the study domain, while the lower elevation Lower Naryn basin receives less. Snow probability is defined as the likelihood that the pixel will be snow covered on any given day, and is based on all clear sky MODIS acquisitions from 2001 to 2014. MOD10A1 snow cover data provided by Karl Rittger.
Water 09 00325 g003
Figure 4. Hydrochemical trends over the study domain elevation gradient. (a) Naryn River δ18O values show a remarkably consistent melt source water signal, and all waters are notably different than rain; (b) Ca2+ and (c) SO42− concentrations in groundwater increase with decreased elevation indicating longer flow paths and/or residence times. Mine discharge is elevated in some ions (c) but not in others (b).
Water 09 00325 g004
Figure 5. EMMA diagrams including mainstem Naryn River and tributary samples as well as all possible end members. (a) Upper Naryn basin EMMA diagram shows the gradual dilution of mine discharge waters with increasing distance from the mine; (b) While deep groundwater does not appear to be a good geometric fit in the Lower Naryn basin EMMA diagram, it is selected due to other diagnostics (Table 1).
Water 09 00325 g005
Figure 6. Source water separation results across the 440 km study site show the importance of both meltwater and melt-sourced groundwater to river flow. Direct contributions from glacier melt wane with distance from snout.
Water 09 00325 g006
Table 1. Methodology and rationale for end member selection for Upper Naryn and Lower Naryn EMMA models.
ReachTracers UsedEnd MembersSample Used to Characterize End MemberEnd Member Selection Rationale
UPSTREAM: From glacier snout to Naryn townCa2+, Na+, K+, SO42−, δ18OMine dischargeMine discharge tributaryClear explanatory power regarding chemical progression of upstream samples
Seasonal snowBordu snowWell positioned to constrain samples in EMMA diagram, acceptable Euclidean distances but important for concentration reconstructions
Glacial outflowPetrov LakeWell positioned to constrain samples in EMMA diagram, Low Euclidean distances
Reacted upstream groundwaterTash Prabat groundwater wellWell positioned to constrain samples in EMMA diagram, Low Euclidean distances
DOWNSTREAM: From Naryn town to Toktogul ReservoirCa2+, Mg2+, Na+, K+, Cl, SO42−, δ18OUpper Naryn RiverNaryn River above Naryn townWell positioned to constrain samples in EMMA diagram, Low Euclidean distances, an obvious source water to downstream flow
Reacted downstream groundwaterAt Kiya wellLow Euclidean distances, EMMA diagram location encapsulates samples despite not being a “tight” fit.
Unreacted (lateral flow) groundwaterKalmak springWell positioned to constrain samples in EMMA diagram, Low Euclidean distances
Table 2. Summary of R2 for modeled vs. observed concentrations based on concentration reconstructions for model validation. All reconstructions yield significant relationships (p < 0.01). Reconstruction plots provided in supplementary information.
AnalyteCa2+Mg2+Na+K+ClNO3SO42−δ18OδD
Downstream Naryn basin model0.920.430.950.950.680.950.90.780.77
Upstream Naryn basin model0.840.840.960.830.940.790.90.920.85

