Water Molecules in a Carbon Nanotube under an Applied Electric Field at Various Temperatures and Pressures

1
Department of Mechanical Engineering, Faculty of Engineering, Brawijaya University, Jl. MT Haryono 167, Malang 65145, Indonesia
2
Graduate School of Science and Technology, Keio University, 3-14-1 Hiyoshi, Kohoku-ku, Yokohama 223-8522, Japan
3
Department of Mechanical Engineering, Keio University, 3-14-1 Hiyoshi, Kohoku-ku, Yokohama 223-8522, Japan
*
Author to whom correspondence should be addressed.
Water 2017, 9(7), 473; https://doi.org/10.3390/w9070473
Submission received: 28 February 2017
/
Revised: 9 June 2017
/
Accepted: 23 June 2017
/
Published: 28 June 2017
(This article belongs to the Special Issue Electrohydrodynamic Liquid Bridges and Electrified Water)
Abstract
:Water confined in carbon nanotubes (CNTs) under the influence of an electric field exhibits behavior different to that of bulk water. Such behavior is fascinating from a nanoscience point of view and has potential application in nanotechnology. Using molecular dynamics simulations, we investigate the structure of water molecules in an CNT, under an electric field at various temperatures and pressures. In the absence of an electric field, water in the CNT has an ordered (solid-like) structure at temperatures of 200 K and 250 K. The solid-like structure of water at these low temperatures exhibits ferroelectric properties. At 300 K, the structure of water is solid-like or disordered (liquid-like), i.e., an unstable structure. This indicates that a melting point occurs at around these conditions. Increasing the pressure to 10 MPa does not change the structure at 300 K. At 350 K, water is completely melted and has only a disordered structure. Under an applied electric field of 1 V/nm, water forms a solid-like structure at all simulation temperatures up to 350 K. This suggests that the electric field induces a phase transition from liquid to ice-nanotube, at temperatures as high as 350 K. The structure of the ice-nanotube under an applied electric field differs from that formed in the absence of an electric field at low temperature. The electrostatic interaction within the ice-nanotube under an electric field is stronger than that in the absence of an electric field.
1. Introduction
The ability of carbon nanotubes (CNTs) to transport water very fast [1,2,3,4] has led to huge recent interest in CNT-based nanofluidics. However, many important issues still need to be clarified. From a hydrodynamics aspect, the mechanism of the enhanced fluid flow through CNTs remains unclear [5,6]. Water exhibits different physical properties when confined in nanoscale space compared with those in the bulk, and this has not yet been explored in detail [7,8,9,10,11]. The ability of CNTs to deliver fluid allows them to be applied in nanofluidic devices such as separation membranes [12,13,14,15] and nano pumps [16,17,18].
Water molecules are polar, so are easily influenced by an electric field. The combined effects of nanoscale confinement and an applied electric field induce interesting properties in water [19,20,21,22,23,24,25]. An applied electric field strengthens the hydrogen bonding of water molecules between the two plates, and induces electrofreezing when the field direction is parallel to the confining wall [19,25]. In contrast, an applied electric field perpendicular to the confining wall disrupts hydrogen bonding, causing melting of the ice [22,23]. Water in nanotubes under the influence of an electric field is of interest from a nanoscience viewpoint and is also important in biophysics. Different ion concentrations across a cell membrane can induce a strong electric field in the cell channel [26,27,28]. Studying water in CNTs under an electric field could further our understanding of the behavior of water in the cell channel [29]. The effect of an electric field on water in CNTs is also relevant for nanotechnology-based applications such as nano pumping [18,30,31,32] and desalination [33].
The dipole moments of water molecules align parallel to the direction of an applied electric field. The change in the molecular orientation of water within a CNT then causes its anomalous behavior. The applied electric field shifts the equilibrium state toward the condition in which water molecules favor filling a CNT [34]. A similar result has been demonstrated in larger CNTs, where the occupancy of water molecules in the CNTs increases with an electric field, implying a preference of water to fill the CNTs [35]. The preference of water to fill CNTs under an electric field can also result in a separation effect on water–alcohol solution [36,37]. The uniform molecular orientation under an electric field forms ordered structures in the CNTs [24,35,38,39]. These structures can be helical or otherwise, depending on the CNT diameter and electric field strength [35]. The electric field induces liquid-to-solid phase transition in CNTs under ambient conditions [24,35,38,39].
In the current study, we perform molecular dynamics (MD) simulations to investigate the structure of water molecules in an CNT, in the presence and absence of an electric field at various temperatures and pressures. To mimic a membrane, the simulation consists of a CNT, graphene sheets, and reservoirs at both ends of the CNT. This configuration differs from that used in previous studies on finite length [38,39] and infinite length [24] CNTs. An applied electric field of 1 V/nm induces the formation of an ordered structure (solid-like structure) in the CNT, at all simulation temperatures and pressures. The applied electric field causes an ice-like structure to form at temperature as high as 350 K and pressure of 0.1 MPa. In the absence of an applied electric field and at temperatures of 200 K and 250 K, water in the CNT also forms an ordered structure. The structure in the absence of an electric field differs from that in the presence of the electric field. The electrostatic interaction within the ordered structure under an electric field is stronger than that in the absence of an electric field.
2. Method
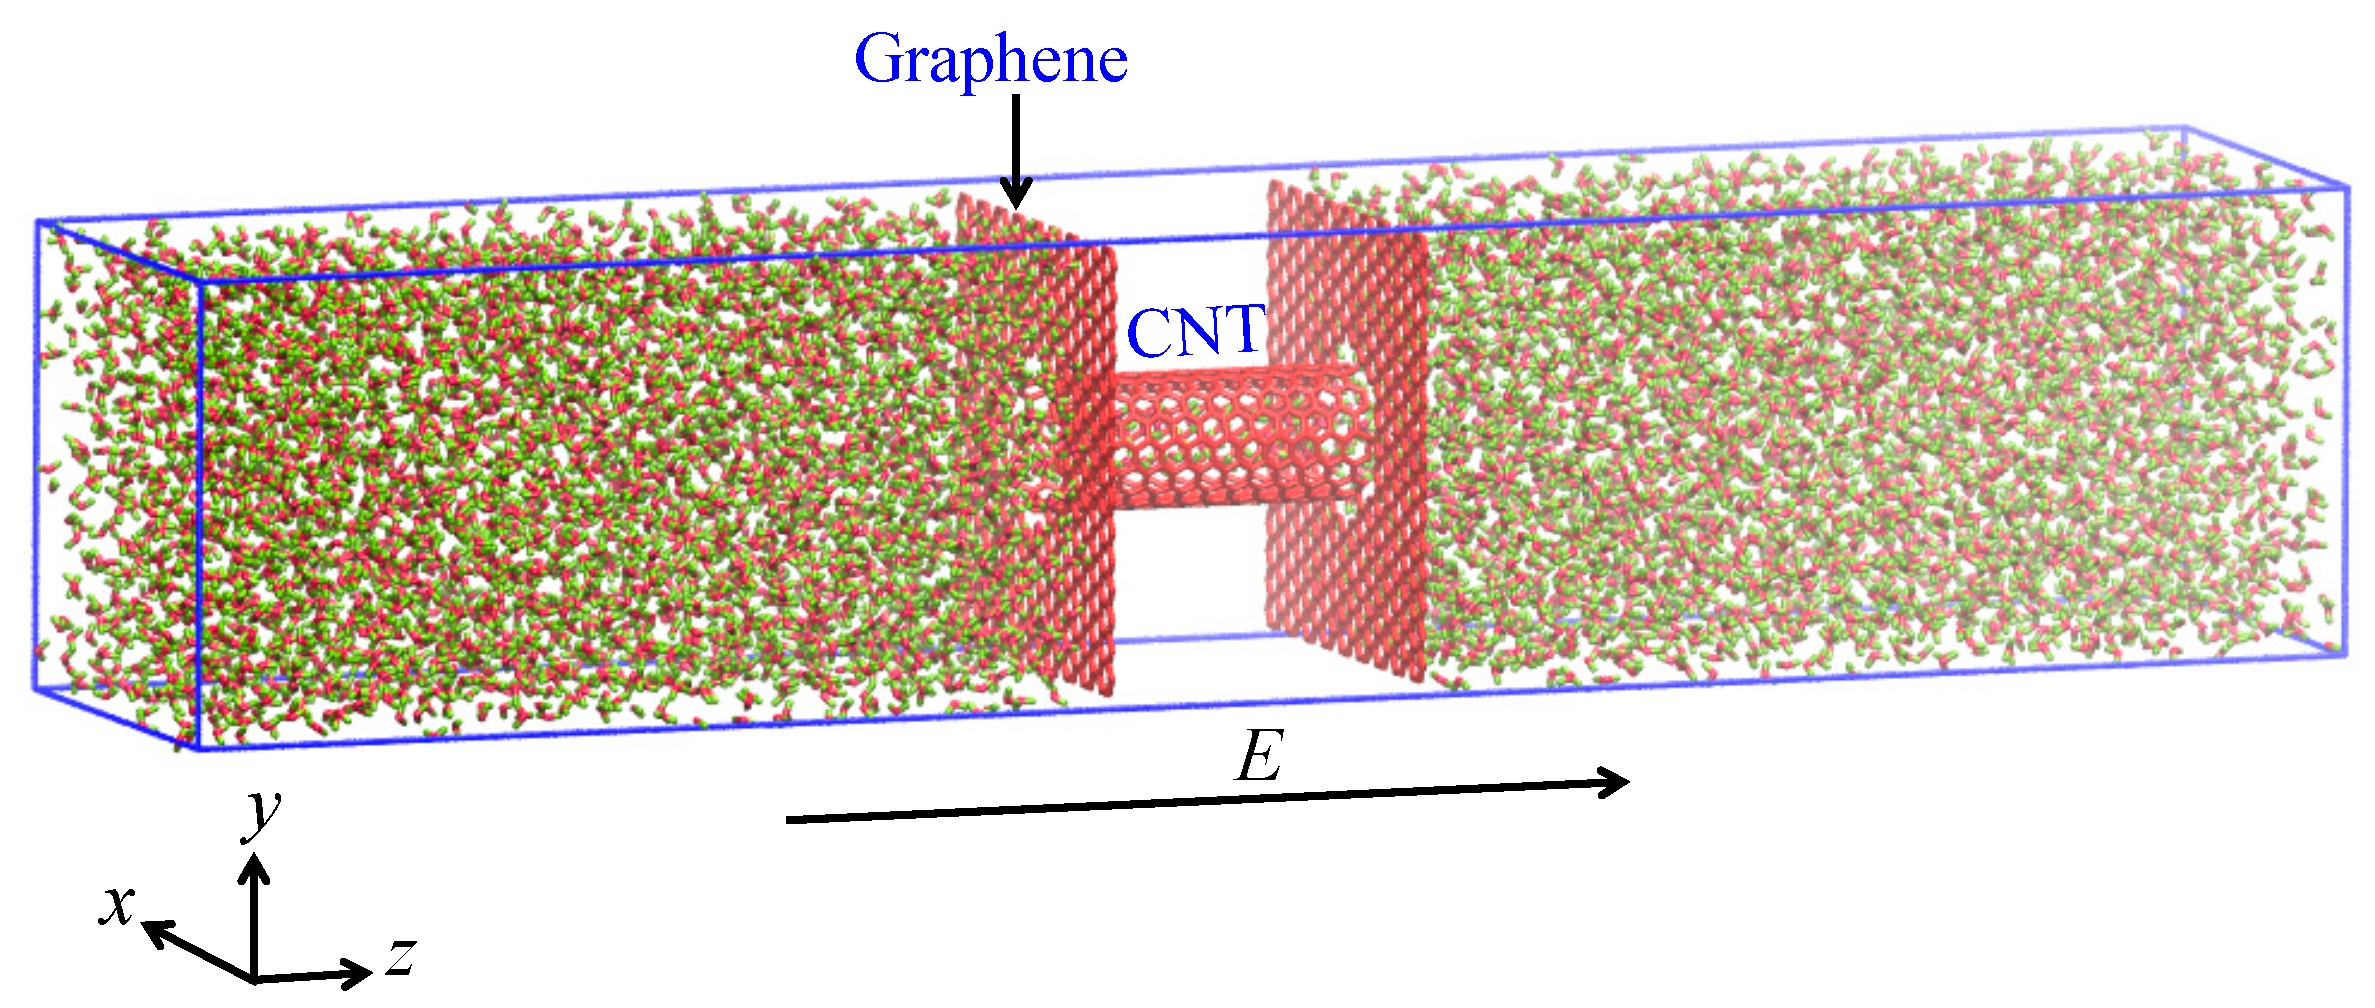
The configuration for the MD simulation consisted of an CNT embedded between two graphene sheets. Water reservoirs were located on the sides of sheets opposite the CNT (Figure 1). The configuration was similar to that used in our previous study [35,36]. The length of the CNT was 2.95 nm and the diameter was 1.08 nm. As the initial condition, each reservoir was filled with 4000 water molecules. All components were placed in a rectangular box that was subjected to periodic boundary conditions in all directions (x, y, and z-axes). The simulation box was 3.83 nm in width and 3.69 nm in height. After equilibration, the length of the simulation box was about 20 nm.
The SPC (simple point charge) model was used for the water molecule [40]. The Lennard–Jones (LJ) parameters for the oxygen atom of water were nm and kJ/mol. The corresponding parameters for the carbon atom of the CNT were nm and kJ/mol. The LJ parameters for the interactions of different atoms were calculated using the combination rule and . A homogeneous 1 V/nm electric field (E) was applied to the axial direction of the CNT, which is in the positive direction of the z-axis. We also performed simulations with the TIP4P water model to clarify dependence of simulation results on water models. The simulation conditions were the same as those carried out with the SPC model.
The MD simulation was carried out using the Gromacs 4.5.5 software package (University of Groningen, Netherlands) [41]. The van der Waals interactions were cut off at 1.5 nm. Electrostatics were treated using the particle mesh Ewald (PME) method [42], with a real space cut off set to 1.5 nm. The SHAKE algorithm [43] was employed to fix the chemical bonds between the atoms of a water molecule. The CNT and graphene sheets were made rigid by maintaining the length and angle of chemical bonds as constant. The simulation was performed with NLLPT, where the constant pressure (P) in the z-direction was maintained using the Parrinello–Rahman technique [44]. The temperature (T) was kept constant using the Nos–Hoover coupling scheme, with a time constant of 0.4 ps [45,46]. The simulations were carried out at various temperatures at constant pressure, i.e., 200 K, 250 K, 300 K, and 350 K at 0.1 MPa, and at various pressures at constant temperature, i.e., 0.1 MPa, 1 MPa, and 10 MPa at 300 K. The time step was set to 2 fs, and the simulation time was 25 ns. The simulation reached equilibrium within 2 ns, and analysis data was taken after 3 ns.
3. Results and Discussion
3.1. Water Structure
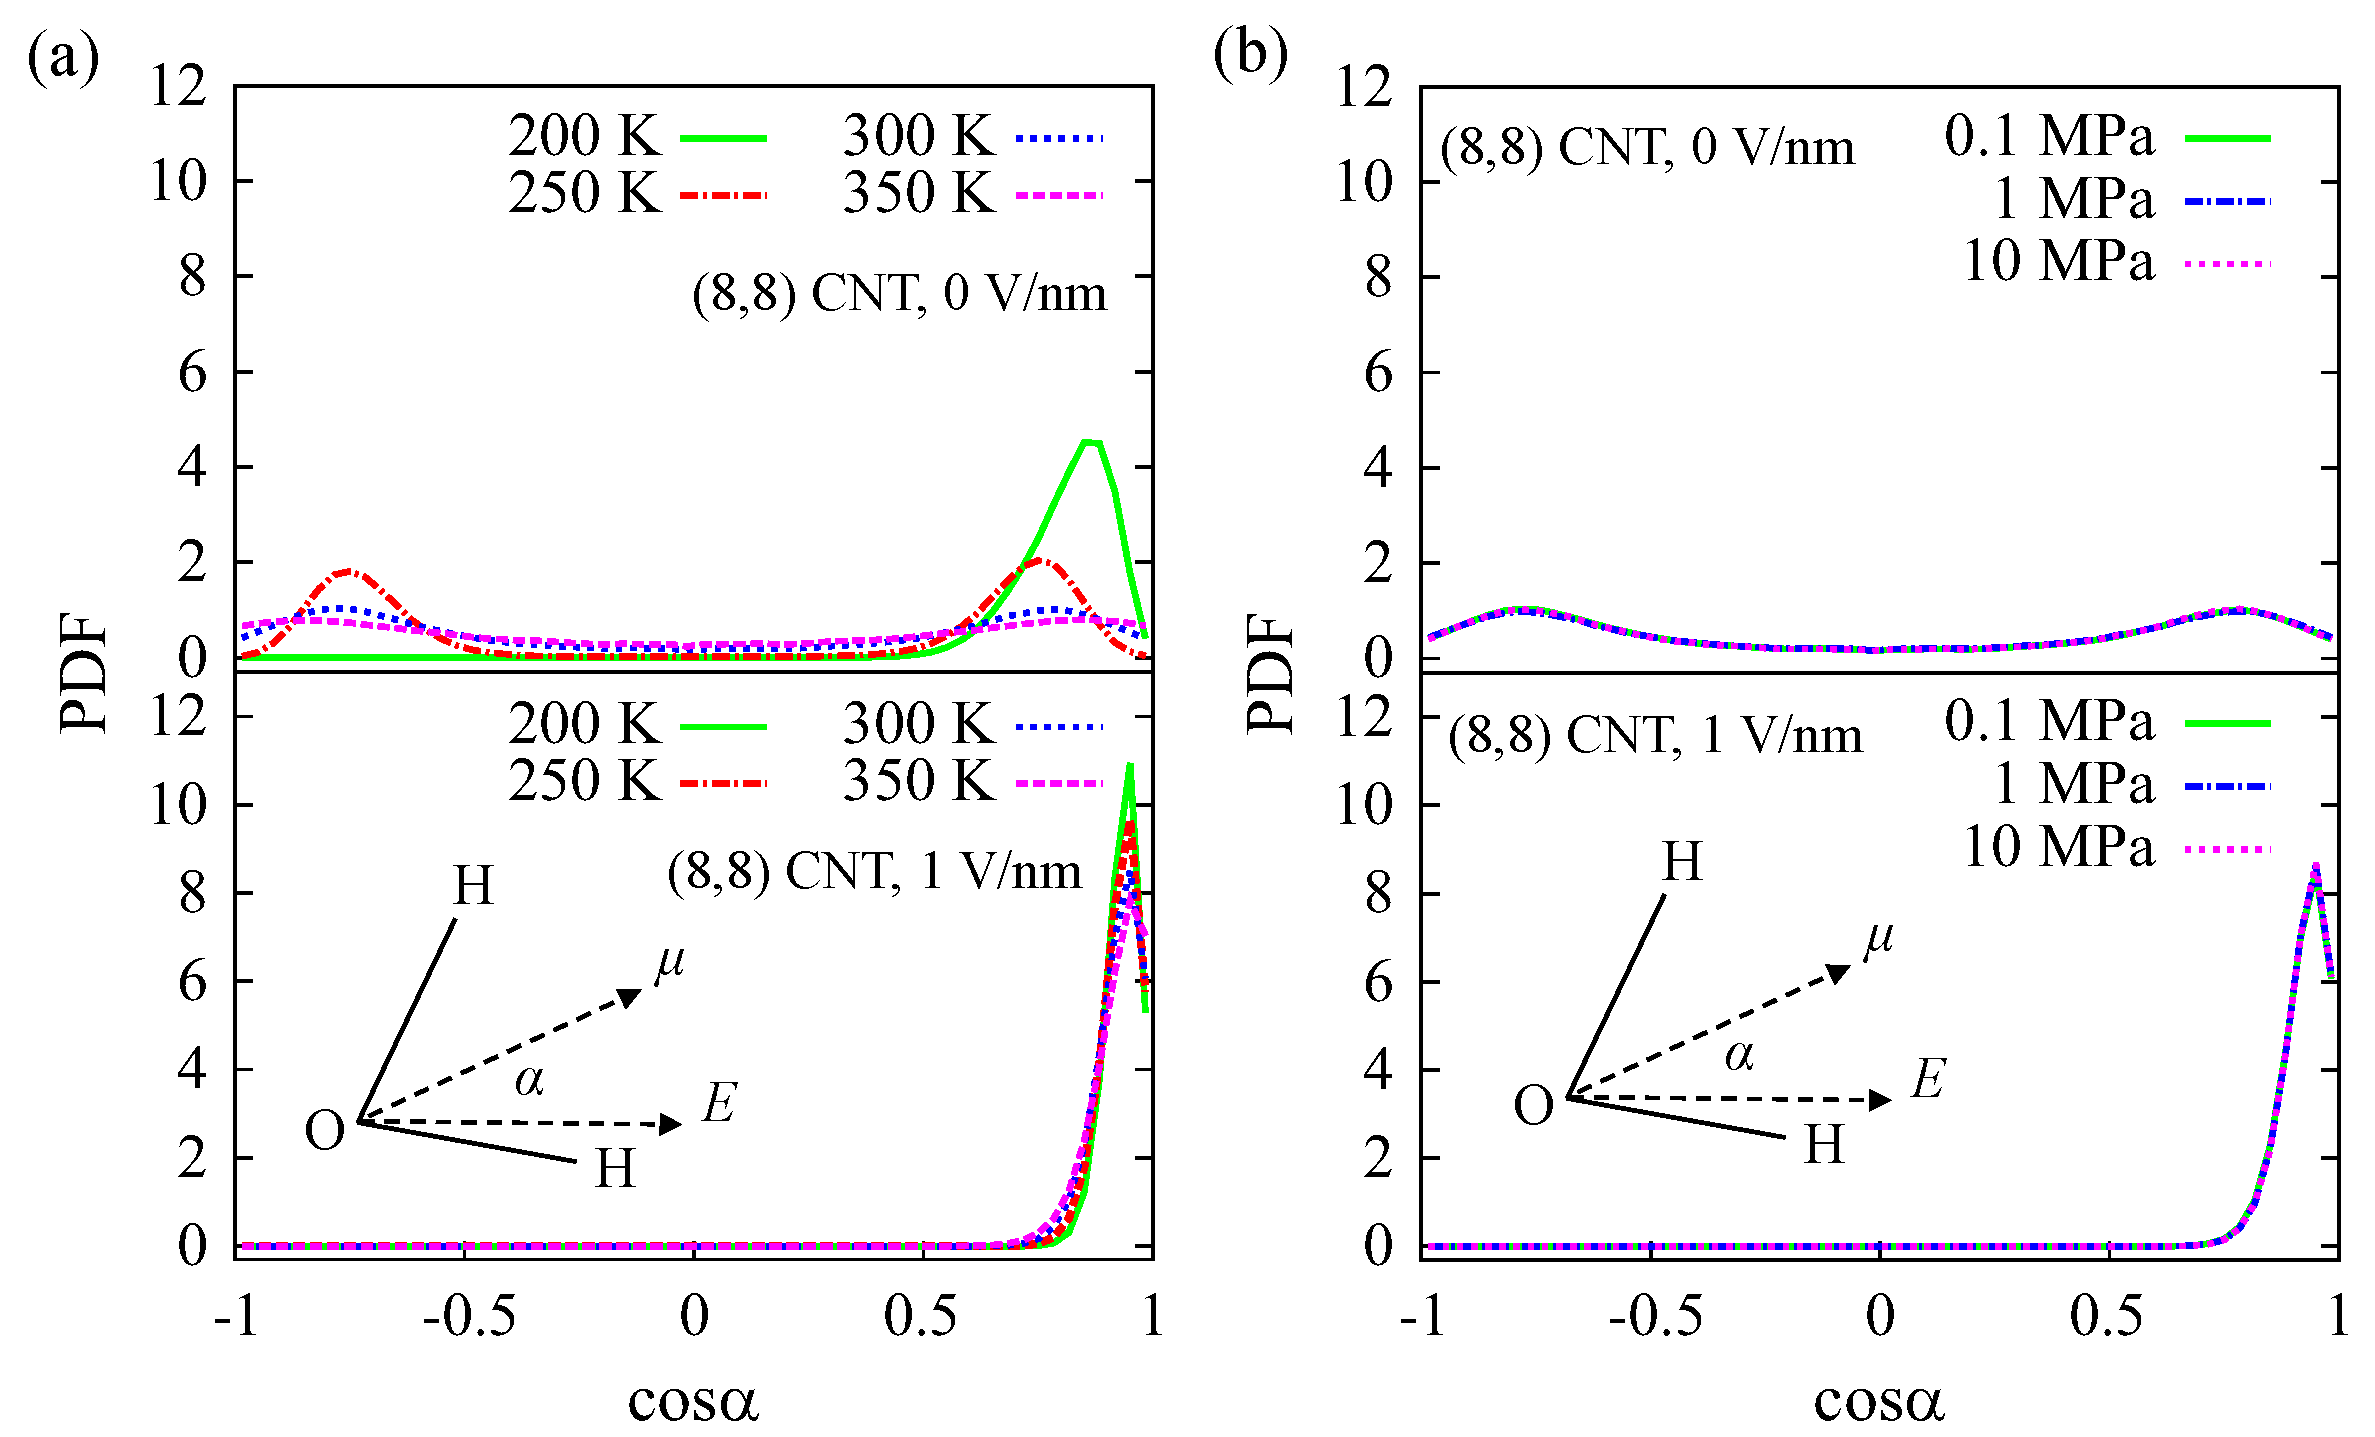
An electric field produces torque on water molecules because of the electric forces acting on the positively charged hydrogen atoms and negatively charged oxygen atom. As a result, the electric field changes the molecular orientation of water (see Figure 2). Figure 2a shows the probability distribution functions (PDFs) of water orientation in an CNT at 200 K to 350 K, ambient pressure of 0.1 MPa, and under electric fields of 0 V/nm and 1 V/nm. The orientation is represented with the angle between the vectors of the dipole moment and the electric field. At 0 V/nm and 250 K to 350 K, water molecules tend to show two peaks in the PDFs, at and . The peaks are higher at the lower temperature of 250 K than those at the higher temperatures of 300 K and 350 K. The two peaks mean at conditions of 0 V/nm and 250 K to 350 K, water in the CNT tends to having two dipole moment orientations, i.e., on the positive z-axis and the negative z-axis, which are opposite to each other, as shown in a previous study at 300 K [47]. When the temperature decreases at 200 K, the distribution consists of a single orientation with one peak at , instead of the two peaks observed at higher temperature. Water molecules have a uniform orientation in the CNT at 200 K, i.e., parallel to the CNT axis. Under an applied electric field of 1 V/nm, water molecules in the CNT have a uniform orientation at all simulated temperature conditions. The orientation of the dipole moment of water is restrained parallel to the direction of the electric field. Figure 2b shows the orientation of water molecules in an CNT at various pressures of 0.1 MPa to 10 MPa, constant temperature of 300 K, under applied electric fields of 0 V/nm and 1 V/nm. The change in pressure does not affect the orientation of water molecules in the CNT under any of the electric field conditions. Simulations with the TIP4P model show the same results (see Figure S1 in supporting information). However, the major difference of the TIP4P model from the SPC model is the peak at at the condition of 200 K and 0 V/nm. The peak at is significantly lower than that at . This indicates that the TIP4P water shows as a ferroelectric material in the CNT at low temperatures. This result is the same as that shown with the SPC model.
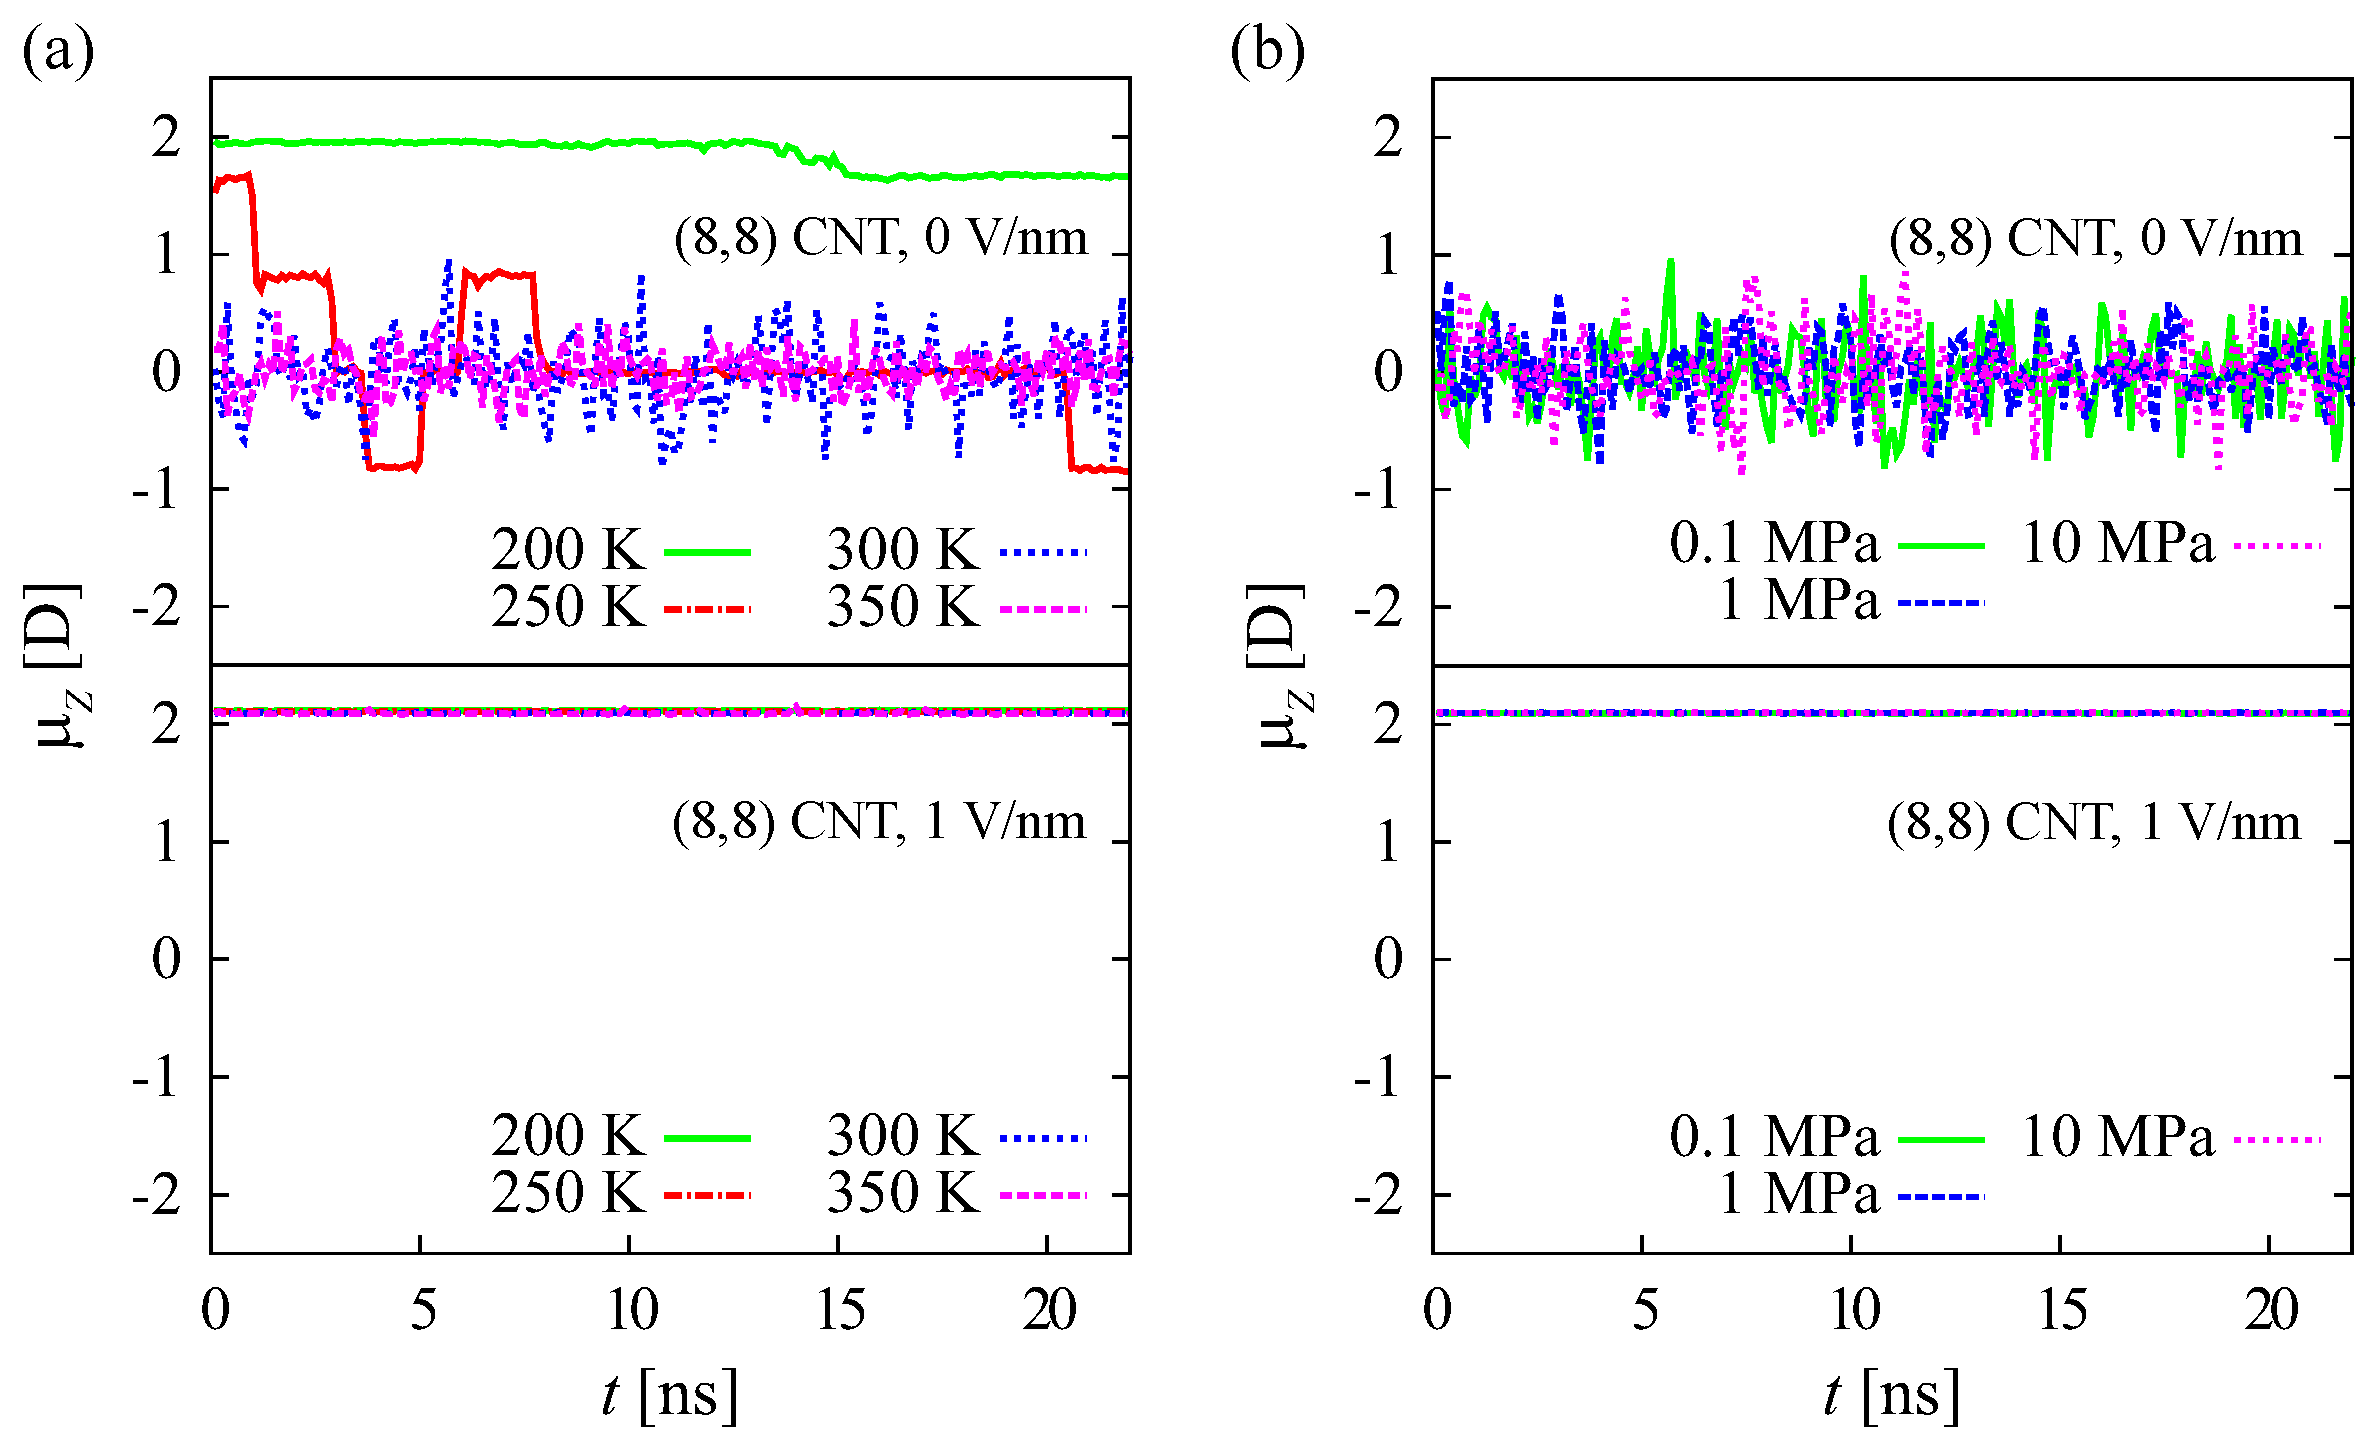
Polarization was determined by calculating the average z-component of the dipole moment () of water molecules in the CNT. The average value was calculated for 0.1 ns (100 frames) from 22 ns of simulation data, and is shown in Figure 3a,b. At a temperature of 200 K and applied electric field of 0 V/nm, the polarization is ≥ 1.7 Debye (D). This indicates that water in the CNT exhibits ferroelectric behavior at 200 K. This is consistent with the water orientation result shown in Figure 2a, in which one peak is observed at 200 K. The polarization of water molecules at low temperature has also been reported in previous studies [48,49]. However, one of these studies reported that polarization does not occur in a 4-gonal ice-nanotube [49]. As explained in the next paragraph, the structure of water molecules in the CNT at 200 K observed in the current study is 4-gonal. The previous study [49] was based on water in an infinite length CNT, rather than a CNT with reservoirs at each end. The dynamics of water molecules in the reservoirs may affect the polarization of water in the CNT at low temperature. At 250 K and 0 V/nm, the direction of polarization changes with time between D and D. A similar result was reported for a 5-gonal ice-nanotube structure in a CNT [48]. At 300 K fluctuates, and at the higher temperature of 350 K, the amplitude of decreases. This result is similar to that reported in the previous study [48]. Under an applied electric field, the orientation of water molecules is uniform (see Figure 2a,b), so is positive, i.e., 2.1 D. Changes in pressure up to 10 MPa do not affect the polarization of water in the CNT (see Figure 3b). Simulations with the TIP4P model show similar results (see Figure S2). However, at the condition of 300 K and 0 V/nm, the change with time between = +0.8 D and = −0.8 D, which is different from that of the SPC model. As explained in the next paragraph, the structure and dynamics of the TIP4P water is slightly different from those with the SPC model at the condition of 300 K and 0 V/nm. This suggests the melting temperature of the TIP4P model is slightly higher than that of the SPC model.
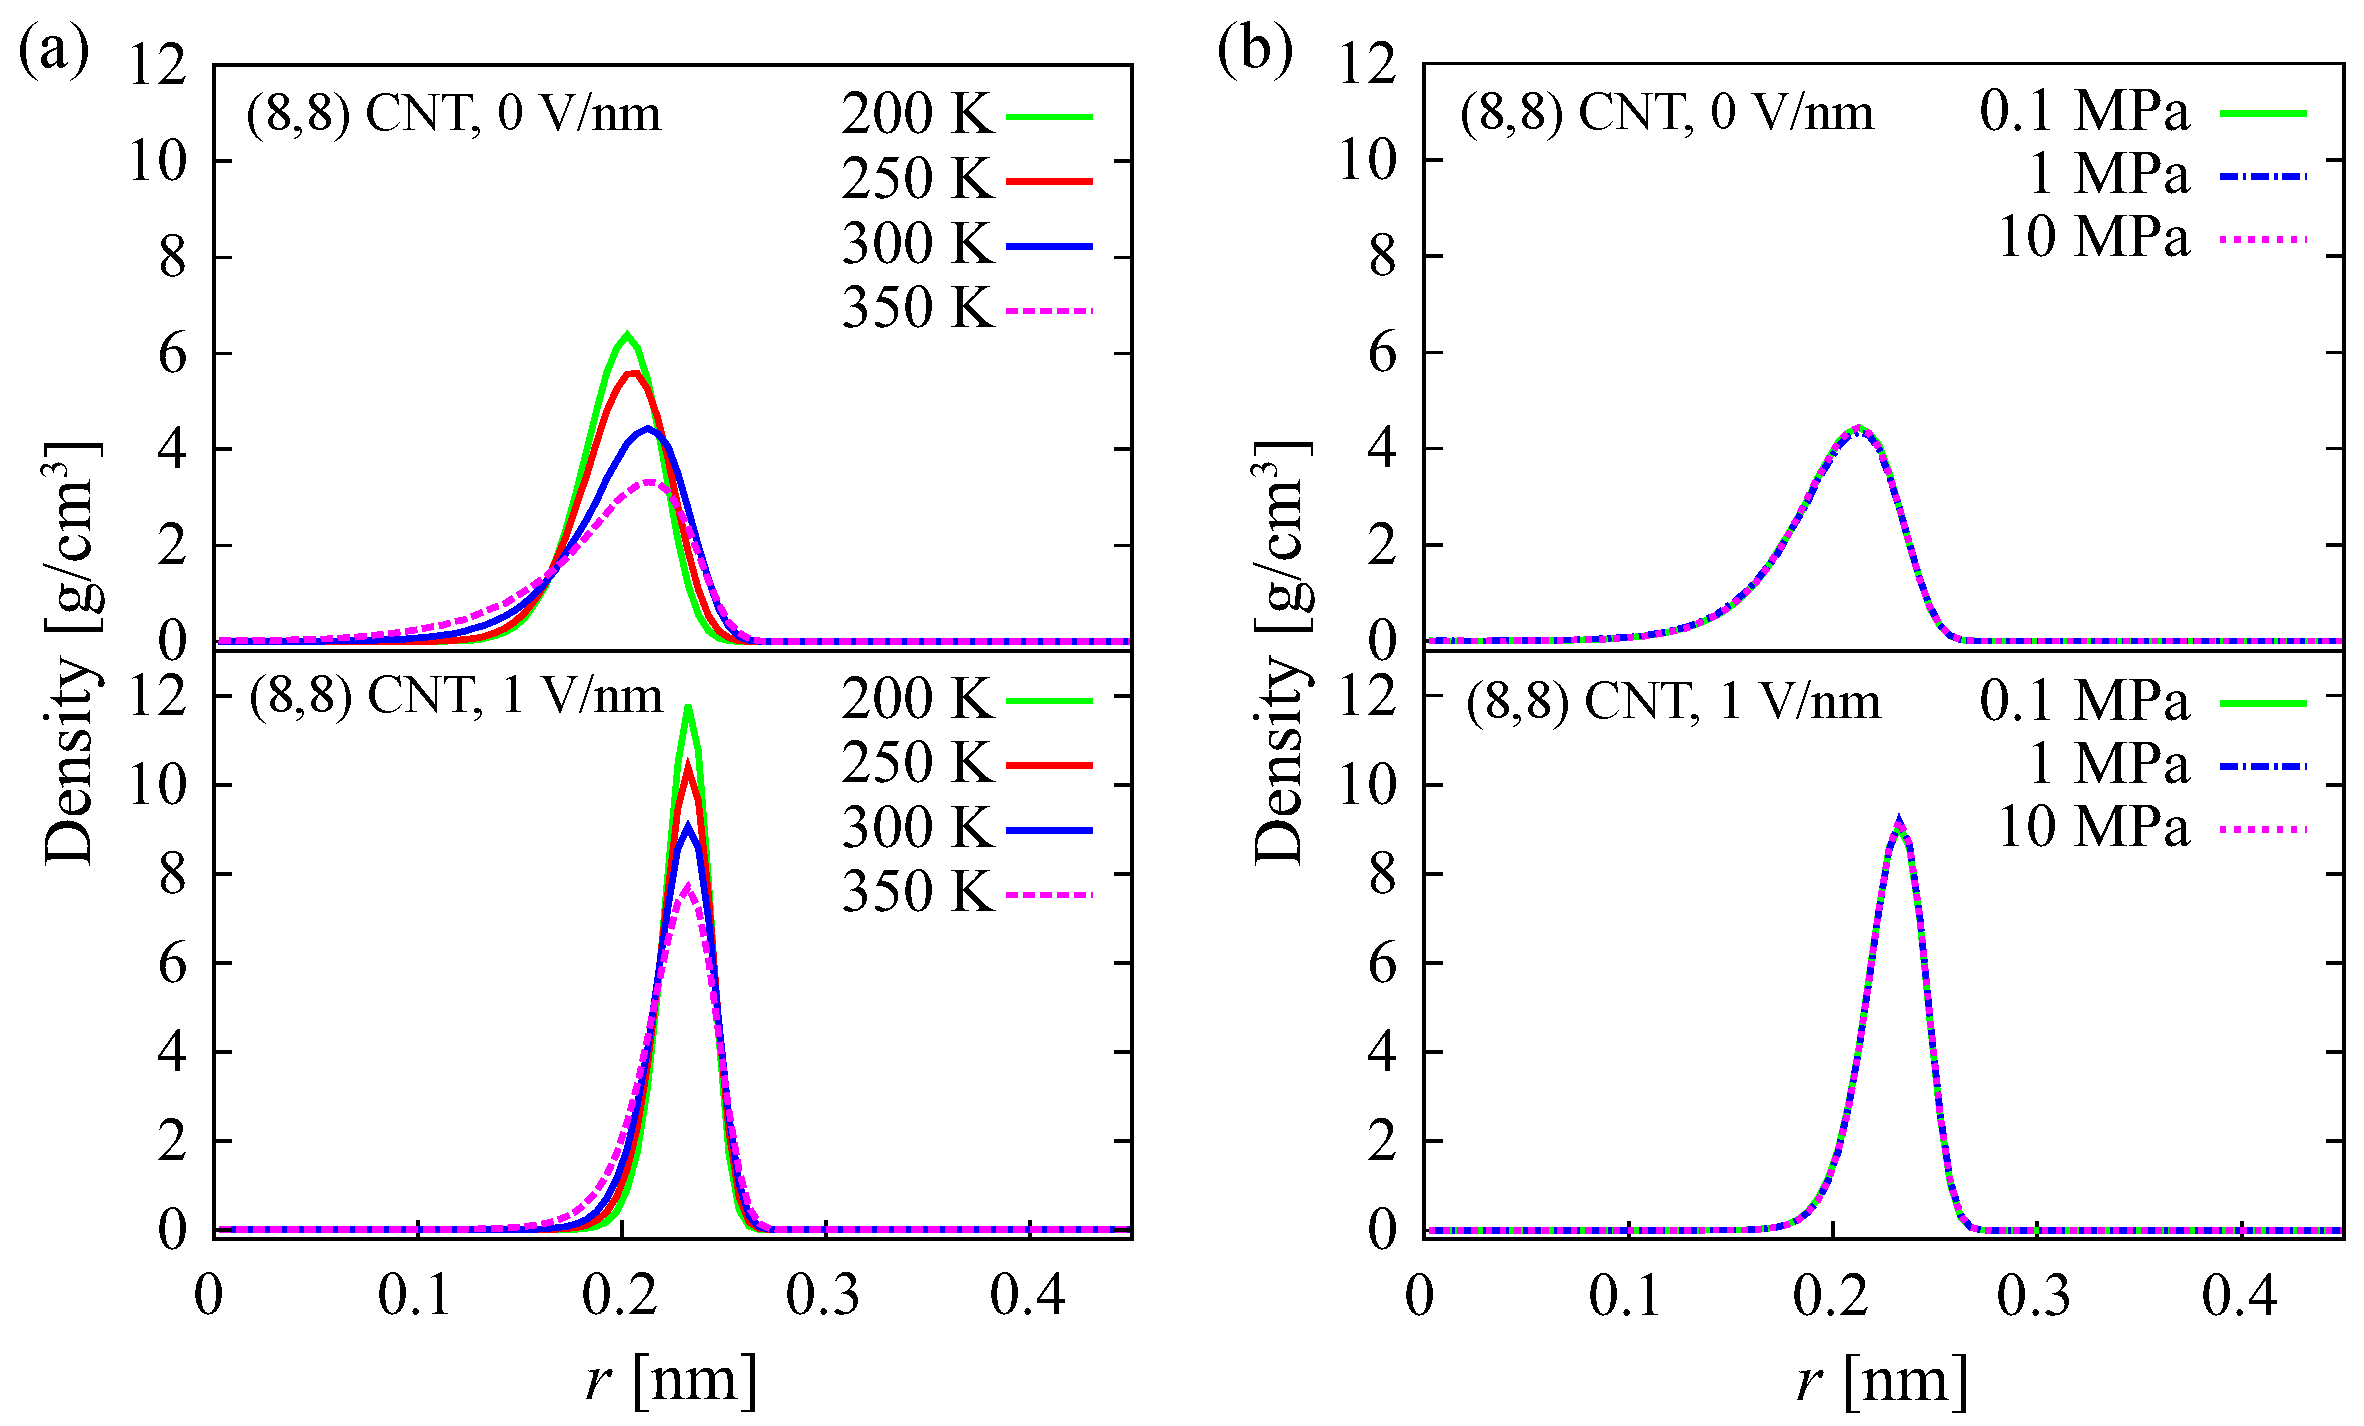
The densities of oxygen atoms in an CNT in the radial direction at various temperatures and pressures are shown in Figure 4a,b, respectively. At E = 1 V/nm, the density distribution is narrower and the peak is higher, compared with at E = 0 V/nm. This is observed for both various temperatures (Figure 4a) and pressures (Figure 4b). This implies that the water structure in an (8, 8) CNT under an electric field differs from that in the absence of an electric field at all simulated temperature and pressure conditions. This is discussed in more detail in the next paragraph. At lower temperatures, the distribution is narrower and consequently the peak is higher, especially at 0 V/nm (Figure 4a). This indicates that, at E = 0 V/nm, the water structure changes with increasing temperature. The change in pressure does not change the radial density distribution, either in the presence or absence of an electric field, as shown in Figure 4b. This suggests that increasing the pressure up to 10 MPa does not change the water structure. A similar result is observed using the TIP4P model (Figure S3). However, the distribution with the TIP4P model is slightly narrower than that with the SPC model at 300 K and 0 V/nm. It is consistent with the result of polarization in the previous paragraph. Another difference is that the distribution with the TIP4P model is slightly wider than that with the SPC model at 350 K and 1 V/nm. This suggests that, at 350 K and 1 V/nm, both water models have different structures.
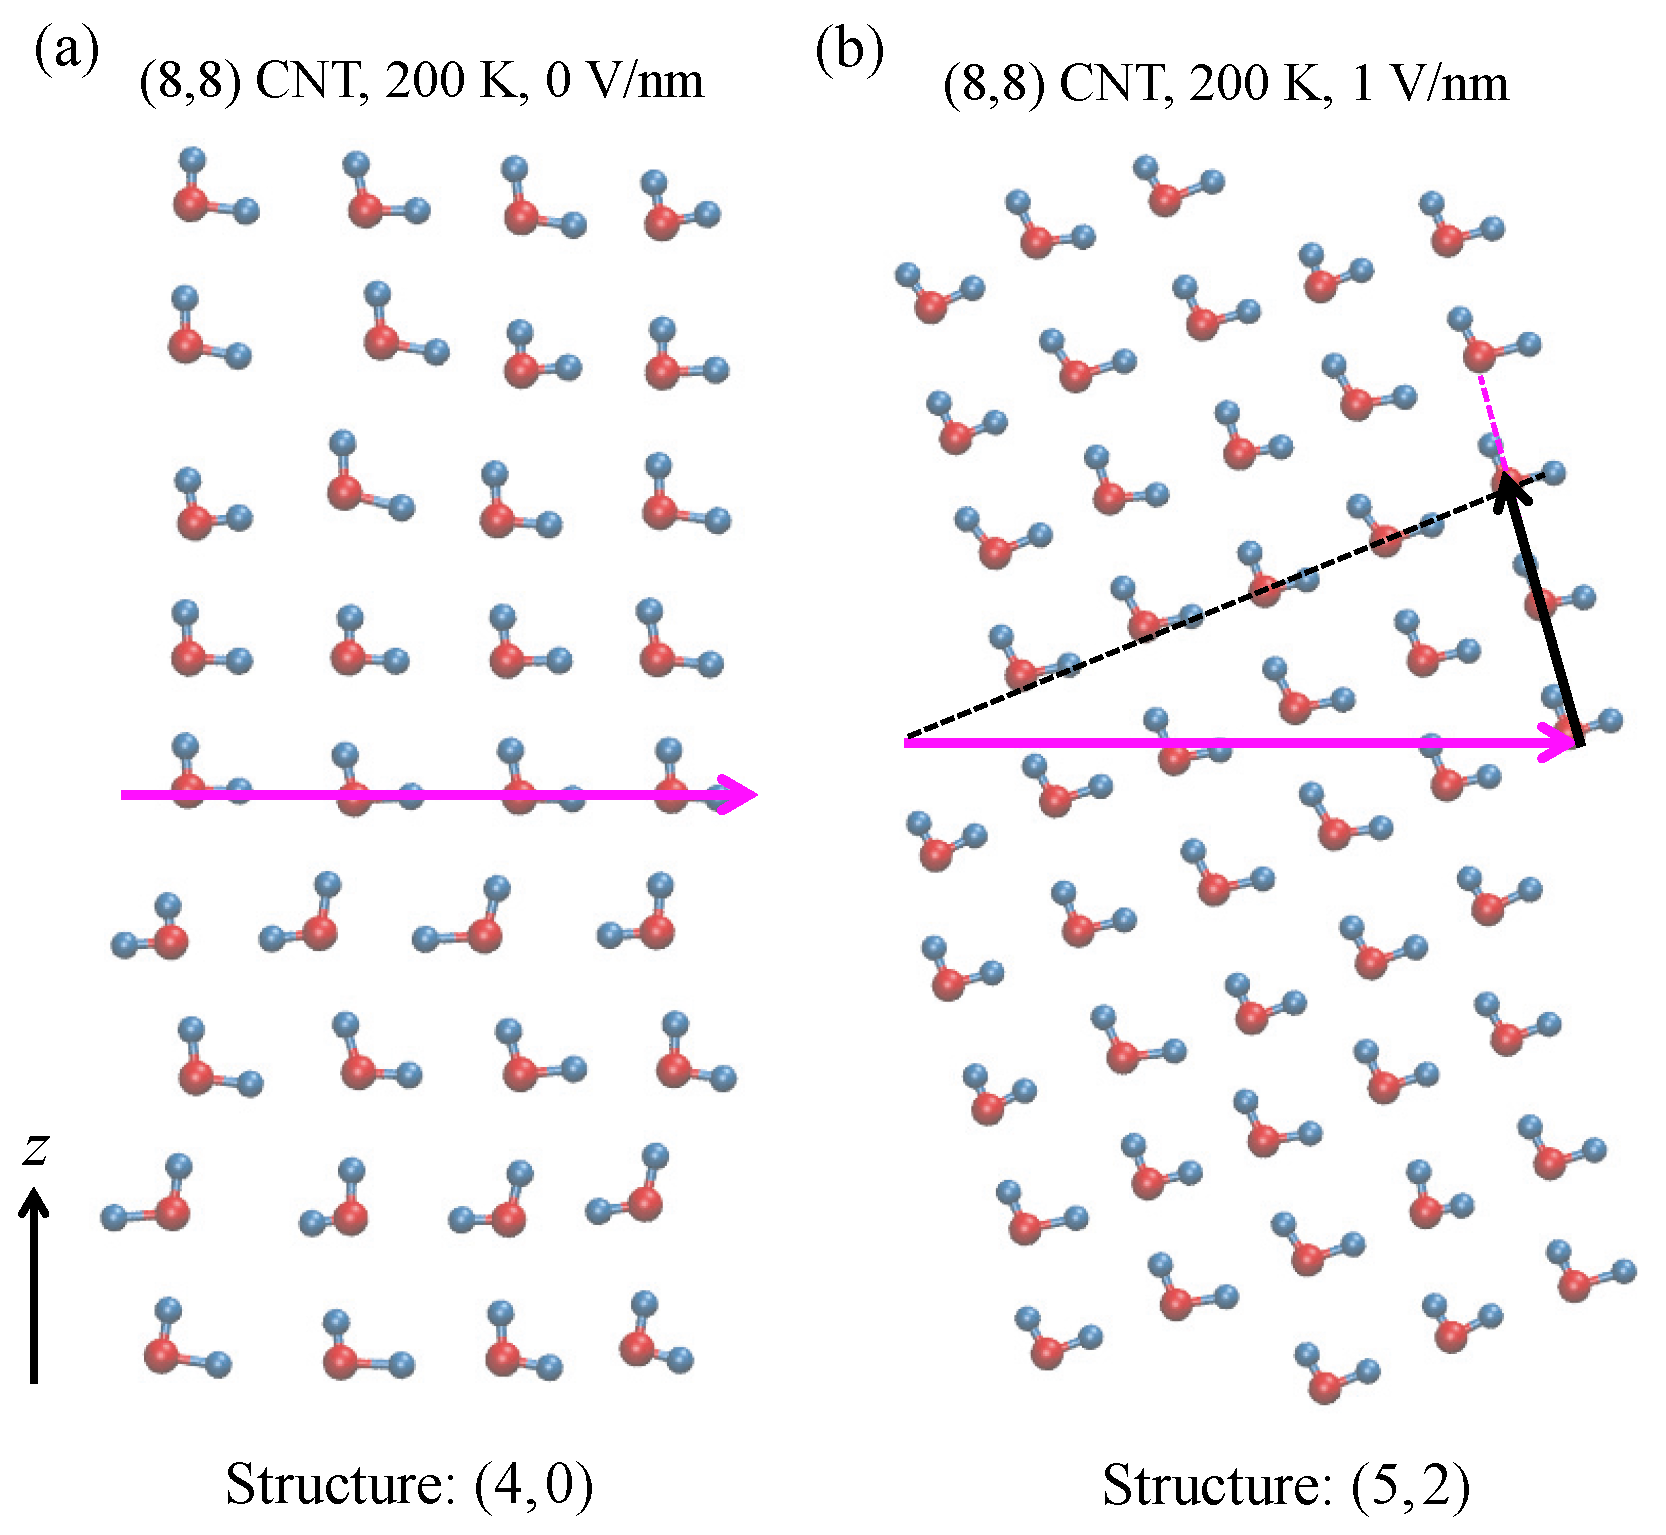
Snapshots of water structures in an (8, 8) CNT at temperatures of 200 K and 350 K and at pressures of 0.1 MPa and 10 MPa are shown in Figure 5a,b, respectively. Snapshots under applied electric fields of 0 V/nm and 1 V/nm are shown in both cases. The structure of water molecules is helical under an applied electric field of 1 V/nm. Under the applied electric field, the structure is the same at all temperature and pressure conditions. This result differs to that in the absence of an electric field. To better understand the water structure, we unrolled the water structure to obtain a two-dimensional (2D) structure. The radial positions of oxygen atoms in the CNT are averaged to determine the radius of the tube. The unrolled 2D structures are shown in Figure 6a for 200 K, 0.1 MPa, and 0 V/nm, and in Figure 6b for 200 K, 0.1 MPa, and 1 V/nm. The structure is identified using the index [50,51], as was used in our previous study [35]. If m, the structure is helical. If m = 0, it is an n-gonal structure [10,50,51]. As an example, water molecules in the structure of Figure 6b form an orderly arrangement, i.e., in both the column (magenta-dotted line) and row (black-dotted line) directions. The width of the structure is five column units (magenta arrow), and the number of rows corresponding to the five unit width is two units (i.e., the length of black arrow). Thus, it is a helical structure. In the same manner, the structure shown in Figure 6a is a 4-gonal structure. The difference in the two ordered structures, and , suggests that an electric field induces a phase transition from solid to solid. The snapshot in Figure 6a also supports our above conclusion that at 200 K and 0 V/nm, the water exhibits ferroelectric behavior. The directions of the dipole moments of all water molecules are on the positive z-axis.
The water structures at all temperature conditions are summarized in Table 1. In the absence of an electric field, water has a solid-like structure of at a low temperature of 200 K and 250 K. At 300 K, the structure of water is or disordered. This indicates that the ordered structure of is unstable at these conditions. The solid-like structure of readily changes to the disordered or liquid-like structure, and vice versa [35]. This indicates that the thermodynamic conditions of the simulation are near the melting or freezing point. A similar result was reported in a previous study, in which the formation of a 5-gonal ice-nanotube in a CNT of diameter 1.15 nm reportedly occurs at 310 ± 5 K [48]. The unstable structure at 300 K and 0 V/nm causes oscillation of the dipole orientation because of rearrangement of the water molecules into a tube-like structure (see Figure 3a). At a higher temperature of 350 K, the structure is completely disordered, and the water behaves as a liquid phase. Interestingly, under an applied electric field of E = 1 V/nm, the structure of water molecules in the CNT (diameter 1.08 nm) is at all temperatures. This structure is different from the structure at low temperature in the absence of an electric field. Previous studies of water in CNTs of slightly larger diameters under an electric field at ambient pressure showed different results [24,38,39]. In a CNT of diameter 1.2 nm and under a 1 V/nm field, TIP4P water has a solid-like structure at T < 105 K, and a liquid-like structure at higher temperatures [38]. In a 1.31 nm diameter CNT under a 1 V/nm field, the solid-like structure of TIP4P water reportedly melts to a liquid phase at T > 230 K [39]. These differences may have arisen from the different simulation configurations. In previous studies [38,39], the CNTs are immersed in bulk water, i.e., there are water molecules both inside and outside of the CNT wall. The interaction of water inside the CNT with water outside the CNT may result in a different freezing point. Moreover, in a 1.11 nm diameter CNT of infinite length under a 1 V/nm field, the melting point of TIP4P water reportedly occurs at 310 K [24]. In our system, there is no water outside the CNT wall. The water is instead located in reservoirs at the ends of the CNT. This may result in the different freezing points of water structures within the CNTs. Snapshots of the TIP4P water in the CNT are shown in Figures S4 and S5, and the structures at various temperatures are summarized in Table S1. In general, the structures are similar to those of the SPC. Slight differences are at the conditions of 300 K and 0 V/nm and of 350 K and 1 V/nm. At condition of 300 K and 0 V/nm, the structure with the TIP4P model is more stable than that with the SPC model. This indicates that the melting point of the TIP4P is slightly higher than that of the SPC. At 350 K and 1 V/nm, the structure with the TIP4P is instead of with the SPC. Hydrogen bond dynamics analysis shows that the structure of the TIP4P at this condition is weaker than that of the SPC. This suggests that, under an electric field, the melting point of the TIP4P model is slightly lower than that of the SPC model.
Table 2 summarizes the water structures in an CNT under various pressure conditions. Under a E = 0 V/nm field, water forms a or a disordered structure that is unstable, as explained above. Increasing the pressure up to 10 MPa does not yield a stable solid-like structure. This implies that the freezing point occurs at a pressure higher than 10 MPa. Under a E = 1 V/nm field, the structure at all pressure conditions is . This structure is the same as that at all temperature conditions in Table 1. An electric field 1 V/nm causes the formation of a structure at all simulated temperatures and pressures. This differs from the structure in the absence of an electric field. Structures of TIP4P at various pressures are listed in Table S2. The structures are and at 0 V/nm and 1 V/nm, respectively. Pressure up to 10 MPa does not change the structures.
3.2. Hydrogen Bond Dynamics
We calculated the hydrogen bond (HB) autocorrelation function , to investigate the dynamic behavior of the water structures [52,53]:
where if a pair of water molecules is bonded at time t, and if otherwise. The denominator is for normalization and is the number of hydrogen bonds (HBs) tagged at . The HBs between water molecules in the CNT are determined by the following geometrical criteria: < 0.36 nm, < 0.24 nm, and angle of [54,55].
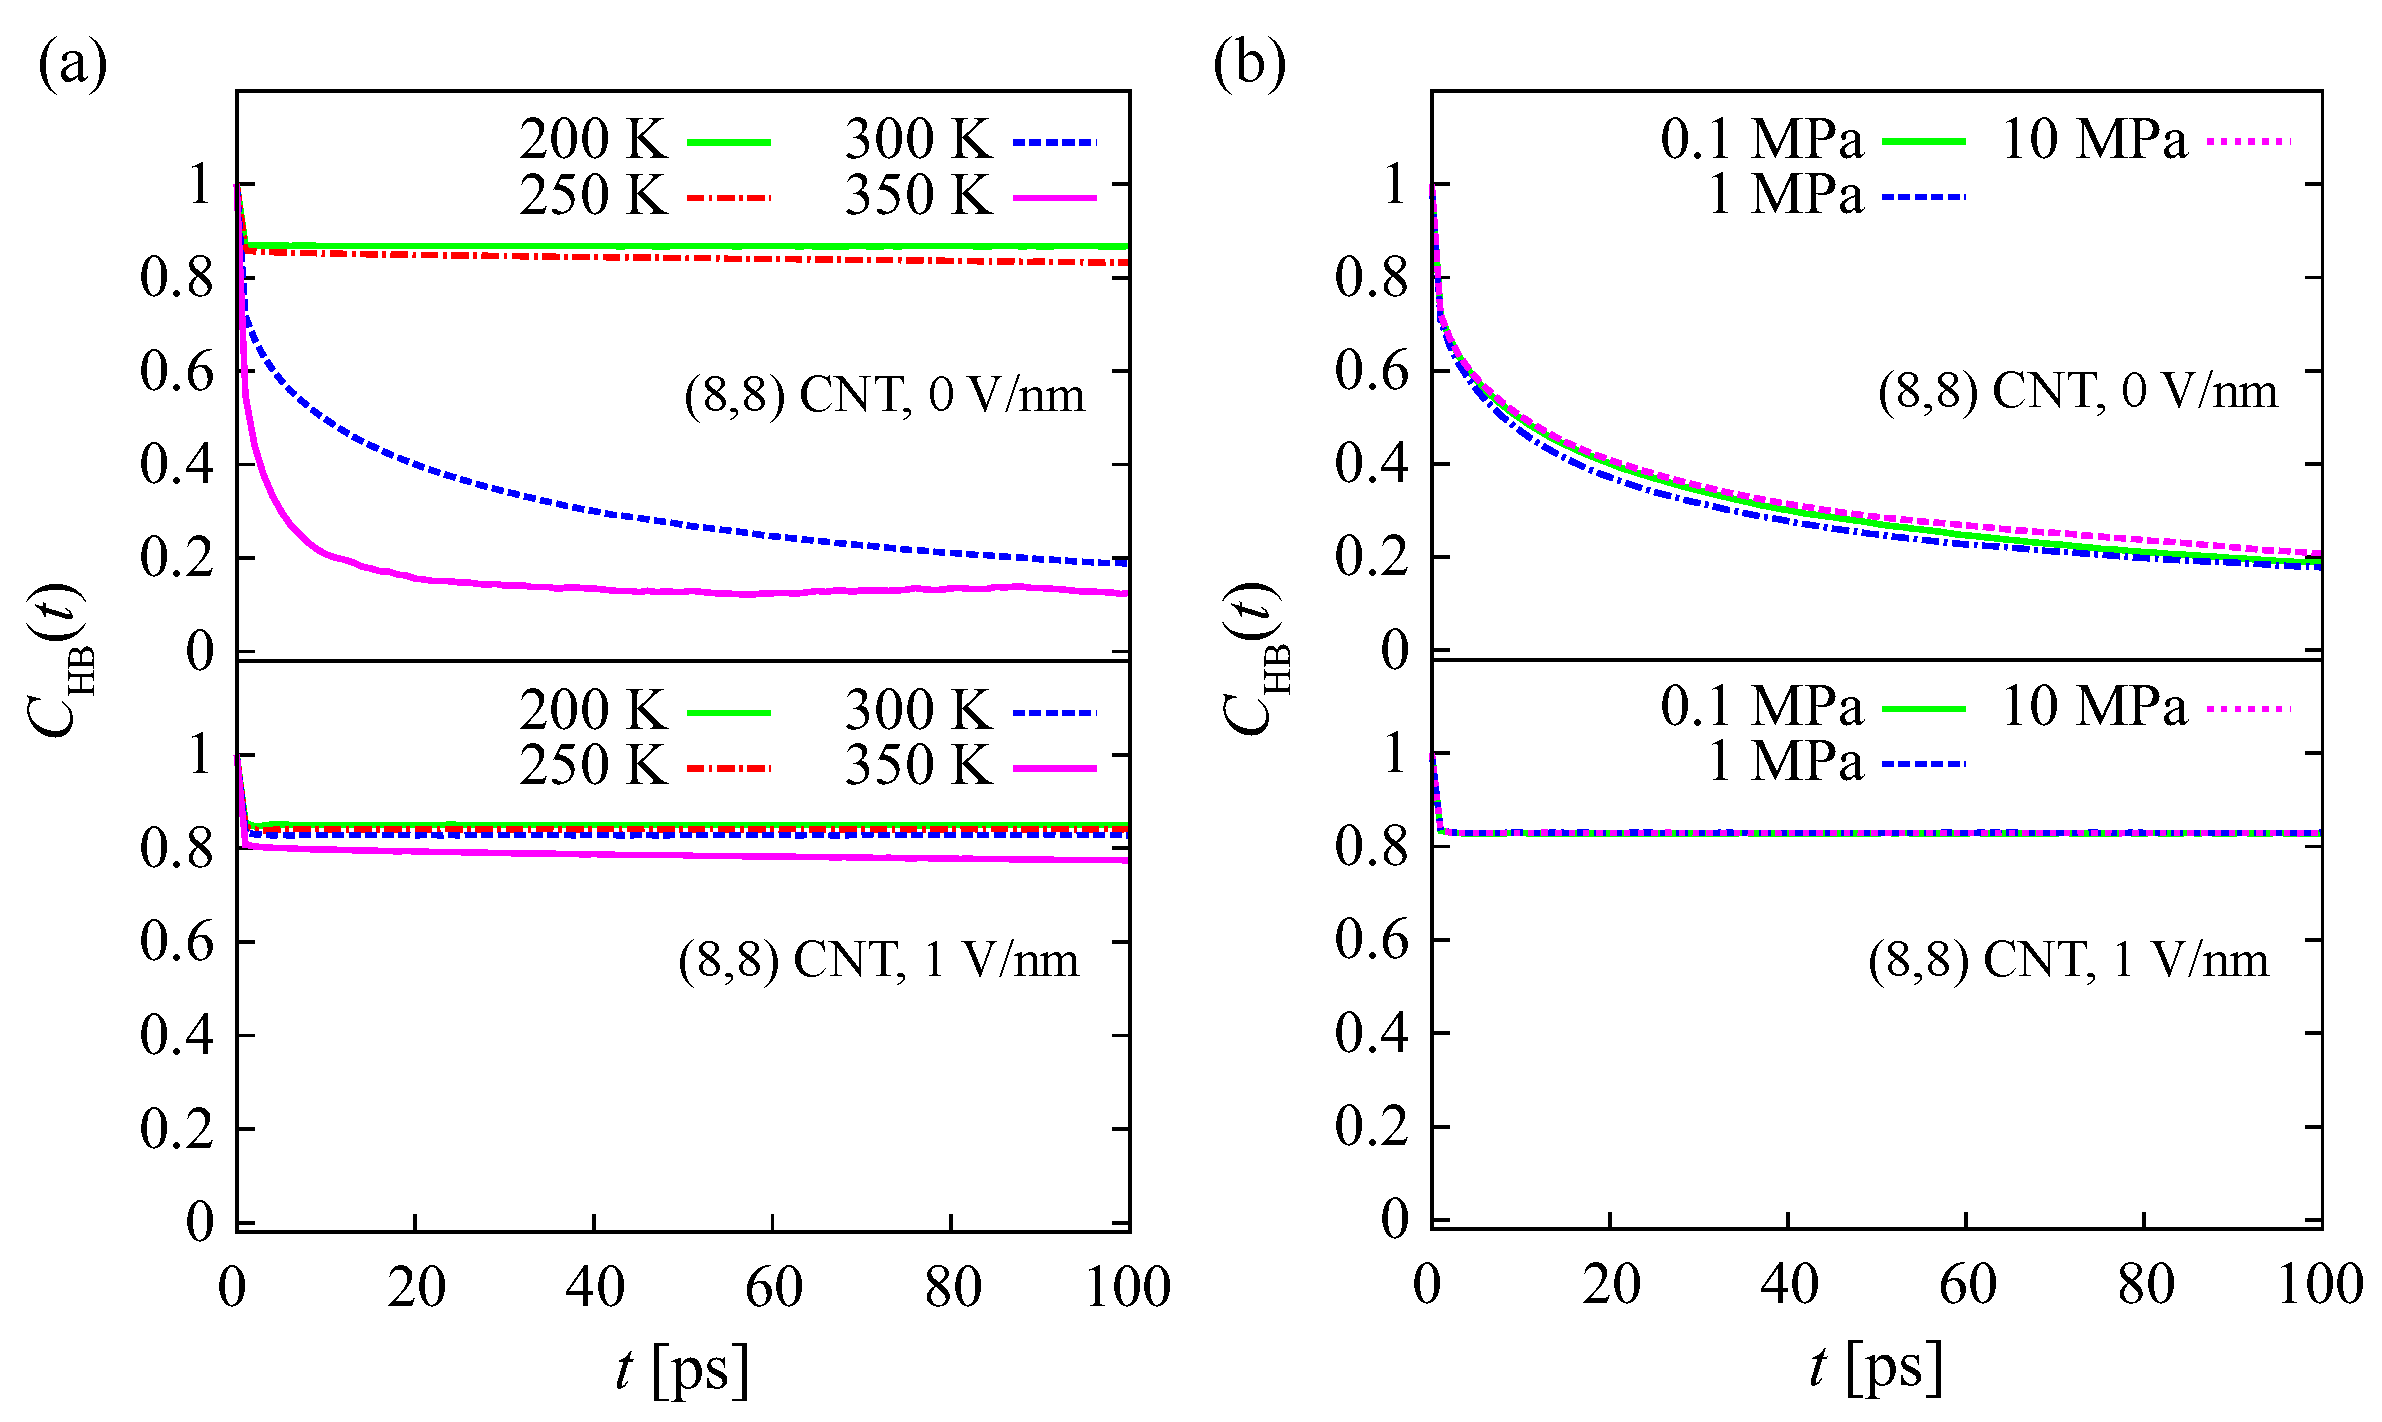
The HB autocorrelation functions within the water structures at various temperatures and 0 V/nm and 1 V/nm fields are shown in Figure 7a. At 200 K, 250 K, and 0 V/nm, decreases slightly and then becomes constant with increasing t. The value of is still higher than 0.8 at t = 100 ps. This indicates that the lifetime of the HBs is long. Similar results are observed for HBs within water structures under a 1 V/nm field at all temperature conditions. This indicates that the solid-like structures in the CNT, i.e., both the -structure at 0 V/nm, and the -structure at 1 V/nm, are retained by strong HBs. Different results are observed at temperatures of 300 K and 350 K under a 0 V/nm field, where the decreases to less than 0.2 at t = 100 ps. This indicates that more than 80% of HBs within the water structure are broken. Pairs of water molecules in this structure are not maintained by strong HBs. Consequently, pairs are easily broken, and the two molecules diffuse away from each other. As seen in Table 1, the structure at these temperatures is disordered, i.e., a liquid-like structure. The within TIP4P structures at various temperatures with 0 V/nm and 1 V/nm are shown in Figure S6a. The dynamics of HB of TIP4P structures is similar to that of SPC except at 300 K and 0 V/nm. At this condition, the of the TIP4P is higher than that of the SPC. This implies that HBs within -structure of the TIP4P is stronger, and the structure is more stable than that of the SPC. Moreover, this denotes that the melting point of the TIP4P is slightly higher than that of the SPC. This result supports the explanation in the previous paragraph. At the condition of 350 K and 1 V/nm, the of the TIP4P is slightly lower than that of the SPC. The HBs within the TIP4P structure is weaker. This suggests that, under an electric field, the melting point of the TIP4P is lower than that of the SPC.
The effect of pressure on under 0 V/nm and 1 V/nm fields is shown in Figure 7b. At V/nm, the value of decreases to around 0.2 for all pressure conditions. A pair of water molecules within the disordered (liquid-like) structure will readily diffuse away from each other. Increasing the pressure up to 10 MPa has no significant effect on the HB strength within the structure. Under a 1 V/nm field, at . This indicates that the -structure within the CNT is retained by strong HBs. This supports the notion that the water behaves as a solid phase. Increasing the pressure up to 10 MPa does not change the within the structure in the CNT under a V/nm field. The dynamics of HBs in the structures at 200 K and 250 K under 0 V/nm and 1 V/nm fields are similar (Figure 7a). The lifetimes of HBs within the -structure (at 0 V/nm) and -structure (at 1 V/nm) are very long. The with the TIP4P model at various pressures are presented at Figure S6b. The pressure up to 10 MPa does not change .
3.3. Potential Energy
To identify the main driving force for the formation of the -structure and -structure within the CNTs, we analyzed the Lennard–Jones (LJ) and Coulomb potential energies of water molecules in the reservoir and in the CNT. In addition, under an external electric field, water has a dipole potential energy , where is the vector of the dipole moment, and is the electric field. Table 3 shows averages of the LJ potential energy, Coulomb potential energy, and dipole potential energy per water molecule in the reservoirs and in the CNT at 200 K and 250 K. is the difference between the potential energy in the CNT () and that in the reservoir (), . Thus, indicates the effect of the CNT wall on the water molecules in the tube. There is no electrostatic interaction of water molecules with the CNT and graphene walls because the CNT and graphene have no charge, i.e., the Coulomb potential represents only water–water interactions.
In the absence of an electric field, i.e., V/nm, the LJ potential energy in the CNT is lower than that in the reservoirs at K and 250 K. The values of are kJ/mol and kJ/mol at 200 K and 250 K, respectively. The negative value of indicates that the van der Waals interaction facilitates water molecules to occupy the tube. On the other hand, the Coulomb potential energy in the reservoirs is lower than that in the CNT. The energy differences are 14.86 kJ/mol and 8.53 kJ/mol at 200 K and 250 K, respectively. This indicates that the electrostatic interaction tends to move the water molecules from the CNT into reservoir. Therefore, at 200 K and 250 K under a 0 V/nm field, the van der Waals interaction is the main driving force maintaining water within the CNT. Similar results are shown by the simulation with the TIP4P water model as presented in Table S3. The values of are kJ/mol and kJ/mol at 200 K and 250 K, respectively. Meanwhile, the with the TIP4P are 16.08 kJ/mol and 6.70 kJ/mol at 200 K and 250 K, respectively. To clarify the contribution for the van der Waals interaction, we calculated the LJ potential energy of the water–water interaction () and water–CNT interaction () in the reservoirs and in the CNT (see Table 4). The potential energy does not include any contribution from the graphene sheets. Under a 0 V/nm field, in the reservoirs and CNT have similar positive values. In contrast, in the CNT has negative values of and kJ/mol at 200 K and 250 K, respectively. This indicates that, in the absence of an electric field, the van der Waals interaction of CNT–water is the main driving force for the formation of the -structure in the CNT, which facilitates water molecules to occupy the CNT. Simulations with TIP4P model show similar results (Table S4). The in the reservoirs and CNT do not have significant different values. On the other hand, the in the CNT have negative values, kJ/mol and kJ/mol at 200 K and 250 K, respectively.
Under an electric field of 1 V/nm, the LJ potential energy difference between the reservoir and CNT is small. The values are kJ/mol and 0.13 kJ/mol at 200 K and 250 K, respectively (see Table 3). The TIP4P water model shows similar results (Table S3). The values of are kJ/mol and kJ/mol at 200 K and 250 K, respectively. We now consider the contribution of the van der Waals interaction. The facilitates water molecules to occupy the CNT, while the tends to remove water from the CNT (see Table 4). Simulations with the TIP4P model show the same results (Table S4). In contrast, the Coulomb potential energy in the CNT is significantly lower than that in the reservoirs. The values are kJ/mol and kJ/mol at 200 K and 250 K, respectively (Table 3). Therefore, under an electric field of 1 V/nm, the electrostatic interaction of water molecules in the CNT is the main driving force for the formation of the -structure in the CNT, and facilitates water molecules to occupy the CNT. Similarly, the presence of an electric field strengthens the electrostatic interaction within the TIP4P water structure. Coulomb potential energy per TIP4P molecule in the CNT at 1 V/nm is significantly lower than that at 0 V/nm (Table S3). At 200 K, the is kJ/mol, which is still higher than kJ/mol of . Therefore, at a low temperature of 200 K, the is still dominant for facilitating the TIP4P water to occupy in the CNT. However, at higher temperatures of 250 K, becomes kJ/mol, which is the main driving energy to facilitate the TIP4P water to fill the CNT. This is due to the Coulomb potential energy of water in reservoirs increasing at a higher temperature. At 300 K and 1 V/nm, decreases to kJ/mol.
We now consider the mechanism of phase transition of the water structure from to within the CNT under an electric field, using the energy differences (see Table 3). Under the electric field, the LJ potentials in the CNT increase by 13.27 kJ/mol and 11.47 kJ/mol at 200 K and 250 K, respectively, compared with those in the absence of an electric field. This main contribution to this increase is the water–water interaction (). In contrast, the Coulomb potentials decrease by kJ/mol and kJ/mol at 200 K and 250 K, respectively. These results indicate that the phase transition of the water structure from to results from the decrease in Coulomb potential and increase in LJ potential (i.e., mainly water–water interactions). This explanation also applies for the TIP4P model. With 1 V/nm, the LJ potentials in the CNT increase by 9.88 kJ/mol and 10.10 kJ/mol at 200 K and 250 K, respectively, compared with those with 0 V/nm (Table S3). Contrarily, the Coulomb potentials decrease by kJ/mol and kJ/mol at 200 K and 250 K, respectively.
The dipole potential energy will be at a minimum if the direction of the dipole moment is parallel to that of the electric field. However, the direction of the dipole moment is not statically parallel to the electric field, but instead oscillates around it. The presence of the graphene sheet causes polarization in the reservoirs, and induces an internal electric field in the direction opposite to the external electric field [35]. As a result, the effective electric field in the reservoir is lower than that in the CNT. The orientation of the dipole moment of water in the reservoir therefore oscillates more than that in the CNT. This causes the average dipole potential in the reservoirs to be slightly higher than that in the CNT, so becomes negative (Table 3). This means that the dipole potential energy promotes water to fill the CNT. However, the contribution of the dipole energy is minor compared to that of the Coulomb potential energy. This supports the notion above that the electrostatic interaction within the water structure is the main driving force for the transition from the -structure to -structure. The of the TIP4P water is slightly higher than that of the SPC. This is owing to the fact that the dipole moment of the TIP4P is lower than that of the SPC, i.e., 2.18 D and 2.27 D, respectively.
In the absence of an electric field, the LJ potential is the main driving force for the formation of an ordered structure in the CNT. However, the electrostatic interaction within water structure tends to remove water from CNT. At the condition of 300 K and 0 V/nm, of the SPC is higher than that of the TIP4P, i.e., kJ/mol and kJ/mol, respectively (see Table S5). This makes the of the SPC higher than that of the TIP4P, i.e., kJ/mol and kJ/mol, respectively. As the result, at 300 K and 0 V/nm the solid-like structure of the TIP4P in the CNT is more stable, and the melting point is higher than that of the SPC. Conversely, with the presence of an electric field, the electrostatic interaction within water structure is the main driving force for the formation of an ordered structure. At 350 K and 1 V/nm, of the SPC is lower than that of the TIP4P, i.e., kJ/mol and kJ/mol, respectively (see Table S6). This makes of the SPC lower than that of the TIP4P, i.e., kJ/mol and kJ/mol, respectively. This causes the structure of the SPC at a high temperature of 350 K under an electric field to be stronger than that of the TIP4P. This suggests that other water models having higher dipole moments, such as TIP3P and TIP4P/2005, may have higher melting point within CNTs.
4. Conclusions
MD simulations have been performed to clarify the structure of water molecules in an CNT, in the presence and absence of an electric field. Simulations have been performed at various temperatures of 200 K to 350 K at constant pressure of 0.1 MPa, and at various pressures of 0.1 MPa to 10 MPa at constant temperature of 300 K. Under a 0 V/nm field at low temperatures of 200 K and 250 K, water in the CNT has an ordered solid-like structure. This indicates that water in the CNT forms an ice-nanotube. At 200 K, the ice-nanotube exhibits ferroelectric behavior. At K, the solid-like structure remains but is unstable. The structure readily changes to a disordered structure or liquid-like structure, and vice versa. This suggests that this temperature is near the melting point. At 300 K, increasing the pressure up to 10 MPa does not change the structure. Under these conditions, water has both ordered and disordered structures, i.e., an unstable structure. At a higher temperature of 350 K, the structure is completely disordered, and water in the CNT is in the liquid phase.
Under an applied electric field of 1 V/nm, water molecules form an ordered structure in the CNT at all simulated temperature conditions. This implies that the electric field induces a phase transition from liquid to ice-nanotube in the CNT, at temperatures as high as 350 K. The structure of the ice-nanotube under the applied electric field differs from that formed in the absence of the electric field at low temperatures of 200 K and 250 K. The electrostatic interactions or hydrogen bonding within the ice-nanotube structure under the electric field are stronger than those in the absence of the electric field. The electrostatic interaction is the main driving force for the solid–solid phase transition at low temperatures. The structure of the ice-nanotube under a 1 V/nm field does not change with increasing pressure of up to 10 MPa.
Supplementary Materials
The following are available online at www.mdpi.com/2073-4441/9/7/473/s1.
Acknowledgments
Eiji Yamamoto was supported by MEXT (Ministry of Education, Culture, Sports, Science and Technology) Grant-in-Aid for the “Building of Consortia for the Development of Human Resources in Science and Technology”.
Author Contributions
Winarto, Eiji Yamamoto and Kenji Yasuoka designed the research; Winarto performed the research; Winarto, Eiji Yamamoto and Kenji Yasuoka discussed the results and wrote the manuscript.
Conflicts of Interest
The authors declare no conflicts of interest associated with this manuscript.
Abbreviations
The following abbreviations are used in this manuscript:
| CNT | Carbon Nanotube |
| MD | Molecular Dynamics |
| Probability Distribution Function | |
| HB | Hydrogen Bond |
| LJ | Lennard–Jones |
References
- Hummer, G.; Rasaiah, J.C.; Noworyta, J.P. Water conduction through the hydrophobic channel of a carbon nanotube. Nature 2001, 414, 188–190. [Google Scholar] [CrossRef] [PubMed]
- Majumder, M.; Chopra, N.; Andrews, R.; Hinds, B.J. Nanoscale hydrodynamics: Enhanced flow in carbon nanotubes. Nature 2005, 438, 44. [Google Scholar] [CrossRef] [PubMed]
- Holt, J.K.; Park, H.G.; Wang, Y.; Stadermann, M.; Artyukhin, A.B.; Grigoropoulos, C.P.; Noy, A.; Bakajin, O. Fast mass transport through sub-2-nanometer carbon nanotubes. Science 2006, 312, 1034–1037. [Google Scholar] [CrossRef] [PubMed]
- Qin, X.; Yuan, Q.; Zhao, Y.; Xie, S.; Liu, Z. Measurement of the rate of water translocation through carbon nanotubes. Nano Lett. 2011, 11, 2173–2177. [Google Scholar] [CrossRef] [PubMed]
- Kannam, S.K.; Todd, B.; Hansen, J.; Daivis, P.J. How fast does water flow in carbon nanotubes? J. Chem. Phys. 2013, 138, 094701. [Google Scholar] [CrossRef] [PubMed]
- Walther, J.H.; Ritos, K.; Cruz-Chu, E.R.; Megaridis, C.M.; Koumoutsakos, P. Barriers to superfast water transport in carbon nanotube membranes. Nano Lett. 2013, 13, 1910–1914. [Google Scholar] [CrossRef] [PubMed]
- Granick, S. Motions and relaxations of confined liquids. Science 1991, 253, 1374–1379. [Google Scholar] [CrossRef] [PubMed]
- Zangi, R. Water confined to a slab geometry: A review of recent computer simulation studies. J. Phys. Condens. Matter 2004, 16, S5371. [Google Scholar] [CrossRef]
- Alexiadis, A.; Kassinos, S. Molecular simulation of water in carbon nanotubes. Chem. Rev. 2008, 108, 5014. [Google Scholar] [CrossRef] [PubMed]
- Koga, K.; Gao, G.; Tanaka, H.; Zeng, X.C. Formation of ordered ice nanotubes inside carbon nanotubes. Nature 2001, 412, 802–805. [Google Scholar] [CrossRef] [PubMed]
- Bai, J.; Wang, J.; Zeng, X.C. Multiwalled ice helixes and ice nanotubes. Proc. Natl. Acad. Sci. USA 2006, 103, 19664–19667. [Google Scholar] [CrossRef] [PubMed]
- Corry, B. Water and ion transport through functionalised carbon nanotubes: Implications for desalination technology. Energy Environ. Sci. 2011, 4, 751–759. [Google Scholar] [CrossRef]
- Goldsmith, J.; Martens, C.C. Molecular dynamics simulation of salt rejection in model surface-modified nanopores. J. Phys. Chem. Lett. 2009, 1, 528–535. [Google Scholar] [CrossRef]
- Chan, W.F.; Chen, H.Y.; Surapathi, A.; Taylor, M.G.; Shao, X.; Marand, E.; Johnson, J.K. Zwitterion functionalized carbon nanotube/polyamide nanocomposite membranes for water desalination. ACS Nano 2013, 7, 5308–5319. [Google Scholar] [CrossRef] [PubMed]
- Arora, G.; Sandler, S.I. Molecular sieving using single wall carbon nanotubes. Nano Lett. 2007, 7, 565–569. [Google Scholar] [CrossRef] [PubMed]
- Insepov, Z.; Wolf, D.; Hassanein, A. Nanopumping using carbon nanotubes. Nano Lett. 2006, 6, 1893–1895. [Google Scholar] [CrossRef] [PubMed]
- Longhurst, M.; Quirke, N. Temperature-driven pumping of fluid through single-walled carbon nanotubes. Nano Lett. 2007, 7, 3324–3328. [Google Scholar] [CrossRef] [PubMed]
- Kou, J.; Zhou, X.; Lu, H.; Xu, Y.; Wu, F.; Fan, J. A vibration-charge-induced unidirectional transport of water molecules in confined nanochannels. Soft Matter 2012, 8, 12111–12115. [Google Scholar] [CrossRef]
- Zangi, R.; Mark, A.E. Electrofreezing of confined water. J. Chem. Phys. 2004, 120, 7123. [Google Scholar] [CrossRef] [PubMed]
- Vaitheeswaran, S.; Yin, H.; Rasaiah, J.C. Water between plates in the presence of an electric field in an open system. J. Phys. Chem. B 2005, 109, 6629–6635. [Google Scholar] [CrossRef] [PubMed]
- Bratko, D.; Daub, C.D.; Leung, K.; Luzar, A. Effect of field direction on electrowetting in a nanopore. J. Am. Chem. Soc. 2007, 129, 2504–2510. [Google Scholar] [CrossRef] [PubMed]
- Figueras, L.; Faraudo, J. Competition between hydrogen bonding and electric field in single-file transport of water in carbon nanotubes. Mol. Simul. 2012, 38, 23–25. [Google Scholar] [CrossRef]
- Qiu, H.; Guo, W. Electromelting of confined monolayer ice. Phys. Rev. Lett. 2013, 110, 195701. [Google Scholar] [CrossRef] [PubMed]
- He, Y.; Sun, G.; Koga, K.; Xu, L. Electrostatic field-exposed water in nanotube at constant axial pressure. Sci. Rep. 2014, 4, 6596. [Google Scholar] [CrossRef] [PubMed]
- Zhao, W.H.; Bai, J.; Yuan, L.F.; Yang, J.; Zeng, X.C. Ferroelectric hexagonal and rhombic monolayer ice phases. Chem. Sci. 2014, 5, 1757–1764. [Google Scholar] [CrossRef]
- Hille, B. Ionic channels in excitable membranes. Current problems and biophysical approaches. Biophys. J. 1978, 22, 283–294. [Google Scholar] [CrossRef]
- Philippsen, A.; Im, W.; Engel, A.; Schirmer, T.; Roux, B.; Müller, D.J. Imaging the electrostatic potential of transmembrane channels: Atomic probe microscopy of OmpF porin. Biophys. J. 2002, 82, 1667–1676. [Google Scholar] [CrossRef]
- Berkowitz, M.L.; Bostick, D.L.; Pandit, S. Aqueous solutions next to phospholipid membrane surfaces: Insights from simulations. Chem. Rev. 2006, 106, 1527–1539. [Google Scholar] [CrossRef] [PubMed]
- Sansom, M.S.; Biggin, P.C. Biophysics: Water at the nanoscale. Nature 2001, 414, 156–159. [Google Scholar] [CrossRef] [PubMed]
- Su, J.; Guo, H. Control of unidirectional transport of single-file water molecules through carbon nanotubes in an electric field. ACS Nano 2010, 5, 351–359. [Google Scholar] [CrossRef] [PubMed]
- Rinne, K.F.; Gekle, S.; Bonthuis, D.J.; Netz, R.R. Nanoscale Pumping of Water by AC Electric Fields. Nano Lett. 2012, 12, 1780–1783. [Google Scholar] [CrossRef] [PubMed]
- De Luca, S.; Todd, B.; Hansen, J.; Daivis, P.J. Electropumping of water with rotating electric fields. J. Chem. Phys. 2013, 138, 154712. [Google Scholar] [CrossRef] [PubMed]
- Suk, M.; Aluru, N. Effect of induced electric field on single-file reverse osmosis. Phys. Chem. Chem. Phys. 2009, 11, 8614–8619. [Google Scholar] [CrossRef] [PubMed]
- Vaitheeswaran, S.; Rasaiah, J.C.; Hummer, G. Electric field and temperature effects on water in the narrow nonpolar pores of carbon nanotubes. J. Chem. Phys. 2004, 121, 7955. [Google Scholar] [CrossRef] [PubMed]
- Winarto; Takaiwa, D.; Yamamoto, E.; Yasuoka, K. Structures of water molecules in carbon nanotubes under electric fields. J. Chem. Phys. 2015, 142, 124701. [Google Scholar] [CrossRef] [PubMed]
- Winarto; Takaiwa, D.; Yamamoto, E.; Yasuoka, K. Water-methanol separation with carbon nanotubes and electric fields. Nanoscale 2015, 7, 12659–12665. [Google Scholar] [CrossRef] [PubMed]
- Winarto; Takaiwa, D.; Yamamoto, E.; Yasuoka, K. Separation of water-ethanol solutions with carbon nanotubes and electric fields. Phys. Chem. Chem. Phys. 2016, 18, 33310–33319. [Google Scholar] [CrossRef] [PubMed]
- Fu, Z.; Luo, Y.; Ma, J.; Wei, G. Phase transition of nanotube-confined water driven by electric field. J. Chem. Phys. 2011, 134, 154507. [Google Scholar] [CrossRef] [PubMed]
- Qian, Z.; Fu, Z.; Wei, G. Influence of electric fields on the structure and structure transition of water confined in a carbon nanotube. J. Chem. Phys. 2014, 140, 154508. [Google Scholar] [CrossRef]
- Berendsen, H.; Postma, J.; Van Gunsteren, W.; Hermans, J. Interaction models for water in relation to protein hydration. Intermol. Forces 1981, 14, 331–342. [Google Scholar]
- Hess, B.; Kutzner, C.; Van Der Spoel, D.; Lindahl, E. GROMACS 4: Algorithms for highly efficient, load-balanced, and scalable molecular simulation. J. Chem. Theory Comput. 2008, 4, 435–447. [Google Scholar] [CrossRef] [PubMed]
- Darden, T.; York, D.; Pedersen, L. Particle mesh Ewald: An N·log (N) method for Ewald sums in large systems. J. Chem. Phys. 1993, 98, 10089. [Google Scholar] [CrossRef]
- Ryckaert, J.P.; Ciccotti, G.; Berendsen, H.J. Numerical integration of the cartesian equations of motion of a system with constraints: Molecular dynamics of n-alkanes. J. Comput. Phys. 1977, 23, 327–341. [Google Scholar] [CrossRef]
- Parrinello, M.; Rahman, A. Polymorphic transitions in single crystals: A new molecular dynamics method. J. Appl. Phys. 1981, 52, 7182. [Google Scholar] [CrossRef]
- Nosé, S. A unified formulation of the constant temperature molecular dynamics methods. J. Chem. Phys. 1984, 81, 511. [Google Scholar] [CrossRef]
- Hoover, W.G. Canonical dynamics: Equilibrium phase-space distributions. Phys. Rev. A 1985, 31, 1695. [Google Scholar] [CrossRef]
- Wang, J.; Zhu, Y.; Zhou, J.; Lu, X.H. Diameter and helicity effects on static properties of water molecules confined in carbon nanotubes. Phys. Chem. Chem. Phys. 2004, 6, 829–835. [Google Scholar] [CrossRef]
- Mikami, F.; Matsuda, K.; Kataura, H.; Maniwa, Y. Dielectric properties of water inside single-walled carbon nanotubes. ACS Nano 2009, 3, 1279–1287. [Google Scholar] [CrossRef] [PubMed]
- Luo, C.; Fa, W.; Zhou, J.; Dong, J.; Zeng, X.C. Ferroelectric ordering in ice nanotubes confined in carbon nanotubes. Nano Lett. 2008, 8, 2607–2612. [Google Scholar] [CrossRef] [PubMed]
- Takaiwa, D.; Koga, K.; Tanaka, H. Structures of filled ice nanotubes inside carbon nanotubes. Mol. Simul. 2007, 33, 127–132. [Google Scholar] [CrossRef]
- Takaiwa, D.; Hatano, I.; Koga, K.; Tanaka, H. Phase diagram of water in carbon nanotubes. Proc. Natl. Acad. Sci. USA 2008, 105, 39–43. [Google Scholar] [CrossRef] [PubMed]
- Luzar, A.; Chandler, D. Hydrogen-bond kinetics in liquid water. Nature 1996, 379, 55–57. [Google Scholar] [CrossRef]
- Paul, S.; Chandra, A. Hydrogen bond dynamics at vapour-water and metal-water interfaces. Chem. Phys. Lett. 2004, 386, 218–224. [Google Scholar] [CrossRef]
- Martí, J. Analysis of the hydrogen bonding and vibrational spectra of supercritical model water by molecular dynamics simulations. J. Chem. Phys. 1999, 110, 6876. [Google Scholar] [CrossRef]
- Gordillo, M.; Martí, J. Hydrogen bond structure of liquid water confined in nanotubes. Chem. Phys. Lett. 2000, 329, 341–345. [Google Scholar] [CrossRef]
Figure 1.
The configuration of the molecular dynamics (MD) simulation consists of an carbon nanotube (CNT), two graphene sheets, and water reservoirs on both sides. Water molecules fill the reservoirs, and an electric field E is applied in the z direction.
Figure 1.
The configuration of the molecular dynamics (MD) simulation consists of an carbon nanotube (CNT), two graphene sheets, and water reservoirs on both sides. Water molecules fill the reservoirs, and an electric field E is applied in the z direction.

Figure 2.
Orientation of water molecules in an CNT: (a) at various temperatures from 200 K to 350 K and ambient pressure of 0.1 MPa. The applied electric field strengths are 0 V/nm (top) and 1 V/nm (bottom). The orientation is indicated by the angle , which is the angle between the dipole moment and the electric field E. O and H represent oxygen and hydrogen atoms, respectively. The vertical axis shows the probability distribution function (PDF); (b) at various pressures from 0.1 MPa to 10 MPa, 300 K, and 0 V/nm (top) and 1 V/nm (bottom).

Figure 3.
Average dipole moment of water molecules in a CNT in the axial direction (): (a) at various temperatures from 200 K to 350 K, 0.1 MPa, and 0 V/nm (top) and 1 V/nm (bottom); (b) at 0.1 MPa to 10 MPa, 300 K, and 0 V/nm (top) and 1 V/nm (bottom).
Figure 3.
Average dipole moment of water molecules in a CNT in the axial direction (): (a) at various temperatures from 200 K to 350 K, 0.1 MPa, and 0 V/nm (top) and 1 V/nm (bottom); (b) at 0.1 MPa to 10 MPa, 300 K, and 0 V/nm (top) and 1 V/nm (bottom).

Figure 4.
Radial density of oxygen atoms in an CNT: (a) at various temperatures of 200 K to 350 K and constant pressure at 0.1 MPa. The applied electric field strengths are 0 V/nm (top) and 1 V/nm (bottom); (b) at various pressures of 0.1 MPa to 10 MPa, constant temperature of 300 K, under applied electric fields of 0 V/nm (top) and 1 V/nm (bottom). is at the axis of the CNT.

Figure 5.
Structures of water molecules in an CNT: (a) at K and 350 K, MPa, and V/nm and 1 V/nm; (b) at MPa and 10 MPa, K, and V/nm and 1 V/nm. Under an applied electric field, the structure of water in the CNT is the same at all simulated temperatures and pressures. The structure differs from that in the absence of an electric field.
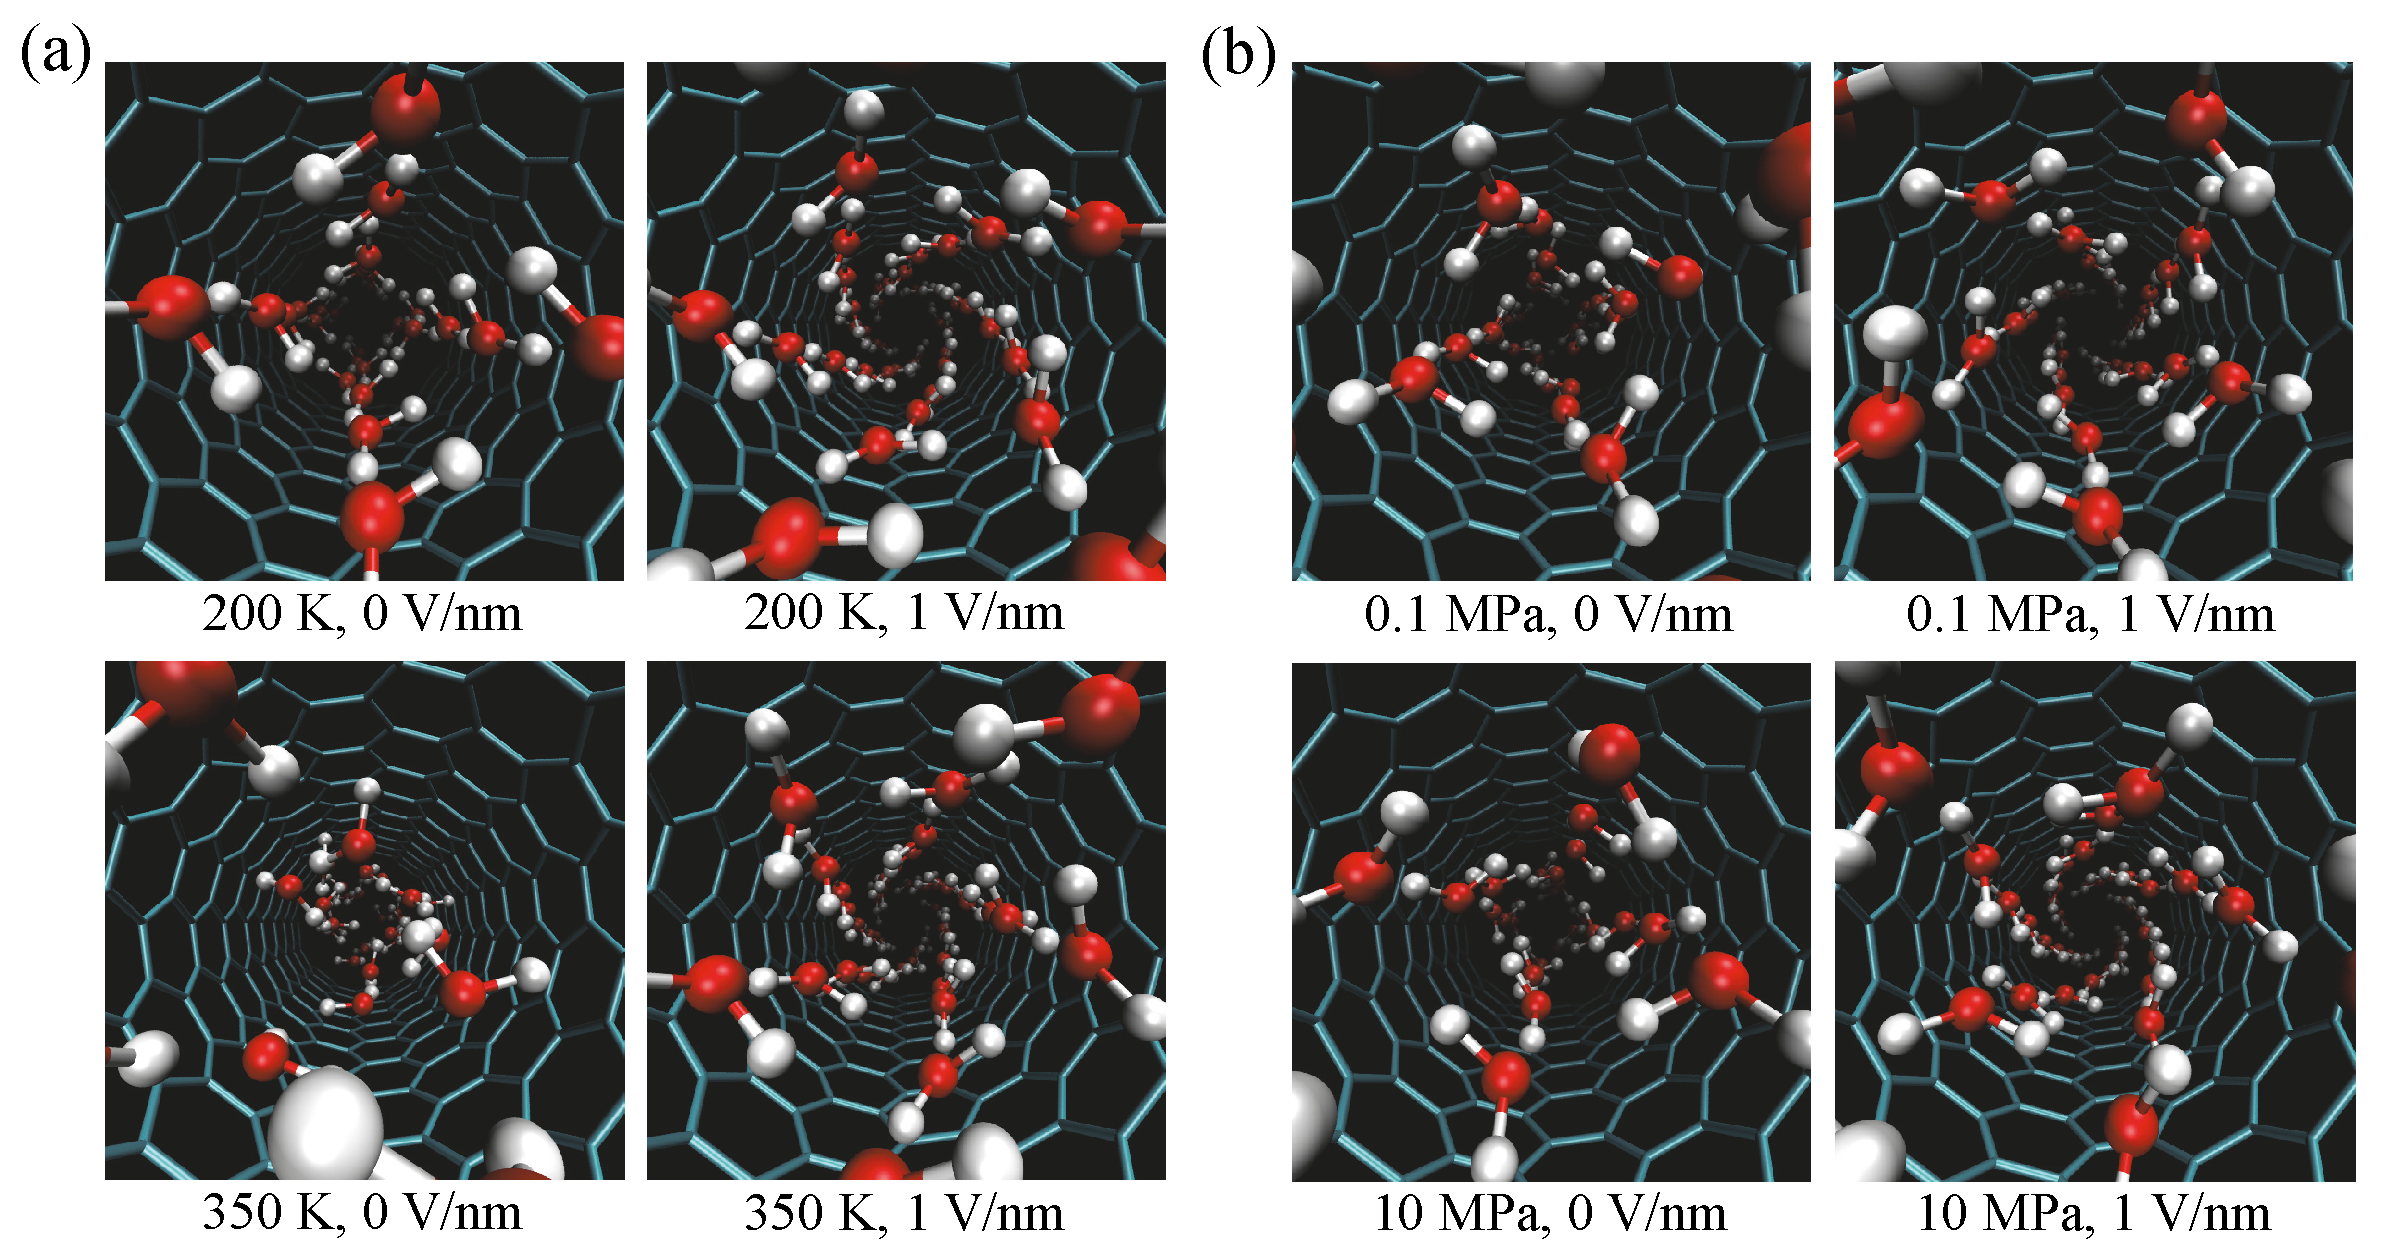
Figure 6.
Two-dimensional structures of water molecules in an CNT at 200 K, 0.1 MPa, and: (a) E = 0 V/nm; (b) E = 1 V/nm.
Figure 6.
Two-dimensional structures of water molecules in an CNT at 200 K, 0.1 MPa, and: (a) E = 0 V/nm; (b) E = 1 V/nm.

Figure 7.
Hydrogen bond autocorrelation functions of water molecules in an CNT: (a) at various temperatures of 200 K to 350 K, constant pressure of 0.1 MPa, and under applied electric fields of 0 V/nm (top) and 1 V/nm (bottom); (b) at various pressures of 0.1 MPa to 10 MPa, constant temperature of 300 K, and under applied fields of 0 V/nm (top) and 1 V/nm (bottom).

Table 1.
Structures of water molecules in an carbon nanotube (CNT) at various temperatures from 200 K to 350 K, at a constant pressure at 0.1 MPa. The electric fields are 0 V/nm and 1 V/nm.
Table 1.
Structures of water molecules in an carbon nanotube (CNT) at various temperatures from 200 K to 350 K, at a constant pressure at 0.1 MPa. The electric fields are 0 V/nm and 1 V/nm.
| Temperature (K) | Structure at 0 V/nm | Structure at 1 V/nm |
|---|---|---|
| 200 | ||
| 250 | ||
| 300 | , disorder | |
| 350 | disorder |
Table 2.
Structures of water molecules in an CNT at various pressures from 0.1 MPa to 10 MPa, at a constant temperature of 300 K. The electric fields are 0 V/nm and 1 V/nm.
Table 2.
Structures of water molecules in an CNT at various pressures from 0.1 MPa to 10 MPa, at a constant temperature of 300 K. The electric fields are 0 V/nm and 1 V/nm.
| Pressure (MPa) | Structure at 0 V/nm | Structure at 1 V/nm |
|---|---|---|
| 0.1 | , disorder | |
| 1 | , disorder | |
| 10 | , disorder |
Table 3.
Average potential energy per water molecule in the reservoirs and in the CNT. is the difference between the potential energies in the CNT () and in the reservoirs (), . The simulation conditions are K and 250 K, MPa, under applied electric fields of V/nm and 1 V/nm.
Table 3.
Average potential energy per water molecule in the reservoirs and in the CNT. is the difference between the potential energies in the CNT () and in the reservoirs (), . The simulation conditions are K and 250 K, MPa, under applied electric fields of V/nm and 1 V/nm.
| T (K) | E [V/nm] | Energy (U) | In Reservoir [kJ/mol] | In CNT [kJ/mol] | [kJ/mol] |
|---|---|---|---|---|---|
| 200 | 0 | LJ | 19.57 | 4.71 | –14.86 |
| Coulomb | –115.35 | –100.49 | 14.86 | ||
| 1 | LJ | 19.51 | 17.98 | –1.53 | |
| Coulomb | –114.94 | –124.96 | –10.02 | ||
| Dipole | –1.11 | –4.26 | –3.15 | ||
| 250 | 0 | LJ | 16.38 | 5.12 | –11.26 |
| Coulomb | –105.46 | –96.93 | 8.53 | ||
| 1 | LJ | 16.46 | 16.59 | 0.13 | |
| Coulomb | –105.45 | –121.04 | –15.59 | ||
| Dipole | –1.09 | –4.24 | –3.15 |
Table 4.
Average the Lennard–Jones (LJ) potential energy for the water–water interaction () and water–CNT interaction () per water molecule, in the reservoirs and in the CNT. is the difference between the potential energies in the CNT () and in the reservoirs (), .
Table 4.
Average the Lennard–Jones (LJ) potential energy for the water–water interaction () and water–CNT interaction () per water molecule, in the reservoirs and in the CNT. is the difference between the potential energies in the CNT () and in the reservoirs (), .
| T (K) | E [V/nm] | Energy (U) | In Reservoir [kJ/mol] | In CNT [kJ/mol] | [kJ/mol] |
|---|---|---|---|---|---|
| 200 | 0 | 19.57 | 18.47 | –1.1 | |
| 0 | –13.51 | –13.51 | |||
| 1 | 19.51 | 30.21 | 10.7 | ||
| 0 | –11.97 | –11.97 | |||
| 250 | 0 | 16.38 | 18.70 | 2.32 | |
| 0 | –13.33 | –13.33 | |||
| 1 | 16.46 | 28.73 | 12.27 | ||
| 0 | –11.85 | –11.85 |
© 2017 by the authors. Licensee MDPI, Basel, Switzerland. This article is an open access article distributed under the terms and conditions of the Creative Commons Attribution (CC BY) license (http://creativecommons.org/licenses/by/4.0/).
Share and Cite
MDPI and ACS Style
Winarto; Yamamoto, E.; Yasuoka, K. Water Molecules in a Carbon Nanotube under an Applied Electric Field at Various Temperatures and Pressures. Water 2017, 9, 473. https://doi.org/10.3390/w9070473
AMA Style
Winarto, Yamamoto E, Yasuoka K. Water Molecules in a Carbon Nanotube under an Applied Electric Field at Various Temperatures and Pressures. Water. 2017; 9(7):473. https://doi.org/10.3390/w9070473
Chicago/Turabian StyleWinarto, Eiji Yamamoto, and Kenji Yasuoka. 2017. "Water Molecules in a Carbon Nanotube under an Applied Electric Field at Various Temperatures and Pressures" Water 9, no. 7: 473. https://doi.org/10.3390/w9070473
Note that from the first issue of 2016, this journal uses article numbers instead of page numbers. See further details here.