1. Introduction
Water, with its anomalous physical and chemical properties, surpasses all other natural substances on Earth. Ancient philosophers considered water the most vital component of matter. Importantly, being a universal polar solvent for hydrophilic molecules having an affinity for water, the substance performs a major role in numerous biochemical and metabolic processes within cells.
A closer view of a water molecule will reveal a structure with an electric and a magnetic field in the vicinity of the atoms of O and H. Multiple water molecules then create complex, dynamic aggregates exhibiting specific electromagnetic field distribution, which characterizes the macroscopic physical and chemical properties of water. The central task within the related investigation is to perform experimental measurement of water via multiple methods exploiting various physical and chemical principles.
The conductivity of water is discussed in general terms by Moore et al. [
1]. Importantly, little or no relevant research has been conducted to date in terms of describing the impact of a spiral “gradient” magnetic field on the ion conductivity of water. The results presented within this paper were obtained from real measuring cycles and embody a unique data set.
A similar but not identical problem was analyzed by several authors. In this context, for example, Vlachova-Hutova et al. and Cefalas et al. [
2,
3] discuss theoretically the influence of a static field on the behavior of a quantum mechanical model of matter (our practical research, however, prominently focuses on a spiral “gradient” magnetic field).
Elia et al. [
4,
5] present experimental results on the physico-chemical properties (electrical conductivity and density) of pure, twice distilled water, subjected to iterative filtering through Pyrex glass filters. After such treatment, the electrical conductivity increased by two orders of magnitude, and the density showed variations in the fourth decimal digit. The results highlight the importance of the number of iterations, the dimension of filter pores, and the volume of filtered water.
Lo et al. [
6,
7] investigate the properties of stable rigid structures (referred to as IE structures, denoting ice formed under an electric field) developed from water molecules at room temperature and normal pressure. The related experiments show that ultra-small amounts of acid, base, or salt can induce stable rigid IE structures in water; these IE structures have UV (ultraviolet) transmission characteristics different from pure water. The corresponding transmission electron microscope images confirm the idea that these IE structures are made up of electric dipoles. In the given context, IE structures also exhibit other interesting physical properties. Compared to normal water, there is an approximate 20% decrease in the dielectric constant for IE water within the MHz band and an increase of the electromagnetic frequency generated by IE water between two identical stainless steel electrodes, and an increased in resistivity to AC (Alternating Current). Fluorescence at the peak of 298 nm is observed in IE water but not in ordinary water.
This paper discusses experimental verification of changes in the structures of a liquid water sample inserted in a special spiral “gradient” magnetic field. The magnetic flux components are characterized by a high degree of inhomogeneity; thus, a gradient is found in the monitored section of space. The relevant measurement of the modified, rearranged water sample pointed to a specific ion conductivity lower than that of the untreated water.
2. Materials and Methods
The present chapter characterizes the water samples used in the experiment, the distribution of the spiral gradient magnetic field into which the samples were inserted, and the method for the water conductivity measurement.
2.1. Materials: Preparing the Water Samples
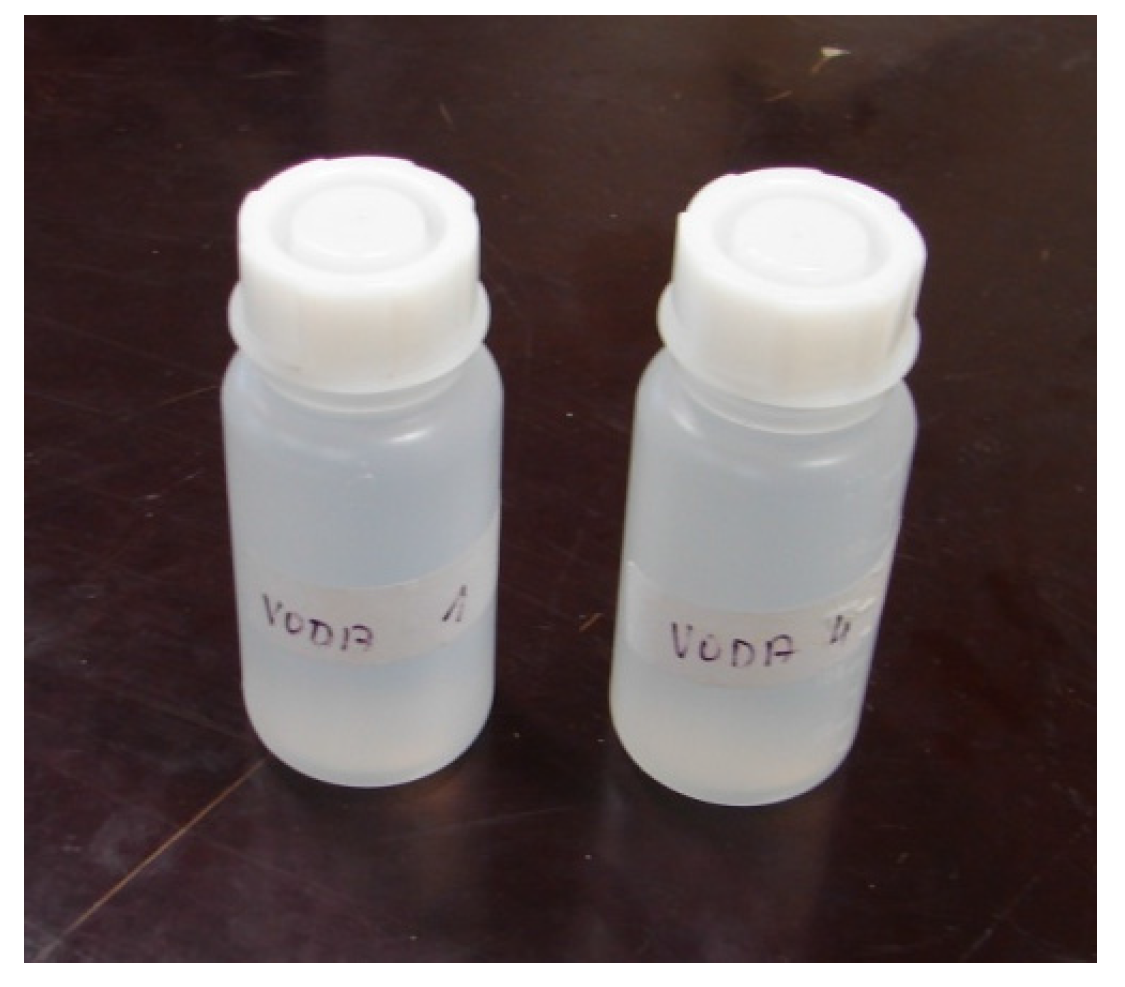
To measure the electrical parameters of water, we prepared two water samples, storing each of these in two PE (polyethylene) vials (BDL, Turnov, Czech Republic). The reference item comprised water untreated with a magnetic field, while the other sample was modified in the given manner, using the configuration of permanent magnets (
Figure 1). The experiment utilized demineralized water produced by the applied AQUA OSMOTIC 02 system (Tisnov, Czech Republic). The device exploits mechanical filtering, carbon filter filtering, demineralization based on reverse osmosis, and secondary treatment with an ion exchanger (a mixture of cation and anion-exchange resins).
The chemistry of the water before the treatment with the AQUA OSMOTIC 02 system is presented in
Table 1. According to the manufacturer, the system will eliminate more than 90% of each element or component indicated in
Table 1.
The PE vials (250 mL) were rinsed five times using demineralized water from a container (25 L); subsequently, for measurement purposes, four PE vials were filled with demineralized water and sealed (
Figure 1). Both the samples acquired from the AQUA OSMOTIC system exhibited the conductivity of 1.2048 μS/cm.
2.2. Magnetic Field to Facilitate the Water Treatment
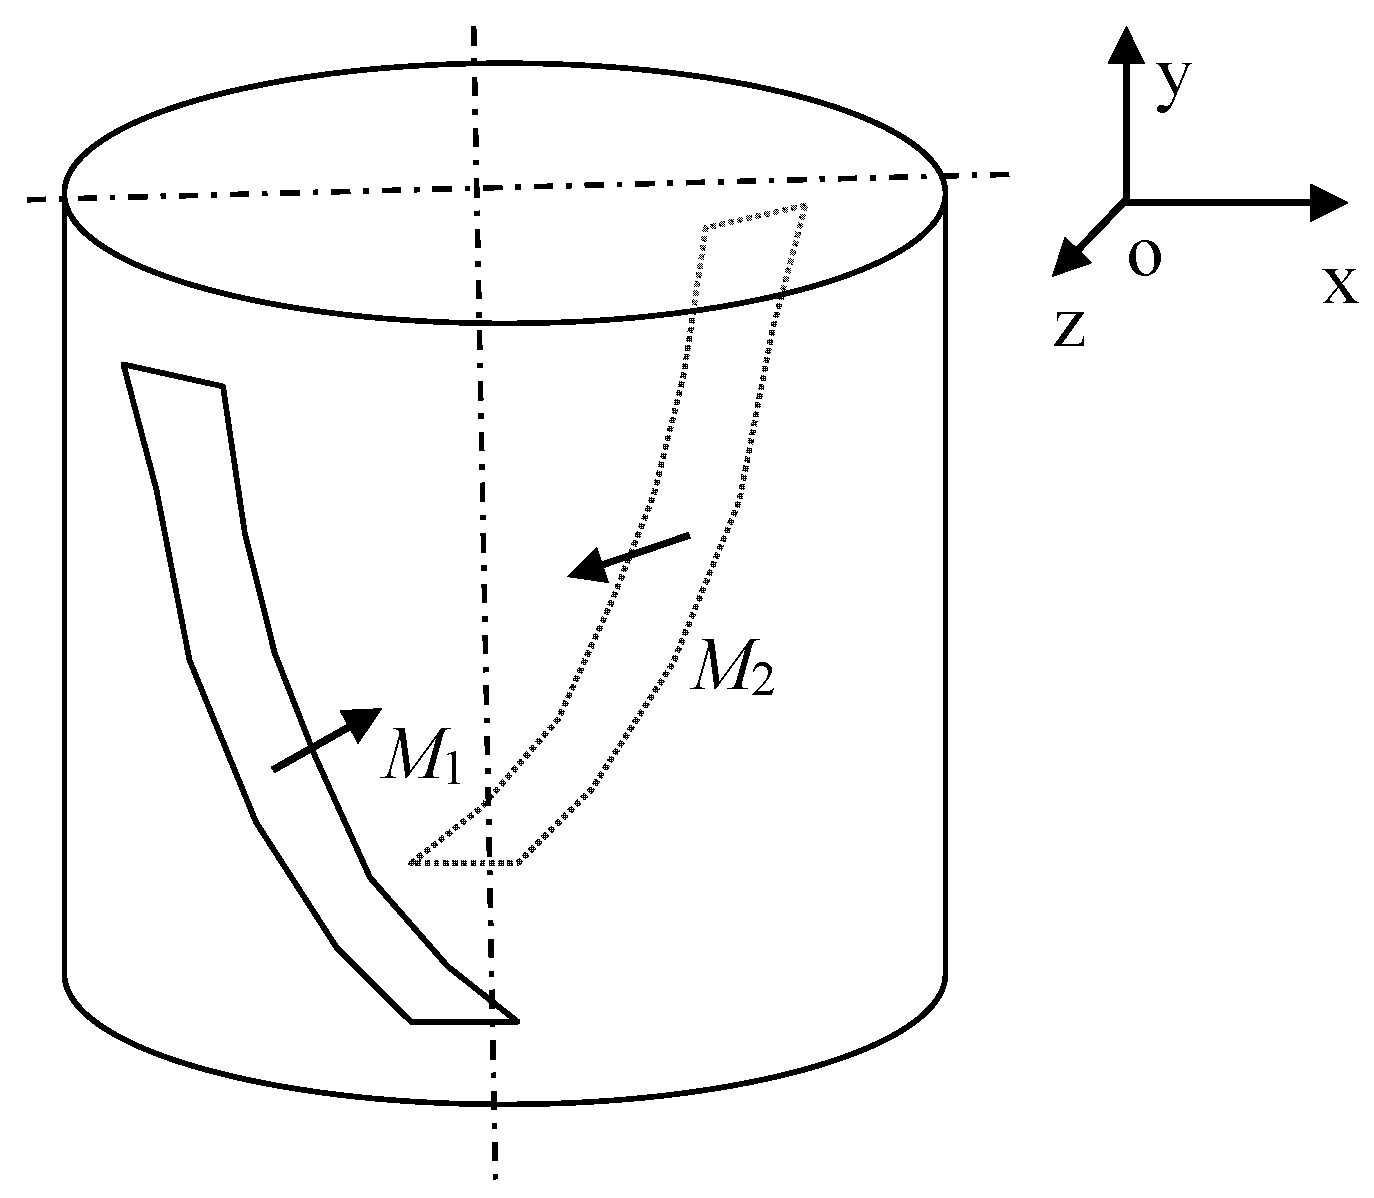
For treatment purposes, we generated a spiral magnetic field having a geometrical configuration as shown in
Figure 2. The arrangement comprises two flexible plastic permanent magnets (PM) with the magnetization orientation denoted by
M1 and
M2, as indicated in
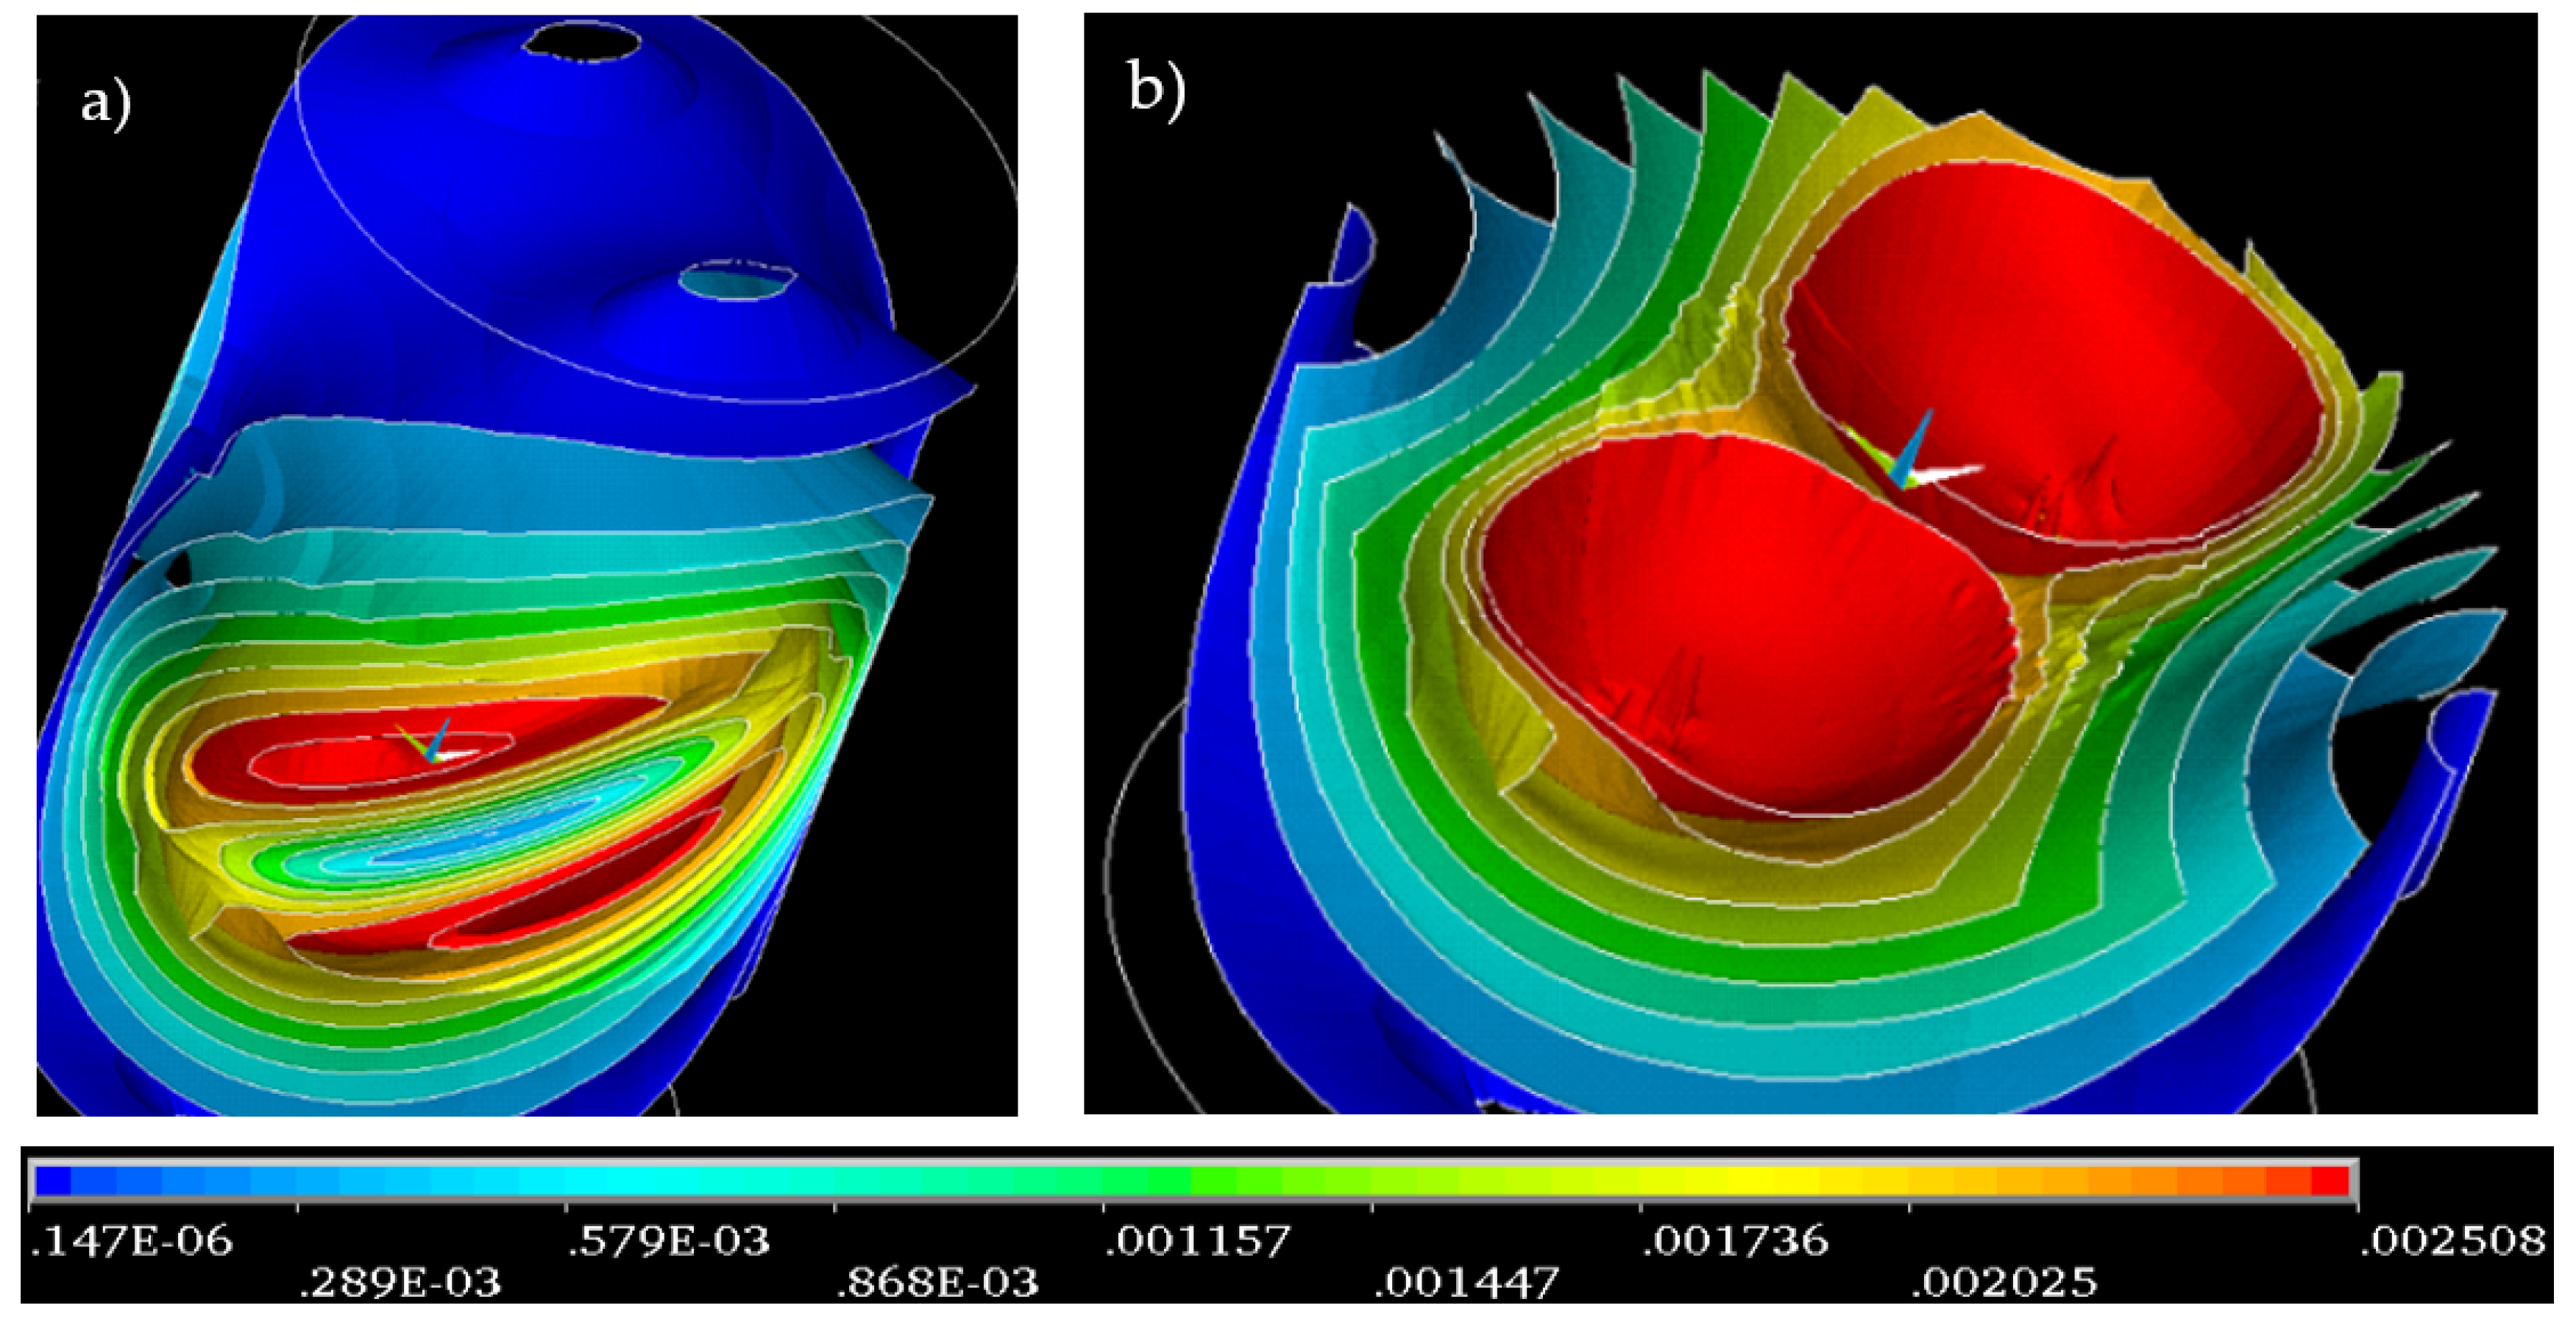
Figure 2. The magnetic field thus preset then produces, inside the configuration space, a gradient magnetic field. The distribution of the field, which corresponds to the geometry in
Figure 2 without an inserted water sample, is represented in
Figure 3.
2.3. Treating the Water Samples with a Spiral Gradient Magnetic Field
One of the water samples held in a pair of sealed PE vials was placed in the center of the above-discussed “gradient” magnetic field and kept at the location for 5 min (the period of time to enable a change in both the arrangement of the molecules and the conductivity of the applied water; no variation in the given sense could occur in a sample left within the field for more than 5 min). The other, or reference, sample (also contained in two PE vials) was positioned at the distance of 4 m from the magnet in an air-conditioned laboratory where the temperature corresponded to 24.7 °C. During the water treatment procedure, we carefully avoided exposing all the samples to the effects of the magnetic field and intensive shaking as both these factors could influence the dynamic arrangement of the water molecules.
2.4. Conductivity Measurement Using a Potentiostat
The electrical conductivities of the water samples (treated and untreated) were measured with a potentiostat after the five-minute contact with the PE containers.
Electrical conductivity constitutes the most important physical quantity affecting the complex permittivity of water, and it is associated with the imaginary part of the complex permittivity. Conductivity effects on the capacitance measurement of water liquids using a cylindrical capacitive sensor are investigated in [
8]; the authors of the paper propose that the measured capacitance rises with increasing electrical conductivity. Other selected studies [
9,
10] compare invasive and non-invasive cylindrical capacitive sensors for the electrical measurement of different water solutions and mixtures, asserting that reactance capacitance is the dominating term in the measurement of capacitance for invasive cylindrical capacitive sensors.
The normal and modified types of water constitute dynamic systems. Each measurement of the conductance or other properties of the water requires us to supply the dynamic system with energy and to assess its reaction with the selected physical quantity. The supplied energy, however, will influence the measured dynamic system; it is thus beneficial to utilize only minimum energy for the conductance measurement. For this purpose, we can advantageously employ electrochemical impedance spectroscopy and a potentiostat [
11,
12,
13,
14,
15,
16]. The latter tool separates the measured liquid sample from the voltage input signals in such a manner that the measurement is performed with merely minimal impact on the sample. Moreover, the potentiostat converts the current signals to voltage ones, which then facilitate the frequency response processing, and executes the impedance analysis. In general terms, impedance analysis is a very popular non-destructive measuring method providing diagnostic information on multiple electrochemical effects, including the charge transfer at the electrode–electrolyte boundary, reaction mechanisms, properties of electrode materials, battery charging status, and the stage of degradation of fuel cell catalysts [
11]. Electrochemical impedance spectrum is most often represented in the complex plane, using a Nyquist plot.
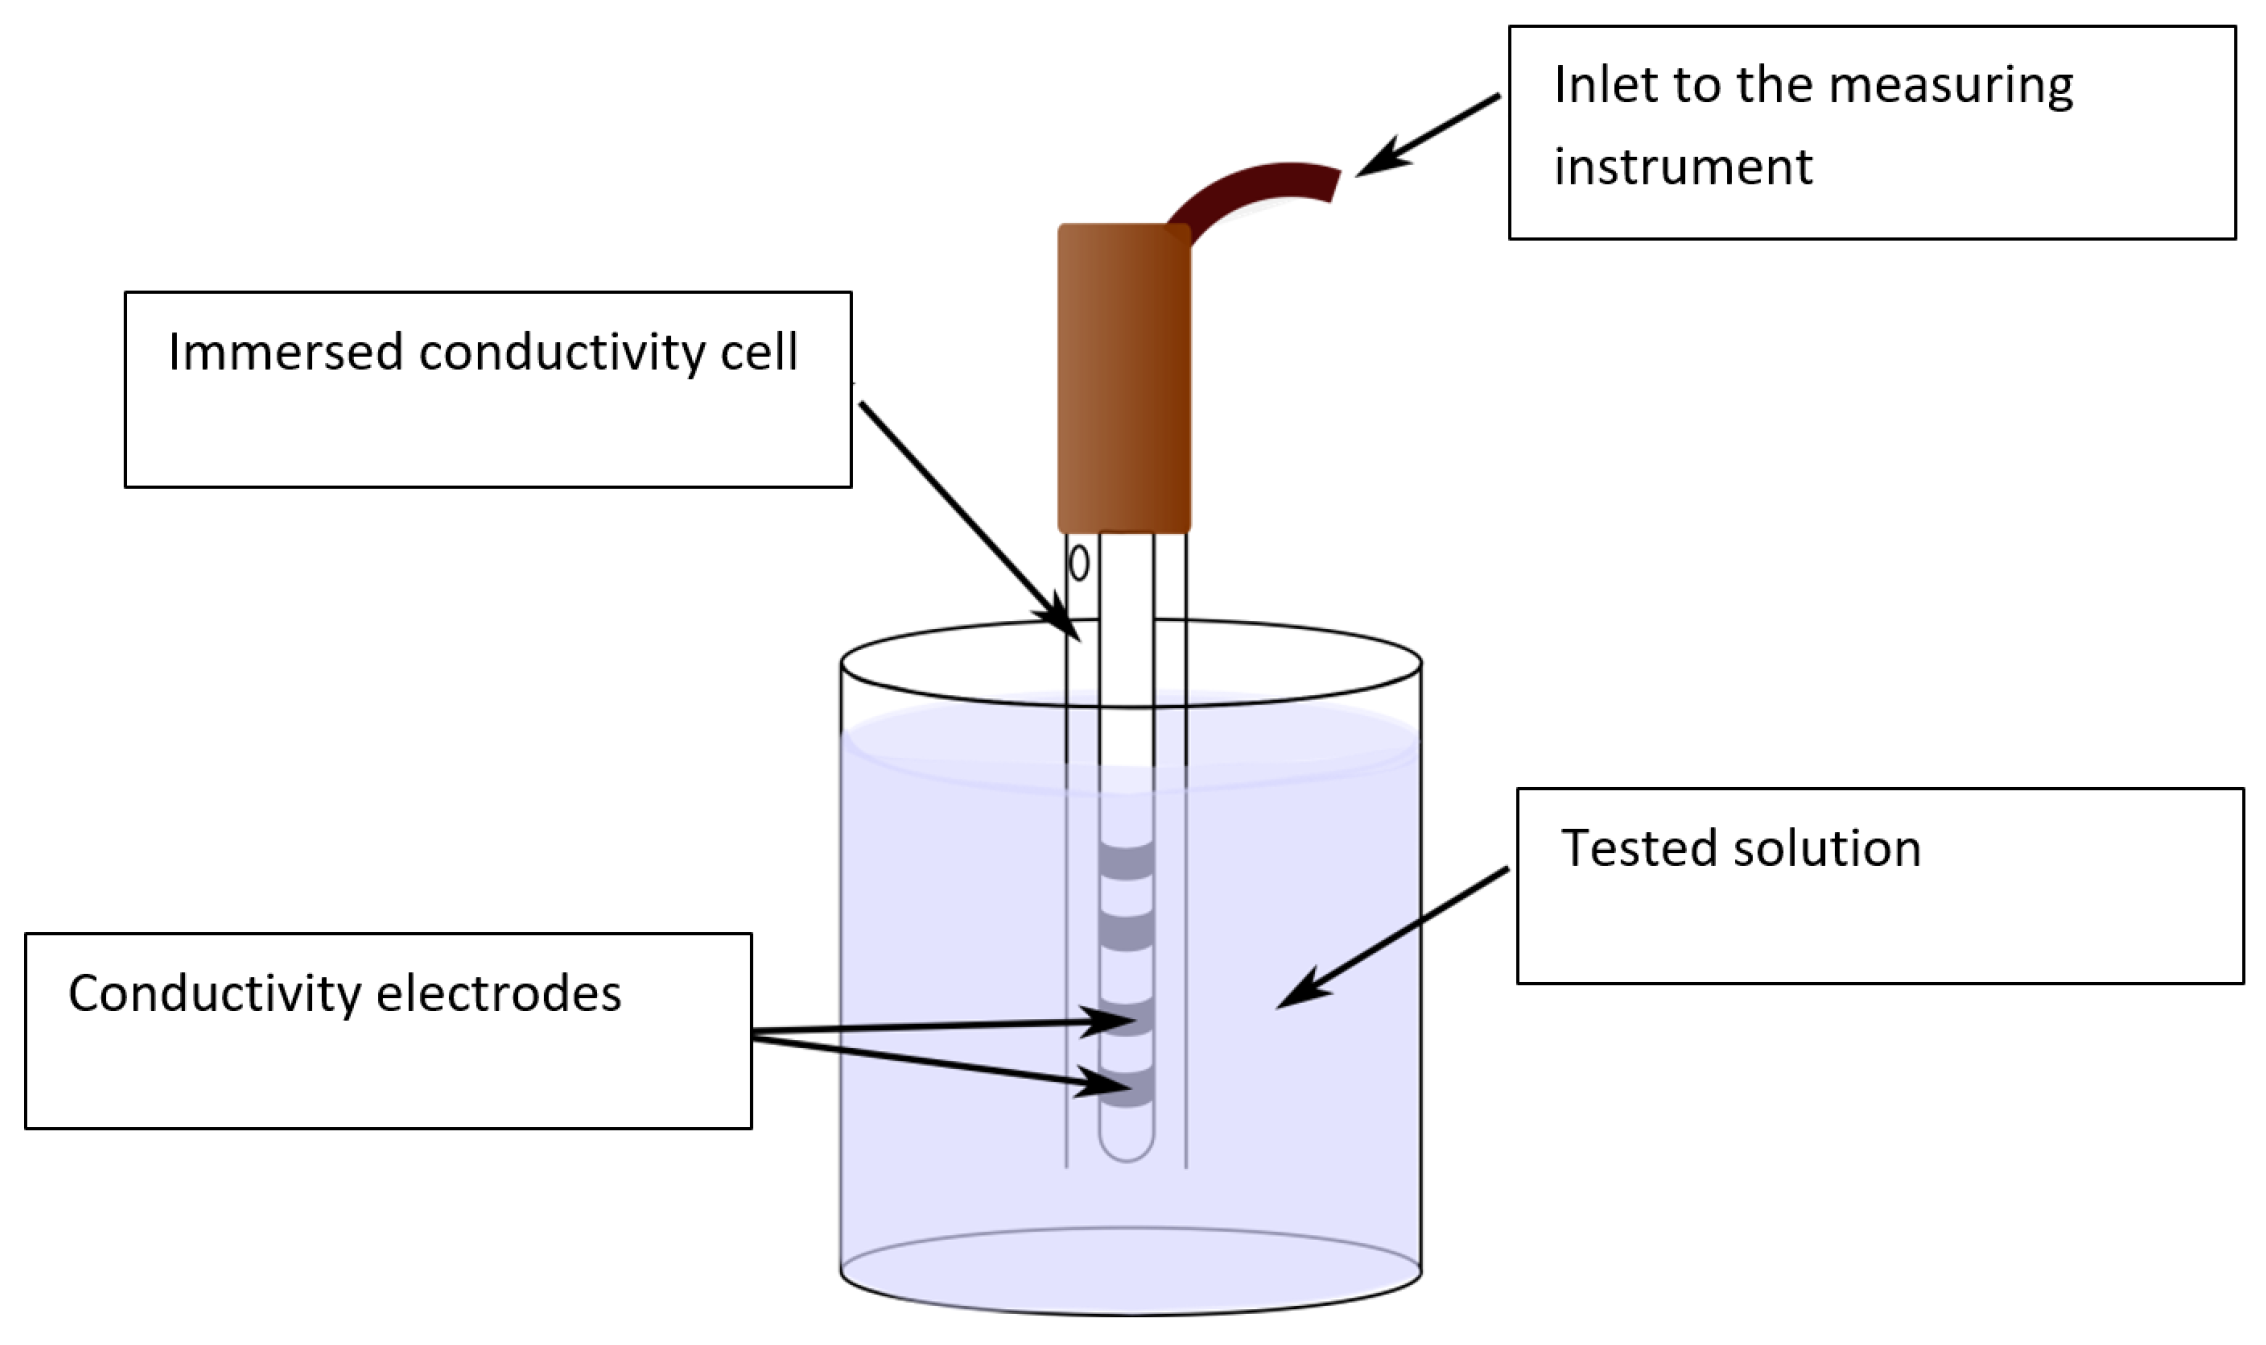
The water conductivity was measured with a ZU 6985 (ILABO, Kyjov, Czech Republic) four-electrode conductivity cell (
Figure 4), a device comprising a glass tube equipped with four platinum electrodes and a temperature sensor Pt1000. The measuring range corresponded to 1 µS, 1000 mS/cm; the constant of the cell equaled 1.19 cm
−1 ± 1%; and the temperature range was between −20.0 and +100 °C. The conductivity cell was connected to a VMP 3 potentiostat (BioLogic, Seyssinet-Pariset, France). To carry out the measurement, we employed the frequency band of between 500 kHz and 1 Hz, with the peak-to-peak voltage of
UP-P 500 mV. The potentiostat exhibited the resolution of 100 µV.
3. Results
The measuring series involved electrochemical impedance spectroscopy and the given potentiostat. Before each measurement of the liquid samples, we had to identify a suitable technique to clean the electrode systems such that the cycles showed the least possible degree of contamination by the previous tasks. Both of the four-electrode systems were cleaned via triple rinsing with demineralized water.
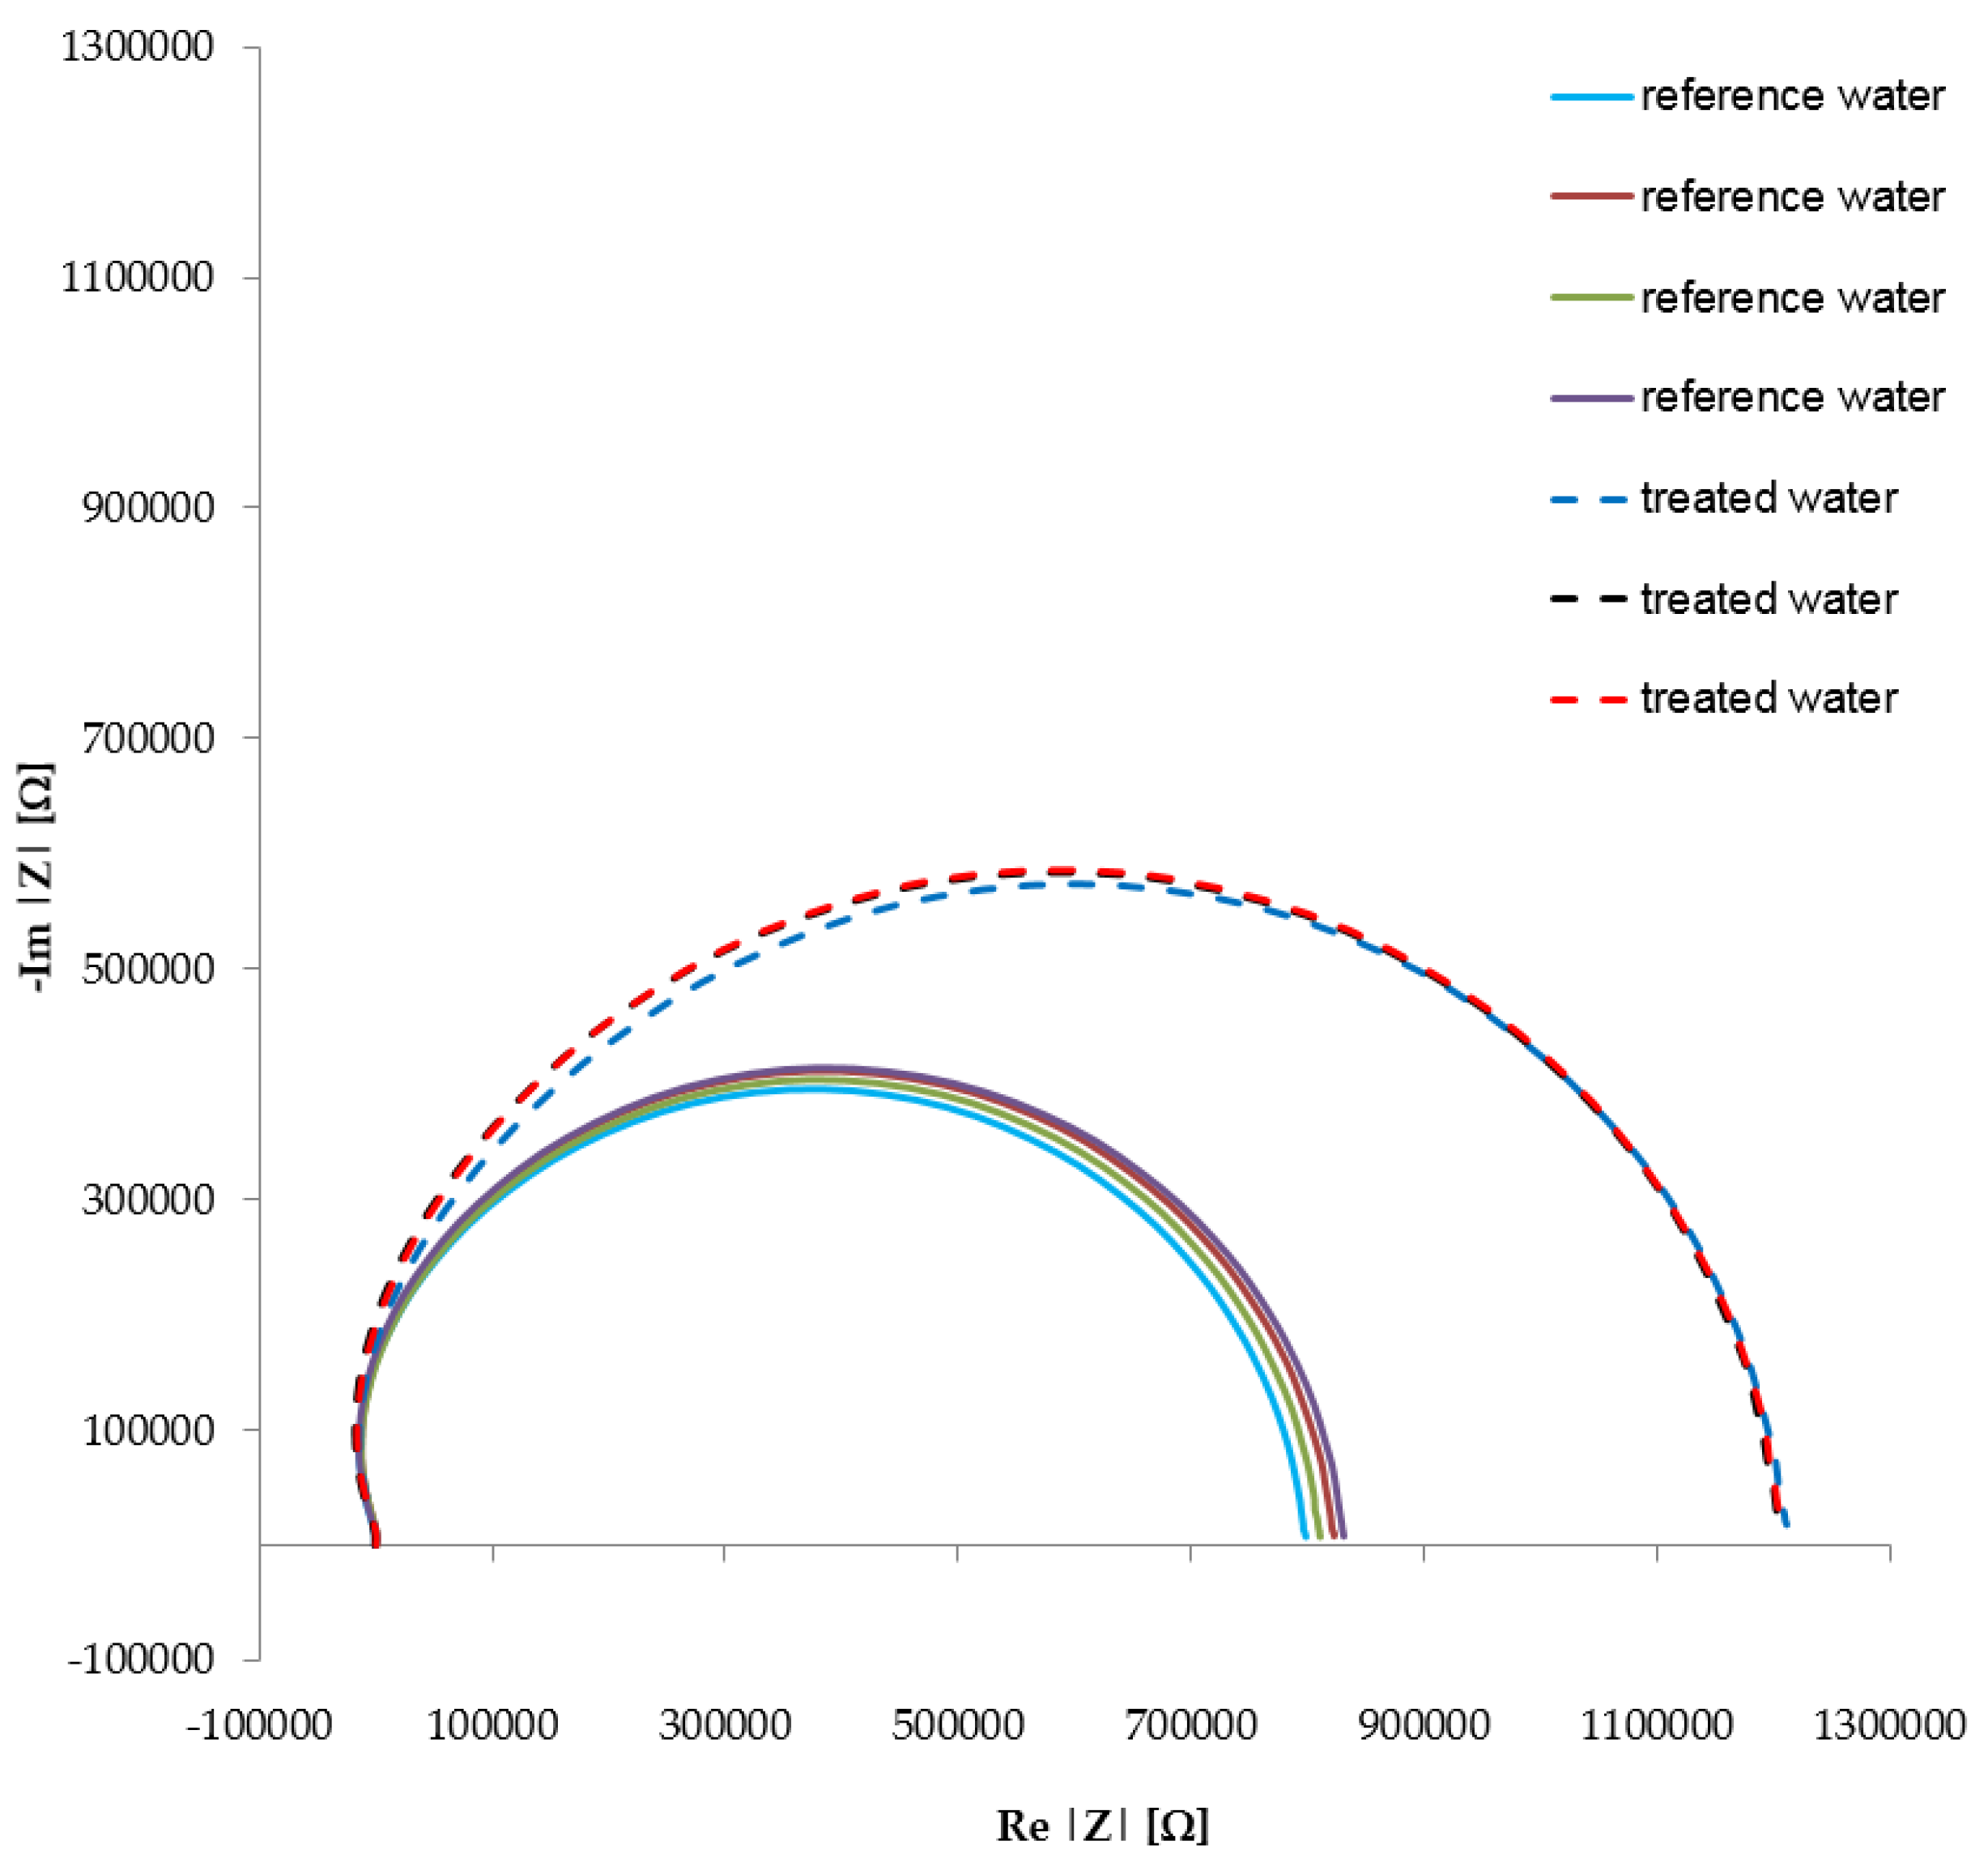
Ten measurement cycles with electrochemical impedance spectroscopy and the potentiostat were performed separately in the reference and treated water samples, within the frequency range of 1 Hz–500 kHz. After measuring the impedance spectrum of the reference water, we extracted the probe, mechanically eliminated the remaining liquid via centrifugal force, and measured the impedance spectrum of the treated water. The procedure was repeated ten times. The results yielded from the measurement of the impedance spectra of the treated and reference samples are shown in the
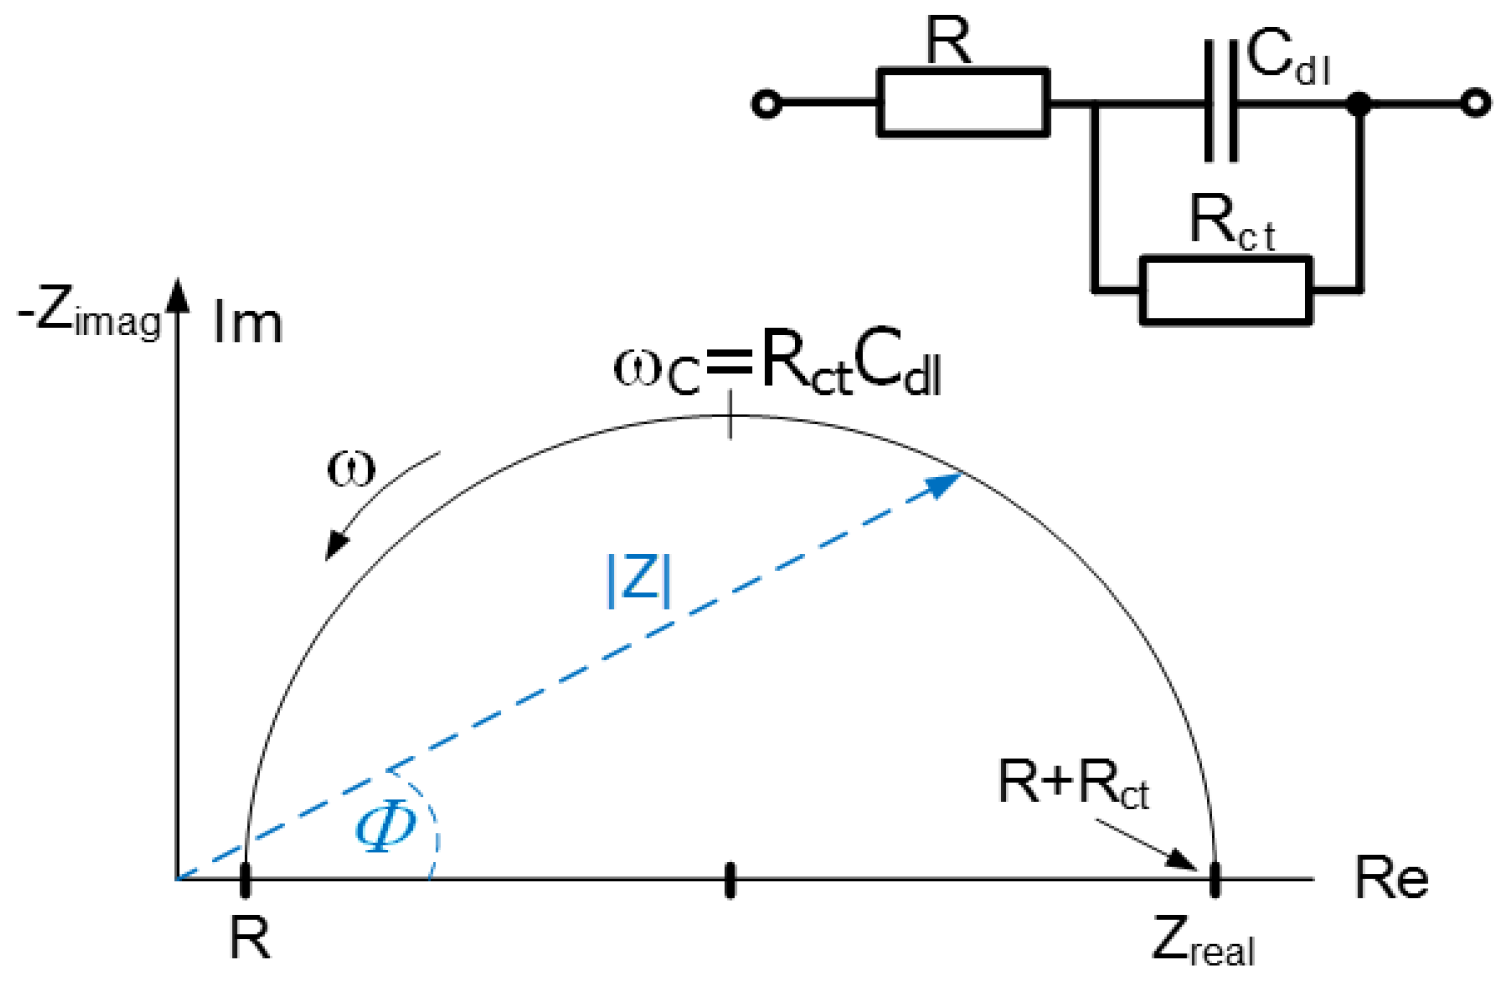
Figure 5 (for simplicity, the diagram displays only seven curves; the remaining three follow the paths of some of the seven curves shown). The
Figure 6 introduces the equivalent circuit diagram of the impedance characteristics to calculate the specific conductance in the measured samples. The results of the impedance analysis of the obtained data and the measurement conditions are summarized in
Table 2 and
Table 3.
4. Discussion
Table 2 indicates that the resistivity of the treated water increases by approximately 50% compared to the reference sample. This variation may arise from a change in the configuration of the particles and the altered electromagnetic field in the vicinity of the water molecules. The ions inducing the water conductivity may become more closely bound to the cluster structure of the molecules. To verify the detected impact of the spiral gradient magnetic field on the water, we performed another measurement cycle, using a different method at a different time and employing samples of partially demineralized water. This procedure, too, yielded a result where the water resistivity is changed by about 50%.
A comparison of the obtained results with those achieved by other researchers will reveal that the conductivity changes produced through the gradient magnetic field applied in our experiment are more pronounced. At this point in the given context, we can refer to the investigation by L. Boulanger [
17], whose measurement of pure water showed a conductivity increase of 10% due to a weak frequency (3.4 kHz) electrical voltage (5 V). Further, Holysz et al. [
18,
19] proved that a magnetic field exerts an influence on the conductivity and evaporation rate of water. This effect can be interpreted on the basis of stronger hydrogen bonds and gas/liquid interface perturbation. The related articles [
18,
19] then indicate that the authors reached a change of only 5% in the conductivity of pure water.
Interesting results comprising, above all, a major conductivity variation, are presented by Levchuk and Levin [
20], who established that the 48-hour long exposure of 7 M NH
4OH solutions containing 1 g/L tungsten or rhenium to a 60 mT magnetic field increases the electrical conductivity of such solutions by 53%–56%, considering the ambient temperature of 20 °C. These researchers did not perform their experiments on
pure water; however, a static magnetic field would presumably cause an increase not exceeding 5%, a rate already proposed within reports [
18,
19].
Our experiments demonstrated the scientifically interesting influence of the spiral gradient magnetic field having the geometry and distribution shown in
Figure 2 and
Figure 3, respectively. Such a field is capable of markedly reducing the conductivity of normal or demineralized water, ensuring a result not obtainable via the methods employed within the above-discussed studies.
The outcomes of the experiment contribute towards an improved physical description of the interaction of water molecules and a magnetic field; the established values are also of major importance for the numerical modeling of the conductivity changes occurring after the insertion of a sample in the given magnetic field.
5. Conclusions
The experimental results show that exposing a sample of demineralized water to a spiral “gradient” magnetic field for the period of 5 min will result in decreased ion conductivity of the water. The changed water conductivity is probably due to both a variation in the arrangement of the water molecules and the altered electromagnetic field in their vicinity. The ions inducing the water conductivity may become more closely bound to the cluster structure of the molecules. The variation in the conductivity of the examined water samples caused by the applied spiral magnetic field was verified via another measurement method employed at a different time, using partially demineralized water.
The time stability of the structural change of the molecules was not monitored; however, the repeated measurements did not exhibit any signs of the original arrangement being restored. In this context, we did not detect variation in the physical, mechanical, and chemical parameters of the water. With respect to the discussion presented herein, we can propose that the examined effect is not easily explainable, and the related problems will be analyzed in further research.


