Phosphorus Dynamics along River Continuum during Typhoon Storm Events


1
Center for Sustainable Technology and Environment (CSTEN), Universiti Tenaga Nasional (UNITEN), 43000 Kajang, Selangor, Malaysia
2
Department of Geography, National Taiwan University, Taipei 10617, Taiwan
3
Research Center for Environmental Changes, Academia Sinica, Taipei 115, Taiwan
*
Author to whom correspondence should be addressed.
Water 2017, 9(7), 537; https://doi.org/10.3390/w9070537
Submission received: 11 February 2017
/
Revised: 10 July 2017
/
Accepted: 14 July 2017
/
Published: 18 July 2017
Abstract
:Information on riverine phosphorus (P) dynamics during typhoon storm events remains scarce in subtropical regions. Thus, this study investigates the spatial and temporal dynamics of riverine phosphorus in a headwater catchment during three typhoon events. Continuous sampling (3 h intervals) of stormwater samples and discharge data were conducted at five locations, which represent the upstream, transitional zone, and downstream areas of the main inflow river. The results revealed that the average event mean concentrations (EMCs) for total dissolved phosphorus (TDP) and particulate phosphorus (PP) in the upstream catchment of Fei-Tsui reservoir were 15.66 μg/L and 11.94 μg/L, respectively. There was at least a 1.3-fold increase in flow-weighted concentrations of TDP and PP from the upper to lower reaches of the main stream. PP and TDP were transported either in clockwise or anticlockwise directions, depending on storm intensity and source. The transport of TDP was primarily regulated by the subsurface flow during the storm event. Soluble reactive phosphorus (SRP) contributes more than 50% of the TDP load in moderate storms, while extreme storms supply a greater dissolved organic phosphorus (DOP) load into the stream. TDP accounted for approximately 50% of TP load during typhoon storms. Mobilization of all P forms was observed from upstream to downstream of the river, except for DOP. A decrease of DOP load on passing downstream may reflect the change in phosphorus form along the river continuum. Peak discharge and antecedent dry days are correlated positively with P fluxes, indicating that river bank erosion and re-suspension of within-channel sediment are the dominant pathways of P during typhoon storm periods.
1. Introduction
Phosphorus is considered as one of the limiting nutrients to primary production in most freshwater aquatic systems. However, excessive phosphorus (P) in an aquatic system will cause eutrophication, contamination of aquatic sediments, and will lead to deterioration of water quality [1]. Generally, phosphorus is present in freshwater systems in three forms: as soluble reactive phosphorus (SRP), dissolved organic phosphorus (DOP), and particulate phosphorus (PP) [2]. Total phosphorus (TP) is referred to the sum of total dissolved phosphorus (TDP) and PP. Most studies have reported the P concentrations as TP and SRP, due to the easy measurement in water samples [3,4,5], but only limited studies report PP concentration [6]. In fact, SRP generally represents less than 50% of total P export in watersheds [4,7]. At a terrestrial scale, previous estimates of global flows of P transported by rivers are about 18.7–31.4 Tg·year−1 [1,8], of which only a small fraction (2 Tg·year−1) is in dissolved form [9]. Numerous studies have indicated that most P export occurs in surface runoff and soil erosion during high flow periods [10,11,12,13,14,15,16,17,18], although subsurface flow and tile drainage may account for a significant proportion of P loss [19]. At an annual scale, most P is exported in a small number of large storm events [13,16]. Lee et al. [20] found that typhoon runoff contributed about 47–80% to annual P export in Taiwan. Study by Chen et al. [17] also indicated that PP concentrations dominated TP export during periods of high water transport. Generally, the transport of dissolved inorganic phosphorus from terrestrial systems is likely limited without the heavy rain brought by typhoons to generate surface erosion. The phosphorus exists mostly as specific types; less than 5% is washed out, and more than 90% remains in the soil or groundwater [18]. Lee et al. [20] found that the intensive typhoon storm runoff will engender deeper irrigation that flushes out nitrate and phosphate stored in deeper soil into the nearby stream network. These studies have confirmed that typhoon storms are crucial in regulating the absolute amount of phosphorus discharges in the subtropical region.
The transport mechanism of P from catchment to stream during storm events depends on rainfall patterns, stream discharge, the relative importance of groundwater vs. runoff, agricultural practices, antecedent moisture conditions, land management operations, P concentration of eroded soils, and connectivity between source areas and the stream [11,13,21]. These governing factors influence the mechanisms of mobilization, pathways of transfer, and the complex biogeochemical processes occurring along the land–water continuum. PP may be transported via soil eroded from field slopes or channel banks, or re-suspension from stream sediments. Meanwhile, dissolved P may be transported through desorption process from mobilized sediments, surface runoff, and leaching [17]. The interpretation of P transfer mechanisms becomes more complex as the scale increases from the plot/hillslope scale to a larger catchment scale. Understanding the contributing source area and transport pathways of different P forms may be enhanced by studying the discharge-water quality hysteresis relationship during storm events. The hysteresis loop technique has been widely used over the past two decades as a mean of investigating the transport systems of water quality parameters, as well as catchment responses to hydrological events [11,16].
It was found that approximately 70% of extreme rain occurs in the typhoon season from July to October; 20% in the Mei-Yu season (May to June), and the other 10% in the remainder of the year [22]. The 1994–2009 period in Taiwan covered the most extreme rainfall events, and showed an increase in extreme rainfall of 150 mm·year−1 from the previous decadal period [23]. Various rainfall studies have shown a shift in distribution toward more intense rainfall events, i.e., less light rain and more heavy rain [24,25]. Changes in rainfall frequency and intensity are influenced by global warming due to changes in atmospheric water vapor and vertical motion [26]. These storm events significantly contribute to P export from catchment surface to stream and reservoir water body. Runoff mechanisms of phosphorus potentially vary significantly throughout the typhoon period as the storm runoff progresses with sequent peak discharges. The fate and transport of phosphorus, in aquatic environments triggered by storms associated with typhoons, are poorly understood due to difficulty and cost to acquire intensive water samples during events. Better understanding of typhoon impacts on the dissolved and particulate phosphorus will enhance understanding of the underlying mechanisms of P dynamics during prolonged storm events in subtropical regions. This information provides a scientific basis for developing site-specific P management strategies to reduce P loss and protect drinking water resources. Thus, the objectives of this study are to (1) quantify the magnitude of P transport from a headwater catchment during typhoon storm events; (2) investigate the P dynamics along river continuum; (3) and analyze the influence of hydrological factors on riverine P dynamics.
2. Materials and Methods
2.1. Study Site
The Fei-Tsui reservoir (121°34′ E, 24°54′ N) is located in the north of Taiwan, and is about 30 km from Taipei City. The reservoir has a catchment area of 303 km2, and a mean water depth of 40 m (maximum depth: 113.5 m at dam site). This reservoir is well protected from human activities, as it has served as the primary drinking water resource for Taipei City since the 1980s. The long-term mean air temperature was 23 °C (1981–2015), and annual mean rainfall was 3835.5 mm·year−1 (1987–2015), with 70% of extreme rainfall occurring in the typhoon season from June to October. The topography of the Fei-Tsui reservoir basin is steep, with 91%, 63%, and 25% of the land surface exceeding slope gradients of 10°, 20°, and 30°, respectively. The underlying geology is mainly dominated by argillite and slate with sandstone interbeds, while the soils are entisols and inceptisols, with high silt contents [14]. Bei-Shih River is the main inflow river of Fei-Tsui reservoir. The three tributaries of Xia-Keng-Zi, Dai-Yu, and Jin-Gua, discharge water into the Bei-Shih river at the upper catchment. Five sampling sites (S1, S2, S3, S4, and S5) were set up within the upstream catchment of Fei-Tsui reservoir. Some catchments were nested within the larger catchment, as shown in Figure 1. The detailed land use distributions for each monitored catchment are summarized in Table 1.
2.2. Field Sampling and Laboratory Analysis
Rainfall data was recorded using tipping bucket rain gauges (0.2 mm resolution) that distributed across the catchment (Figure 1). Rainfall and hydrological data at the Fei-Tsui reservoir catchment were obtained from Taipei Fei-Tsui Reservoir administration office. The Thiessen polygon method was used to calculate the mean rainfall amount in the catchment. Stream water level was measured at the catchment outlet using sensors. The stream water level was then converted to discharge by using the stage–discharge relationship curve developed from manual discharge measurements taken at the catchment outlet. The base flow water samples were manually collected biweekly at every catchment outlet between May and September 2012. In addition, stormwater samples were manually grabbed at 3 h intervals from five sampling sites along Bei-Shih river during the typhoon induced storm events. Water samples in this study were collected using a US DH-48 depth-integrated sampler. This method allows water from the entire water column to be collected in equal volumes, regardless of the particular velocity at different points in the water column. Traditionally, grab sampling (dipping a bottle into the stream near the surface) was used to get water samples from streams. However, this method has been found to under-represent suspended solids concentrations, because a sample of the entire water column is not collected. Depth-integrated sampling involved inserting a 500 mL plastic bottle into the sampler, and then lowering the sampler off the bridge using a long strap that tied securely to the handle of the sampler. The sampler was allowed to sink slowly to the streambed in one motion to fill the sample bottle. If the sample bottle did not fill in one motion, the sampler was raised and lowered slowly, until full. After that, the water samples were stored in the cooler with ice, and delivered immediately to the laboratory once the sampling was completed. All the collected water samples were analyzed for targeted water quality parameters. The filtered and unfiltered samples were analysed for TDP and TP, respectively, by means of acid digestion [27] followed by colorimetric determination using ascorbic acid and molybdate blue, as described by Murphy and Riley [28]. Particulate P (PP) was calculated as the difference between the TP and TDP concentrations. Aliquots of each sample were filtered (0.45 μm, Whatman GF/F) and analyzed for soluble reactive phosphorus (SRP). Dissolved organic phosphorus (DOP) level was calculated as the difference between TDP and SRP concentrations. In addition, the total suspended solids (TSS) was determined according to the standard method for water and wastewater. Experimental determination of volatile suspended solids (VSS) was performed by measuring the loss of weight of total suspended solids (TSS), after incineration in a laboratory oven at 550 °C. Meanwhile, non-volatile suspended solids (NVSS) was obtained via the subtraction of TSS and VSS.
2.3. Data Analysis
In this study, the P load in storm events was calculated by summing up the products of mean concentration between two consecutive samples, and cumulative discharge for each time interval between two samples. This approach was recommended by Vagstad et al. [29] as the most accurate method for load estimation of particulate materials during storm events. In the P fluxes estimation, P concentration is assumed to be evenly mixed in the entire cross section of the river. The P flux (kg P km−2 h−1) for each storm was calculated by normalized total P load (kg P) by catchment area (km) and duration of storm (h). The flow-weighted mean concentration, also known as event mean concentration (EMC), was calculated for all forms of P and other constituents, by using Equation (1):
where EMC is event mean concentration (mg/L), C is average flow-weighted concentration (mg/L), M is total pollutant mass (kg), V is total runoff volume (m3), Q(t) is time varying flow rate (m3/s); C(t) is time varying pollutant concentration (mg/L), and T is total duration of runoff (s).
2.4. Hysteresis Loop Analysis
Understanding of the catchment transport pathways activated during storm events can be enhanced by studying the changing relationship between discharge and water quality parameters during an individual storm event. Variations in the concentration of constituents in rivers during storms often result in a hysteresis effect, with different concentrations during the rising and falling limbs of the hydrograph [30]. When plotted, such concentration/discharge relationships result in a circular pattern that is referred to as a “hysteresis loop”. Analyses of concentration–discharge hysteresis have been widely used to discriminate diffuse and in-channel sources of sediments and phosphorus [30,31,32]. Seeger et al. [33] described three basic types of hysteresis loops: clockwise, counter-clockwise, and figure eight. A clockwise hysteresis loop is produced when the concentration is higher on the rising limb, while an anticlockwise loop is produced when the concentration is higher on the falling limb [30]. A figure-eight pattern is a combination of both clockwise and counter-clockwise loops, as shown in Figure 2.
3. Results
3.1. Storm Characteristics
Three storm events induced by typhoons Talim, Soala, and Tembin were monitored at the study area during June to August 2012, and the characteristics of these storms have been summarized in Table 2. Storm events are characterized in terms of total rainfall depth (Rdep), total rainfall duration (Rdur), mean rainfall intensity (I), mean discharge (Qave), peak discharge (Qpeak), antecedent dry day (ADD), and five-day antecedent precipitation index (API5). The monitored rainfall depths range from 34.5 to 922 mm, while intensities vary from 0.51 to 7.9 mm/h. The storms induced by typhoons Talim and Tembin were the moderate storms which recorded mean rainfall of 44.8 mm and 60.2 mm, respectively. The temporal changes in rainfalls and discharges at sampling site S4 during typhoons Talim, Soala, and Tembin, are shown in Figure 3(A1–A3). The storm induced by typhoon Talim was smaller, but longer in duration, than that of typhoon Tembin, and was accompanied by various temporal rainfall and runoff patterns, as shown in Figure 3(A1). The total rainfall depth induced by typhoon Soala was almost 12 times greater than that of typhoons Talim and Tembin. The storm produced a peak discharge of 115.68 m3·s−1 at sampling site S4 during typhoon Soala. All catchments had experienced two to three antecedent dry days before the storms induced by typhoon Talim. All catchments exhibited high values of API5, ranging from 116.5 mm to 227.8 mm, prior to the arrival of typhoon Soala. Catchment S5 has wetter soil conditions, with API5 value of 152.5 mm prior to typhoon Talim, compared to other catchments, with API5 values only ranging from 23.0 mm to 45.1 mm.
3.2. Flow-Weighted Phosphorus Concentrations and Fluxes
Flow-weighted concentrations (EMCs) for phosphorus and other constituents at all sampling sites are summarized in Table 3. The riverine P concentrations varied widely in both P forms and between storm events. The flow-weighted mean concentrations of TP for sites S1, S2, S3, S4, and S5 are 27.56 μg/L, 21.28 μg/L, 25.30 μg/L, 27.69 μg/L, and 27.12 μg/L, respectively. During the base-flow measurements, all P fractions were elevated when compared with the concentrations measured during the typhoon storm events at site S1. On the other hand, the flow-weighted TP and PP concentrations increased 1.2-fold and 2.0-fold, compared to base-flow measurements at site S2. All P fraction concentrations were lower in terms of storm runoff, compared to base-flow concentrations at site S3. In contrast, the TP fraction increased 1.1-fold of base-flow concentration at site S4. Chen and Wu [36] found that the concentrations for TP in the stormwater runoff were 0.86-fold of base-flow measurements at the same sampling site S4, from 1999 to 2000, respectively. Large differences between the P fractions were observed for the main stream site and the major tributaries. These results show the importance of re-suspension of phosphorus along the main stream, in delivering PP to the lowland section of the river. The TSS concentration in the base-flow measurement, is increasing from upstream tributaries to downstream sites. The TSS concentration at S4 was 2 times greater than that in the base-flow at site S1. However, the proportion of NVSS to TSS in base-flow is decreasing from 0.67 at S1, to 0.39 at S4. These results suggest that the volatile suspended solid (VSS) levels increase from upstream to downstream due to re-suspension along the main stream. Interestingly, the flow-weighted TSS concentration was observed to increase from S1 to S3, but decreased to nearly half at site S4. A similar result was observed for NVSS from upstream to downstream. This may explain the retention of TSS at the floodplain along the stream from S3 to S4. On average, the EMCs for TP, TDP, SRP, and PP in the upstream catchment of Fei-Tsui reservoir are 27.6 μg/L, 15.66 μg/L, 3.74 μg/L, and 11.94 μg/L, respectively. There is a 1.3, 1.3, 2.05, 1.3, and 1.25-fold increase in flow-weighted concentrations of TP, TDP, SRP, PP, and TSS, respectively, from the upper to lower reaches of the main stream in Fei-Tsui reservoir.
The phosphorus fluxes (kg·km−2) were calculated for all monitored storm events at every sampling site. The P loads and fluxes showed clearly, the distinctive patterns in both P forms, and between different storms and catchment sites. In P flux estimations, higher fluxes were logically associated with high flow events. TP fluxes at site S2 were varied from 7.94 kg/storm for typhoon Tembin, to 177.36 kg/storm for typhoon Soala. These fluxes were equivalent to phosphorus yields between 0.0007 kg·TP·ha−1/storm to 0.0161 kg TP·ha−1/storm for TP at site S2. Meanwhile, TP fluxes at site S4 were varied from 15.74 kg/storm for typhoon Tembin to 322.73 kg/storm for typhoon Soala. Corresponding TP yields varied between 0.0008 kg·ha−1/storm to 0.0165 kg·ha−1/storm at site S4. PP fluxes at site S2 varied from 2.21 kg·PP/storm for typhoon Tembin to 77.72 kg·PP/storm for typhoon Soala, while PP fluxes at site S1 varied from 8.99 kg·PP/storm for typhoon Tembin to 145.92 kg PP/storm for typhoon Soala, respectively. When TP and PP fluxes were compared between typhoon storm events, larger fluxes were observed for typhoon Soala, mainly due to larger storm runoff volume. The mean TP, TDP, SRP, and PP yields during three typhoon events at the upstream catchment of Fei-Tsui Reservoir were 0.008 kg·ha−1, 0.005 kg·ha−1, 0.001 kg·ha−1, and 0.003 kg·ha−1, respectively.
3.3. Hysteresis Patterns of Phosphorus
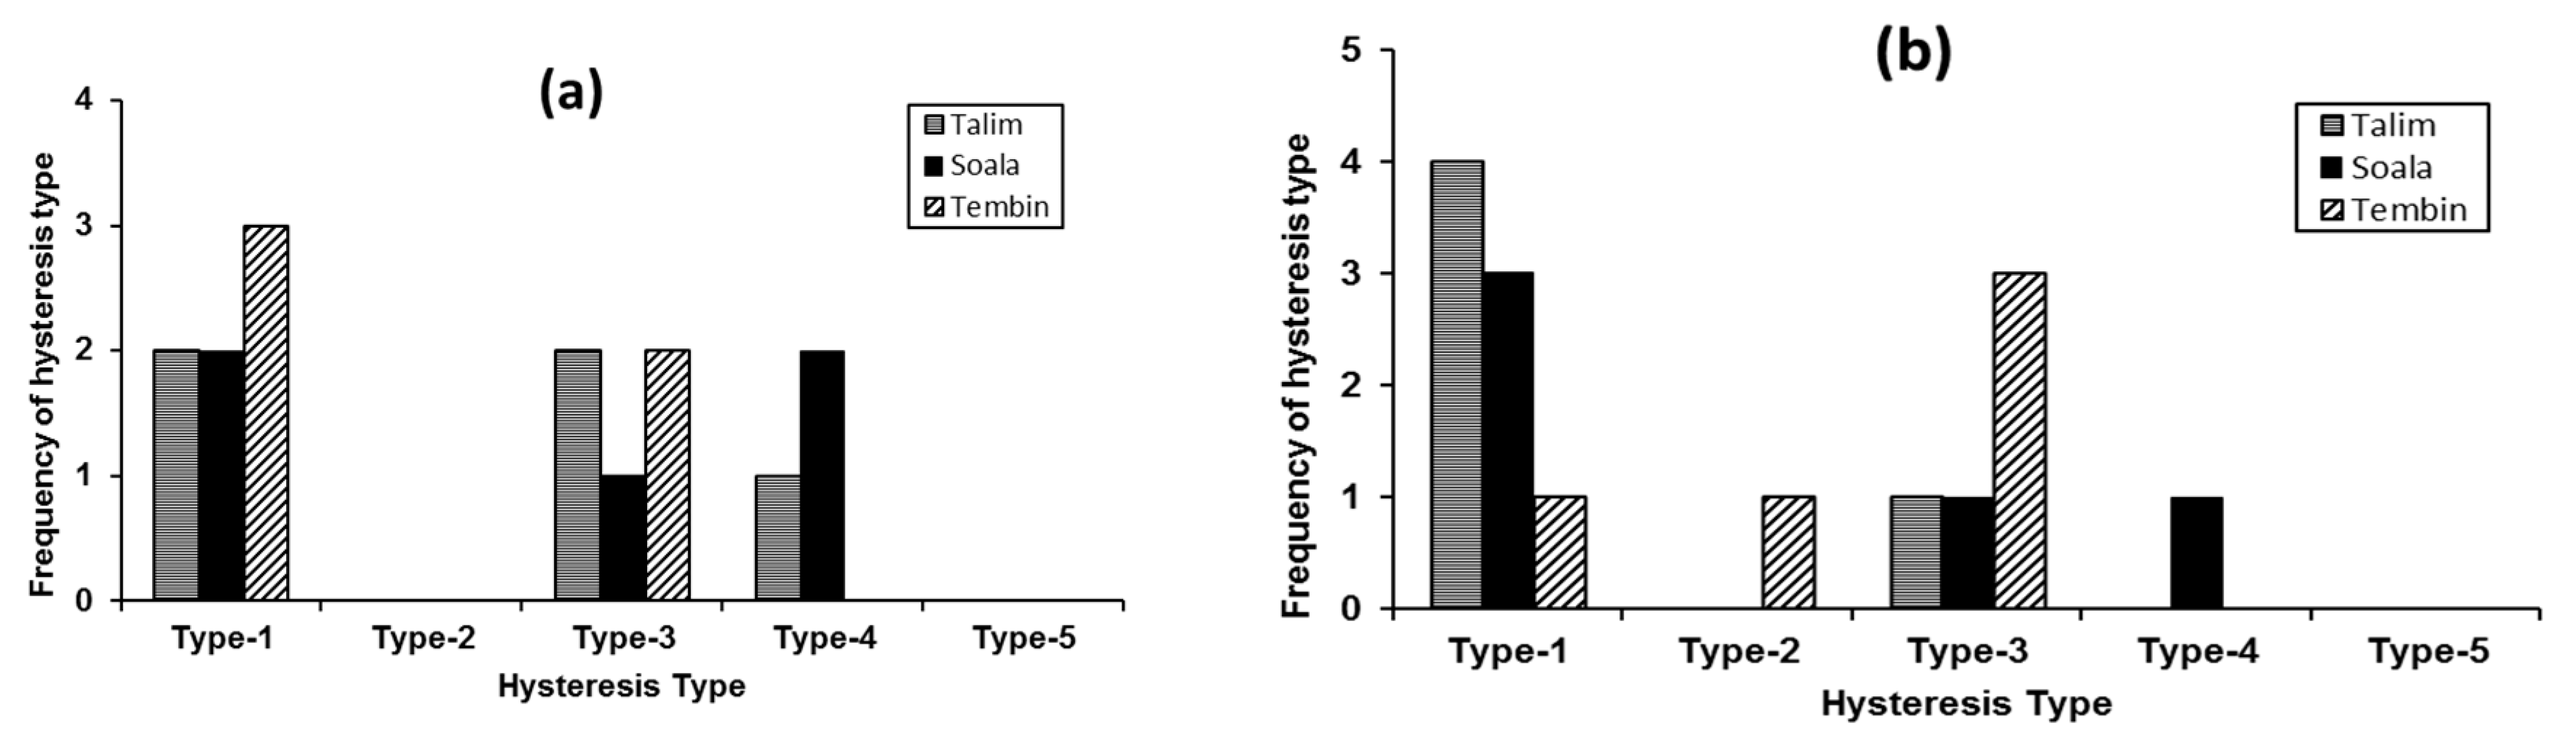
The P composition changes with discharge and different patterns exist under varied flow conditions. The discharges and concentrations of different forms of phosphorus (P) over storm periods were plotted, to investigate the dynamics of P in relation to the hydrological conditions. The time series of concentrations for different P forms at sampling site S4 during monitored storm events are shown in Figure 3(A1–A3). All forms of P showed similar patterns of transport mechanisms during typhoons Talim and Tembin, although the changes of SRP at site S4 during typhoon Soala were not significant. The peak of PP and TP concentrations mainly occurred either on the rising limb, or at the peak of hydrograph, and returned to pre-event concentration levels relatively quickly, as discharge decreased. Similar observations have been made in studies by House and Warwick [10] at the lower River Swale, UK. Hysteresis loop analysis was carried out to examine the transport patterns of different forms of P in stormwater runoff during monitored typhoon storm periods. The hysteresis loop patterns for P concentrations at site S4 were plotted as shown in Figure 3(B1–B3,C1–C3). The frequency results of hysteresis patterns for TDP and PP at all sampling sites are summarized in Figure 4. Generally, hysteresis TYPE-1 (clockwise) is the most common hysteresis type for TDP, which occurred seven times among all studied catchments during typhoon events. Meanwhile, the hysteresis pattern of TDP occurred five times for TYPE-3, three times for TYPE-4, and with no occurrences for hystereses TYPE-2 and TYPE-5. For PP, hysteresis TYPE-1 remains the most common hysteresis loop, occurring eight times, once for TYPE-2 and TYPE-4, five times for TYPE-3, and no event for TYPE-5. Basically, TDP and PP were transported in the hysteresis patterns of TYPE-1 and TYPE-3.
3.4. Temporal and Spatial Changes of Phosphorus Fractions
For the two smaller typhoon storms monitored (i.e., typhoons Talim and Tembin, <100 mm rainfall), DOP contributed, on average, more than 50% of the TDP flux, while SRP only accounted for around 11% of TDP flux in typhoon Soala. The percentages of all P forms for three typhoon events at every sampling site are analyzed and presented in Table 4. Our results indicated that SRP only represented a small fraction of TP in stream runoff during large typhoon storm event. For typhoons Talim and Tembin, SRP accounted for 33.4% and 25.1% of the TP flux, respectively, and only 6.1% of the TP flux for typhoon Soala. On the other hand, PP accounted for 36%, 45%, and 49% of the TP flux for typhoons Talim, Soala, and Tembin, respectively. When proportions of DOP to TDP fluxes were compared between small and large storms, DOP flux was generally higher for large storms (typhoon Soala) than for small storms (typhoons Talim & Tembin). The percentage of DOP to TDP flux during the two moderate storms increased from 37–62% to 88.75–89.62% in typhoon Soala. The mean percentages of DOP to TP fluxes are 30.7%, 49.4%, and 25.4% for typhoons Talim, Soala, and Tembin, respectively.
Estimations of the entering and exiting fluxes of phosphorus enable the calculation of an upstream–downstream balance. The balances for different P fluxes at upstream and downstream during typhoon periods in this study are summarized in Table 5. PP balances indicate that mobilization predominates during storm events. Phosphorus loads in the upland catchment were predominantly in both particulate and dissolved forms, but the particulate-bound phosphorus increased toward the lowland reach as the flow progressed.
Mobilization of all phosphorus and TSS loads was observed from site S1 to site S2 in all three typhoon storm events. For example, the TP loading was increased from 0.7 kg at site S1, to 16.0 kg at site S2, during typhoon Talim. This may be due to the sampling site S2 being only 1 km downstream of site S1. However, TSS showed retention from upstream sites to downstream, at site S4, during typhoon Soala. The TSS flux at site S4 showed a reduction of 28%, compared to that observed at the upstream sites. On the other hand, there was a retention of TDP observed at site S4 during typhoons Soala and Tembin. Both typhoon storms produced a retention of TDP of 1% and 19% of the input flux at site S4, respectively.
3.5. Hydrological Factors Controlling P Transport
The relationship between EMCs and fluxes of phosphorus with storm characteristics was analyzed using Spearman correlation analysis, to determine the controlling factors that influence P response at event scales. Analyzed storm characteristics included rainfall depth (Rdep), rainfall duration (Rdur), mean intensity (I), max intensity (Imax), mean discharge (Qave), peak discharge (Qpeak), antecedent dry days (ADD), and five-day antecedent precipitation index (API5). All storm variables showed positive correlations with EMCs of DOP, with significant correlation observed between storm duration and DOP as shown in Table 6. Positive correlations were found for ADD with all P forms, except PP and TSS, with significant positive correlation observed with SRP (r = 0.797, p < 0.01). EMCs of all P forms, except DOP, were negatively correlated with Imax and Qave. Meanwhile, API5 showed positive correlations with TP, TDP, DOP, and PP, but was significantly negatively correlated with SRP. On the other hand, storm duration and Imax were correlated negatively with all P fluxes, except for the positive correlation between Imax and SRP. ADD and Qpeak were positively correlated with the fluxes of all P forms.
4. Discussion
The hysteresis analysis was used to investigate how storm discharge and phosphorus transport varies in relation to catchment hydrogeology, rainfall intensity and duration, antecedent conditions, and land use and management. TDP showed the anti-clockwise (TYPE-3) hysteresis pattern, which may suggest that the source of TDP could be from subsurface flow. On the other hand, PP showed the clockwise hysteresis (TYPE-1) behavior for storms Talim and Soala, indicating a flushing of PP from top soils into the stream during the early stage of the storm runoff. In fact, Zehetner et al. [14] found high phosphorus concentration at the soil surface, and its concentration decreased logarithmically near constant levels, below a depth of approximately 10 cm. The clockwise hysteresis pattern was also observed for PP in storm Talim, which may imply the importance of an antecedent dry period on PP build-up, since typhoon Talim experienced the longest period of antecedent dry days, compared to typhoons Soala and Tembin. The PP concentration in base flow was observed to decrease from 20.09 μg/L, to 7.17 μg/L at the downstream. This could be attributed to the retention of PP by within-channel sediment deposition, particularly in the low-velocity downstream during summer season. The frequency of TYPE-1 hysteresis pattern was observed to decrease from typhoons Talim to Tembin, which showed a progressive exhaustion of PP available to be transported as the storm events progressed. Bowes et al. [30] observed that as near-channel P sources became depleted during consecutive storm events, clockwise hysteresis of P forms weakened, and tended toward anticlockwise hysteresis. It is suggested that the hysteresis patterns are mainly influenced by the connectivity of P sources with delivery primarily controlled by the transport of P-rich sediment from catchment to the stream system.
The P fractions showed great variability in both temporal and spatial scales. The SRP showed smaller contribution to TDP as the storm size increased. This indicates that DOP played an important role in TDP export during high flow periods. The origin of DOP was suggested to be either from the terrestrial vegetation with fertilization, or the decomposition of rot off in the forested area [36,37]. Similar observations were found by Chen et al. [38], as P composition varied more widely in typhoon storms, compared to typical storm events. They observed that the DOP/TDP ratios ranged from 67% to 87% for typhoon storms, and 56% to 60% for typical storm events. The fraction of SRP/TDP ranged from 40% to 44% for typical storms, and 13% to 33% for typhoon storms. The results for small typhoon storms in this study are similar to the findings reported by McDowell and Wilcock [7] in New Zealand, where stream SRP generally represented 26.9% of TP in summer/fall. Chen and Wu [36] also found that SRP only represented 20% of TP in river inflow of Fei-Tsui reservoir. In terms of dominant phosphorus forms, TDP accounted for 64%, 55%, and 50% of TP fluxes for typhoons Talim, Soala, and Tembin, respectively. Chen et al. [17] found similar observations that TDP accounted for 60% of TP flux for small storm (rainfall = 75 mm), while it accounted for 39% of TP flux for large storm (rainfall = 142 mm).
In terms of spatial changes, it is observed that the percentage of PP transported in the river was increasing from the upstream to the downstream site. This could be caused by the soil erosion from agricultural land or re-suspension of river bed and flood plain sediments during storm events [6,14,17,18]. Kronvang et al. [6] indicated that 7% of PP losses originated from overland flow, 11–18% from tile-drain flow, and the rest from stream bank soil erosion during storms. Bowes et al. [39] and Owens and Walling [40] have also suggested that dissolved phosphorus in the water column was transformed to PP by adsorption, to suspended sediment as it was transported down the river. Chen et al. [17] found that the particulates, which adsorbed larger amount of phosphorus flushed out either from catchment surface or in the river, always desorbed PP during the high river flow periods. Chen and Wu [36] found that the Fei-Tsui reservoir is in noncalcareous geology, and rich with Fe, Al, and Mn ions in the soil. The particle bound P, like Fe, Mn, or Al bound P minerals, were released from sediment under specific pH values or concentration of salts in the water. The erosion of stream banks and near-channel field soils will deliver these phosphorus rich sediments to the downstream sites. Therefore, management of soil erosion in the headwaters is crucial for effectively controlling the phosphorus transport [41]. The monitoring results also suggest that the transport of DOP was decreasing towards downstream, as the typhoon storm period progressed during the summer season. A decrease of DOP load downstream may reflect the change in phosphorus source down the river continuum. The downstream river has the lowest flow velocity and highest proportion of fine sediment. Re-suspension of sediment during high flow periods will release a greater inorganic phosphorus load, subsequently reducing the proportion of DOP in TDP.
An inverse relationship was observed between SRP and PP concentrations and discharge during typhoon storm events. This demonstrated that intense storm events with high discharge rates tend to produce lower EMCs of SRP, due to dilution effects or exhaustion of sources. Negative correlations between dissolved P concentrations and discharges have been observed in previous studies [42,43,44,45]. Antecedent condition appears to play an important role in SRP export during storm events. Higher SRP flux occurred in typhoon storm events with longer antecedent dry days and lower API5 values. This may explain the re-mobilization of P-rich bed-sediments that accumulated within the river channel from the upstream to the downstream of main inflow river during the summer low-flow periods [46,47,48,49]. Previous work also suggest that channel fine-grained sediment potentially stores phosphorus, ready to be remobilized during storm events [50,51,52].
5. Conclusions
This study has monitored the phosphorus concentrations during three typhoon storm events at the upstream catchment of Fei-Tsui reservoir, Taiwan. The results have clearly demonstrated the phosphorus dynamics along the river continuum during typhoon storm periods. The mean EMCs for TP, TDP, SRP, and PP in the upstream catchment of Fei-Tsui reservoir are 27.6 μg/L, 15.66 μg/L, 3.74 μg/L, and 11.94 μg/L, respectively. There were 1.3, 1.3, 2.05, 1.3, and 1.25-fold increases in flow-weighted concentrations of TP, TDP, SRP, PP, and TSS from the upper to lower reaches of the main stream for Fei-Tsui reservoir. SRP contributed more than 50% of the TDP loads in moderate storms, while extreme storms supply greater DOP load from overland flow into the stream. TDP accounted for approximately 50% of TP load in the typhoon storms.
The hysteresis results showed that TDP and PP are transported with either clockwise or anticlockwise behavior, depending on the storm intensity. TDP transport is primarily regulated by the subsurface flow during storm events. Phosphorus loads in the upland catchment are predominantly in both particulate and dissolved forms, but the particulate-bound phosphorus increases toward the lowland reach as the flow progress. Re-mobilization of phosphorus rich bed-sediments within the river channel plays an important role in phosphorus flux estimation. A decrease of DOP load passing downstream may reflect the change in phosphorus form down the river continuum.
ADD shows positive correlation with EMCs of all forms of P, except PP. Qpeak and ADD are also correlated positively with P fluxes. The findings indicate that storm events transport a large amount of phosphorus which has accumulated during dry periods. River bank erosion, and re-suspension of within-channel phosphorus caused by high storm discharge, are the dominant pathways of P fluxes during the typhoon storm event. Thus, soil conservation practices and river bank protection should be targeted as the main mitigating strategies for reducing the P emission during typhoon storm periods.
Acknowledgments
The authors would like to thank the Taipei Fei-Tsui Reservoir Administration Office for providing the valuable water quality and hydrological data sets. We sincerely thank the anonymous reviewers for giving comments and suggestions which improved this manuscript.
Author Contributions
M.F.C. and F.-K.S. conceived and designed the experiments; M.F.C. and J.-C.H. performed the experiments; M.F.C. analyzed the data; F.-K.S. and J.-C.H. contributed reagents/materials/analysis tools; M.F.C. wrote the paper.
Conflicts of Interest
The authors declare no conflict of interest.
References
- Compton, J.; Mallison, D.; Glenn, C.; Filippelli, G.; Föllmi, K.; Shields, G.; Zanin, Y. Variations in the global phosphorus cycle. In Marine Authigenesis: From Global to Microbial: 66 (SEPM Special Publication); SEPM (Society of Sedimentary Geology): Tulsa, OK, USA, 2000; pp. 21–33. [Google Scholar]
- Teubner, K. Phytoplankton, pelagic community and nutrients in a deep oligotrophic alpine lake: Ratios as sensitive indicators of the use of P-resources (DRP:DOP:PP and TN:TP:SRSi). Water Res. 2003, 37, 1583–1592. [Google Scholar] [CrossRef]
- David, M.B.; Gentry, L.E. Anthropogenic inputs of nitrogen and phosphorus and riverine export for Illinois, USA. J. Environ. Qual. 2000, 29, 494–508. [Google Scholar] [CrossRef]
- Royer, T.V.; David, M.B.; Gentry, L.E. Timing of riverine export of nitrate and phosphorus from agricultural watersheds in Illinois: Implications for reducing nutrient loading to the Mississippi River. Environ. Sci. Technol. 2006, 40, 4126–4131. [Google Scholar] [CrossRef] [PubMed]
- Vidon, P.; Tedesco, L.P.; Pascual, D.L.; Campbell, M.A.; Casey, L.R.; Wilson, J.; Gray, M. Seasonal changes in stream water quality along an agricultural/urban land-use gradient. Proc. Indiana Acad. Sci. 2008, 117, 107–123. [Google Scholar]
- Kronvang, B.; Laubel, A.; Grant, R. Suspended sediment and particulate phosphorus transport and delivery pathways in an arable catchment, Gelbaek stream, Denmark. Hydrol. Process. 1997, 11, 627–642. [Google Scholar] [CrossRef]
- McDowell, R.W.; Wilcock, R.J. Particulate phosphorus transport within streamflow of an agricultural catchment. J. Environ. Qual. 2004, 33, 2111–2121. [Google Scholar] [CrossRef] [PubMed]
- Howarth, R.W.; Jensen, H.S.; Marino, R.; Postma, H. Transport to and processing of P in near-shore and oceanic waters. In Phosphorus in the Global Environment: Transfers, Cycles and Management; Tiessen, H., Ed.; John Willey & Son, Inc.: New York, NY, USA, 1995; pp. 323–345. [Google Scholar]
- Meybeck, M. Carbon, nitrogen and phosphorus transport by rivers. Am. J. Sci. 1982, 282, 401–450. [Google Scholar] [CrossRef]
- House, W.A.; Warwick, M.S. Intensive measurements of nutrient dynamics in the River Swale. Sci. Total Environ. 1998, 210, 111–137. [Google Scholar] [CrossRef]
- Zhang, Z.; Fukushima, T.; Onda, Y.; Gomi, T.; Fukuyama, T.; Sidle, R.; Kosugi, K.; Matsushige, K. Nutrient runoff from forested watersheds in central Japan during typhoon storms: Implications for understanding runoff mechanisms during storm events. Hydrol. Process. 2007, 21, 1167–1178. [Google Scholar] [CrossRef]
- Chow, M.F.; Shiah, F.K.; Lai, C.C.; Kuo, H.Y.; Wang, K.W.; Lin, C.H.; Chen, T.Y.; Kobayashi, Y.; Ko, C.Y. Evaluation of surface water quality using multivariate statistical techniques: A case study of Fei-Tsui Reservoir basin, Taiwan. Environ. Earth Sci. 2016, 75, 1–15. [Google Scholar] [CrossRef]
- Wang, Z.; Yang, S.; Zhao, C.; Bai, J.; Lou, H.; Chen, K.; Wu, L.; Dong, G.; Zhou, Q. Assessment of Non-Point Source Total Phosphorus Pollution from Different Land Use and Soil Types in a Mid-High Latitude Region of China. Water 2016, 8, 505. [Google Scholar] [CrossRef]
- Zehetner, F.; Vemuri, M.L.; Huh, C.A.; Kao, S.J.; Hsu, S.C.; Chen, Z.S. Soil and phosphorus re-distribution along a steep tea plantation in Feitsui Reservoir catchment of northern Taiwan. Soil Sci. Plant Nutr. 2008, 54, 618–626. [Google Scholar] [CrossRef]
- Ballantine, D.; Walling, D.E.; Leeks, G.J.L. Mobilisation and transport of sediment-associated phosphorus by surface runoff. Water Air Soil Pollut. 2009, 196, 311–320. [Google Scholar] [CrossRef]
- Bowes, M.J.; Smith, J.T.; Neal, C. The value of high-resolution nutrient monitoring: A case study of the River Frome, Dorset, UK. J. Hydrol. 2009, 378, 82–96. [Google Scholar] [CrossRef]
- Chen, Y.C.; Liu, J.H.; Kuo, J.T.; Lin, C.F. Estimation of phosphorus flux in rivers during flooding. Environ. Monit. Assess. 2013, 185, 5653–5672. [Google Scholar] [CrossRef] [PubMed]
- Chen, C.F.; Lin, J.Y. Estimating the gross budget of applied nitrogen and phosphorus in tea plantations. Sustain. Environ. Res. 2016, 26, 124–130. [Google Scholar] [CrossRef]
- Gachter, R.; Ngatiah, J.M.; Stamm, C. Transport of phosphate from soil to surface waters by preferential flow. Environ. Sci. Technol. 1998, 32, 1865–1869. [Google Scholar] [CrossRef]
- Lee, T.Y.; Huang, J.C.; Kao, S.J.; Tung, C.P. Temporal variation of nitrate and phosphate transport in headwater catchments: The hydrological controls and land use alteration. Biogeosciences 2013, 10, 2617–2632. [Google Scholar] [CrossRef]
- Rodríguez-Blanco, M.L.; Taboada-Castro, M.M.; Taboada-Castro, M.T. Sediment and phosphorus loss in runoff from an agroforestry catchment, NW, Spain. Land Degrad. Dev. 2010, 21, 1611–1670. [Google Scholar] [CrossRef]
- Su, S.H.; Kuo, H.C.; Hsu, L.H.; Yang, Y.T. Temporal and spatial characteristics of typhoon extreme rainfall in Taiwan. J. Meteorol. Soc. Jpn. 2012, 90, 721–736. [Google Scholar] [CrossRef]
- Tu, J.Y.; Chou, C. Changes in precipitation frequency and intensity in the vicinity of Taiwan: Typhoon versus non-typhoon events. Environ. Res. Lett. 2013, 8, 014023. [Google Scholar] [CrossRef]
- Lenderink, G.; Meijgaard, E. Increase in hourly precipitation extremes beyond expectations from temperature changes. Nat. Geosci. 2008, 1, 511–514. [Google Scholar] [CrossRef]
- Min, S.K.; Zhang, X.; Zwiers, F.W.; Hegerl, G.C. Human contribution to more-intense precipitation extremes. Nature 2011, 470, 378–381. [Google Scholar] [CrossRef] [PubMed]
- Chou, C.; Neelin, J.D.; Chen, C.A.; Tu, J.Y. Evaluating the rich-get-richer mechanism in tropical precipitation change under global warming. J. Clim. 2009, 22, 1982–2005. [Google Scholar] [CrossRef]
- APHA (American Public Health Association); AWWA (American Water Works Association); WEF (Water Environment Federation). Standard Methods for the Examination of Water and Wastewater, 21st ed.; APHA; AWWA; WEF: Washington, DC, USA, 2005. [Google Scholar]
- Murphy, J.; Riley, J.P. A modified single solution method for the determination of phosphate in natural waters. Anal. Chim. Acta 1962, 27, 31–36. [Google Scholar] [CrossRef]
- Vagstad, N.; Deelstra, J.; Eggestad, H.O. Discharge and measurement, sampling techniques and their influences on calculated sediment and phosphorus loss from agricultural area. In Sediment and Phosphorus: Erosion and Delivery, Transport and Fate of Sediments and Sediment-Associated Nutrients in Watersheds; NERI Technical Report 178; National Environmental Research Institute: Silkeborg, Denmark, 1996; pp. 93–95. [Google Scholar]
- Bowes, M.J.; House, W.A.; Hodginson, R.A.; Leach, D.V. Phosphorus-discharge hysteresis during storm events along a river catchment: The River Swale, UK. Water Res. 2005, 39, 751–762. [Google Scholar] [CrossRef] [PubMed]
- Lloyd, C.E.M.; Freer, J.E.; Johnes, P.J.; Collins, A.L. Using hysteresis analysis of high-resolution water quality monitoring data, including uncertainty, to infer controls on nutrient and sediment transfer in catchments. Sci. Total Environ. 2016, 543, 388–404. [Google Scholar] [CrossRef] [PubMed]
- House, W.A.; Warwick, M.S. Hysteresis of the solute concentration/discharge relationship in rivers during storms. Water Res. 1998, 32, 2279–2290. [Google Scholar] [CrossRef]
- Seeger, M.; Errea, M.P.; Beguería, S.; Arnáez, J.; Martí-Bono, C.; García-Ruiz, J.M. Catchment soil moisture and rainfall characteristics as determinant factors for discharge/suspended sediment hysteretic loops in a small headwater catchment in the Spanish Pyrenees. J. Hydrol. 2004, 288, 299–311. [Google Scholar] [CrossRef]
- Williams, G.P. Sediment concentration versus water discharge during single hydrologic events. J. Hydrol. 1989, 111, 89–106. [Google Scholar] [CrossRef]
- Kurashige, Y. Mechanisms of sediment supply in headwater rivers. Trans. Jpn. Geomorphol. Union 1994, 15A, 109–129. [Google Scholar]
- Chen, Y.; Wu, S. Effects of the Phosphorus Forms of the Watershed on the Speciation of Phytoplankton: A Case Study of the Two Subtropical Deep Reservoirs in Taiwan. Crit. Trans. Water Environ. Resour. Manag. 2004, 1–10. [Google Scholar] [CrossRef]
- Tsai, C.J.; Lin, T.C.; Hwong, J.L.; Lin, N.H.; Wang, C.P.; Hamburg, S. Typhoon impacts on stream water chemistry in a plantation and an adjacent natural forest in central Taiwan. J. Hydrol. 2009, 378, 290–298. [Google Scholar] [CrossRef]
- Chen, N.; Wu, Y.; Chen, Z.; Hong, H. Phosphorus export during storm events from a human perturbed watershed, southeast China: Implications for coastal ecology. Estuar. Coast. Shelf Sci. 2015, 166, 178–188. [Google Scholar] [CrossRef]
- Bowes, M.J.; House, W.A.; Hodgkinson, R.A. Phosphorus dynamics along a river continuum. Sci. Total Environ. 2003, 313, 199–212. [Google Scholar] [CrossRef]
- Owens, P.N.; Walling, D.E. The phosphorus content of fluvial sediment in rural and industrialized river basins. Water Res. 2002, 36, 685–701. [Google Scholar] [CrossRef]
- Kleinman, P.J.A.; Sharpley, A.N.; Saporito, L.S.; Buda, A.R.; Bryant, R.B. Application of manure to no-till soils: Phosphorus losses by sub-surface and surface pathways. Nutr. Cycl. Agroecosyst. 2009, 84, 215–227. [Google Scholar] [CrossRef]
- Chow, M.F.; Yusop, Z.; Toriman, M.E. Stormwater runoff quality and pollutant loading from commercial, residential, and industrial catchments in the tropic. Environ. Monit. Assess. 2013, 185, 8321–8331. [Google Scholar] [CrossRef] [PubMed]
- Neal, C.; Williams, R.J.; Neal, M.; Bhardwaj, L.C.; Wickham, H.; Harrow, M.; Hill, L.K. The water quality of the River Thames at a rural site downstream of Oxford. Sci. Total Environ. 2000, 251, 441–457. [Google Scholar] [CrossRef]
- Chow, M.F.; Yusop, Z. Sizing first flush pollutant loading of stormwater runoff in tropical urban catchments. Environ. Earth Sci. 2014, 72, 4047–4058. [Google Scholar] [CrossRef]
- Gan, H.; Zhuo, M.; Li, D.; Zhou, Y. Quality characterization and impact assessment of highway runoff in urban and rural area of Guangzhou, China. Environ. Monit. Assess. 2008, 140, 147–159. [Google Scholar] [CrossRef] [PubMed]
- Rodriguez-Blanco, M.L.; Taboada-Castro, M.M.; Taboada-Castro, M.T. Phosphorus transport into a stream draining from a mixed land use catchment in Galicia (NW Spain): Significance of runoff events. J. Hydrol. 2013, 481, 12–21. [Google Scholar] [CrossRef]
- Lin, T.C.; Shaner, P.J.L.; Wang, L.J.; Shih, Y.T.; Wang, C.P.; Huang, G.H.; Huang, J.C. Effects of mountain tea plantations on nutrient cycling at upstream watersheds. Hydrol. Earth Syst. Sci. 2015, 19, 4493–4504. [Google Scholar] [CrossRef]
- Bowes, M.J.; Jarvie, H.P.; Halliday, S.J.; Skeffington, R.A.; Wade, A.J.; Loewenthal, M.; Gozzard, E.; Newman, J.R.; Palmer-Felgate, E.J. Characterising phosphorus and nitrate inputs to a rural river using high-frequency concentration–flow relationships. Sci. Total Environ. 2015, 511, 608–620. [Google Scholar] [CrossRef] [PubMed] [Green Version]
- Stutter, M.I.; Langan, S.J.; Cooper, R.J. Spatial contributions of diffuse inputs and within-channel processes to the form of stream water phosphorus over storm events. J. Hydrol. 2008, 350, 203–214. [Google Scholar] [CrossRef]
- Ballantine, D.; Walling, D.; Collins, A.; Leeks, G.L. Phosphorus storage in fine channel bed sediments. Water Air Soil Pollut. Focus 2006, 6, 371–380. [Google Scholar] [CrossRef]
- Ballantine, D.J.; Walling, D.E.; Collins, A.L.; Leeks, G.J.L. The content and storage of phosphorus in fine-grained channel bed sediment in contrasting lowland agricultural catchments in the UK. Geoderma 2009, 151, 141–149. [Google Scholar] [CrossRef]
- Jarvie, H.P.; Jurgens, M.D.; Williams, R.J.; Neal, C.; Davies, J.J.L.; Barrett, C.; White, J. Role of river bed sediments as sources and sinks of phosphorus across two major eutrophic UK river basins: The Hampshire Avon and Herefordshire wye. J. Hydrol. 2005, 304, 51–74. [Google Scholar] [CrossRef]
Figure 1.
Location of Fei-Tsui reservoir and sampling sites.
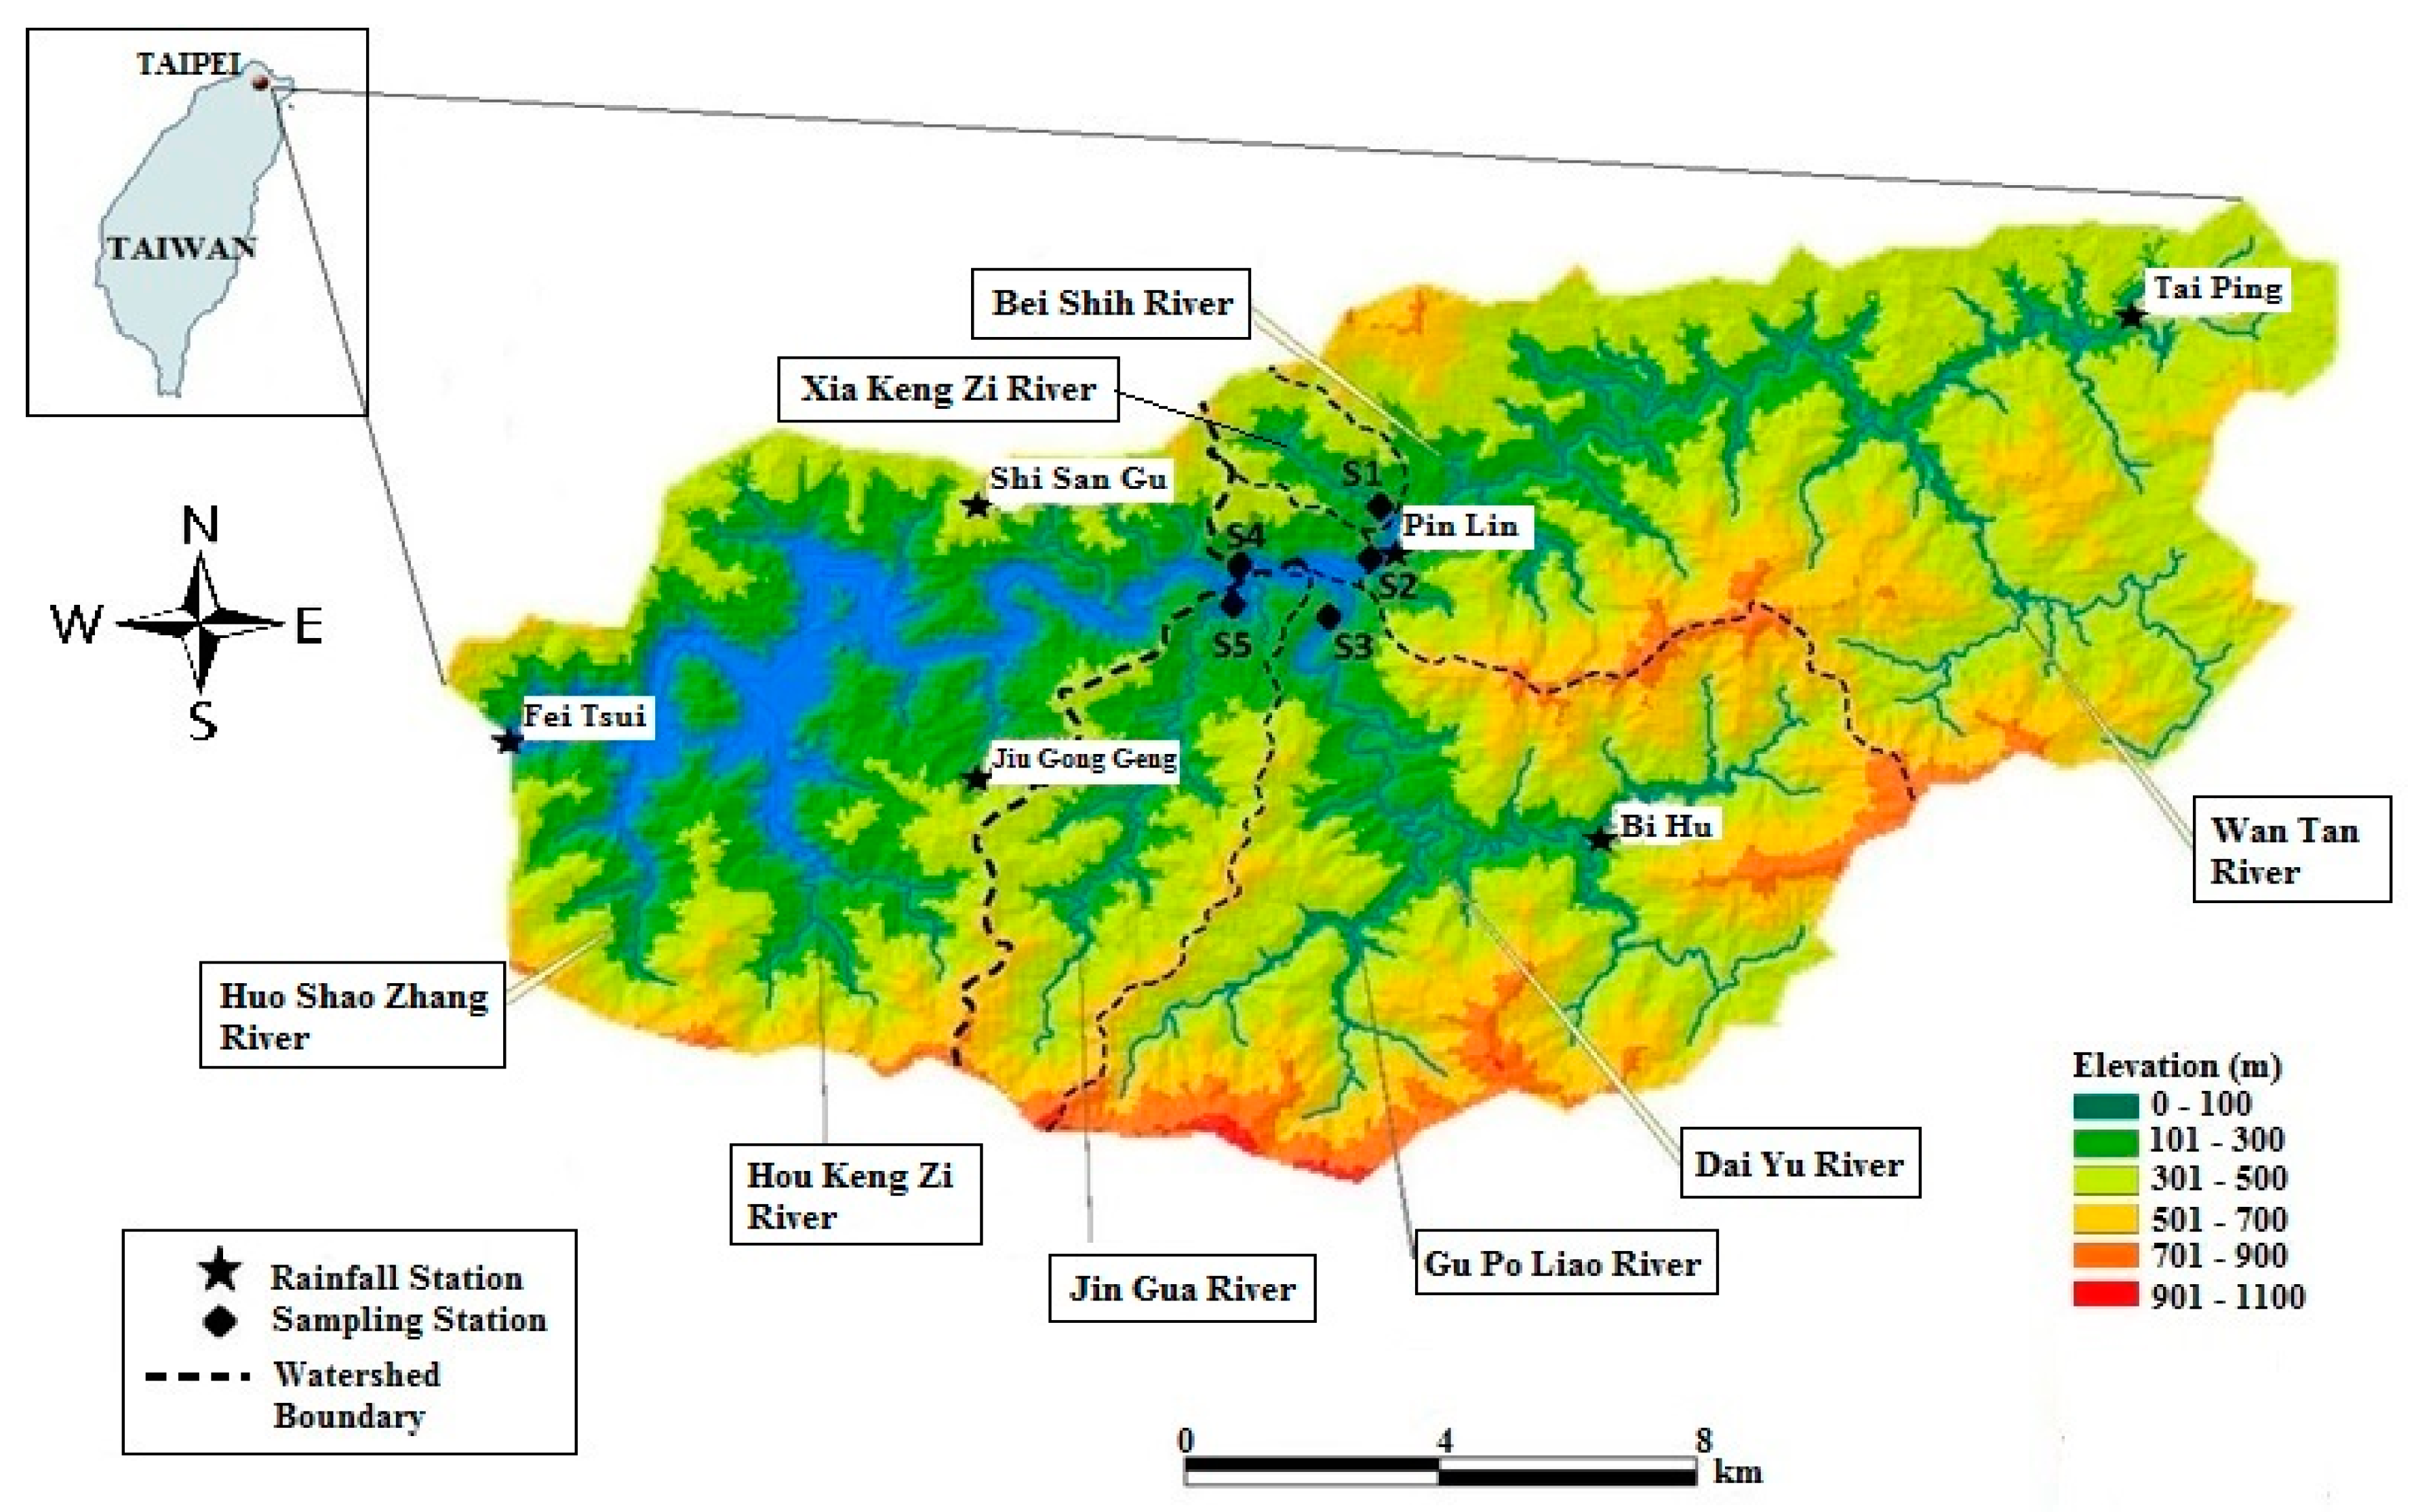
Figure 2.
Hysteresis types (after Williams [34]; Kurashige [35]). Arrows indicate direction through time; TYPE-1 clockwise; TYPE-2 figure eight, clockwise early in storm reversing to counterclockwise; TYPE-3 counterclockwise; TYPE-4 figure eight, counterclockwise early in storm reversing to clockwise; and TYPE-5 no exhaustion.
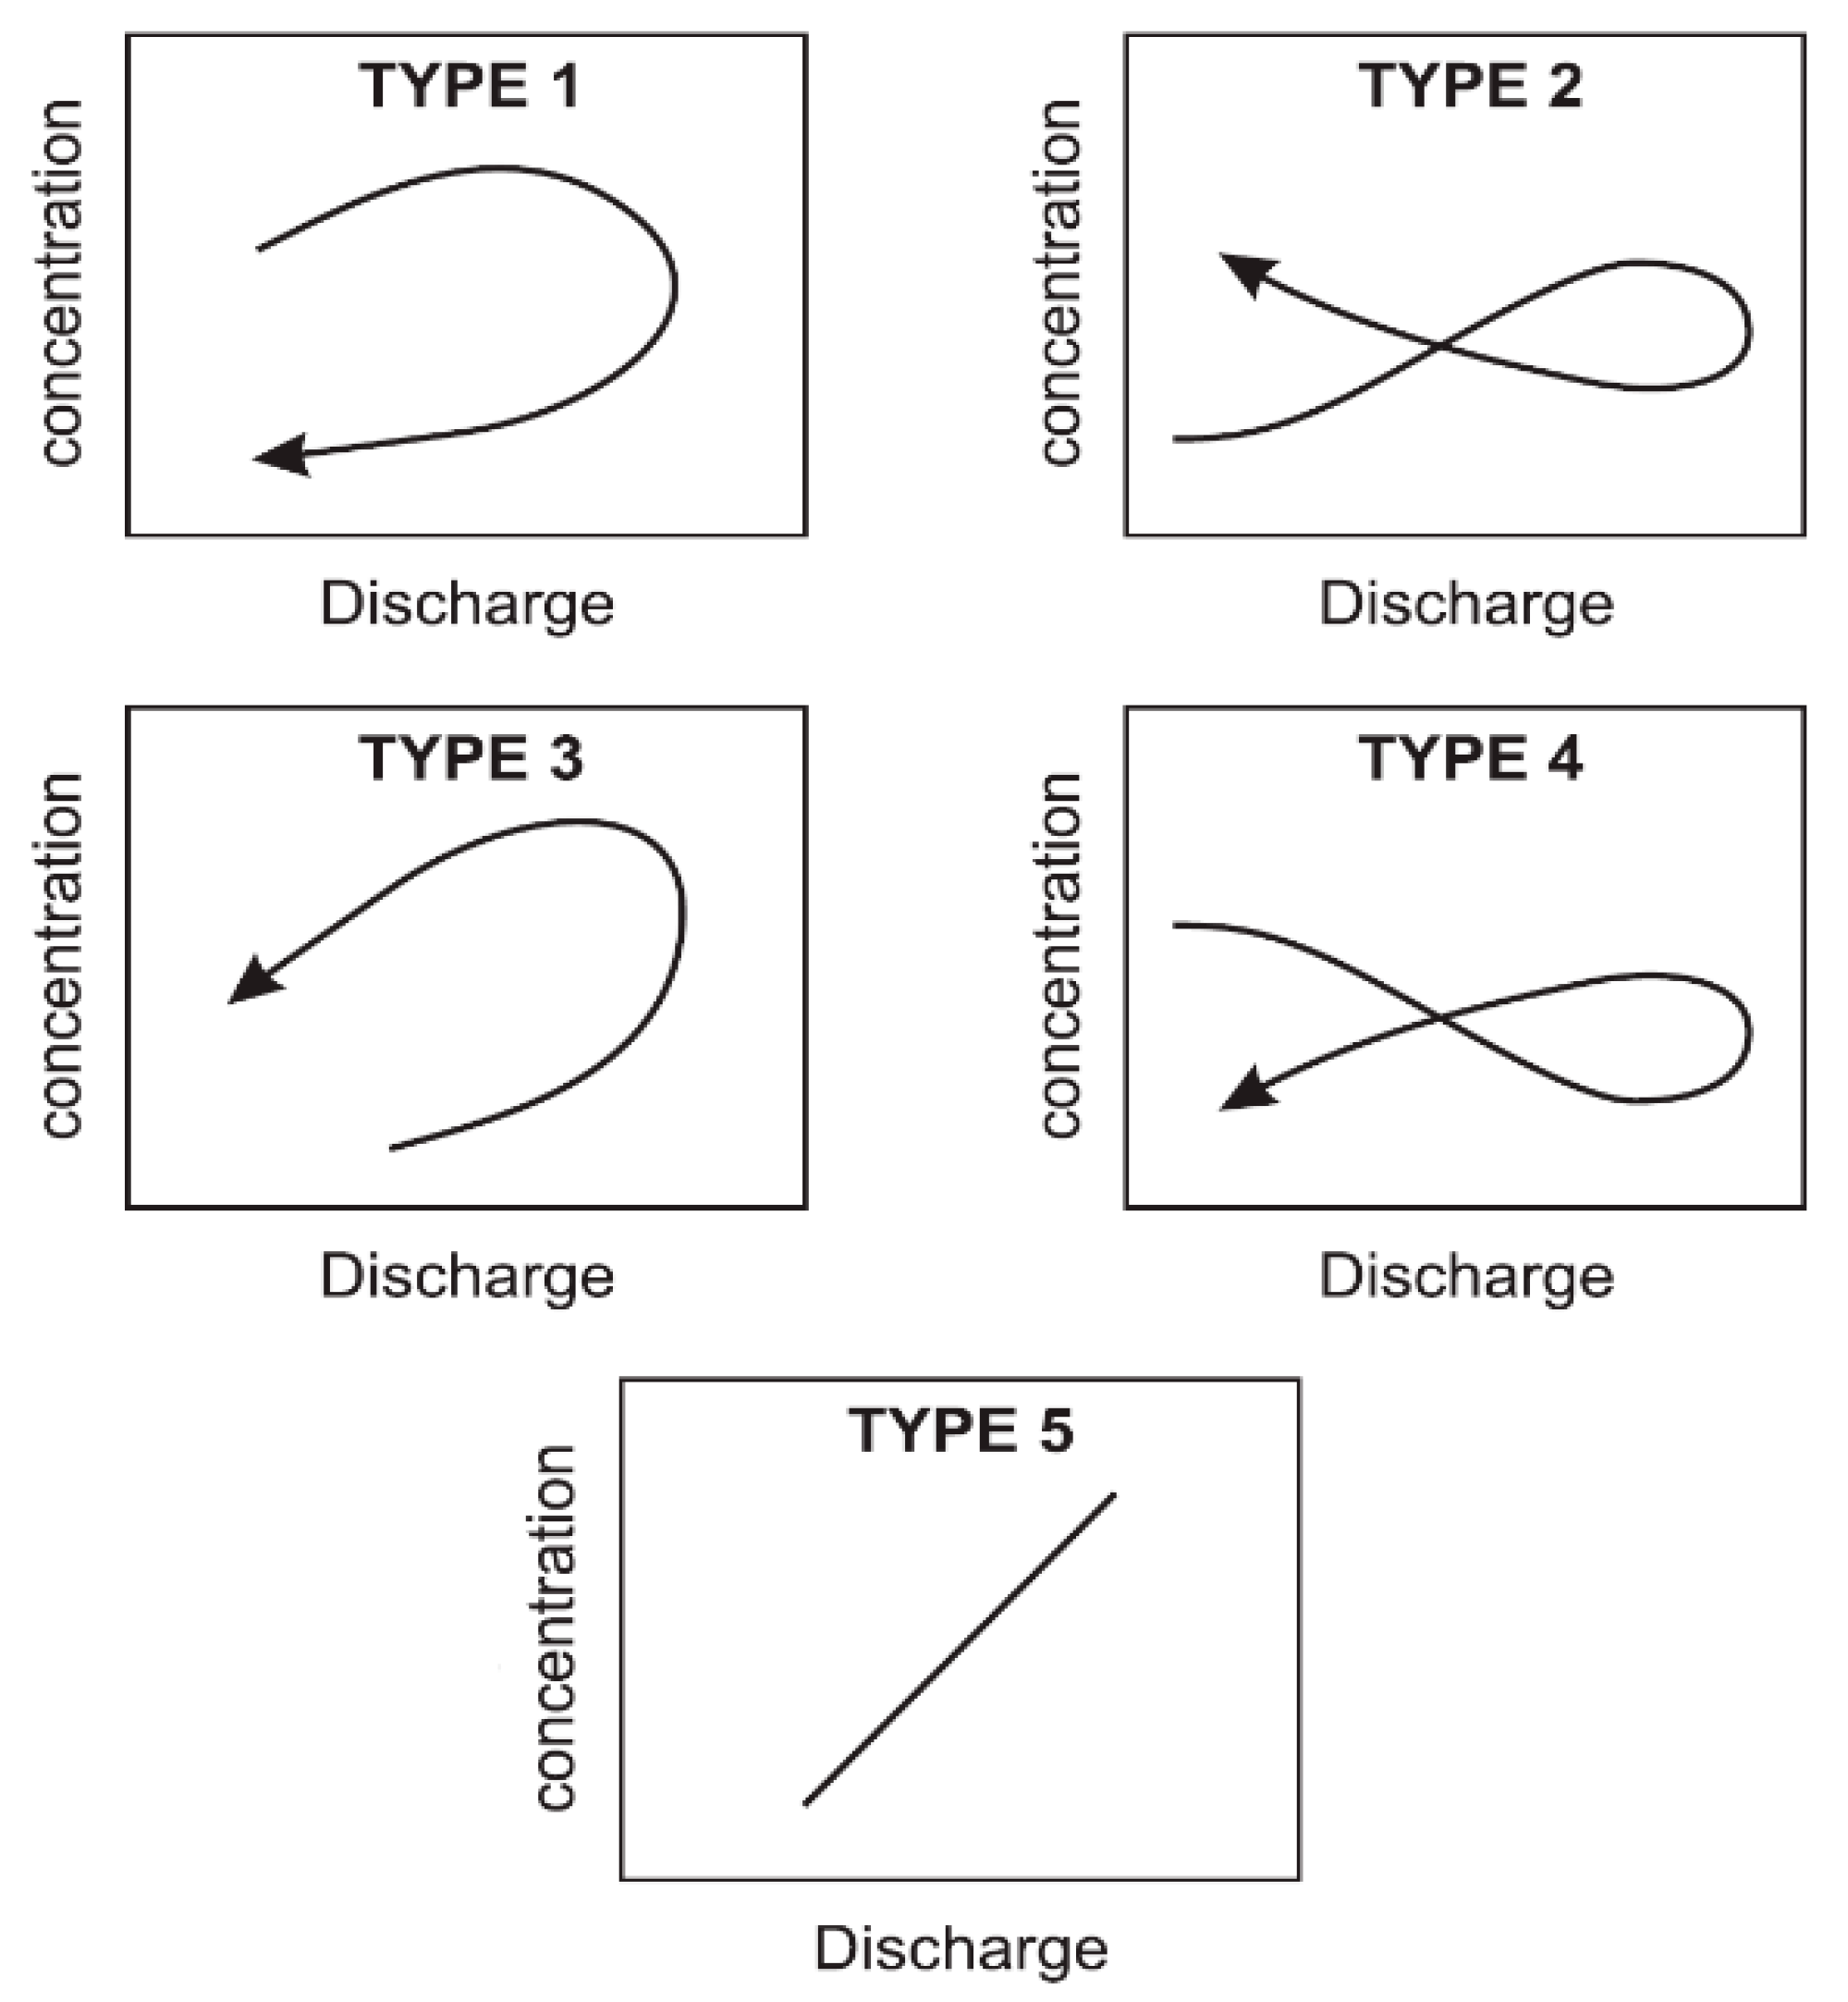
Figure 3.
Time series of phosphorus (P) concentrations and discharges (A1–A3), and hysteresis patterns for total dissolved phosphorus (TDP); (B1–B3), and particulate phosphorus (PP); (C1–C3) at site S4 during typhoon storm events.
Figure 3.
Time series of phosphorus (P) concentrations and discharges (A1–A3), and hysteresis patterns for total dissolved phosphorus (TDP); (B1–B3), and particulate phosphorus (PP); (C1–C3) at site S4 during typhoon storm events.
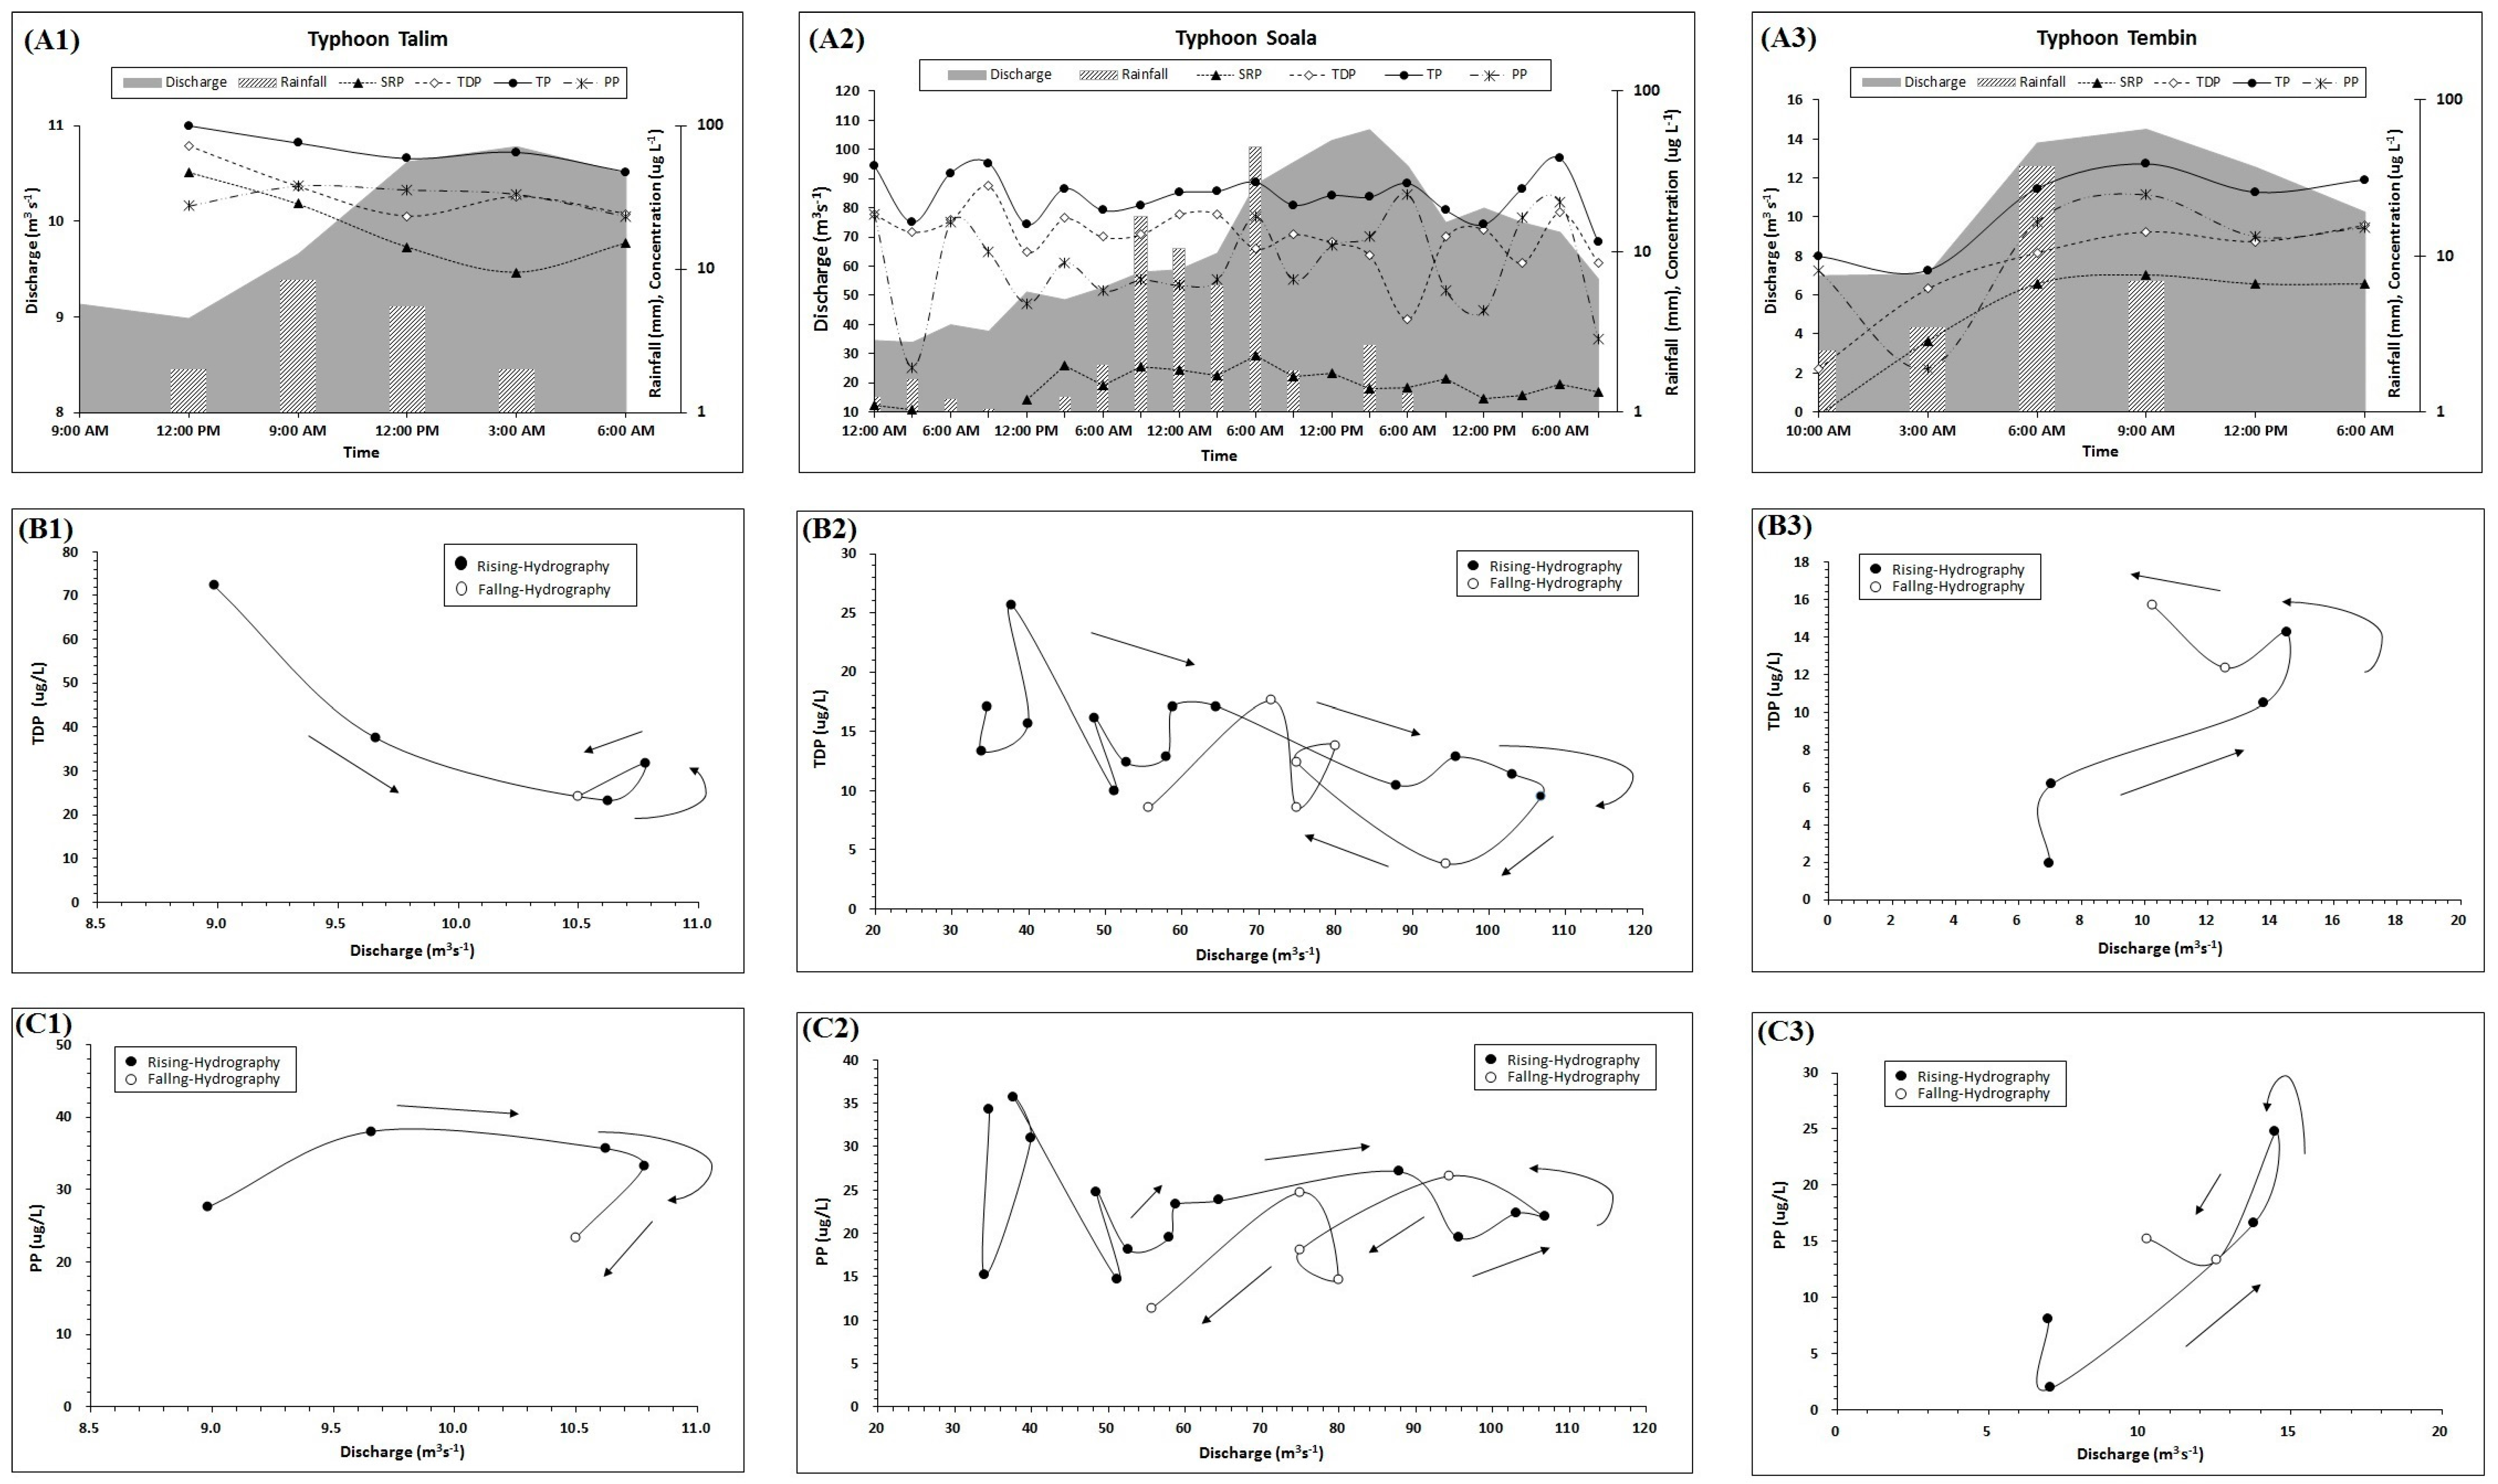
Figure 4.
Frequency of hysteresis patterns for (a) TDP; and (b) PP during typhoon storm events.

Table 1.
Details of sampling sites and land use distributions.
| Site | Sampling Site Coordinate | Stream | Area (km2) | Percentage of Land Use (%) | |||||
|---|---|---|---|---|---|---|---|---|---|
| Agriculture | Forest | Road | Water | Building | Other | ||||
| S1 | 24°56′31.1″ N 121°42′46.6″ E | Xia-Keng-Zi | 5.58 | 19.1 | 72.7 | 4.4 | 0.6 | 1.6 | 1.6 |
| S2 | 24°56′9.3″ N 121°42′46.0″ E | Bei-Shih | 110.47 | 4.8 | 90.6 | 1.2 | 1.2 | 0.5 | 1.7 |
| S3 | 24°55′56.5″ N 121°42′19.1″ E | Dai-Yu | 78.86 | 2.1 | 95.5 | 0.5 | 0.9 | 0.2 | 0.7 |
| S4 | 24°55′57.8″ N 121°41′24.5″ E | Bei-Shih | 195.52 | 4.1 | 91.8 | 1.0 | 1.2 | 0.4 | 1.5 |
| S5 | 24°55′46.7″ N 121°41′29.9″ E | Jin-Gua | 22.92 | 5.4 | 92.3 | 0.3 | 0.8 | 0.2 | 1.0 |
Table 2.
Characteristics of monitored storms during typhoons Talim, Soala, and Tembin.
| Typhoon | Parameter | Unit | Site | ||||
|---|---|---|---|---|---|---|---|
| S1 | S2 | S3 | S4 | S5 | |||
| Talim 19 June–21 June | Rdep | (mm) | 46.5 | 46.5 | 34.5 | 46.5 | 53.5 |
| Rdur | (h) | 67 | 67 | 67 | 67 | 67 | |
| I | (mm/h) | 0.69 | 0.69 | 0.51 | 0.69 | 0.80 | |
| Imax | (mm/h) | 4.5 | 4.5 | 5.5 | 4.5 | 4.0 | |
| Qave | (m3·s−1) | 0.28 | 5.51 | 2.85 | 9.74 | 2.33 | |
| Qpeak | (m3· s−1) | 0.31 | 6.20 | 3.95 | 10.97 | 5.30 | |
| ADD | (day) | 3 | 3 | 3 | 3 | 2 | |
| API5 | (mm) | 45.1 | 45.1 | 23.0 | 45.1 | 152.5 | |
| Soala 31 July–3 August | Rdep | (mm) | 669 | 669 | 922 | 669 | 687 |
| Rdur | (h) | 117 | 117 | 117 | 117 | 117 | |
| I | (mm/h) | 5.70 | 5.70 | 7.90 | 5.70 | 5.90 | |
| Imax | (mm/h) | 39.0 | 39.0 | 59.5 | 39.0 | 46.5 | |
| Qave | (m3· s−1) | 1.88 | 37.6 | 21.95 | 73.08 | 10.29 | |
| Qpeak | (m3 ·s−1) | 3.27 | 65.36 | 49.59 | 115.68 | 29.55 | |
| ADD | (day) | 0 | 0 | 0 | 0 | 0 | |
| API5 | (mm) | 130.9 | 130.9 | 227.8 | 130.9 | 116.5 | |
| Tembin 28 August–29 August | Rdep | (mm) | 63.5 | 63.5 | 63.0 | 63.5 | 54.0 |
| Rdur | (h) | 34 | 34 | 34 | 34 | 34 | |
| I | (mm/h) | 1.87 | 1.87 | 1.85 | 1.87 | 1.59 | |
| Imax | (mm/h) | 20.5 | 20.5 | 19.0 | 20.5 | 14.0 | |
| Qave | (m3· s−1) | 0.29 | 5.74 | 2.46 | 10.22 | 0.99 | |
| Qpeak | (m3· s−1) | 0.49 | 9.79 | 5.79 | 17.33 | 2.35 | |
| ADD | (day) | 0 | 0 | 0 | 0 | 0 | |
| API5 | (mm) | 64.0 | 64.0 | 85.0 | 64.0 | 63.7 | |
Note: API = ∑ki Pi, where Pi are precipitation 1, 2, …, i (i = 5) days prior to the event and k is a constant (k = 0.85). Three soil antecedent moisture conditions were classified according to API value. Condition I (dry): 0 ≤ API ≤ 15 mm; Condition II (average): 15 ≤ API ≤ 30 mm; Condition III (wet): API > 30 mm.
Table 3.
Flow-weighted concentrations for all forms of P and other constituents.
| Site | Typhoon | Flow-Weighted Concentration | ||||||||
|---|---|---|---|---|---|---|---|---|---|---|
| TP | TDP | SRP | PP | Temp. | pH | EC | TSS | NVSS | ||
| μg/L | μg/L | μg/L | μg/L | °C | μmho/cm | mg/L | mg/L | |||
| S1 | Talim | 21.37 | 13.30 | 7.44 | 8.07 | 22.67 | 7.69 | 115.82 | 3.55 | 2.29 |
| Soala | 28.34 | 14.87 | 1.64 | 13.47 | 23.00 | 7.16 | 63.89 | 120.58 | 107.75 | |
| Tembin | 22.96 | 12.63 | 4.82 | 10.32 | 23.71 | 7.55 | 85.26 | 13.02 | 4.37 | |
| mean | 27.56 | 14.65 | 2.22 | 12.92 | 23.00 | 7.22 | 68.80 | 106.75 | 94.98 | |
| Base flow | 46.59 | 26.51 | 4.04 | 20.09 | 25.20 | 7.86 | 134.0 | 1.43 | - | |
| S2 | Talim | 22.50 | 12.41 | 6.12 | 10.09 | 23.25 | 7.49 | 69.61 | 3.18 | 1.92 |
| Soala | 21.35 | 11.99 | 1.24 | 9.35 | 23.17 | 6.93 | 36.33 | 187.12 | 185.53 | |
| Tembin | 18.01 | 12.99 | 5.77 | 5.02 | 24.62 | 7.48 | 62.23 | 15.90 | 5.13 | |
| mean | 21.28 | 12.07 | 1.82 | 9.21 | 23.25 | 7.00 | 40.05 | 165.28 | 163.28 | |
| Base flow | 17.59 | 12.96 | 5.70 | 4.64 | 25.30 | 7.99 | 62.00 | 1.95 | - | |
| S3 | Talim | 21.33 | 15.58 | 6.03 | 5.76 | 23.13 | 7.63 | 79.12 | 3.28 | 2.05 |
| Soala | 25.90 | 14.61 | 1.57 | 11.29 | 23.45 | 7.03 | 34.22 | 346.80 | 326.37 | |
| Tembin | 19.58 | 9.06 | 5.57 | 10.52 | 24.32 | 7.60 | 63.43 | 16.71 | 9.86 | |
| mean | 25.30 | 14.42 | 2.06 | 10.88 | 23.47 | 7.10 | 38.60 | 308.37 | 289.87 | |
| Base flow | 29.48 | 15.69 | 3.56 | 13.79 | 25.10 | 7.89 | 83.00 | 2.41 | - | |
| S4 | Talim | 84.75 | 53.95 | 29.47 | 30.80 | 25.21 | 8.46 | 67.89 | 5.85 | 3.83 |
| Soala | 22.97 | 12.59 | 1.47 | 10.39 | 23.92 | 6.44 | 35.46 | 170.00 | 156.49 | |
| Tembin | 20.16 | 8.65 | 5.42 | 11.52 | 24.63 | 7.51 | 65.60 | 17.96 | 9.76 | |
| mean | 27.69 | 15.64 | 3.86 | 12.04 | 24.06 | 6.65 | 39.47 | 149.74 | 137.39 | |
| Base flow | 24.41 | 17.24 | 29.94 | 7.17 | 26.40 | 9.20 | 74.00 | 2.90 | - | |
| S5 | Talim | 34.95 | 23.30 | 14.69 | 11.66 | 22.91 | 7.70 | 76.47 | 5.00 | 3.53 |
| Soala | 26.32 | 15.14 | 1.70 | 11.18 | 24.26 | 6.98 | 35.21 | 608.50 | 572.73 | |
| Tembin | 24.74 | 8.97 | 4.30 | 15.77 | 24.56 | 7.58 | 69.69 | 17.07 | 7.70 | |
| mean | 27.12 | 15.76 | 3.04 | 11.35 | 24.13 | 7.06 | 40.19 | 533.22 | 501.52 | |
| Base flow | 72.27 | 36.85 | 8.55 | 35.42 | 24.90 | 8.05 | 81.00 | 3.92 | - | |
Notes: SRP—soluble reactive phosphorus; Temp.—water temperature; EC—electrical conductivity; TSS—total suspended solids; NVSS—non-volatile suspended solids.
Table 4.
Percentages of ratio for all P forms at each sampling site during typhoon storm events.
| Site | Typhoon | Percentage of Ratio (%) | |||||
|---|---|---|---|---|---|---|---|
| SRP:TDP | TDP:TP | DOP:TDP | PP:TP | SRP:TP | DOP:TP | ||
| S1 | Talim | 55.93 | 62.23 | 44.07 | 37.77 | 34.78 | 27.43 |
| Soala | 11.01 | 52.47 | 88.99 | 47.53 | 5.78 | 46.69 | |
| Tembin | 38.17 | 55.04 | 61.83 | 44.96 | 20.95 | 34.19 | |
| S2 | Talim | 49.32 | 55.15 | 50.68 | 44.85 | 27.20 | 27.94 |
| Soala | 10.38 | 56.18 | 89.62 | 43.82 | 5.83 | 50.35 | |
| Tembin | 44.40 | 72.14 | 55.60 | 27.86 | 32.03 | 40.10 | |
| S3 | Talim | 38.73 | 73.01 | 61.27 | 26.99 | 28.28 | 44.73 |
| Soala | 10.76 | 56.41 | 89.24 | 43.59 | 6.07 | 50.34 | |
| Tembin | 61.50 | 46.26 | 38.50 | 53.74 | 28.45 | 17.81 | |
| S4 | Talim | 54.63 | 63.66 | 45.37 | 36.34 | 34.78 | 28.88 |
| Soala | 11.71 | 54.79 | 88.29 | 45.21 | 6.41 | 48.37 | |
| Tembin | 62.72 | 42.89 | 37.28 | 57.11 | 26.90 | 15.99 | |
| S5 | Talim | 63.04 | 66.65 | 36.96 | 33.35 | 42.02 | 24.63 |
| Soala | 11.25 | 57.53 | 88.75 | 42.47 | 6.48 | 51.05 | |
| Tembin | 47.99 | 36.25 | 52.01 | 63.75 | 17.38 | 18.84 | |
Table 5.
Balances for all P and TSS fluxes at upstream and downstream during typhoon periods.
| Typhoon | Upstream Site (S1) P Loading (kg) | Upstream Sites (S1, S2 & S3) P Loading (kg) | ||||||||
|---|---|---|---|---|---|---|---|---|---|---|
| TP | TDP | SRP | PP | TSS | TP | TDP | SRP | PP | TSS | |
| Talim | 0.7 | 0.4 | 0.2 | 0.2 | 1.3 × 10² | 24.8 | 15.2 | 6.9 | 9.6 | 3.6 × 10³ |
| Soala | 11.7 | 6.1 | 0.6 | 5.6 | 5.0 × 10⁴ | 317.8 | 178.4 | 18.8 | 139.4 | 3.3 × 10⁶ |
| Tembin | 0.5 | 0.2 | 0.1 | 0.2 | 2.9 × 10² | 13.5 | 8.3 | 4.0 | 5.1 | 1.2 × 10⁴ |
| Downstream Site (S2) P Loading (kg) | Downstream Site (S4) P Loading (kg) | |||||||||
| Talim | 16.0 | 8.8 | 4.3 | 7.2 | 2.3 × 10³ | 107.0 | 68.1 | 37.2 | 38.8 | 7.4 × 10³ |
| Soala | 177.3 | 99.6 | 10.3 | 77.7 | 1.6 × 10⁶ | 322.7 | 176.8 | 20.7 | 145.9 | 2.4 × 10⁶ |
| Tembin | 7.9 | 5.7 | 2.5 | 2.2 | 7.0 × 10³ | 15.7 | 6.7 | 4.2 | 8.9 | 1.4 × 10⁴ |
Table 6.
Correlations between hydrological factors with event mean concentrations (EMCs) and fluxes for all P forms.
Table 6.
Correlations between hydrological factors with event mean concentrations (EMCs) and fluxes for all P forms.
| Parameter | Storm Characteristics | |||||||
|---|---|---|---|---|---|---|---|---|
| Rdep | Rdur | I | Imax | Qave | Qpeak | ADD | API5 | |
| Event Mean Concentration (mg/L) | ||||||||
| TP | 0.134 | 0.491 | 0.134 | −0.011 | −0.021 | 0.007 | 0.142 | 0.307 |
| TDP | −0.155 | 0.416 | −0.155 | −0.170 | −0.054 | −0.086 | 0.487 | 0.025 |
| DOP | 0.372 | 0.775 ** | 0.372 | 0.386 | 0.421 | 0.393 | 0.034 | 0.332 |
| SRP | −0.852 | −0.472 | −0.852 ** | −0.895 ** | −0.468 | −0.464 | 0.797 ** | −0.607 * |
| PP | 0.134 | 0.057 | 0.134 | −0.011 | −0.036 | 0.021 | −0.146 | 0.271 |
| TSS | 0.931 ** | 0.472 | 0.931 ** | 0.903 ** | 0.582 * | 0.611 * | −0.818 ** | 0.704 ** |
| Fluxes (kg) | ||||||||
| TP | −0.063 | −0.246 | −0.063 | −0.150 | −0.004 | 0.032 | 0.140 | −0.025 |
| TDP | 0.020 | −0.076 | 0.020 | −0.082 | 0.022 | 0.063 | 0.135 | 0.102 |
| DOP | 0.062 | −0.047 | 0.062 | −0.047 | 0.072 | 0.115 | 0.078 | 0.163 |
| SRP | 0.142 | −0.086 | 0.142 | 0.062 | 0.117 | 0.171 | 0.028 | 0.102 |
| PP | −0.073 | −0.399 | −0.073 | −0.174 | −0.034 | 0.009 | 0.071 | −0.062 |
| TSS | 0.170 | −0.340 | 0.170 | 0.054 | −0.111 | −0.071 | −0.261 | 0.300 |
Notes: ** Correlation is significant at the 0.01 level (2-tailed); * Correlation is significant at the 0.05 level (2-tailed).
© 2017 by the authors. Licensee MDPI, Basel, Switzerland. This article is an open access article distributed under the terms and conditions of the Creative Commons Attribution (CC BY) license (http://creativecommons.org/licenses/by/4.0/).
Share and Cite
MDPI and ACS Style
Chow, M.F.; Huang, J.-C.; Shiah, F.-K. Phosphorus Dynamics along River Continuum during Typhoon Storm Events. Water 2017, 9, 537. https://doi.org/10.3390/w9070537
AMA Style
Chow MF, Huang J-C, Shiah F-K. Phosphorus Dynamics along River Continuum during Typhoon Storm Events. Water. 2017; 9(7):537. https://doi.org/10.3390/w9070537
Chicago/Turabian StyleChow, Ming Fai, Jr-Chuan Huang, and Fuh-Kwo Shiah. 2017. "Phosphorus Dynamics along River Continuum during Typhoon Storm Events" Water 9, no. 7: 537. https://doi.org/10.3390/w9070537
Note that from the first issue of 2016, this journal uses article numbers instead of page numbers. See further details here.