Regional Groundwater Flow Assessment in a Prospective High-Level Radioactive Waste Repository of China


1
College of Water Sciences, Beijing Normal University, Beijing 100875, China
2
Engineering Research Center of Groundwater Pollution Control and Remediation of Ministry of Education, Beijing Normal University, Beijing 100875, China
*
Author to whom correspondence should be addressed.
Water 2017, 9(7), 551; https://doi.org/10.3390/w9070551
Submission received: 13 June 2017
/
Revised: 7 July 2017
/
Accepted: 17 July 2017
/
Published: 23 July 2017
(This article belongs to the Special Issue Advances in Groundwater Flow and Solute Transport: Pushing the Hidden Boundary)
Abstract
:The production of nuclear energy will result in high-level radioactive waste (HLRW), which brings potential environmental dangers. Selecting a proper disposal repository is a crucial step in the development of nuclear energy. This paper introduces firstly the hydrogeological conditions of the Beishan area in China. Next, a regional groundwater model is constructed using a multiphase flow simulator to analyze the groundwater flow pattern in the Beishan area. Model calibration shows that the simulated and observed hydraulic heads match well, and the simulated regional groundwater flow pattern is similar to the surface flow pattern from the channel network, indicating that the groundwater flow is mainly dependent on the topography. In addition, the simulated groundwater storage over the period from 2003 to 2014 is similar to the trend derived from the Gravity Recovery and Climate Experiment satellite-derived results. Last, the established model is used to evaluate the influences of the extreme climate and regional faults on the groundwater flow pattern. It shows that they do not have a significant influence on the regional groundwater flow patterns. This study will provide a preliminary reference for the regional groundwater flow assessment in the site of the HLRW in China.
1. Introduction
Nuclear energy is considered as an additional dependable and clean energy source all over the world [1]. However, high-level radioactive waste (HLRW), which are the highly radioactive materials produced as a byproduct of the reactions that occur inside nuclear reactors, will probably bring potential dangers. Therefore, the proper disposal of nuclear waste is highly challenging.
The safety of high-level radioactive waste disposal has gained much attention in the world. In America, Yucca Mountain was regarded as a potential repository site of high-level nuclear waste in 2002, with many experimental and numerical studies performed on groundwater flow. The initial assessment of the regional groundwater system at Yucca Mountains was carried out in 1997 [2], and then the comprehensive evaluation and simulation of the system was performed in 2010 by using MODFLOW-2000 [3]. In addition, a site-scale model for fluid flow in the unsaturated zone of Yucca Mountain, including fracture flow [4,5,6,7] and parallel computing [8], was developed by Transport Of Unsaturated Groundwater and Heat 2 (TOUGH2) to reproduce the overall system behavior. Finland was the first country to propose an ultimate disposal way for HLRW. In 2001, Finland selected a high-level radioactive waste disposal site based on field investigation and numerical simulation [9]. A kind of crystalline rock, which is tectonically and geochemically stable, was selected as the ultimate rock of high-level radioactive waste disposal site in Finland. According to the regional groundwater assessment, the groundwater flow in fractures plays a significant role in the regional groundwater system. In Sweden, because one of the candidate sites is located on the coast of the Baltic Sea and composed of 26 catchment areas and 96 subcatchments in total, the integrated hydrogeological-hydrological analysis are required to assess groundwater flow paths in the bedrock for a reasonable repository site selection [10]. After some detailed tests and numerical studies, Forsmark in Sweden was considered as the final repository for short-lived radioactive waste in 2009. This method provides an optional method for safety assessment of regional groundwater flow in the regions with special topographic or climate conditions. In China, research on the disposal of HLRW has only been performed since 1985. The Beishan area was selected as the most prospective site for a disposal repository of HLRW in 1993 [11], with the tectonically stable rock and arid climate. A simplified numerical model of the regional groundwater flow in the Beishan area was developed [12]. In recent years, to trace the recharge source of groundwater and explore groundwater age in the Beishan area, hydrogeological and isotopic studies have been performed [13,14], which suggest that the main recharge source of groundwater is rainfall. However, the regional groundwater flow pattern in the Beishan area has not been fully discussed to date. Therefore, it is necessary to develop an understanding of a saturated-unsaturated groundwater model to assist site selection for the disposal of HLRW. In addition, the influences of climate change or faults on regional groundwater flow patterns needed to be further addressed.
The objective of this study includes two aspects. One is to analyze and evaluate the regional groundwater flow patterns by using an established saturated-unsaturated groundwater model. The model results then will be further used to subdivide groundwater flow systems, which is helpful to refine the radioactive waste disposal site selection in China. The other objective is to test how the flow in the proposed disposal site is influenced by the hydraulic properties of regional fault zones and by climate change. After the model construction, the changes of the groundwater level and the soil moisture will be discussed in detail. Next, the simulated variations of groundwater storage and soil water are compared with the Gravity Recovery and Climate Experiment (GRACE) satellite-derived results. Last, the groundwater budgets and the influences of extreme climate and regional faults on the groundwater flow system will be evaluated. This study will provide a preliminary reference for the regional groundwater flow assessment in a potential high-level radioactive waste repository of China.
2. Method
2.1.Study Area
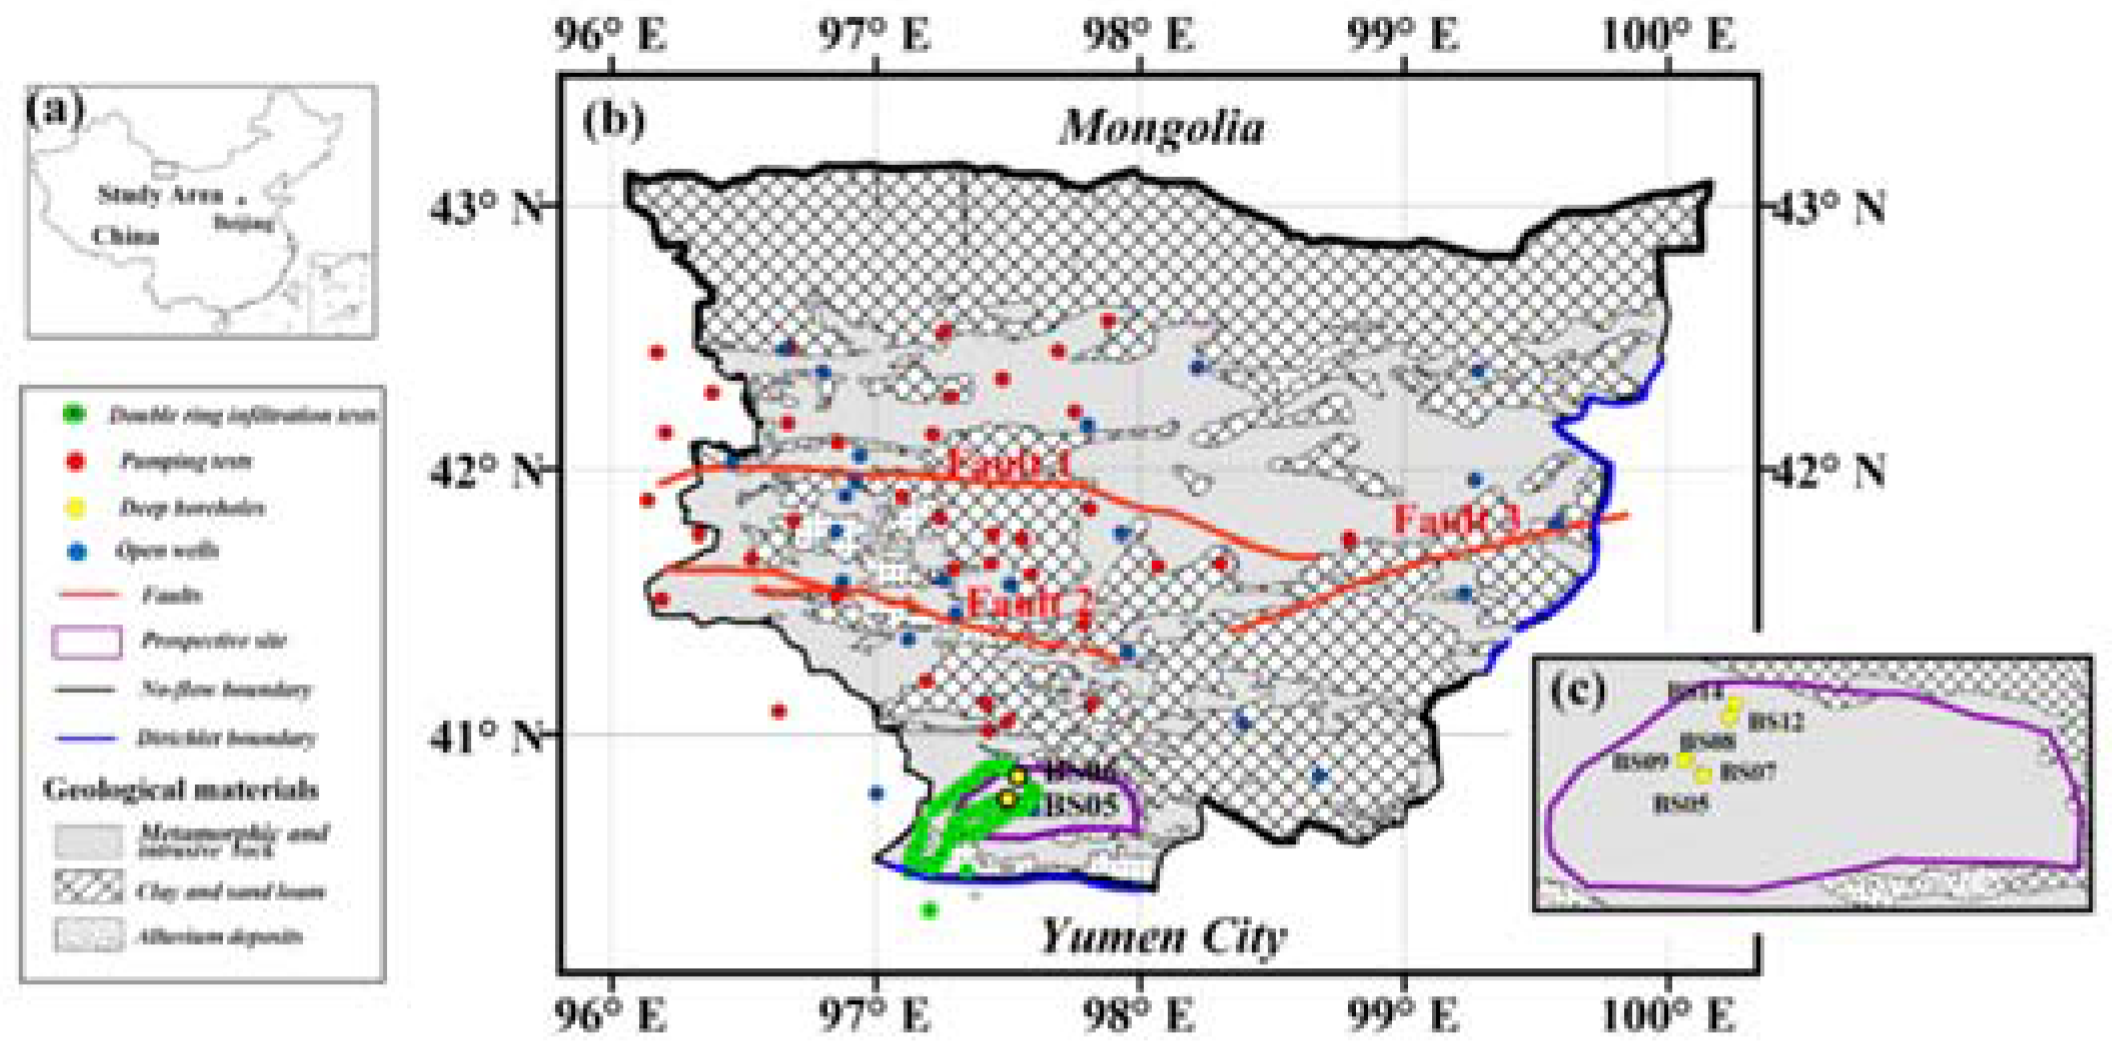
The Beishan area is a typical inland arid region with an area of approximately 68,900 km2. The area is located in Gansu Province, northwestern China (Figure 1) and is surrounded by Mongolia to the north, and Yumen City in the south. The area includes the Shu-le river basin in the west and the Heihe river basin in the east. The yearly average rainfall is 60–100 mm, and 60% of the total rainfall is from June to August. The mean annual potential evaporation is 2900–3200 mm, and the mean annual surface temperature is 4–5 °C.
The study area is mainly composed of flatter Gobi and small hills, and depression and valleys are distributed among them, forming an undulating topography. The elevation varies significantly from 873 m to 2556 m over the study area. And the higher mountains, with the elevation from 1700 m to 2500 m, are located in the middle east of the study area. The geological materials in the study area can be classified into Proterozoic metamorphic (schist), intrusive (granite) rocks, Quaternary clay and sandy loam weathered from schist and granite, with occasional alluvium deposits. Part of locations with rock represent locations without clay or sandy loam (scale is 1:500,000, Figure 1). The thicknesses of the clay and sandy loam and alluvium deposits are less than 50 m. Faults and fractures are distributed from Quaternary deposits to the intensely weathered granite in the study area, but most faults are tension faults and filled with quartz according to the investigation [15].
2.2. Model boundaries and their representations
To obtain the drainage divide, the USGS/NASA Shuttle Radar Topography Mission (SRTM) data in 3 arc seconds is used to extract channel network and watershed information. The main procedures in Arc Hydro Tools in ArcGIS software include Digital Elevation Model (DEM) pretreatment, determination of the direction of flow, and extraction of flow accumulation, channel network, watersheds and watershed division. The colormap of the DEM and generated channel network are shown in Figure 2. The study area is surrounded by a natural surface divide in the north, the west and the partial east boundaries (Figure 2). Considering human activities, such as groundwater pumping in Yumen City, the south boundary is set between Yumen City and Gobi. There are nearly no rivers in the study area. The top layer of this model is set as the atmosphere layer. The bottom layer is assumed to be a no-flow boundary. No long-term observation well data are available, and hydraulic heads at 33 open wells are collected from 2008 to 2009. The depth to groundwater in open wells almost varies from 5 m to 50 m, occasionally over hundreds of meters. Field investigation from 2012 to 2015 found that the inter-annual variation of water table in open wells is very small, usually less than 0.1 m, and yearly average of water table remain almost the same. According to the measured results [16], the depth to the groundwater level in BS09, BS12, BS14, BS05 are 59.5 m, 5.2 m, 36.6 m, 65 m, respectively. Vertical changes of soil moisture are not measured. Vertically, soil water usually changes from unsaturated state to fully-saturated state.
As investigated by the Beijing Research Institute of Uranium Geology (2010) [16], the metamorphic rock and intrusion rock extend from the surface to the depth of over 600 m. The permeability of original metamorphic and intrusion rock is low. However, because faults and fractures are occasionally distributed in the study area, hydraulic conductivity at the intersections of faults and fractures is relatively high. The metamorphic rock and intrusion rock can be simplified into three types according to logs of deep drillings [16], i.e., intensely weathered, middle weathered, and weakly weathered or even unweathered layers, where the thicknesses of the three layers are 50, 100, and 500 m, respectively. To better present the change of groundwater level and soil moisture in the unsaturated zone, the intensely weathered layer is refined to 15 model layers, where the thickness of each layer is 0.1, 1.4, 0.5, 1.0, 1.0, 2.0, 2.0, 2.0, 2.5, 2.5, 3.0, 3.0, 9.0, 10.0 and 10.0 m. The middle weathered layer is refined to five layers with the same thickness (20 m). The weakly weathered or unweathered layer is refined to three layers, and the thicknesses of the three layers are 100, 200 and 200 m (Figure 3). In total, the model is divided into 23 model layers, so that the processes of the unsaturated-saturated interface can be identified by the transition from two-phase flow to single-phase flow in the numerical simulation.
2.3. Numerical Model
The parallel version of multiphase flow simulator is adopted in this study. TOUGH2 is a model based on the integral finite difference method, which could offer the advantage of being applicable to regular or irregular discretization in one, two and three dimensions [17]. The governing equations of TOUGH2 are established from mass and energy balance. Fluid flow is described with a multiphase extension of Darcy’s law; in addition there is diffusive mass transport in all phases. Heat flow is governed by conduction and convection, also including sensible as well as latent heat effects. Time will be discretized fully implicitly as a first-order backward finite difference. The nonlinear equations in the residual form are solved by Newton/Raphson iteration [18]. The EOS3 module in TOUGH2 can simulate water and air movement in isothermal and nonisothermal conditions. The single and two-phase conditions can be easily known from the range of a primary variable [17]. This module was employed to simulate the regional groundwater flow in the saturated-unsaturated zone of the study area, and it could describe fluid and heat flow in multiphase, multi-component systems [18,19]. The mass and energy equations for the two-phase flow of two components (water, air) in the TOUGH2/EOS3 module are summarized in Table 1 [20]. The unsaturated-saturated interface can be judged by the transition from the state of two-phase flow to that of single-phase flow.
3. Data Preparation
3.1. Elevation and Model Discretization
The topography is important for both regional and local groundwater flow patterns [21]. The elevation is derived from the SRTM data in 3 arc seconds, where Reuter recreated products by adopting void-filling interpolation methods to obtain higher-quality SRTM data [22]. The elevation changes from over 2300 m in the west to 900 m in the eastern part. By using IGMESH [23], which is a convenient irregular-grid-based pre- and post-processing tool for the TOUGH2 simulator, the study area is discretized into 12,390 gridblocks in the plane and 23 model layers in the vertical direction. There are 284,970 gridblocks and 1,120,107 connections in total (Figure 4). The prospective site of the disposal repository is refined for better characterization of the groundwater flow.
3.2. Hydraulic Properties
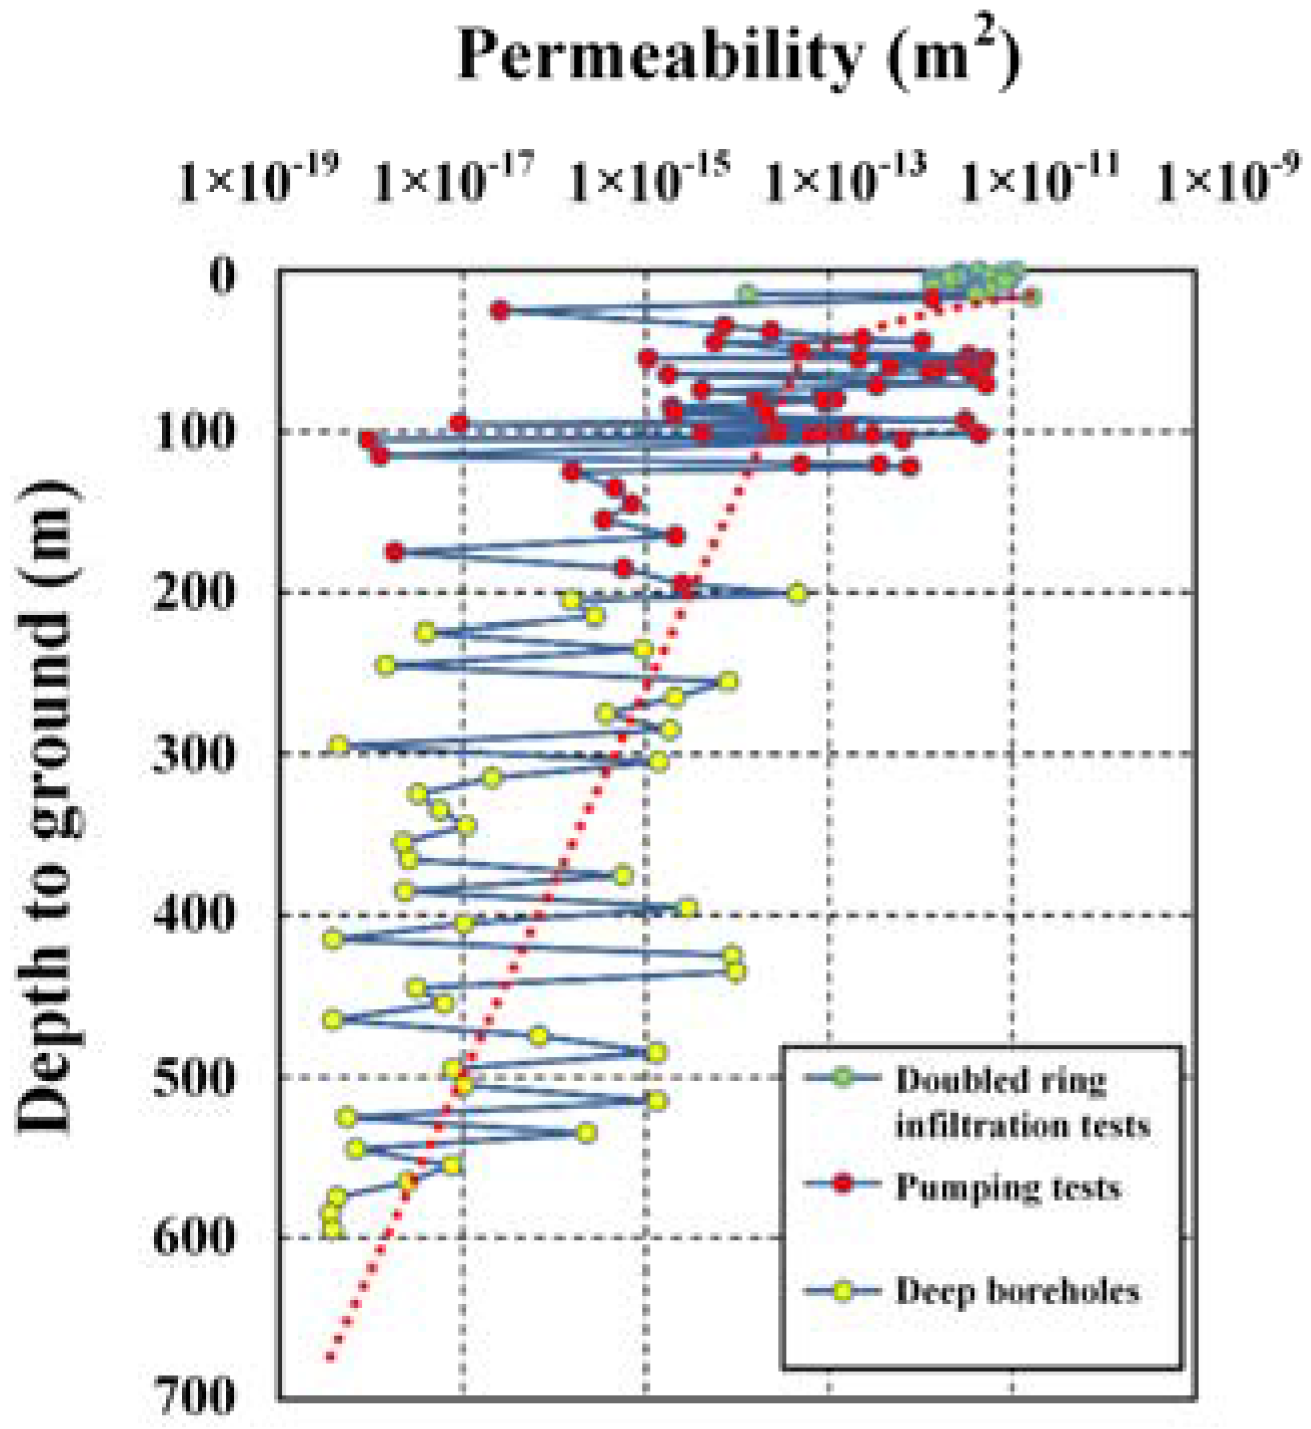
Since 2005, the Beijing Research Institute of Uranium Geology has performed many field investigations via borehole drilling as well as hydrogeochemical and isotope sampling in an effort to identify a feasible site for high level radioactive waste disposal. The institute summarized hydraulic conductivity data from many pumping tests [16]. Hydraulic tests can be divided into three types: pumping tests, double ring infiltration tests and double packer hydraulic tests. There are 37 shallow wells with traditional pumping tests, and the locations of these tests are shown in Figure 1, where the range of the estimated hydraulic conductivity is from 0.0015 to 3.82 m/day. Double ring infiltration tests were conducted to estimate the hydraulic conductivity of the shallow soil in 2013 and 2014, and there are 113 test data points in total. The range of hydraulic conductivity estimated by the double ring infiltration tests is 0.11–18.8 m/day, and the arithmetic mean value of hydraulic conductivity is approximately 4.27 m/day. Double packer hydraulic tests were performed at deep wells BS05 and BS06, where the depth of the drilling borehole is approximately 600 m below the surface. According to a large number of double packer hydraulic tests, the mean values of the hydraulic conductivities at BS05 and BS06 are 0.0088 and 0.00018 m/day, respectively. Considering all the test results, the change of permeability with the depth to the surface obtained from all test data [16] is summarized in Figure 5. The permeability is found to have an almost exponentially deceasing trend with the depth. The permeability obtained from these wells are in the range of 1 × 10⁻¹¹ to 1 × 10⁻¹⁸ m2.
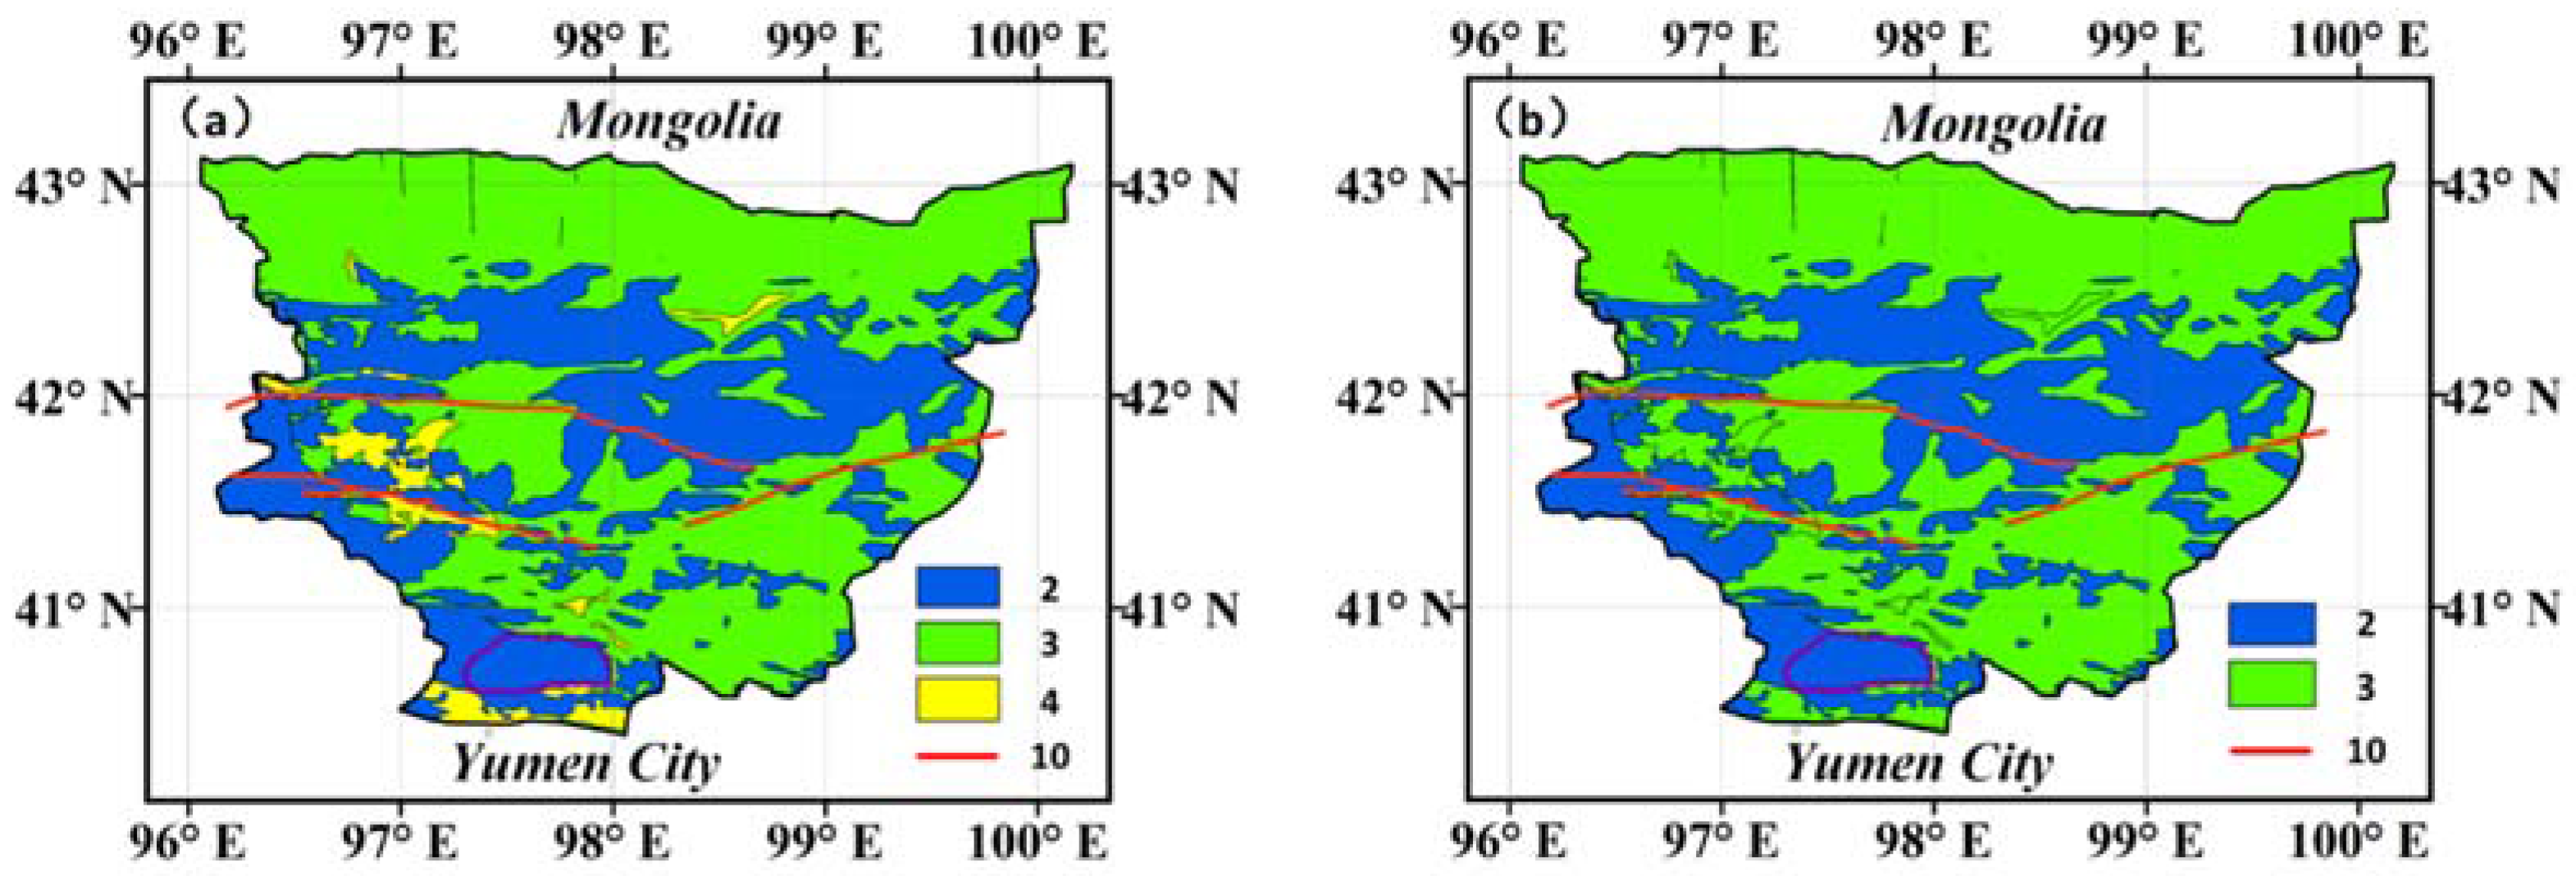
Vertically, there are 23 model layers in total. Table 2 lists the vertical model layers and the zonation of hydraulic properties for each layer. The lithology zoning map at the 2nd layer and the 3rd layer (Figure 6) are made from the geological zones in Figure 1. The rock grain density, formation heat conductivity and pore compressibility are assumed to be uniform, at 2650 kg·m−3, 1 W·m−1·°C−1 and 3.7 × 10⁻¹⁰ Pa−1, respectively. The heat capacity of the top layer is set as 8.0 × 1099 J·kg−1·°C−1, and the values of the other layers are set as 1000 J·kg−1·°C−1. The relative permeability and capillary pressure were calculated by the van Genuchten–Mualem model [24]. In addition, related parameters and the pore compression coefficient of the model were obtained according to the empirical value of soil. Because the study area is almost composed of low-permeability media, such as metamorphic and intrusive rocks, parameters for estimating relative permeability in the van Genuchten-Mualem model remain the same for each type of rock. Among them, λ (a parameter in Van Genuchten–Mualem function) is equal to 0.492. Residual liquid saturation Slr and residual gas saturation Sgr are both set as 0.01, and saturated liquid saturation Sls in the Van Genuchten–Mualem Model is 1.0. Initial capillary pressure P0 and maximum capillary pressure Pmax are set as 1.0 × 10³ Pa and 1.0 × 10¹² Pa also based on the empirical value, respectively.
3.3. Regional Faults
Geological investigation [15] verified that fractures and regional faults are developed in the Beishan area (Figure 1). Usually, there are granite and quartz fractures with filling materials. The field investigation in 2013 and 2014 and previous geological studies (scale is 1:500,000) found that the regional faults extend along the south-eastern, north-eastern, and east-western directions, and the inclination of those faults is mainly between 60° and 70°. In the model, the regional faults are assumed to extend vertically to a depth of approximately 80 m. In addition, the widths of the faults are usually greater than 0.01 m on surface rocks, and then are reduced to 0.001–0.003 m in the depth of 650 m. However, the properties of faults are not fully recognized. In this model, three groups of regional faults (Figure 1) are modeled by the method of Equivalent Permeability Medium, and key parameters are listed in Table 2 (zone 10). They are considered to analyze their influences on the regional groundwater flow pattern.
3.4. Initial Conditions and Boundary Conditions
The initial pressure field is assumed to be under hydrostatic equilibrium by running the model over hundred thousands of years with yearly average rainfall infiltration (90 mm). The temperature field is determined from a surface temperature of 15 °C and a common geothermal gradient of 30 °C/km. This model is assumed to be isothermal. The hydraulic head can be converted from pressure according to Equation (1). The fluxes at the southern and partial eastern boundaries are difficult to ascertain. Thus, the model sets gridblocks at the boundary as constant pressure in TOUGH2, which is estimated by field investigations.
where P is the water pressure, Pa; P0 is the standard atmospheric pressure, Pa; ρ is the water density, kg/m3; g is the gravitational acceleration, m/s2; and H is the hydraulic head, m.
3.5. Source and Sinks
The main groundwater recharge item is precipitation infiltration. Groundwater discharge mainly includes evapotranspiration and lateral outflow. Monthly precipitation data over the study area are obtained from data of the Global Precipitation Climatology Project (GPCP), which is a section of the WCRP (the World Climate Research program). The GPCP dataset integrated infrared and microwave satellite observations, and 6000 global conventional observation data points are proven to be reliable precipitation data sources [25,26,27]. The change of monthly rainfall from 2003 to 2014 is shown in Figure 7, and the yearly average rainfall is approximately 90 mm. Most rainfall is from June to September.
The methods for recharge estimation include in situ experiments of tritium migration (TM) and chloride mass balance (CMB) [28]. According to the tests, the estimated infiltration recharge rates are approximately 2.55 to 6.57 mm/year based on in situ experiments of TM, 0.05 to 1.57 mm/year based on the CMB method in unsaturated zones, and 0.287 mm/year based on the CMB method in saturated zones [14]. So the infiltration rates from the precipitation on the top boundary are set as 0.01 and 0.004 for Quaternary and the weakly permeable strata respectively.
4. Model Calibration
The time period for model calibration is set from January of 2003 to December of 2014. In this study, calibration targets include observed hydraulic heads, and GRACE (Gravity Recovery and Climate Experiment)-derived groundwater storage.
4.1. Comparison of Simulated and Observed Hydraulic Heads
The simulated pressure from TOUGH2 software is converted to the hydraulic head by Equation (1). A comparison of the simulated and observed hydraulic heads at 33 open wells is shown inFigure 8. Here, the relative error is defined as the ratio of the absolute error of observed and simulated values to the observed values. Of the simulated data, 91% are in the range of the relative error in 2%. Overall, the fit between the simulated values and observed values is reasonable. The poor match between the observed and simulated results may be caused by the representations in the models of coarse resolution of hydrogeology zonation, averagely allocation of sources and sinks over a region, and heterogeneity of rock.
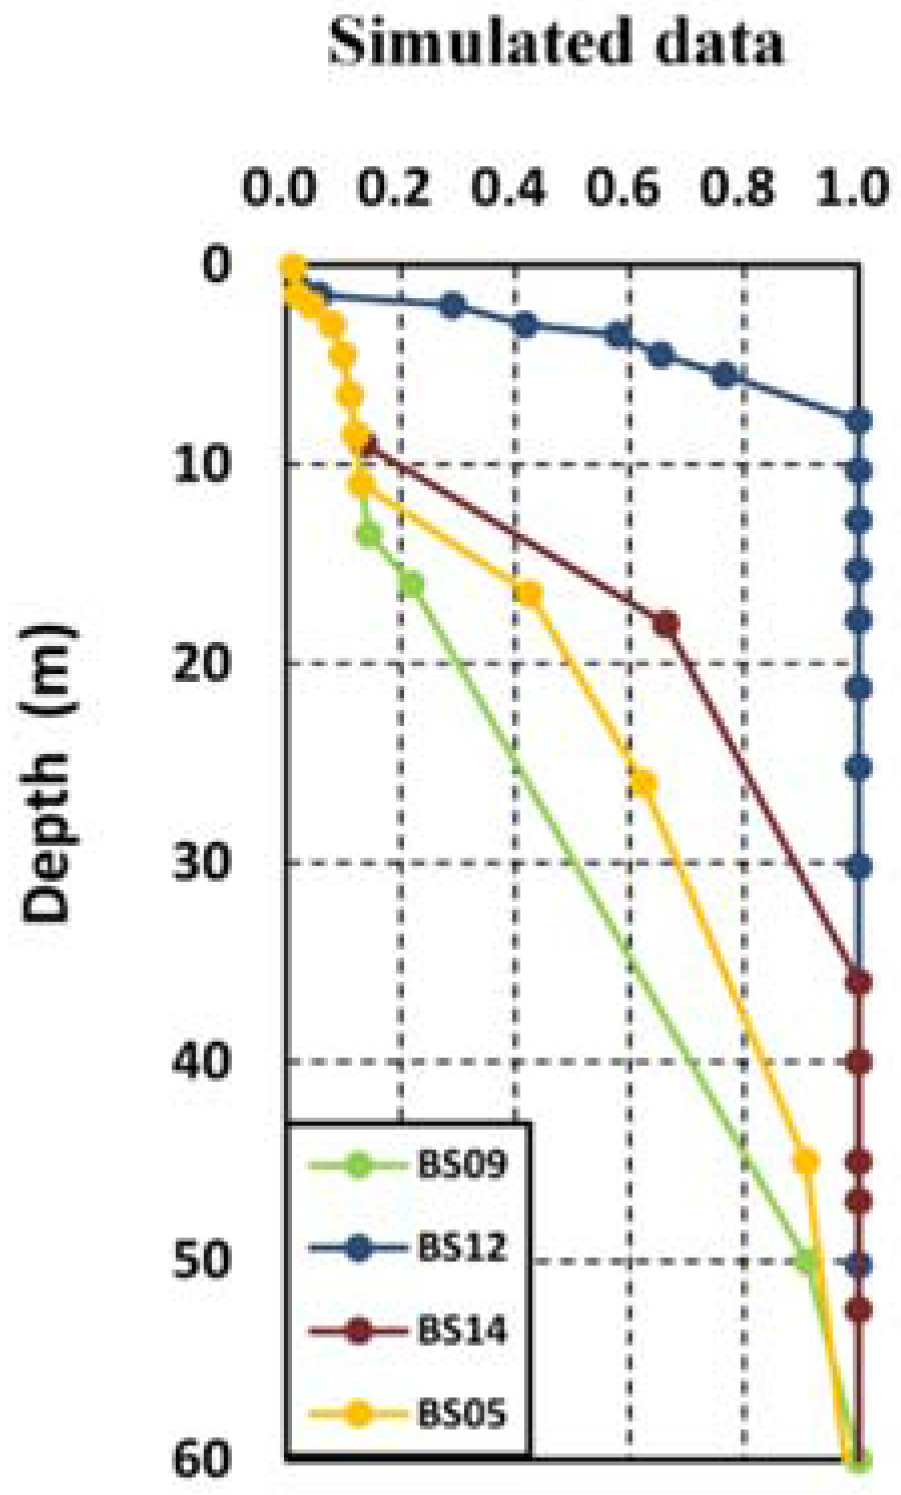
The change of soil moisture with depth at the end of 2014 is shown in Figure 9. From Figure 9, the depth of water table is basically in accordance with the measured depth to the groundwater level [16], which reveals that the simulated values fit the measured values well. In addition, some scholars performed tests on the soil permeability of the aeration zone in the study area [14], and they found that the soil permeability varied significantly at the spatial scale. As the graph shows, there is an obvious sudden change at the depth of 2 m for BS12 and approximately 10 m for the other boreholes. Because the shallow layer is composed of sand, clay and some intensely weathered granite and the permeability of these rocks are different, there is also some difference among the liquid saturation levels. For BS12, the depth of sand and clay is approximately 2 m; thus, a change occurs at that depth, and then, the liquid saturation reached saturation quickly. Regarding the other boreholes, the granite weathering degree is more serious than that below 10 m; thus, an abrupt change occurred at approximately 10 m below the surface.
4.2. Groundwater Flow Patterns
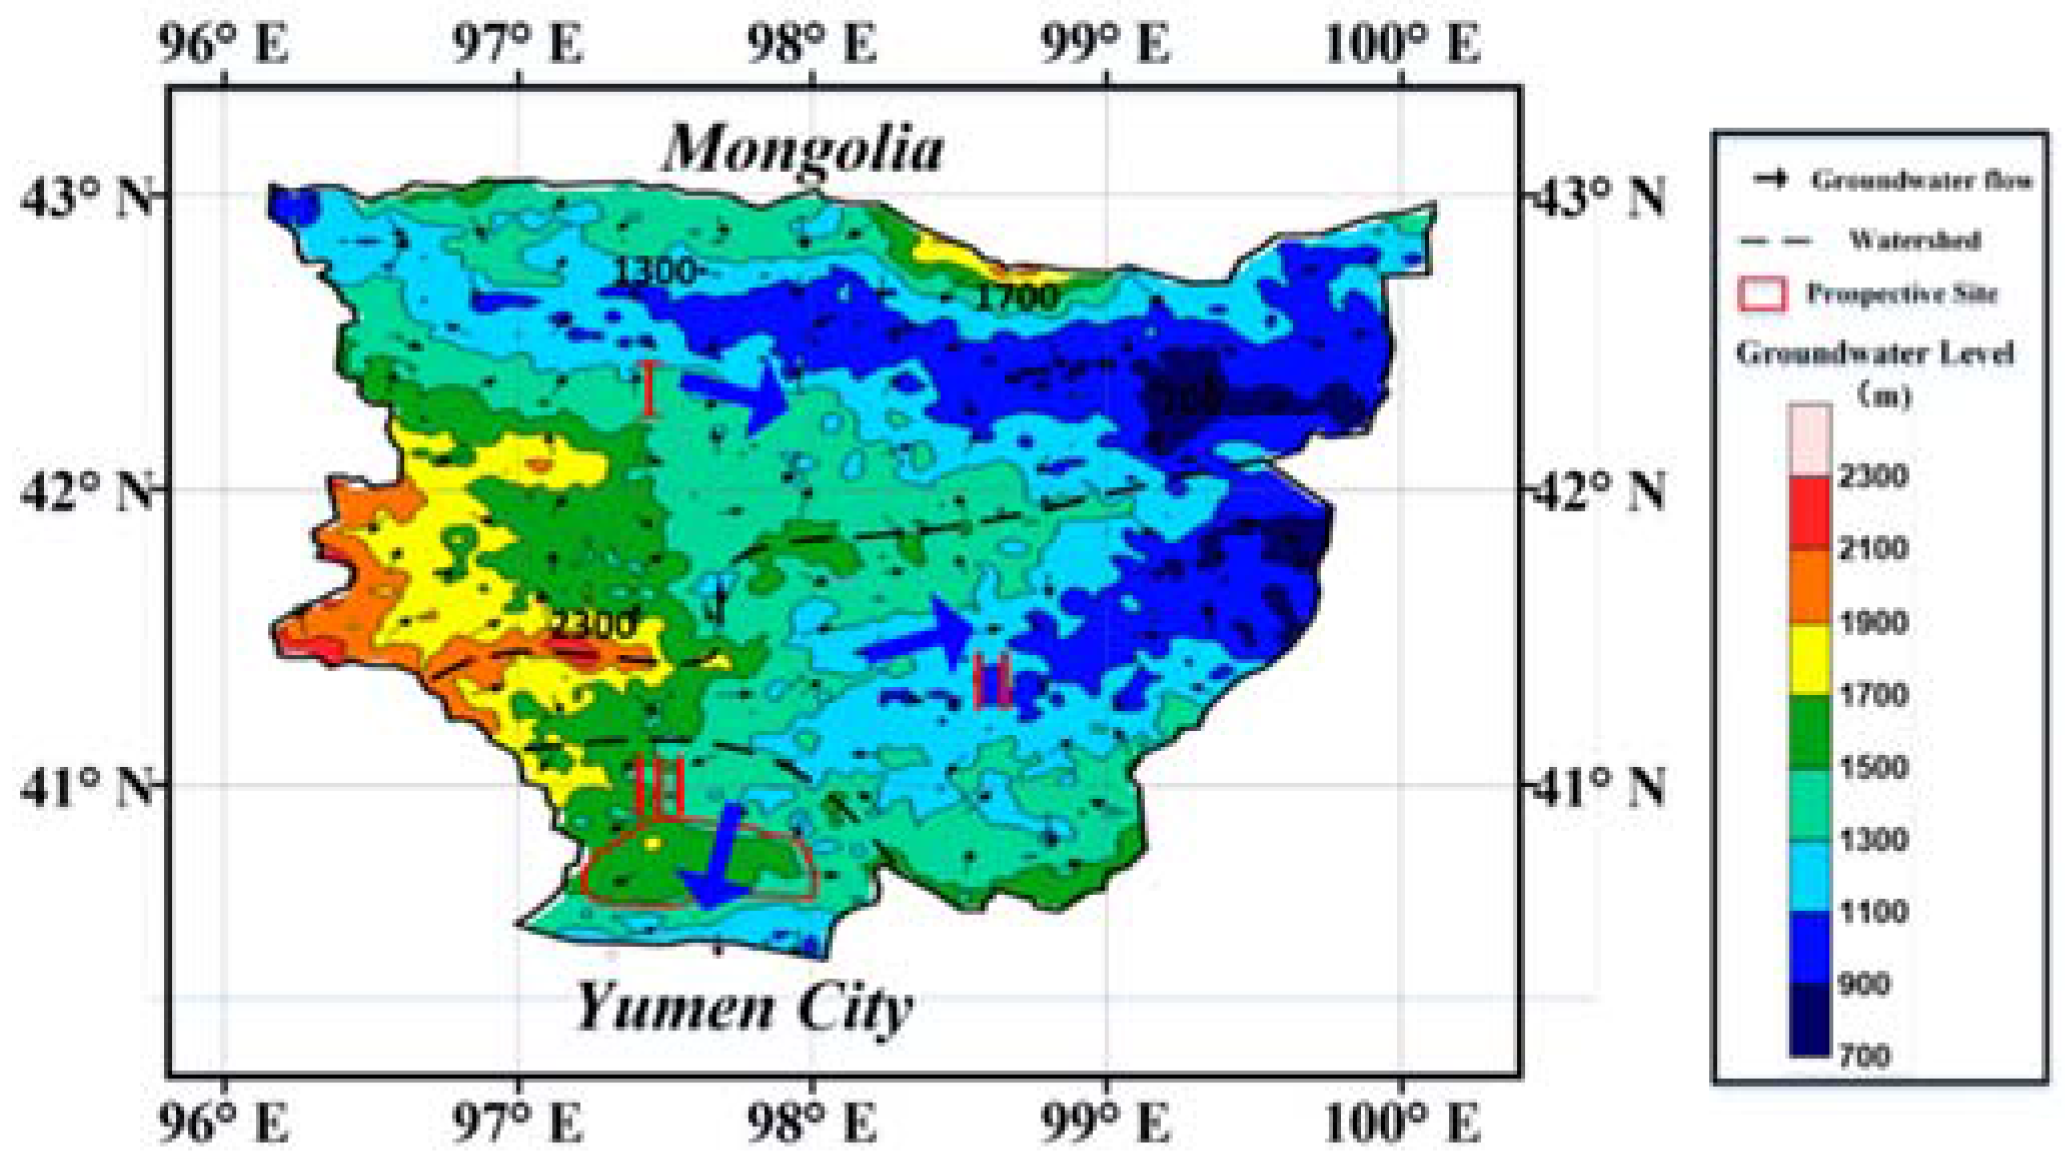
Figure 10 shows the groundwater flow pattern in the Beishan area. The groundwater level in Figure 10 ranges approximately from 700 m to 2300 m (a.s.l.), with the lowest in the northeast and the highest in the mid-west. Then, the groundwater system in the study area can be divided into three local groundwater systems. Local groundwater in unit I and II flow towards the southeast and the northeast respectively, and then flow into the downstream of the Heihe River Basin. Groundwater in unit Ⅲ flows to the south boundary. Meanwhile, the prospective site for high-level radioactive waste disposal is located in the unit Ⅲ, so the hydrostratigraphic units should be further investigated for finalizing site selection. Comparing Figure 10 and Figure 2, the groundwater flow is found to have almost the same pattern as surface flow, suggesting that groundwater flow is mainly dependent on the topography.
4.3. Change of Groundwater Storage
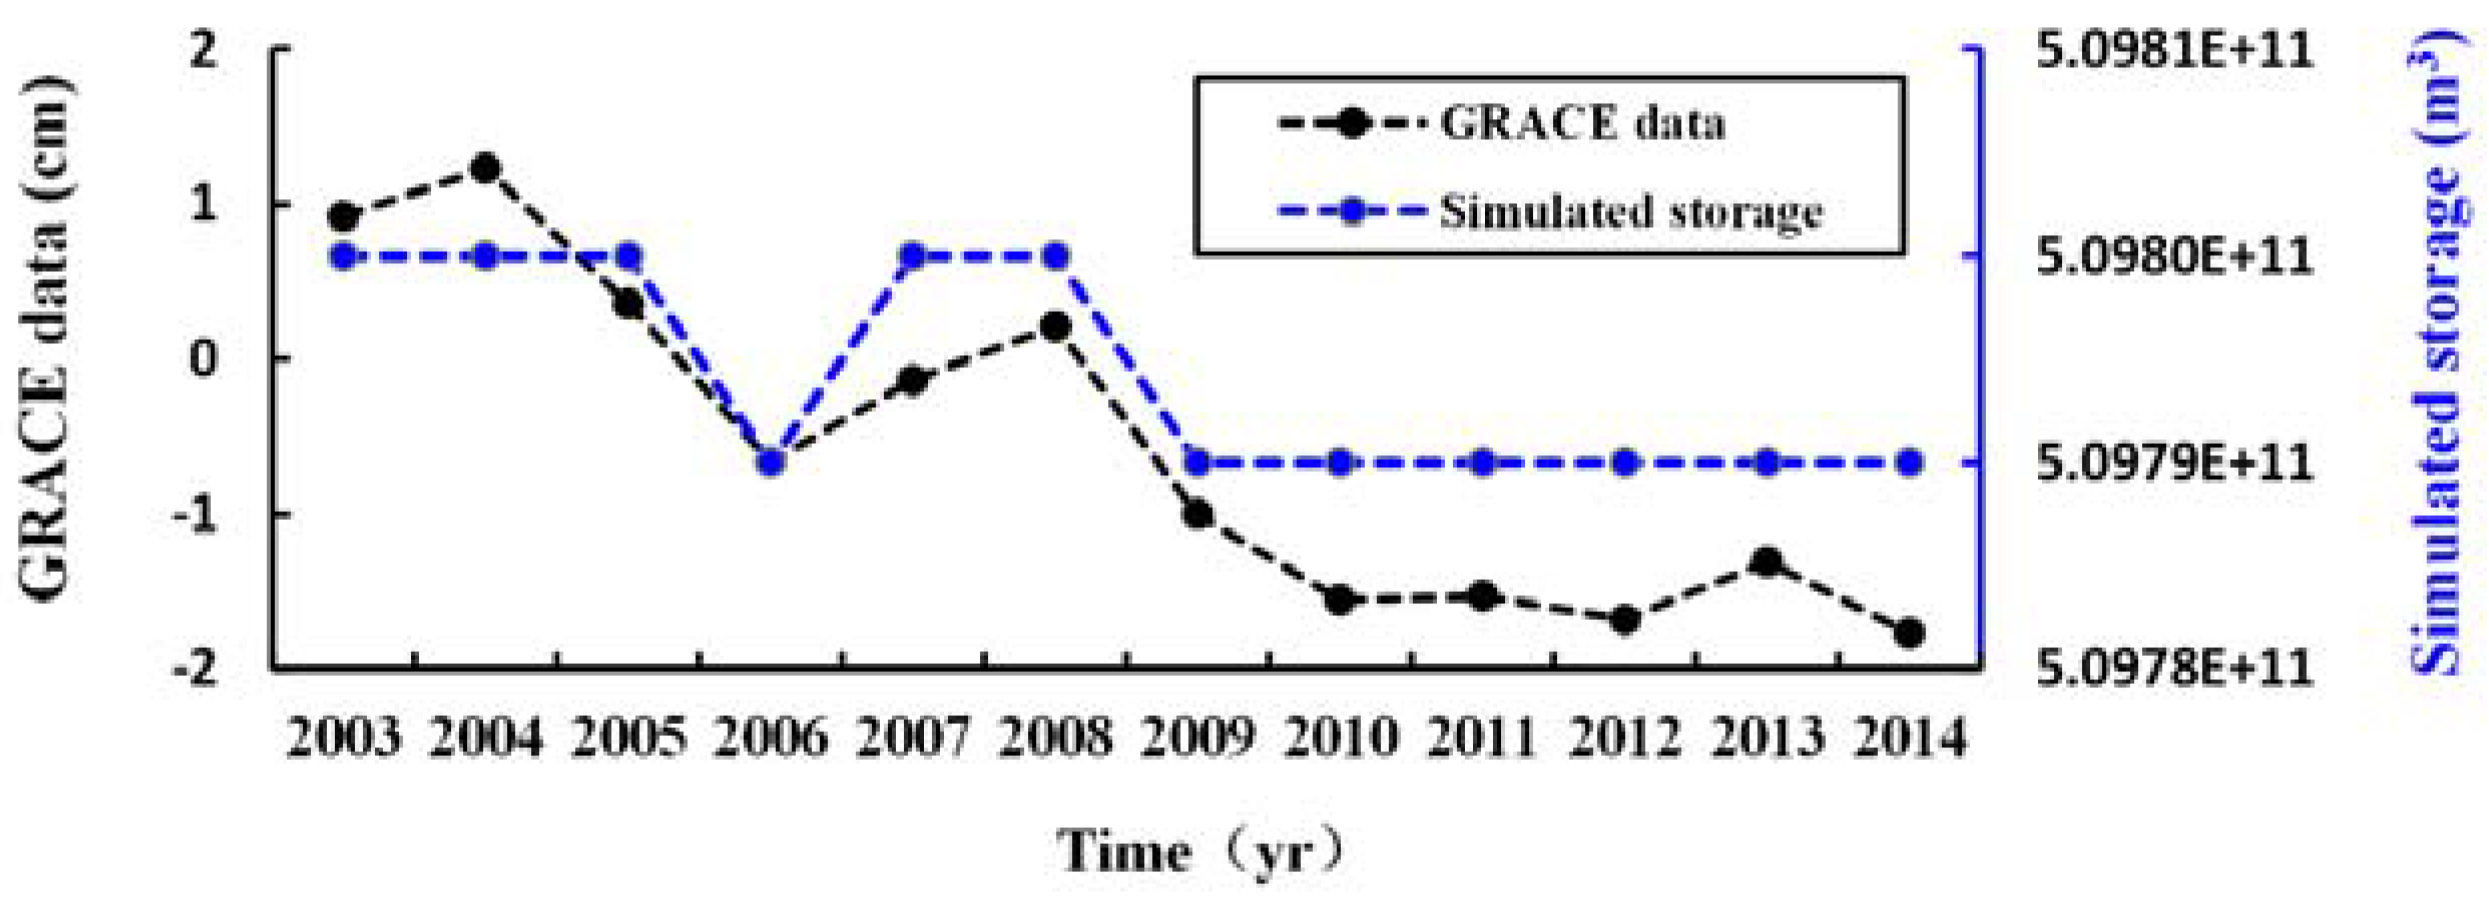
Limited point-based observation well data make it difficult to sufficiently calibrate the numerical model in the study area. In this situation, the simulated groundwater storage changes are compared with the GRACE-derived results. The Gravity Recovery and Climate Experiment (GRACE) satellite can monitor the time-dependent earth’s gravitational field and then obtain the groundwater storage variation by inversion calculation [29,30]. The GRACE-derived terrestrial water storage (TWS) includes surface water, groundwater, soil water and snow water. Recent studies verified that TWS can be directly estimated from GRACE data for certain large basins when appropriate smoothing is applied to reduce striping [31], and the TWS changes agree reasonably well, at least for long wavelengths, with those estimated from hydrology models and observation networks [29,32,33,34]. In data-poor regions of the world, such as desert and some remote mountainous regions, GRACE may represent the only option for regional groundwater assessments [35]. Because the study area is in an arid region, and the infiltration rate is so small that there are nearly no rivers; thus, the changes of both surface water and snow water are set as zero [36]. The GRACE-derived data in the study area represent the sum of groundwater and soil water. The numerical model in the saturated–unsaturated zone of the study area can output the changes of groundwater and soil water. A comparison of the groundwater and soil water storage changes with the GRACE-derived values is shown in Figure 11, which shows that the simulated storage trend is accordance with the GRACE-derived TWS variations.
5. Discussions
5.1. Groundwater Budgets
Groundwater budgets play important roles in analyzing regional groundwater flow. Groundwater budgets can be used to evaluate the generation of the groundwater and guide the groundwater management, especially in a large-scale region. In the Beishan area, the main groundwater recharge item is precipitation infiltration, and groundwater discharge mainly includes evapotranspiration and lateral outflow. The Beijing Research Institute of Uranium Geology conducted some field tests to obtain the precipitation infiltration recharge rate of unsaturated soil in the Beishan area.
According to the principle of water balance, the water resources budget can be expressed in Equation (2).
where P is the annual average precipitation, m; W is the study area, m2; ΔQ is the total groundwater storage variation (including soil water and saturated groundwater), m3; O is the outflow volume at the Dirichlet boundaries, m3; and S denotes the surface runoff and evaporation, m3.
In the numerical model, the yearly averaged precipitation is 90 mm. The yearly averaged outflow at the Dirichlet boundaries is approximately 1.03 × 10⁶ m3. Changes in the soil water and saturated groundwater are approximately −3.22 × 10⁵ m3/year. Thus, from Equation (2), surface runoff and evaporation account for approximately 99.99% of precipitation. Over the study area, approximately 0.01%–0.05% of the precipitation infiltrates into the groundwater.
For assessing the influence of the south boundary on groundwater flow in the Beishan area, different yearly annual precipitations (Table 3) are set to estimate the groundwater budgets. The results suggest the south boundary is not sensitive for the groundwater flow pattern in the Beishan area.
5.2. Influences of Climate Change on Groundwater Flow Pattern
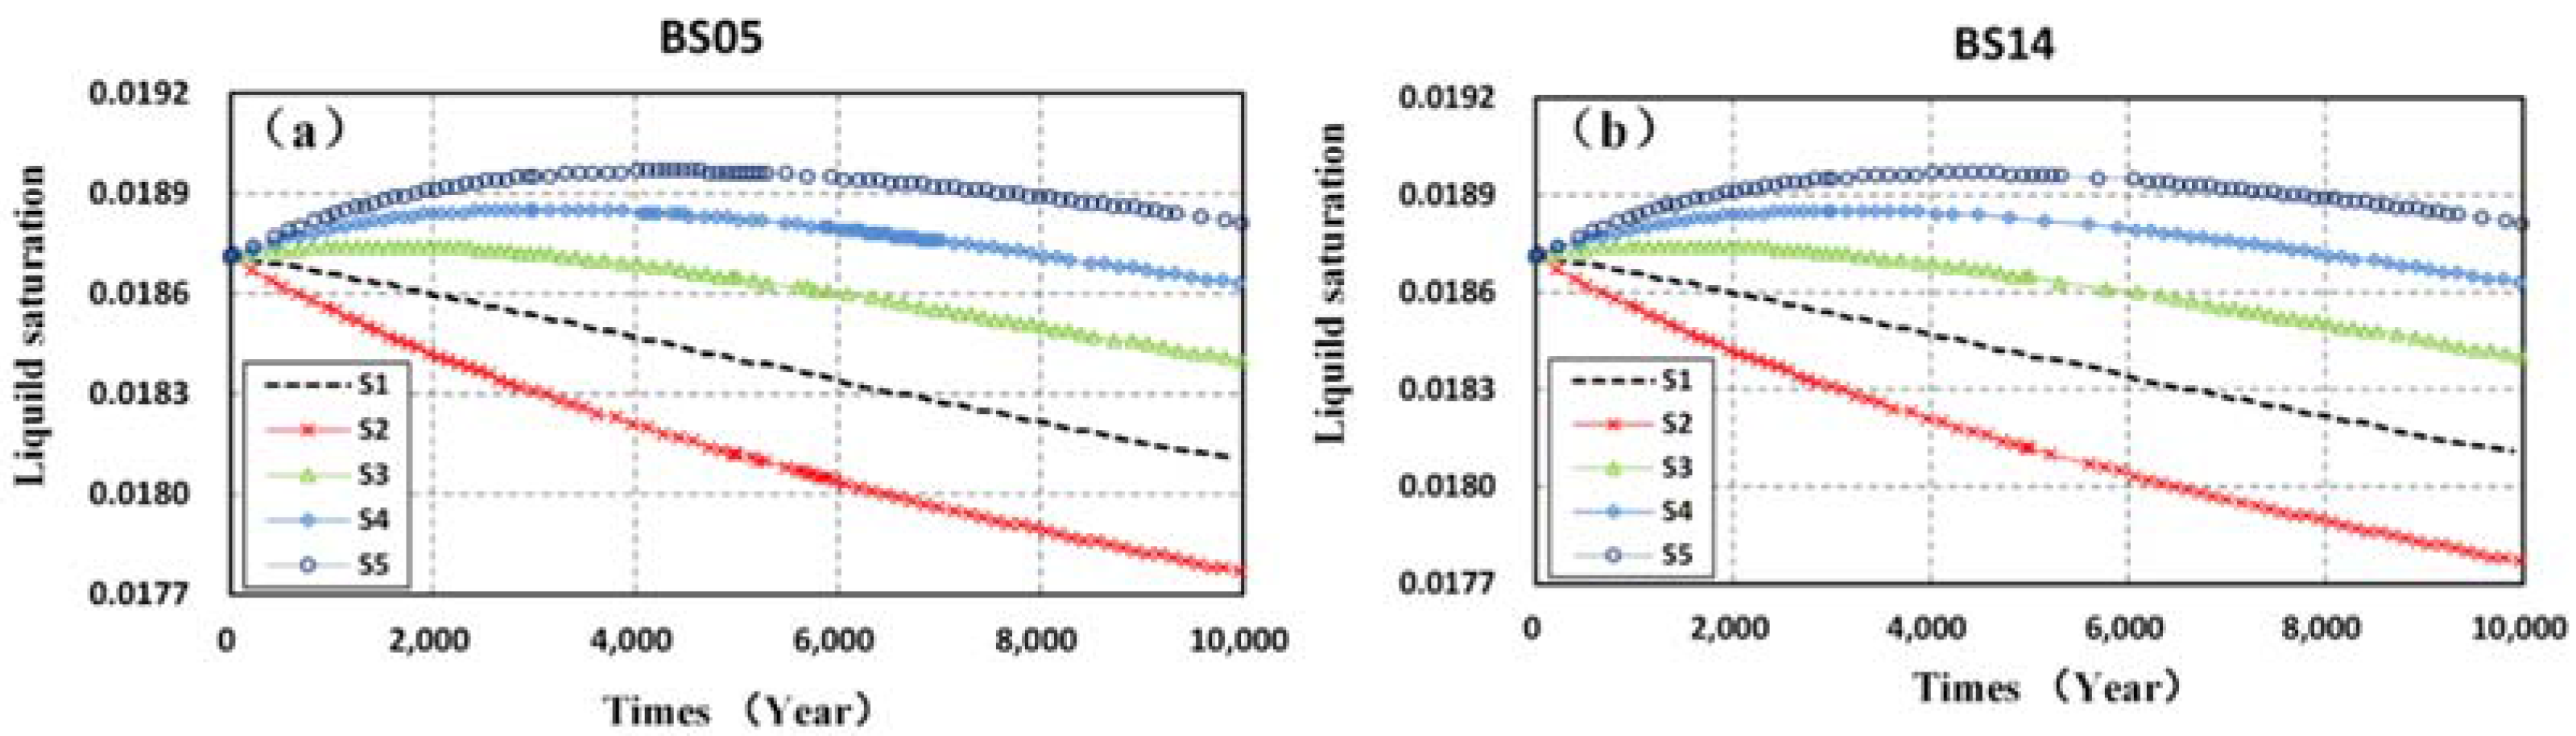
The safety of the disposal repository in the Beishan area is the primary concern. As discussed earlier, the main recharge of groundwater is precipitation. As a result, the climate changes under extreme conditions, such as wet and dry conditions, should be considered to evaluate their influences on the regional groundwater flow [37]. A long-term calculation is thus required for the variation of climate; as a result, the prediction period is set as 10,000 years. Five precipitation scenarios are set with yearly value at 90, 40, 200, 300 and 450 mm for S1, S2, S3, S4 and S5 scenario, respectively. S1 is the base scenario. S2–S5 represent different annual mean precipitation scenarios.
Figure 12 reveals the liquid saturation at the depth of 2 m in two boreholes. The result suggests that liquid saturation causes a change in a small range for each scenario, and higher precipitation will incur an increase of the liquid saturation level. The highest difference of liquid saturation between S5 and S1 is 7.0 × 10⁻⁴. The changes of liquid saturation with time at the two boreholes are very similar. From the pattern of the water table over the study area, the maximum difference of the water table relative to the base case is approximately 0.015 m for 10,000 years. The average groundwater velocity at the prospective site is approximately 4.66 × 10⁻¹³ m/s, and it shows no obvious change under five climate scenarios, suggesting that climate changes will have a limited effect on the groundwater flow in the Beishan area.
5.3. Influences of Faults on Regional Groundwater Flow
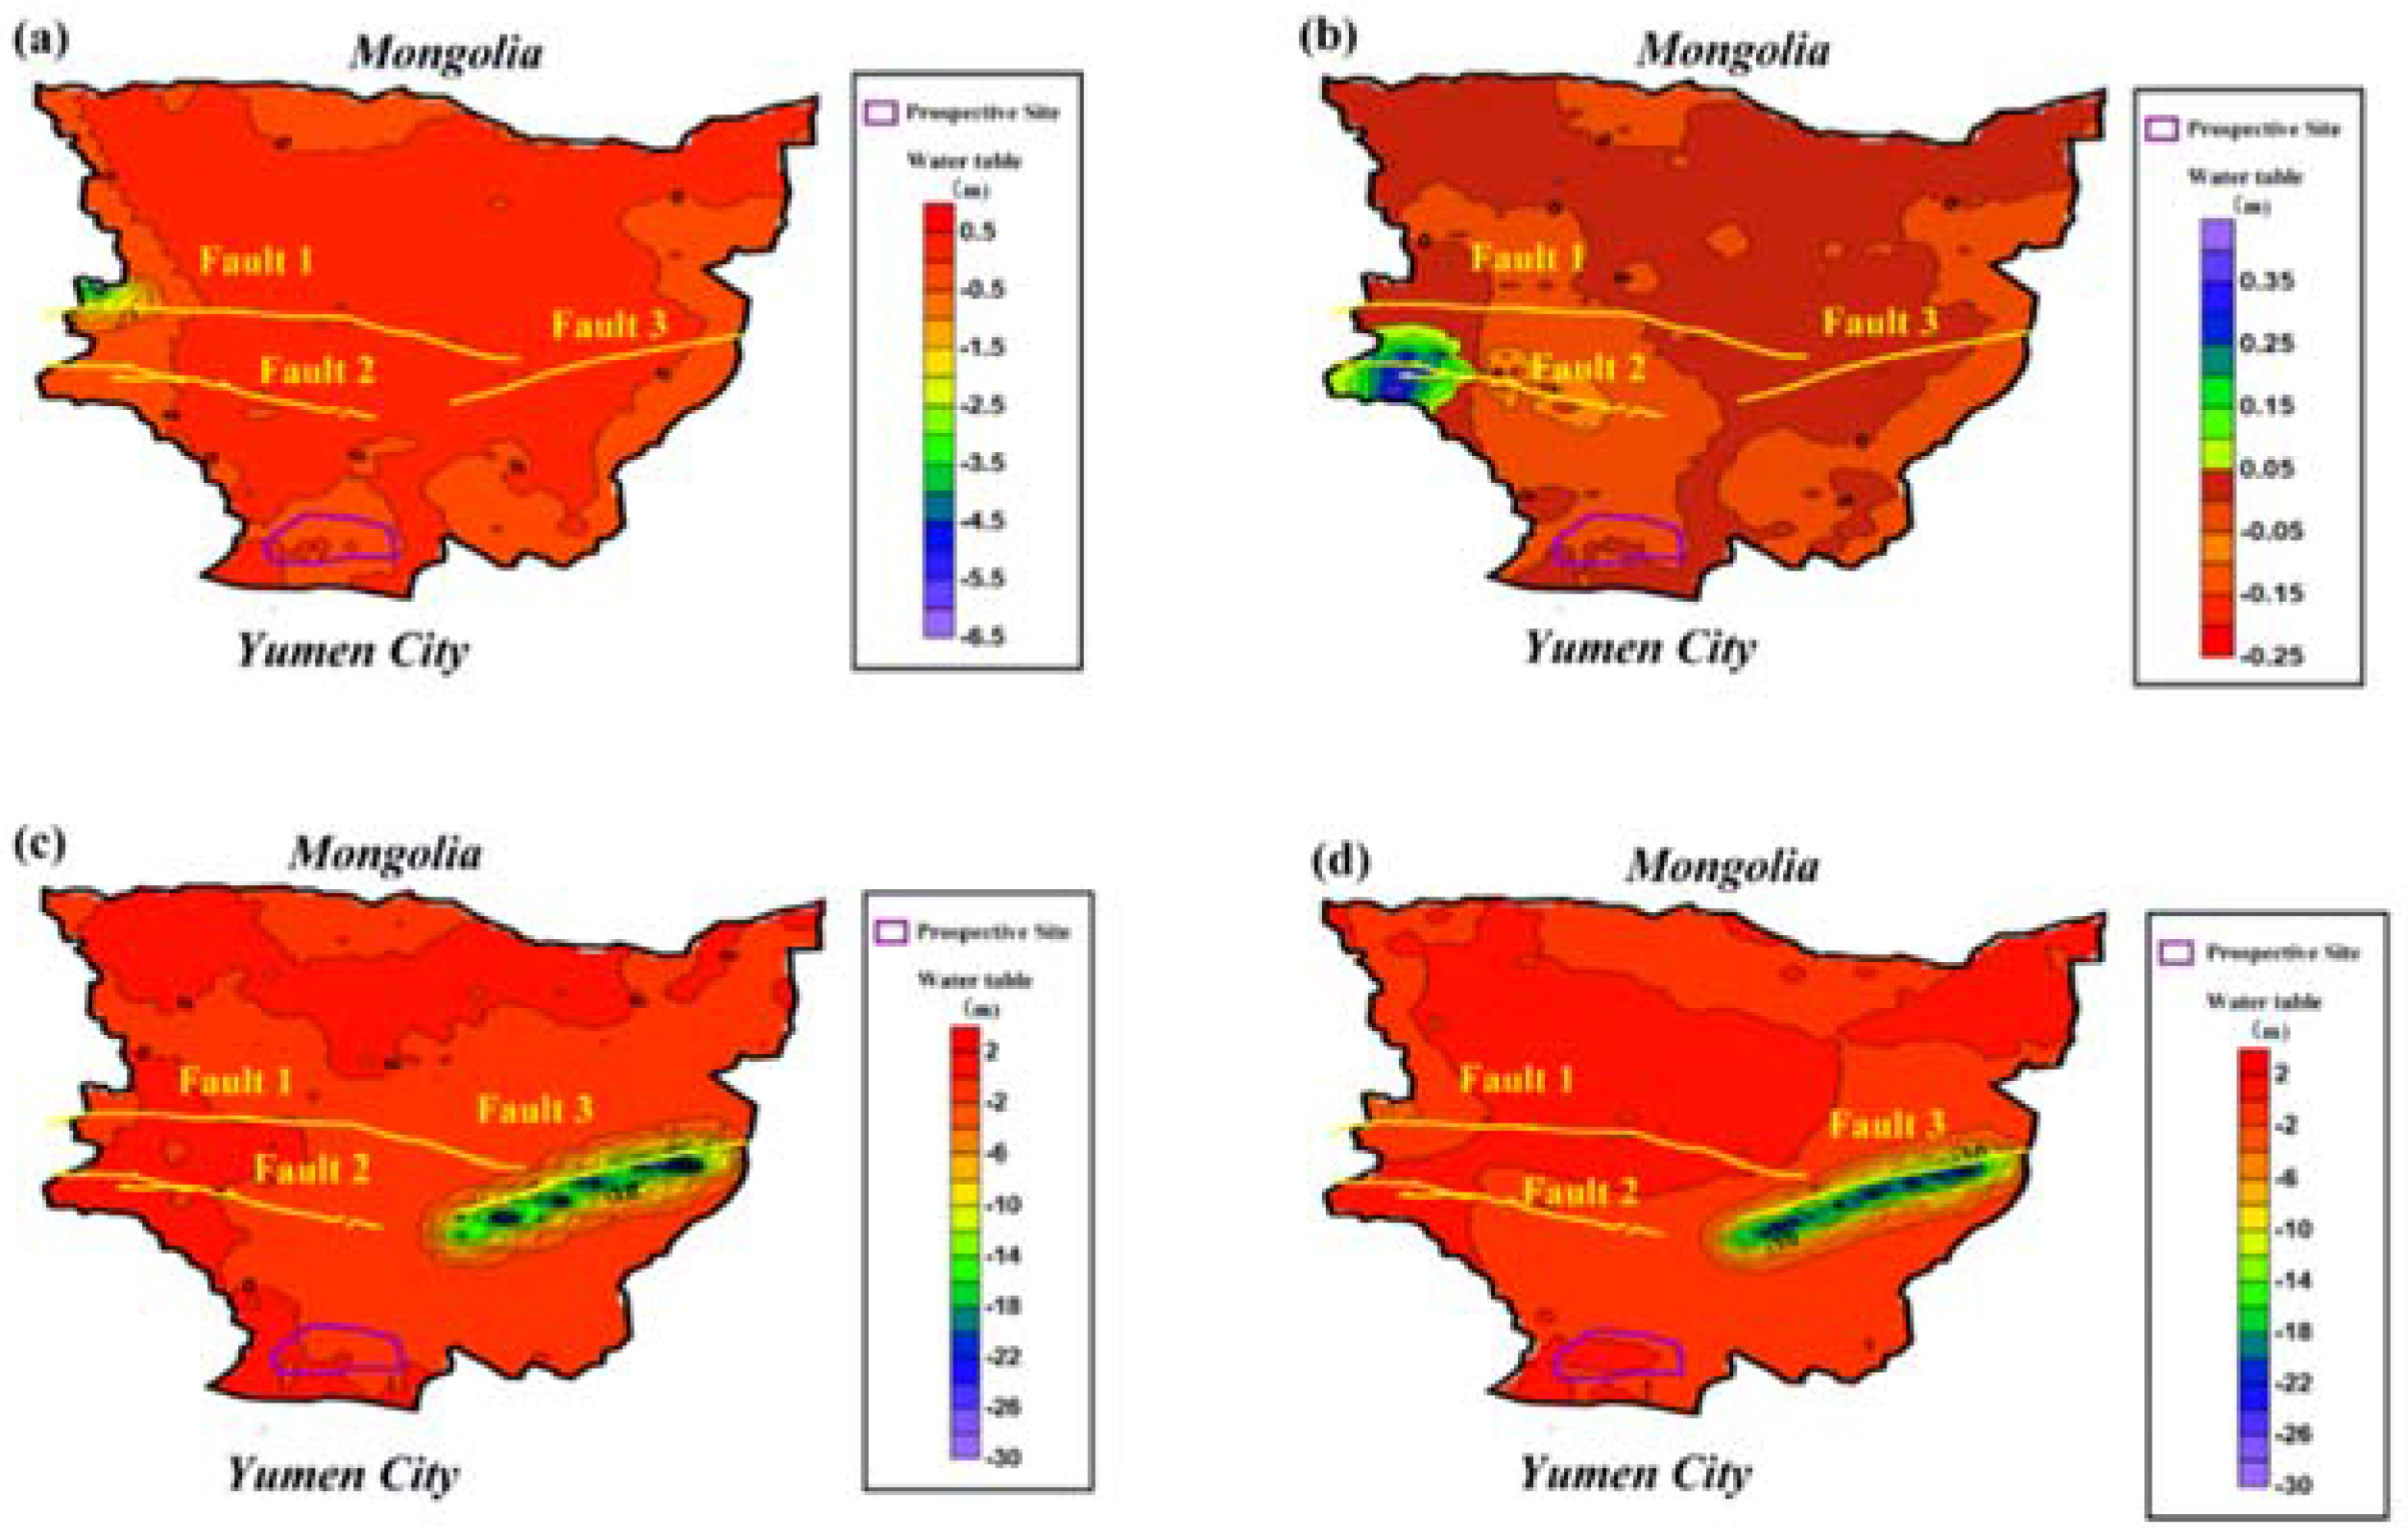
Because the properties of three faults are not fully understood, the method of scenario analysis is used to ascertain the influences of regional faults on the groundwater flow patterns. Four scenarios (shown in Table 4) are set by changing the permeability of different faults (S2–S5), and S1 is set as the base scenario. All models are run for 10,000 years. The changes of liquid saturation with time at the BS05 and BS14 wells under the four scenarios are nearly the same. To determine the influence on the regional groundwater level, the predicted contour maps of the water table difference in these four scenarios relative to the base scenario are shown in Figure 13. The result reveals that Fault 3 plays a significant role in the groundwater flow pattern, with the maximum variation of 30 m, and S5 considering all three faults together is also similar with S4. However, the permeability values of Fault 1 and Fault 2 have a small influence on the water table, with the greatest variation of 6.5 m. According to the flow directions of groundwater system (Figure 10), faults 1 and 2 occupy the topographically high area between regions I and II such that groundwater drains away from them. Only fault 3 lies transverse to regional flow paths, and so the influence of fault 3 on the regional groundwater flow is significantly. Overall, the influences of the permeability of the three faults are mostly located at the region near the faults, and they will not change the pattern of regional groundwater flow.
6. Conclusions
The proper disposal of high-level radioactive wastes is highly challenging. Numerical simulation is a wise method to evaluate the safety of a high-level radioactive waste repository [38]. The numerical method is also an effective approach to ascertain the groundwater flow patterns and the influences of climate change on the groundwater flow. In this study, the regional groundwater flow model in the Beishan area, a prospective disposal site for HLRW, was constructed based on the TOUGH2-MP/EOS3 module, which could describe fluid flow in multiphase, multi-component systems. The arid study area covers approximately 68,900 km2. This model was divided into 23 layers in the vertical direction to allow the unsaturated and saturated zones to be simulated accurately. The parameters of the model were identified by a series of investigations and statistical analysis. Initial pressure field was obtained by running the established model over 10,000 years after comparing a large period, and the differences of the pressure field between two periods were very small, so the initial pressure had been considered as a steady state.
The calibration targets included the hydraulic head from observation wells, and the GRACE-derived groundwater storage changes. The good match between the simulated and observed results proved the reliability of this model. In addition, the model revealed that the regional groundwater flow pattern is quite similar to the surface flow from the channel network given by the DEM model, suggesting that groundwater is mainly dependent on the topography. The study demonstrated that only 0.01%–0.05% of the precipitation infiltrates into the groundwater, which is mainly caused by the wide distribution of low permeability media. Model predictions showed that extreme climate and the permeability of three groups of faults will not have a noticeable effect on the regional groundwater flow in the Beishan area within a period of 10,000 years.
In this paper, field investigation data were integrated to establish the numerical model to fully analyze and evaluate the regional groundwater flow pattern under extreme climate and uncertain fault properties, although the information on hydrogeological conditions is limited. This study is focused on analyzing the regional groundwater flow patterns, refining the groundwater flow systems and testing the influences of hypothesis that both climate change and the fault zone hydraulic properties. Results show three local groundwater systems are subdivided from the regional groundwater flow. To finalize the site selection, a series of chemical and physical experiments, and much data of observation well are highly required. It is suggested that experiments and refined field investigations could be carried out in the region of local flow system, such as the unit III. The study also found that local groundwater flow is sensitive to faults developed in the study area. A detailed investigation on fracture distribution, and development of a refined model, such as dual porosity or dual permeability model in the local area, are required to be carried out.
Acknowledgments
This study was supported by the Research and Development Project on Geological Disposal of High Level Radioactive Waste by the State Administration of Science, Technology and Industry for National Defense (Grant Number: 2012-240) and the National Natural Science Foundation of China (Grant number: 41572220). We thank the Beijing Research Institute of Uranium Geology for supporting the field test data. We would also like to thank the China Scholarship Council for their financial support and constructive comments and suggestions from two anonymous reviewers.
Author Contributions
Xiaoyuan Cao, Litang Hu, Jinsheng Wang and Jingrui Wang. Litang Hu conceived the study; Xiaoyuan Cao and Jingrui Wang analyzed the data. Xiaoyuan Cao conducted the research work under the supervision of Litang Hu and Jinsheng Wang. Xiaoyuan Cao and Litang Hu analyzed and discussed the results. All co-authors contributed to the discussion of the results. Xiaoyuan Cao wrote the first draft of the paper. Litang Hu and Xiaoyuan Cao corrected the first draft of the paper. All co-authors revised and commented the final draft of the paper.
Conflicts of Interest
The authors declare no conflict of interest.
References
- Rosner, R.; Goldberg, S.M. A practical, regional approach to nuclear waste storage. Bull. At. Sci. 2013, 69, 58–66. [Google Scholar] [CrossRef]
- D’Agnese, F.A.; Faunt, C.C.; Turner, A.K.; Hill, M.C. Hydrogeologic Evaluation and Numerical Simulation of the Death Valley Regional Ground—Water Flow System; 4300; U.S Geological Survey Water—Resources Investigations Report: Nevada, CA, USA, 1997; p. 96.
- Belcher, W.R.; Sweetkind, D.S. Death Valley Regional Groundwater Flow System, Nevada and California—Hydrogeologic Framework and Transient Groundwater Flow Model; No.1711; U.S. Geological Survey: Nevada, CA, USA, 2010.
- Thoma, S.G.; Gallegos, D.P.; Smith, D.M. Impact of fracture coatings on fracture/matrix flow interactions in unsaturated, porous media. Water Resour. Res. 1992, 28, 1357–1367. [Google Scholar] [CrossRef]
- Liu, H.H.; Bodvarsson, G.S.; Doughty, C. An Active Fracture Model for Unsaturated Flow and Transport; No. MOL. 20000125.0485; Yucca Mountain Project: Las Vegas, NV, USA, 1999. [Google Scholar] [CrossRef]
- Wu, Y.S.; Haukwa, C.; Bodvarsson, G.S. A site-scale model for fluid and heat flow in the unsaturated zone of Yucca Mountain, Nevada. J. Contam. Hydrol. 1999, 38, 185–215. [Google Scholar] [CrossRef]
- Bodvarsson, G.S.; Wu, Y.S.; Zhang, K. Development of discrete flow paths in unsaturated fractures at Yucca Mountain. J. Contam. Hydrol. 2003, 62, 23–42. [Google Scholar] [CrossRef]
- Zhang, K.; Wu, Y.S.; Bodvarsson, G.S. Parallel computing simulation of fluid flow in the unsaturated zone of Yucca Mountain, Nevada. J. Contam. Hydrol. 2003, 62, 381–399. [Google Scholar] [CrossRef]
- Tim, M. The Site Selection Process for a Spent Fuel Repository in Finland-Summary Report; Posiva Oy: Helsinki, Finland, 2000. [Google Scholar]
- Werner, K.; Bosson, E.; Berglund, S. Analysis of water flow paths: Methodology and example calculations for a potential geological repository in Sweden. AMBIO J. Hum. Environ. 2006, 35, 425–434. [Google Scholar] [CrossRef]
- Wang, J.; Chen, W.; Su, R.; Guo, Y.; Jin, Y. Geological disposal of high-level radioactive waste and its key scientific issues. J. Rock Mech. Eng. 2006, 25, 801–812. (In Chinese) [Google Scholar]
- Dong, Y.H.; Li, G.M.; Li, M. Numerical modeling of the regional ground water flow in Beishan area, Gansu Province. Chin. Sci. Bull. 2009, 54, 3112–3115. [Google Scholar] [CrossRef]
- Xiao, F.; Guo, Y.H.; Wang, Z.M. Outlook of Isotopic Hydrologic Study in Beishan Preselected Area of High Level Waste Repository. Uranium Geol. 2012, 2, 83–114. [Google Scholar]
- Li, J.B.; Su, R.; Zhou, Z.C.; Guo, Y.; Ji, R.; Zhang, M. Soil permeability of aeration zone in Xinchang-Xiangyangshan—A preselected site for high level radioactive waste disposal. Acta Pedol. Sinica. 2015, 52, 1412–1421. [Google Scholar] [CrossRef]
- Beijing Research Institute of Uranium Geology. Research on the Fault Activity in the Beishan Area, Gansu, China; Science Report; Beijing Research Institute of Uranium Geology: Beijing, China, 2011. (In Chinese) [Google Scholar]
- Beijing Research Institute of Uranium Geology. Researches on Regional Hydrogeological Characterization in the Beishan Area, Gansu, China; Science Report; Beijing Research Institute of Uranium Geology: Beijing, China, 2010. (In Chinese) [Google Scholar]
- Pruess, K.; Oldenburg, C.M.; Moridis, G.J. TOUGH2 User’s Guide; Version 2; Lawrence Berkeley National Laboratory: Berkeley, CA, USA, 1999.
- Zhang, K.; Wu, Y.S.; Pruess, K. User’s Guide for TOUGH2-MP-a Massively Parallel Vrsion of the TOUGH2 Code; Report LBNL-315; Lawrence Berkeley National Laboratory: Berkeley, CA, USA, 2008.
- Pruess, K. A mechanistic model for water seepage through thick unsaturated zones in fractured rocks of low matrix permeability. Water Resour. Res. 1999, 35, 1039–1051. [Google Scholar] [CrossRef]
- Hu, L.T.; Winterfeld, P.H.; Fakcharoenphol, P.; Wu, Y.S. A novel fully-coupled flow and geomechanics model in enhanced geothermal reservoirs. J. Petrol. Sci. Eng. 2013, 107, 1–11. [Google Scholar] [CrossRef]
- Wang, X.S.; Jiang, X.W.; Wan, L.; Ge, S.; Li, H. A new analytical solution of topography—Driven flow in a drainage basin with depth-dependent anisotropy of permeability. Water Resour. Res. 2011, 47. [Google Scholar] [CrossRef]
- Reuter, H.I.; Nelson, A.; Jarvis, A. An evaluation of void filling interpolation methods for SRTM data. International. Int. J. Geogr. Inf. Sci. 2007, 21, 983–1008. [Google Scholar] [CrossRef]
- Hu, L.T.; Zhang, K.N.; Cao, X.Y.; Li, Y.; Guo, C. IGMESH: A convenient irregular-grid-based pre-and post-processing tool for TOUGH2 simulator. Comput. Geosci. 2016, 95, 11–17. [Google Scholar] [CrossRef]
- Van Genuchten, M.T. A closed-form equation for predicting the hydraulic conductivity of unsaturated soils. Soil Sci. Soc. Am. J. 1980, 44, 892–898. [Google Scholar] [CrossRef]
- Skomorowski, P.; Rubel, F.; Rudolf, B. Verification of GPCP-1DD global satellite precipitation products using MAP surface observations. Phys. Chem. Earth 2001, 26, 403–409. [Google Scholar] [CrossRef]
- Huffman, G.J.; Adler, R.F.; Bolvin, D.T.; Gu, G. Improving the global precipitation record: GPCP version 2.1. Geophys. Res. Lett. 2009, 36. [Google Scholar] [CrossRef]
- Wang, K.; Niu, J.; Chen, J. Features of global hydrological processes using the Variable Infiltration Capacity Model simulation: Focusing on five major river basins. AGU Fall Meeting Abstracts. 2013. Available online: http://adsabs.harvard.edu/abs/2013AGUFM.H33B1347W (accessed on 20 July 2017).
- Gee, G.W.; Zhang, Z.F.; Tyler, S.W.; Albright, W.H.; Singleton, M.J. Chloride mass balance. Vadose Zone J. 2005, 4, 72–78. [Google Scholar] [CrossRef]
- Schmidt, R.; Schwintzer, P.; Flechtner, F.; Reigber, C.; Güntner, A.; Döll, P.; Ramillien, G.; Cazenave, A.; Petrovic, S.; Jochmann, H.; Wünsch, J. GRACE observations of changes in continental water storage. Glob. Planet. Chang. 2006, 50, 112–126. [Google Scholar] [CrossRef]
- Gonzalez, R.; Ouarda, T.B.; Marpu, P.R.; Allam, M.M.; Eltahir, E.A.; Pearson, S. Water Budget Analysis in Arid Regions, Application to the United Arab Emirates. Water 2016, 8, 415. [Google Scholar] [CrossRef]
- Chen, J.L.; Rodell, M.; Wilson, C.R.; Famiglietti, J.S. Low degree spherical harmonic influences on Gravity Recovery and Climate Experiment (GRACE) water storage estimates. Geophys. Res. Lett. 2005, 32. [Google Scholar] [CrossRef]
- Swenson, S.; Yeh, P.J.F.; Wahr, J.; Famiglietti, J. A comparison of terrestrial water storage variations from GRACE with in situ measurements from Illinois. Geophys. Res. Lett. 2006, 33. [Google Scholar] [CrossRef]
- Syed, T.; Famiglietti, J.; Rodell, M.; Chen, J.; Wilson, C.R. Analysis of terrestrial water storage changes from GRACE and GLDAS. Water Resour. Res. 2008, 44, 57–79. [Google Scholar] [CrossRef]
- Tiwari, V.M.; Wahr, J.; Swenson, S. Dwindling groundwater resources in northern India, from satellite gravity observations. Geophys. Res. Lett. 2009, 36. [Google Scholar] [CrossRef]
- Rodell, M.; Chen, J.L.; Kato, H.; Famiglietti, J.S.; Nigro, J.; Wilson, C.R. Estimating groundwater storage changes in the Mississippi River basin (USA) using GRACE. Hydrogeol. J. 2007, 15, 159–166. [Google Scholar] [CrossRef]
- Hu, L.T.; Jiao, J.J. An innovative method to estimate regional-scale hydraulic diffusivity using GRACE data. Hydrol. Sci. J. 2016. [Google Scholar] [CrossRef]
- Van Roosmalen, L.; Christensen, B.S.; Sonnenborg, T.O. Regional differences in climate change impacts on groundwater and stream discharge in Denmark. Vadose Zone J. 2007, 6, 554–571. [Google Scholar] [CrossRef]
- Qiu, S.; Liang, X.; Xiao, C.; Huang, H.; Fang, Z.; Lv, F. Numerical simulation of groundwater flow in a river valley basin in Jilin Urban area, China. Water 2015, 7, 5768–5787. [Google Scholar] [CrossRef]
Figure 1.
Sketch map of the study area: (a) map of China; (b) map of the study area; and (c) location of boreholes in the prospective site of the disposal repository.
Figure 1.
Sketch map of the study area: (a) map of China; (b) map of the study area; and (c) location of boreholes in the prospective site of the disposal repository.

Figure 2.
Schematic map of the channel network and model boundary.
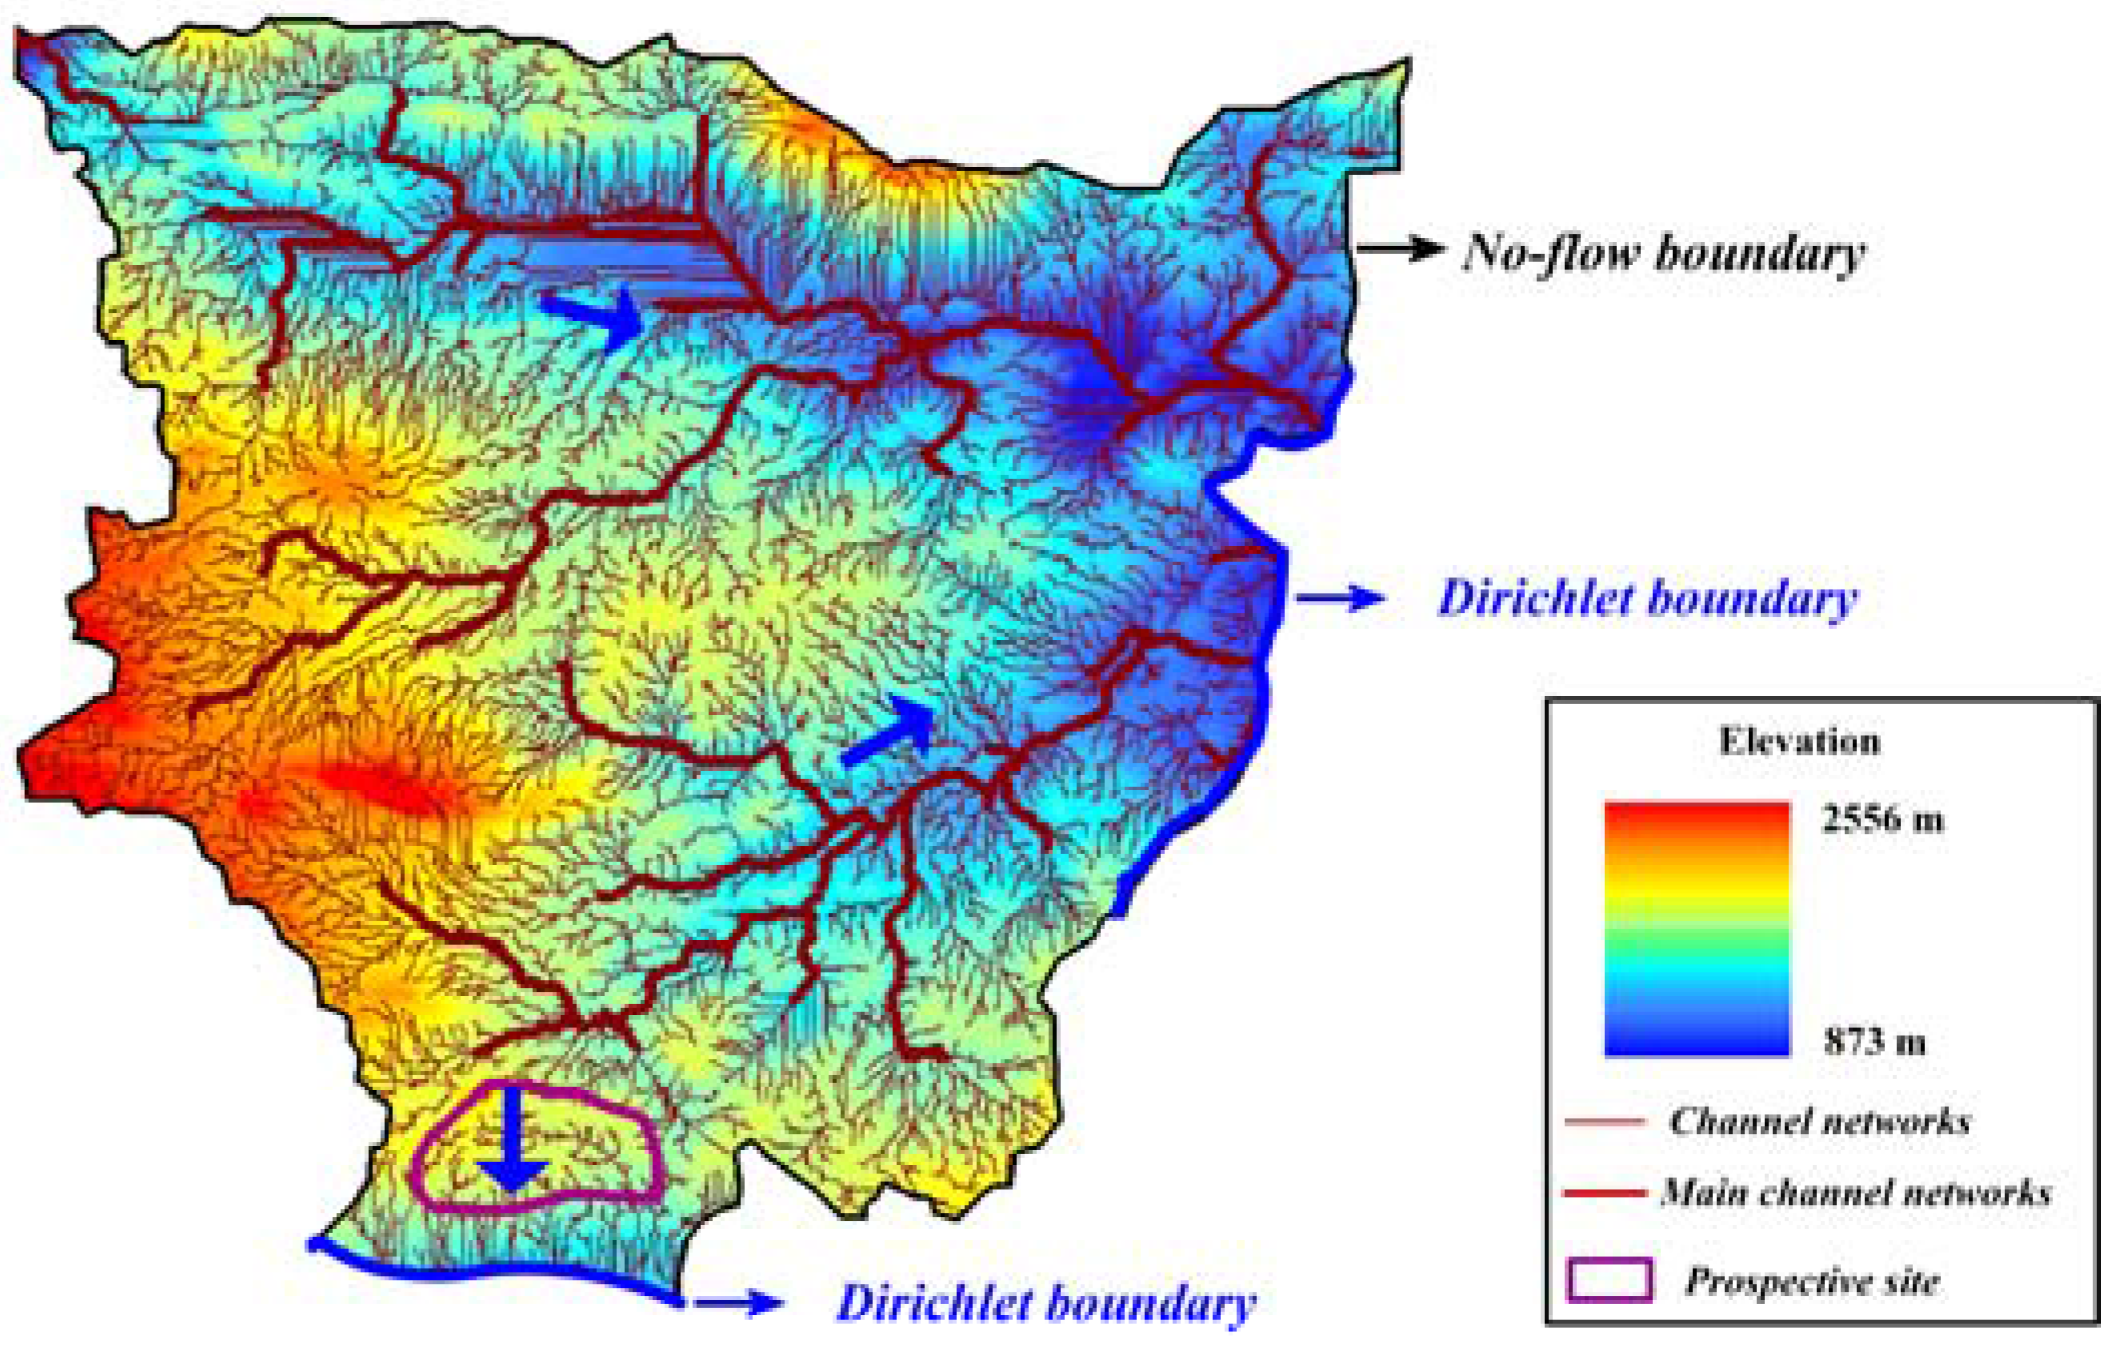
Figure 3.
Lithologic description of the study area: (a) lithological column; and (b) the lithology profile in the areas with of the Quaternary deposits.
Figure 3.
Lithologic description of the study area: (a) lithological column; and (b) the lithology profile in the areas with of the Quaternary deposits.
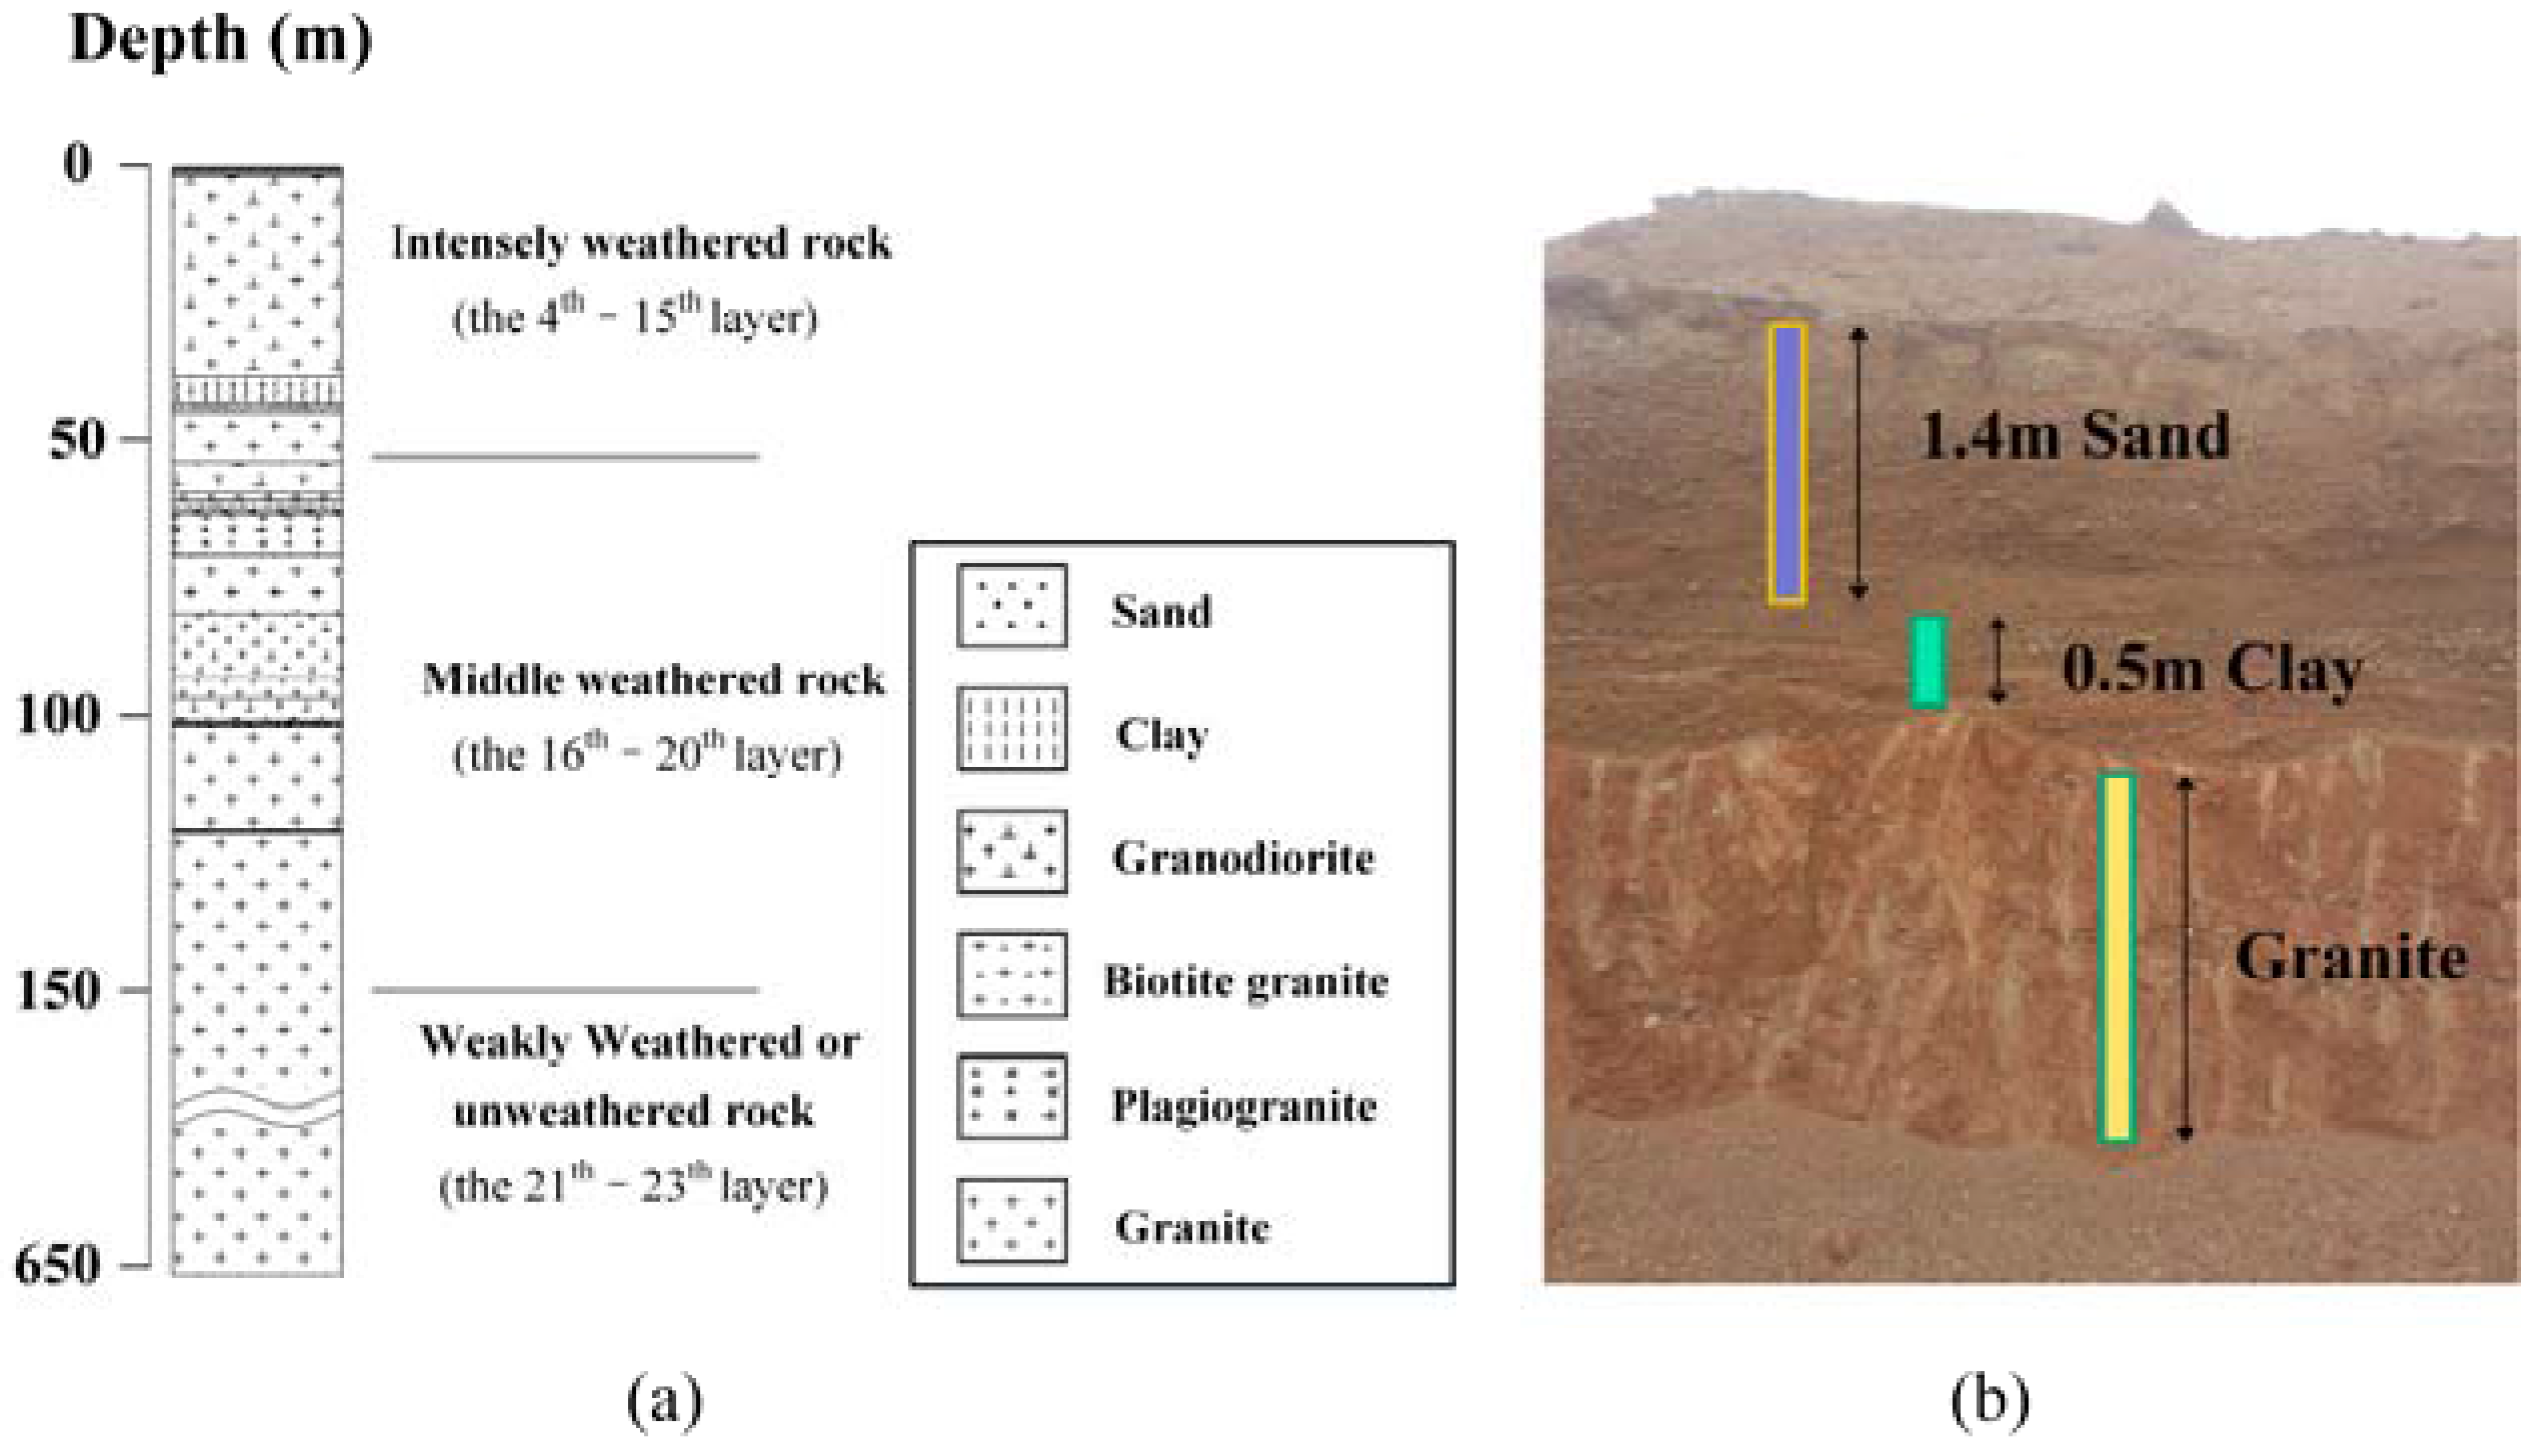
Figure 4.
Mesh of the study area (scale ratio of x:y:z = 1:1:65): (a) three-dimensional mesh; (b) mesh of Horizontal plan; and (c) elevation of profile A-A’.
Figure 4.
Mesh of the study area (scale ratio of x:y:z = 1:1:65): (a) three-dimensional mesh; (b) mesh of Horizontal plan; and (c) elevation of profile A-A’.
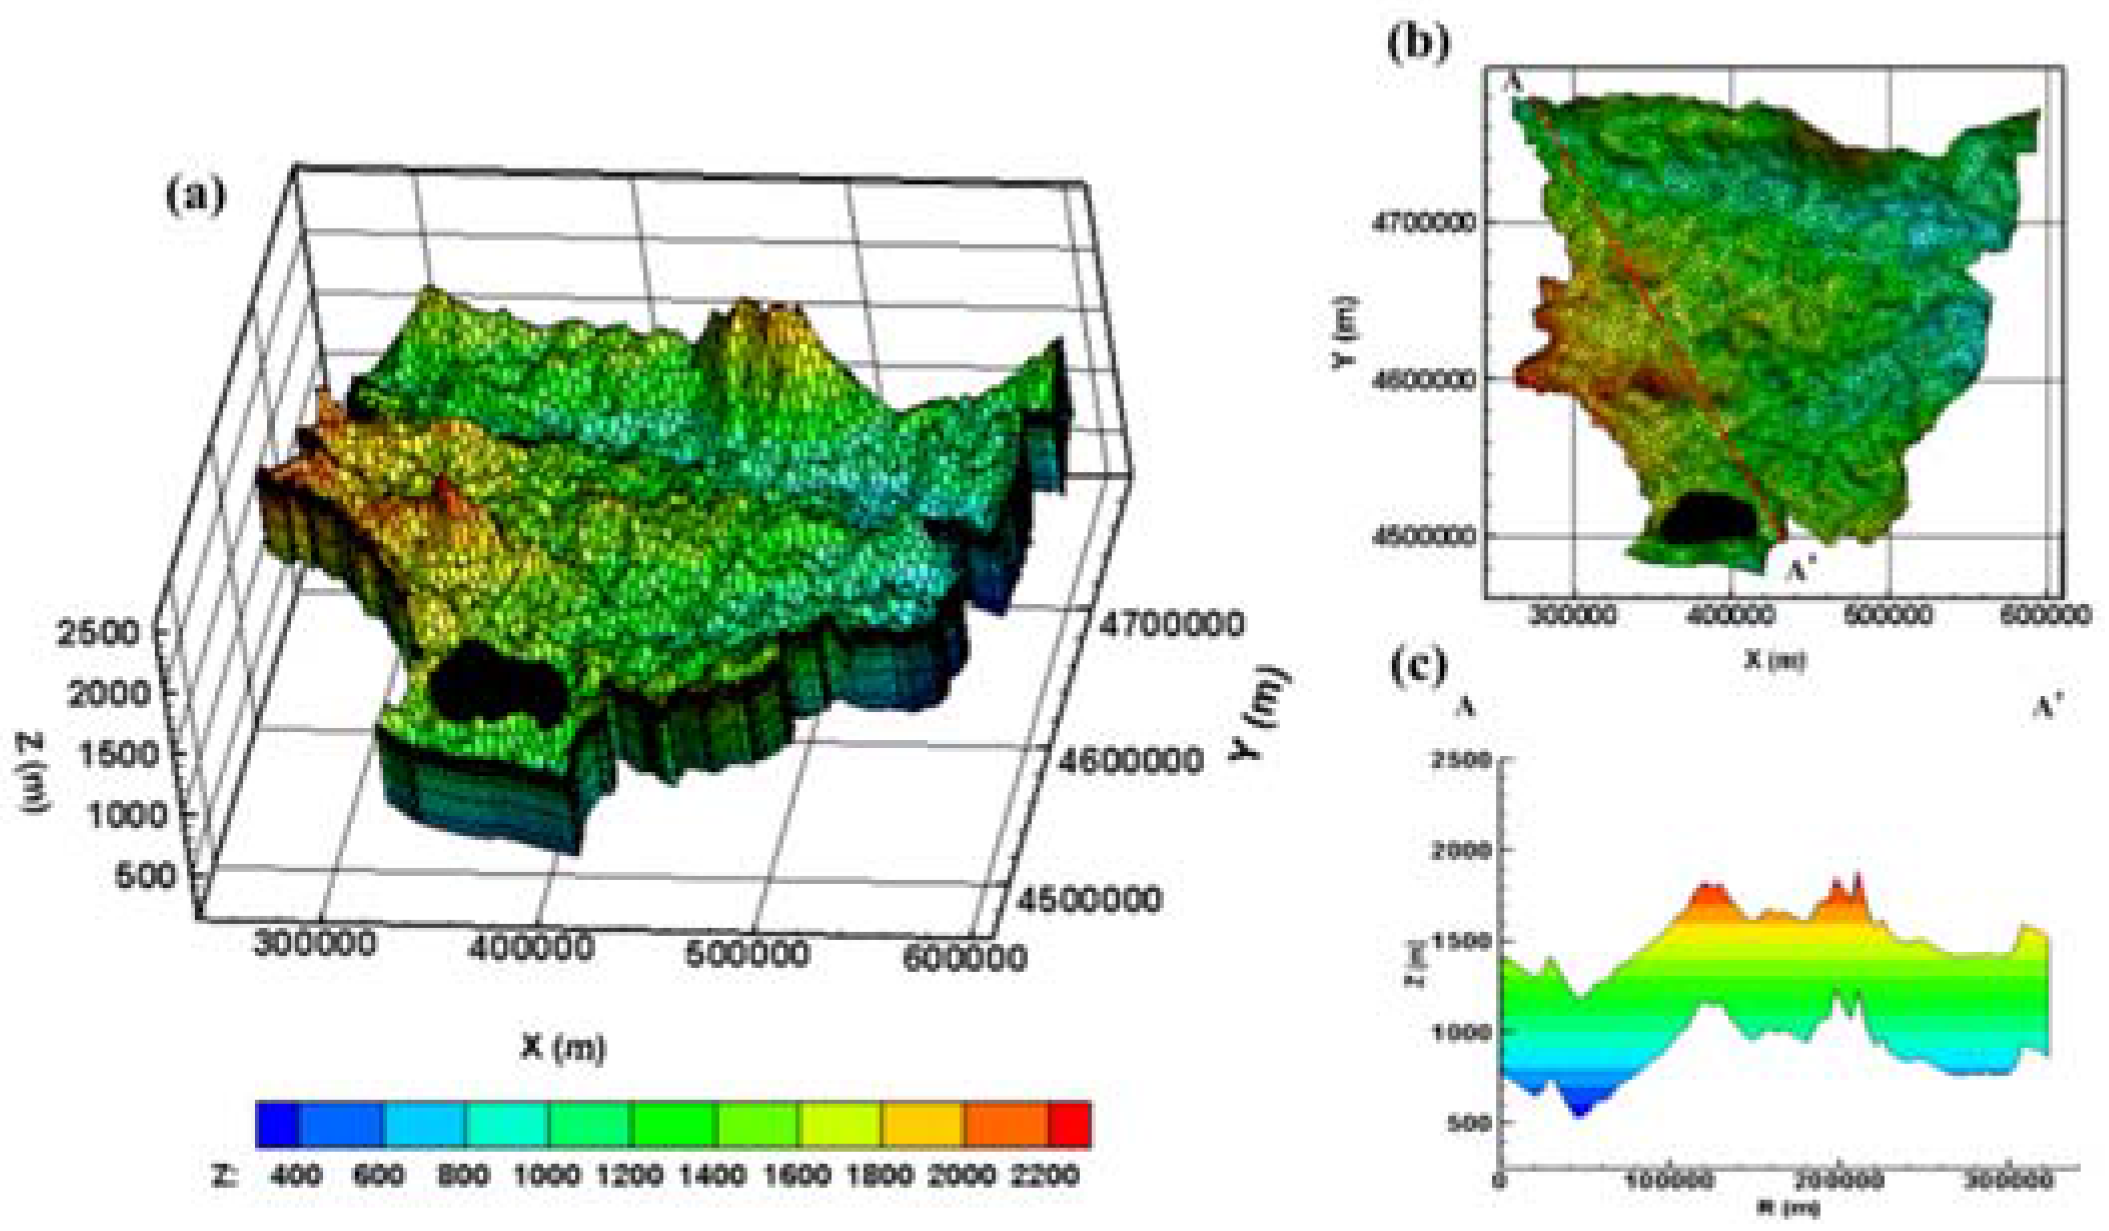
Figure 5.
Change of permeability with depth to ground obtained from field tests.

Figure 6.
Lithology zoning map of the shallow layer: (a) zoning map of Layer 2; and (b) zoning map of Layer 3. The numbers are consistent with the Table 2.
Figure 6.
Lithology zoning map of the shallow layer: (a) zoning map of Layer 2; and (b) zoning map of Layer 3. The numbers are consistent with the Table 2.

Figure 7.
Monthly rainfall from 2003 to 2014 in the Beishan area.
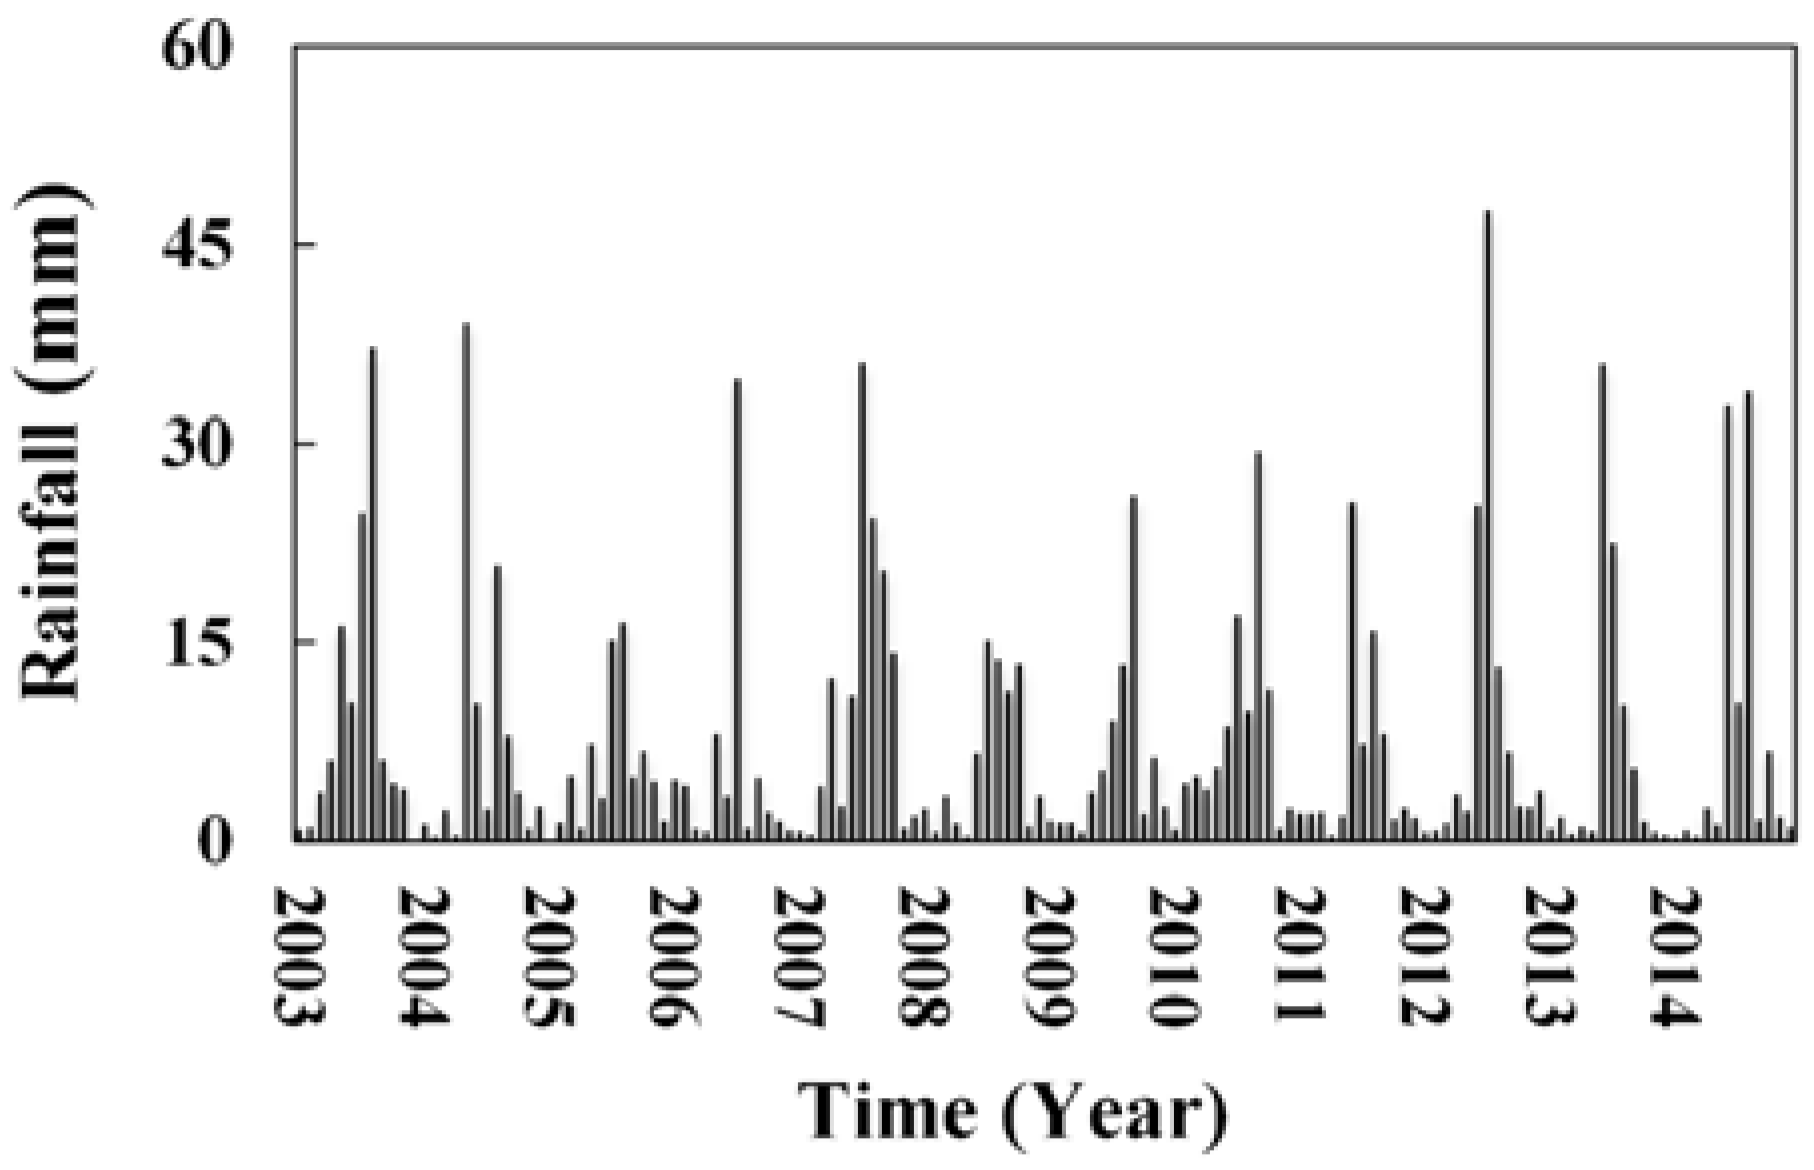
Figure 8.
Fit between the observed data and the simulated data.
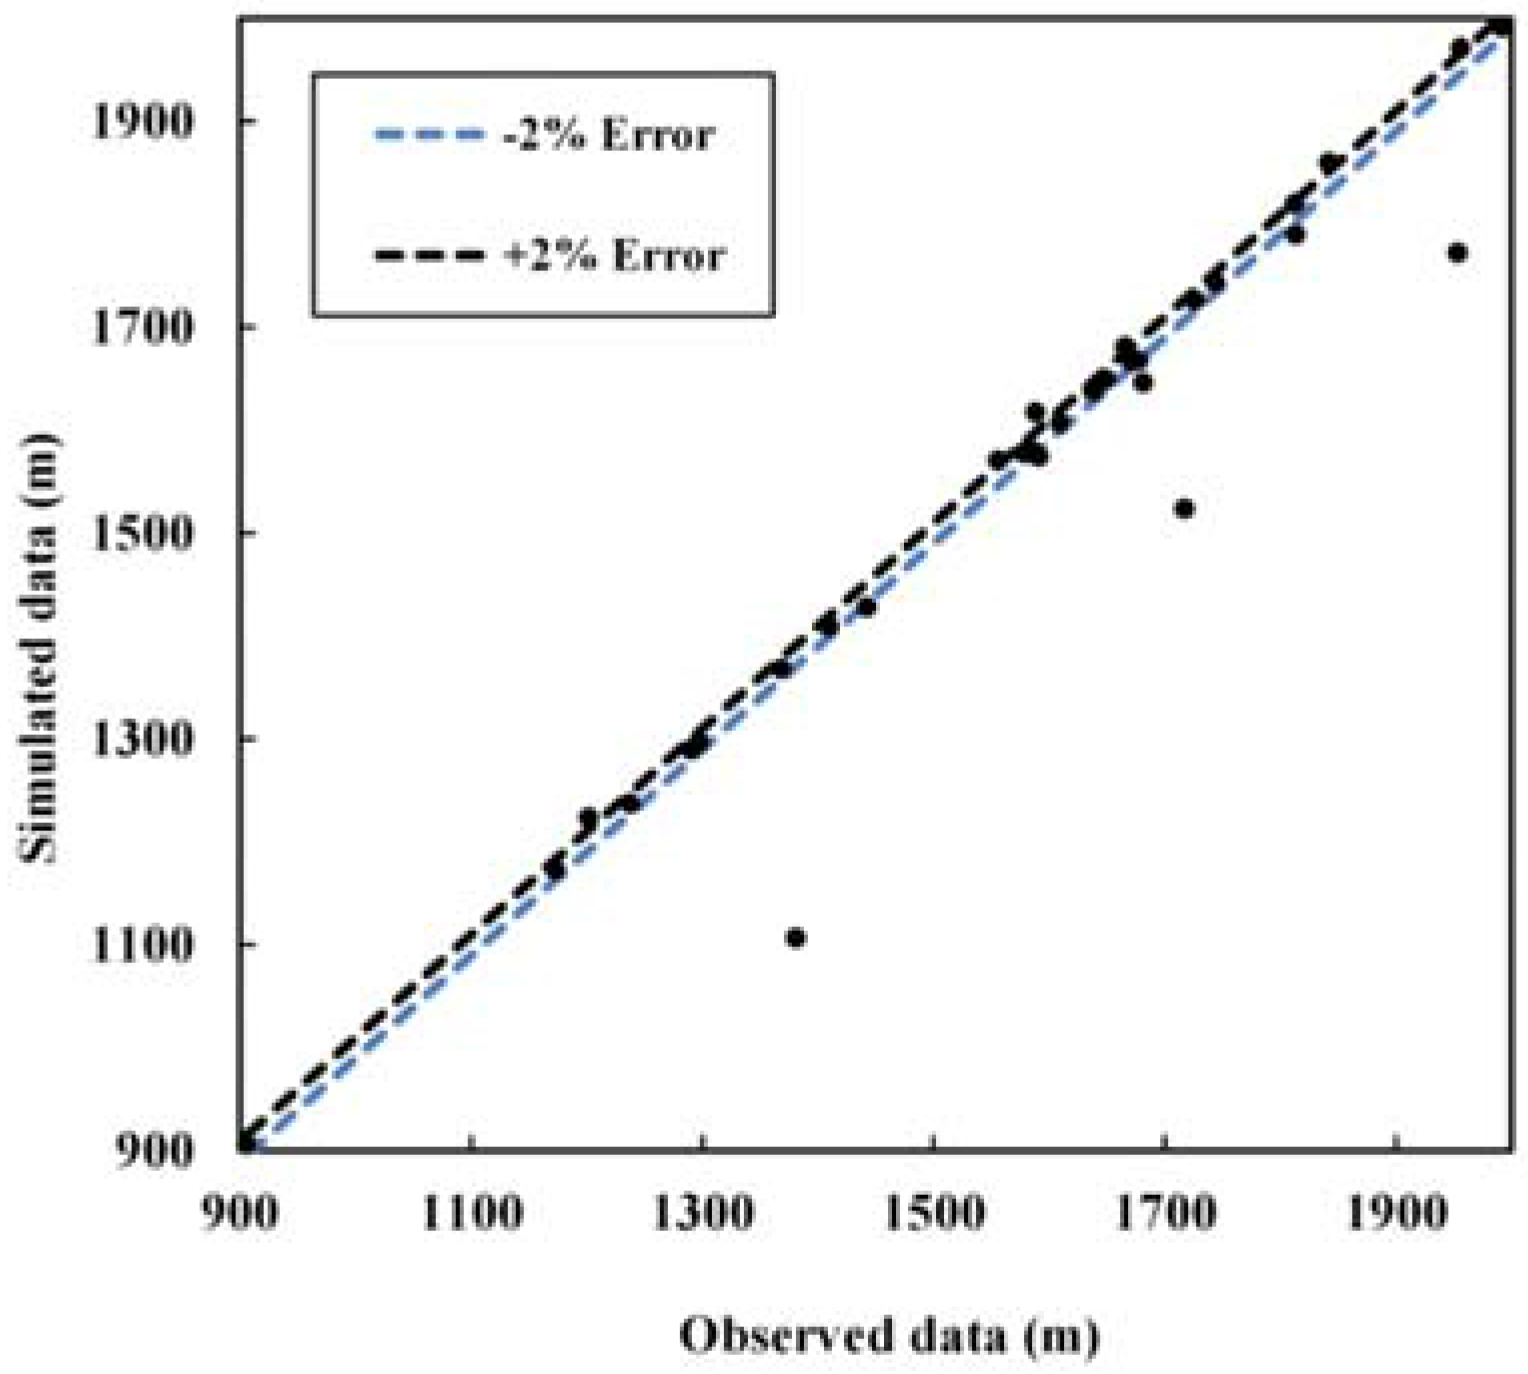
Figure 9.
Changes of the liquid saturation with depth for four boreholes at the end of 2014.

Figure 10.
Groundwater flow levels in the Beishan area at the end of 2014.

Figure 11.
Comparison between the simulated and GRACE-derived TWS variations.

Figure 12.
Change of liquid saturation under different precipitation conditions with time: (a) for the BS05 well; and (b) for the BS14 well.
Figure 12.
Change of liquid saturation under different precipitation conditions with time: (a) for the BS05 well; and (b) for the BS14 well.

Figure 13.
Contour map of the water table difference in the scenarios relative to the base case: (a) water table difference between S2 and S1; (b) water table difference between S3 and S1; (c) water table difference between S4 and S1; and (d) water table difference between S5 and S1.
Figure 13.
Contour map of the water table difference in the scenarios relative to the base case: (a) water table difference between S2 and S1; (b) water table difference between S3 and S1; (c) water table difference between S4 and S1; and (d) water table difference between S5 and S1.

Table 1.
Governing equations for TOUGH2/EOS3.
| Description | Equation |
|---|---|
| Conservation of mass and energy | |
| Mass accumulation | |
| Mass flux | |
| Energy flux | |
| Energy accumulation | |
where are the accumulation terms of the components and energy, kg m−3 for components and J m−3 for energy; is the index for the components, =1 (water), 2 (air), and 3 (temperature); is the volume of the nth grid cell, m3; is the flux, g m−2 s−1; is the normal vector on the surface element, dimensionless; is the area of closed surface, m2; is the source/sink terms for mass or energy components, kg m−3s−1 or J m−3s−1; is the porosity, dimensionless; is the saturation of phase , dimensionless; is the density of phase , kg m−3; = G for gas and = L for liquid; is the mass fraction of component in fluid phase , dimensionless; is the Darcy velocity in phase , m s−1; is the thermal conductivity, W K−1 m−1; is the viscosity, Pa s; is the specific enthalpy in phase , J kg−1; is the heat conductivity, W K−-1 m−1; is temperature, °C or ; is the relative permeability to phase ; is the gravitational acceleration constant, m s−2; and k is the absolute permeability, m2.
Table 2.
List of the hydrogeology zones for the 23 model layers.
| Serial Number of Layer | Description | Zone | Permeability (m2) | Porosity(−) | |
|---|---|---|---|---|---|
| kx = ky | kz | ||||
| 1 | Atmosphere layer | 1 | 1.0 × 10⁻¹² | 1.0 × 10⁻¹² | 0.99 |
| 2 | Quaternary deposits and weakly permeable strata (10 represents faults) | 2 | 1.0 × 10⁻¹³ | 5.0 × 10⁻¹⁴ | 0.25 |
| 3 | 1.0 × 10⁻¹³ | 5.0 × 10⁻¹⁴ | 0.05 | ||
| 4 | 1.0 × 10⁻¹¹ | 5.0 × 10⁻¹² | 0.2 | ||
| 10 | 1.0 × 10⁻¹³ | 5.0 × 10⁻¹⁴ | 0.9 | ||
| 3 | Weakly permeable strata (10 represents faults) | 2 | 1.0 × 10⁻¹³ | 5.0 × 10⁻¹⁴ | 0.25 |
| 3 | 1.0 × 10⁻¹³ | 5.0 × 10⁻¹⁴ | 0.05 | ||
| 10 | 1.0 × 10⁻¹³ | 5.0 × 10⁻¹⁴ | 0.9 | ||
| 4–15 | Intensely weathered rock (10 represents faults) | 5 | 2.0 × 10⁻¹⁵ | 2.0 × 10⁻¹⁶ | 0.05 |
| 10 | 1.0 × 10⁻¹³ | 5.0 × 10⁻¹⁴ | 0.9 | ||
| 16–20 | Middle-weathered rock | 6 | 1.0 × 10⁻¹⁶ | 1.0 × 10⁻¹⁷ | 0.02 |
| 21 | Weakly weathered rock or Unweathered rock | 7 | 1.0 × 10⁻¹⁷ | 1.0 × 10⁻¹⁸ | 0.01 |
| 22 | 8 | 1.0 × 10⁻¹⁸ | 1.0 × 10⁻¹⁹ | 0.01 | |
| 23 | 9 | 1.0 × 10⁻¹⁸ | 1.0 × 10⁻¹⁹ | 0.01 | |
Table 3.
The variation of groundwater budgets in five scenarios (m3/year).
| Precipitation (mm) | 40 | 90 | 200 | 300 | 450 | |
|---|---|---|---|---|---|---|
| Recharge | 2.76 × 10⁹ | 6.55 × 10⁹ | 1.38 × 10¹⁰ | 2.07 × 10¹⁰ | 3.10 × 10¹⁰ | |
| Discharge | Evaporation and surface runoff | 2.76 × 10⁹ | 6.55 × 10⁹ | 1.38 × 10¹⁰ | 2.07 × 10¹⁰ | 3.10 × 10¹⁰ |
| O1 1 | 9.70 × 10⁵ | 9.70 × 10⁵ | 9.70 × 10⁵ | 9.70 × 10⁵ | 9.70 × 10⁵ | |
| O2 | 6.12 × 10⁴ | 6.12 × 10⁴ | 6.12 × 10⁴ | 6.12 × 10⁴ | 6.12 × 10⁴ | |
| Total groundwater storage variation | −3.22 × 10⁵ | −3.22 × 10⁵ | −3.21 × 10⁵ | −3.20 ×10⁵ | −3.18 × 10⁵ | |
1 O1 is the eastern Dirichlet boundary, O2 is the south Dirichlet boundary.
Table 4.
Permeability distribution under four scenarios (m2).
| Scenarios | Fault 1 | Fault 2 | Fault 3 |
|---|---|---|---|
| Base scenario (S1) | 1.0 × 10⁻¹³ | 1.0 × 10⁻¹³ | 1.0 × 10⁻¹³ |
| Scenario 2 | 1.0 × 10⁻⁹ | 1.0 × 10⁻¹³ | 1.0 × 10⁻¹³ |
| Scenario 3 | 1.0 × 10⁻¹³ | 1.0 × 10⁻⁹ | 1.0 × 10⁻¹³ |
| Scenario 4 | 1.0 × 10⁻¹³ | 1.0 × 10⁻¹³ | 1.0 × 10⁻⁹ |
| Scenario 5 | 1.0 × 10⁻⁹ | 1.0 × 10⁻⁹ | 1.0 × 10⁻⁹ |
© 2017 by the authors. Licensee MDPI, Basel, Switzerland. This article is an open access article distributed under the terms and conditions of the Creative Commons Attribution (CC BY) license (http://creativecommons.org/licenses/by/4.0/).
Share and Cite
MDPI and ACS Style
Cao, X.; Hu, L.; Wang, J.; Wang, J. Regional Groundwater Flow Assessment in a Prospective High-Level Radioactive Waste Repository of China. Water 2017, 9, 551. https://doi.org/10.3390/w9070551
AMA Style
Cao X, Hu L, Wang J, Wang J. Regional Groundwater Flow Assessment in a Prospective High-Level Radioactive Waste Repository of China. Water. 2017; 9(7):551. https://doi.org/10.3390/w9070551
Chicago/Turabian StyleCao, Xiaoyuan, Litang Hu, Jinsheng Wang, and Jingrui Wang. 2017. "Regional Groundwater Flow Assessment in a Prospective High-Level Radioactive Waste Repository of China" Water 9, no. 7: 551. https://doi.org/10.3390/w9070551
Note that from the first issue of 2016, this journal uses article numbers instead of page numbers. See further details here.