Evaluating the Effects of Low Impact Development Practices on Urban Flooding under Different Rainfall Intensities


Abstract
:1. Introduction
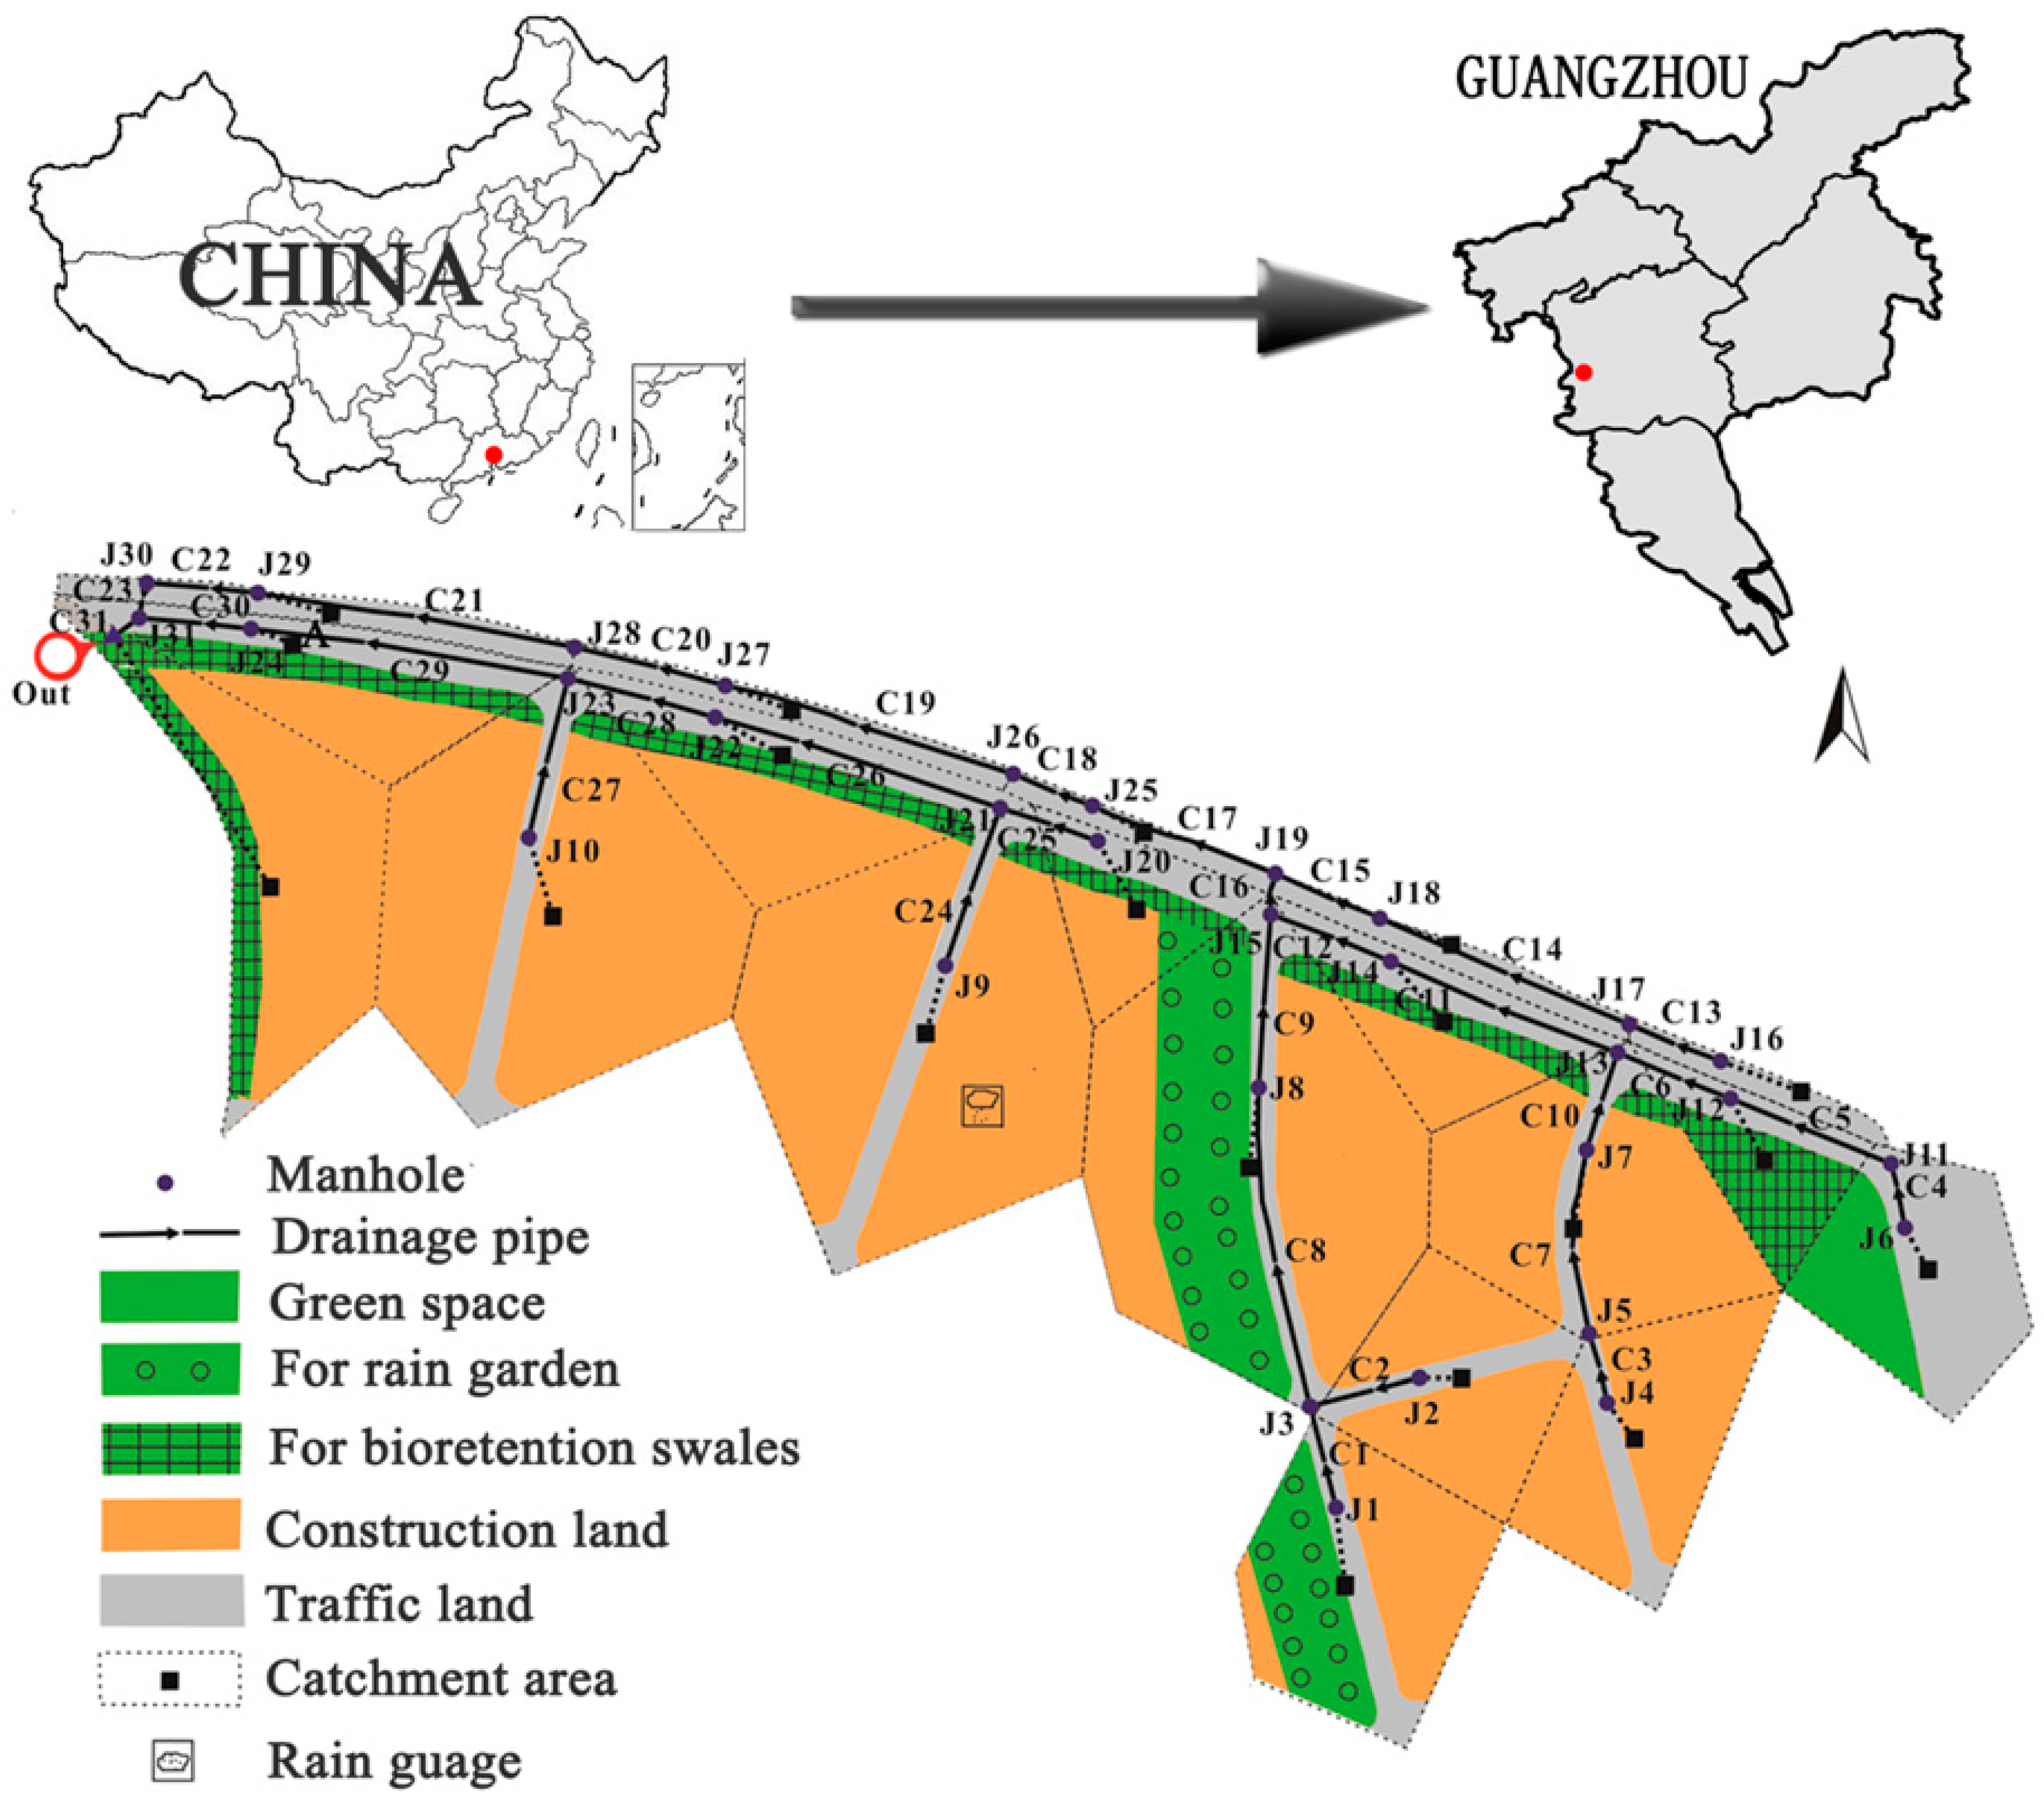
2. Study Area
3. Methodology
3.1. SWMM Model
3.1.1. Surface Runoff Simulation Module
3.1.2. Transmission Calculation Module
3.1.3. Flood Calculation Module
3.1.4. LID Module
3.2. Evaluation of Model Accuracy
3.3. Projection Pursuit Method
- Step (1)
- Put into to calculate the value of
- Step (2)
- Use Equation (4) and (5) for calculating and
- Step (3)
- Use Equation (3) to calculate , that is
- Step (4)
- Analyze the flood characteristics. will be substituted into the formula to obtain the best projection value for each manhole ; the greater the projection value is, the larger the flood.
3.4. Setting of Rainfall Scenarios
4. Results and Discussion
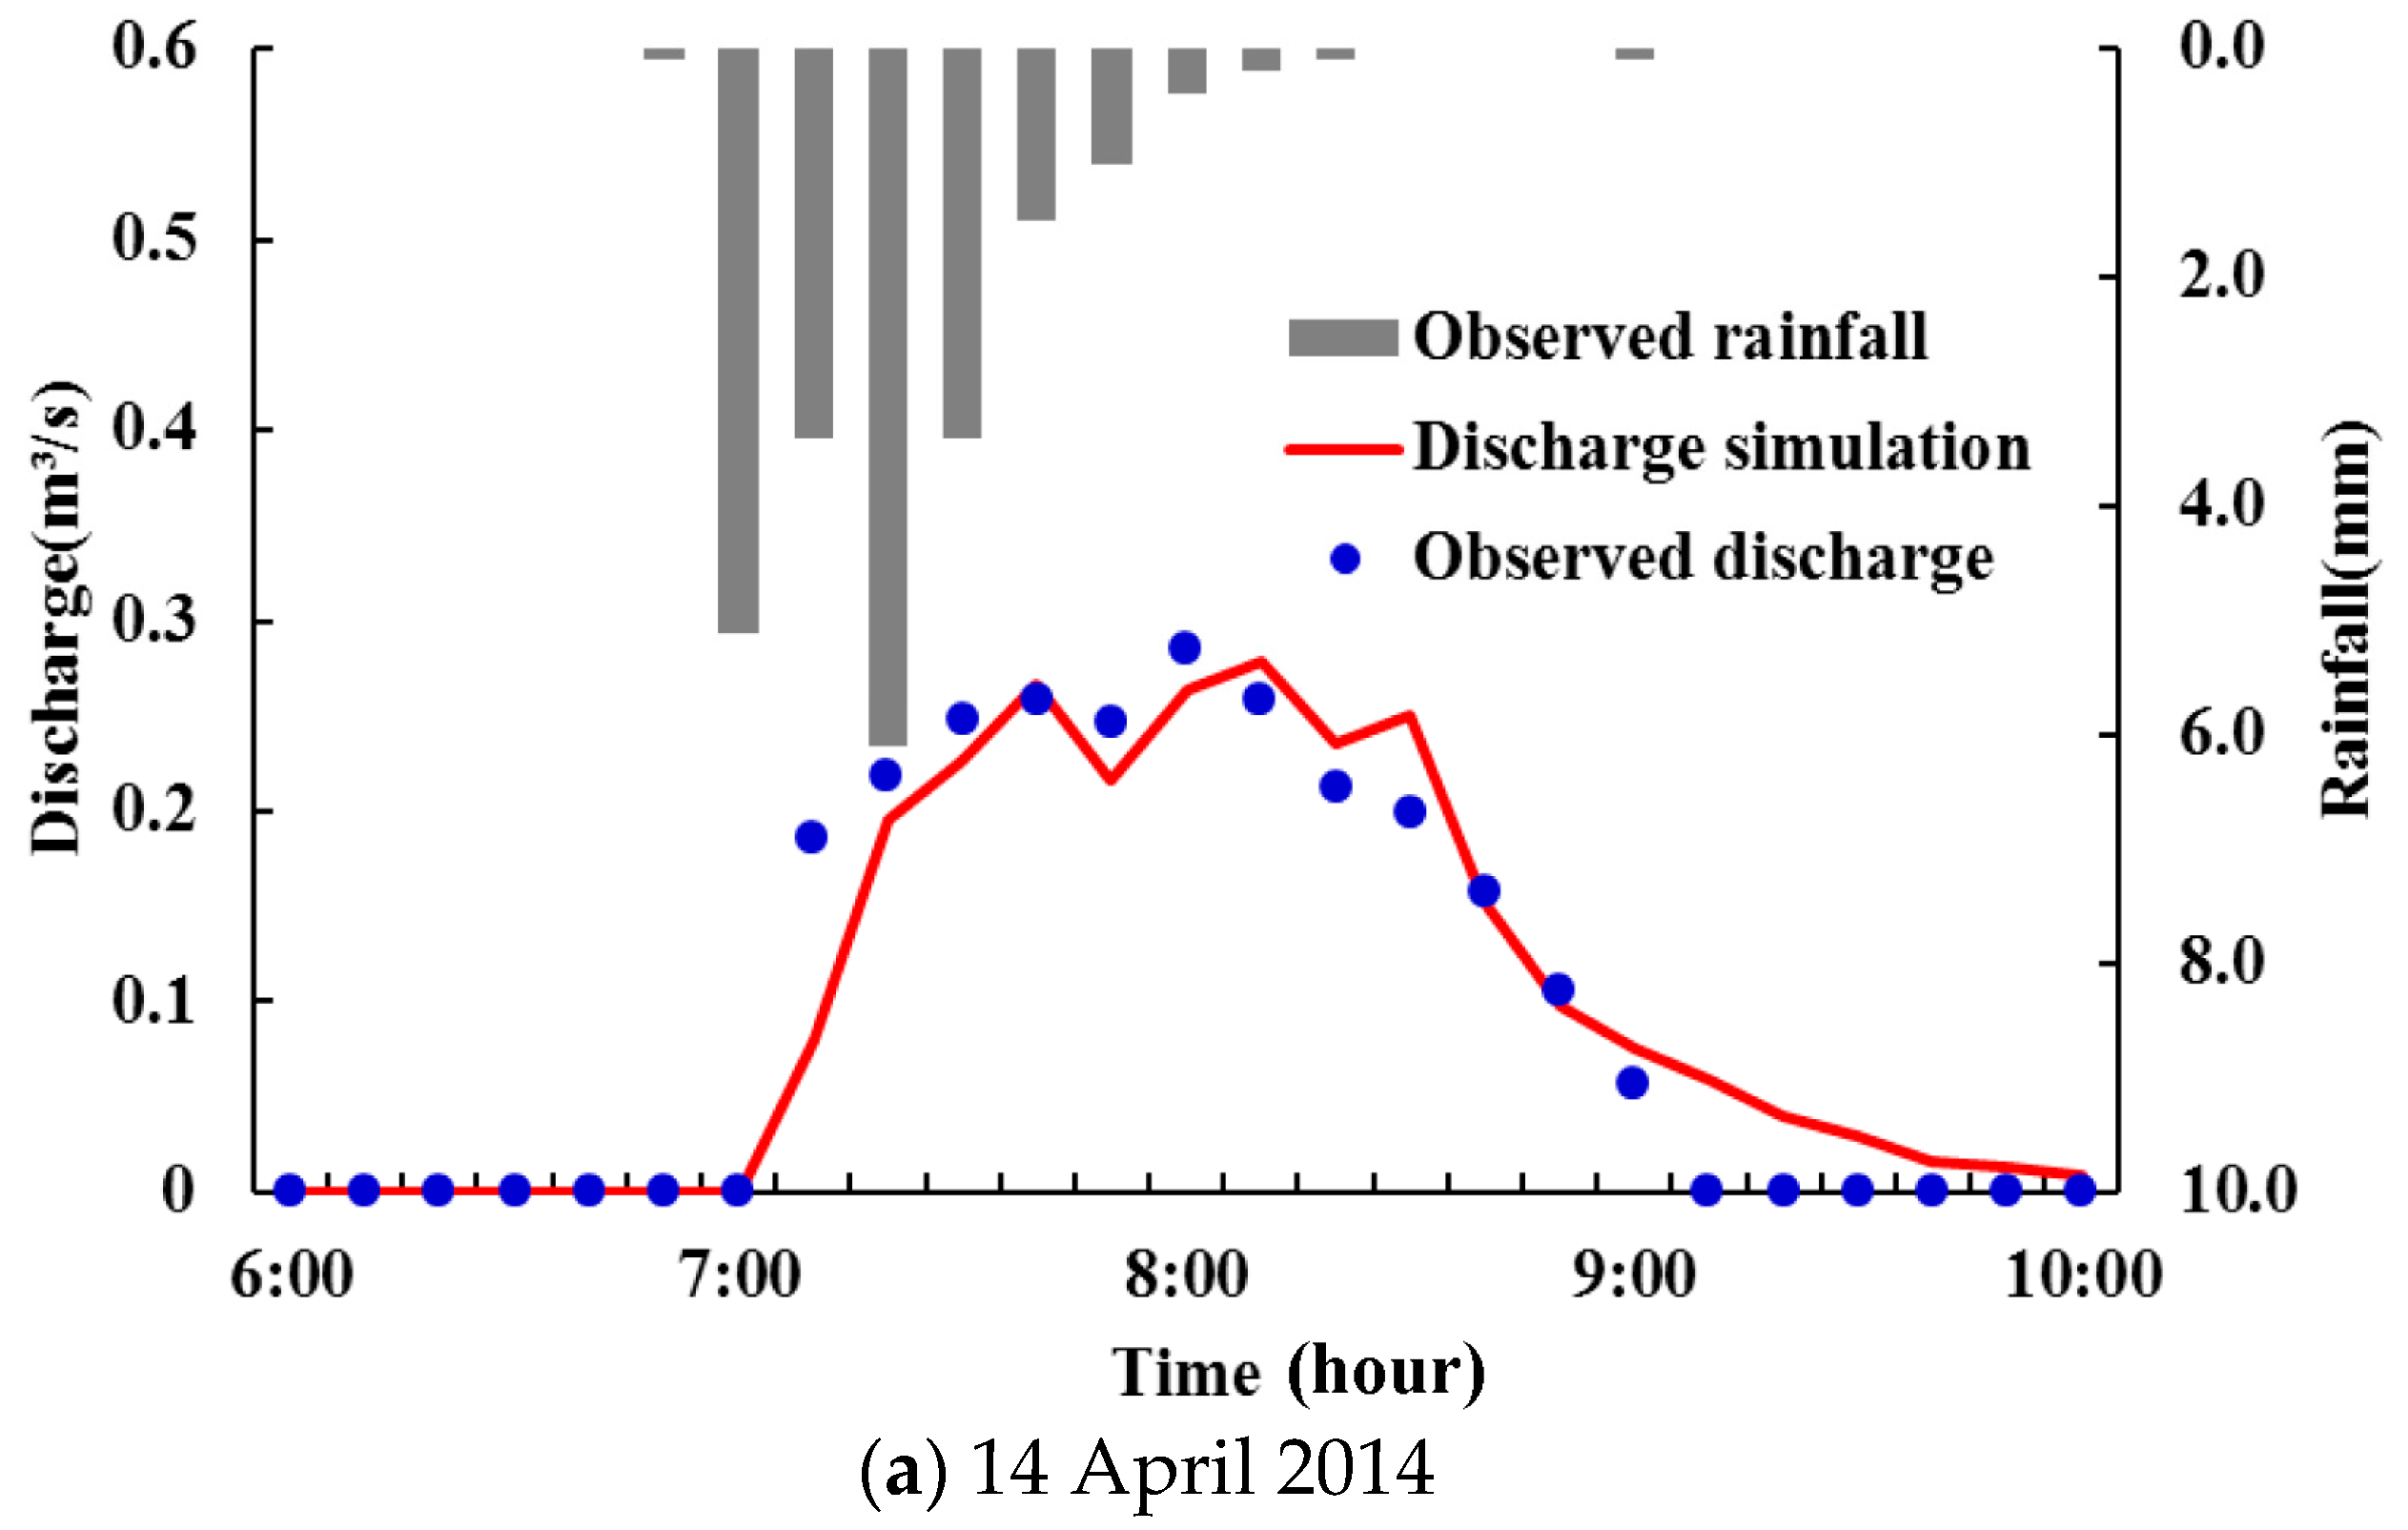
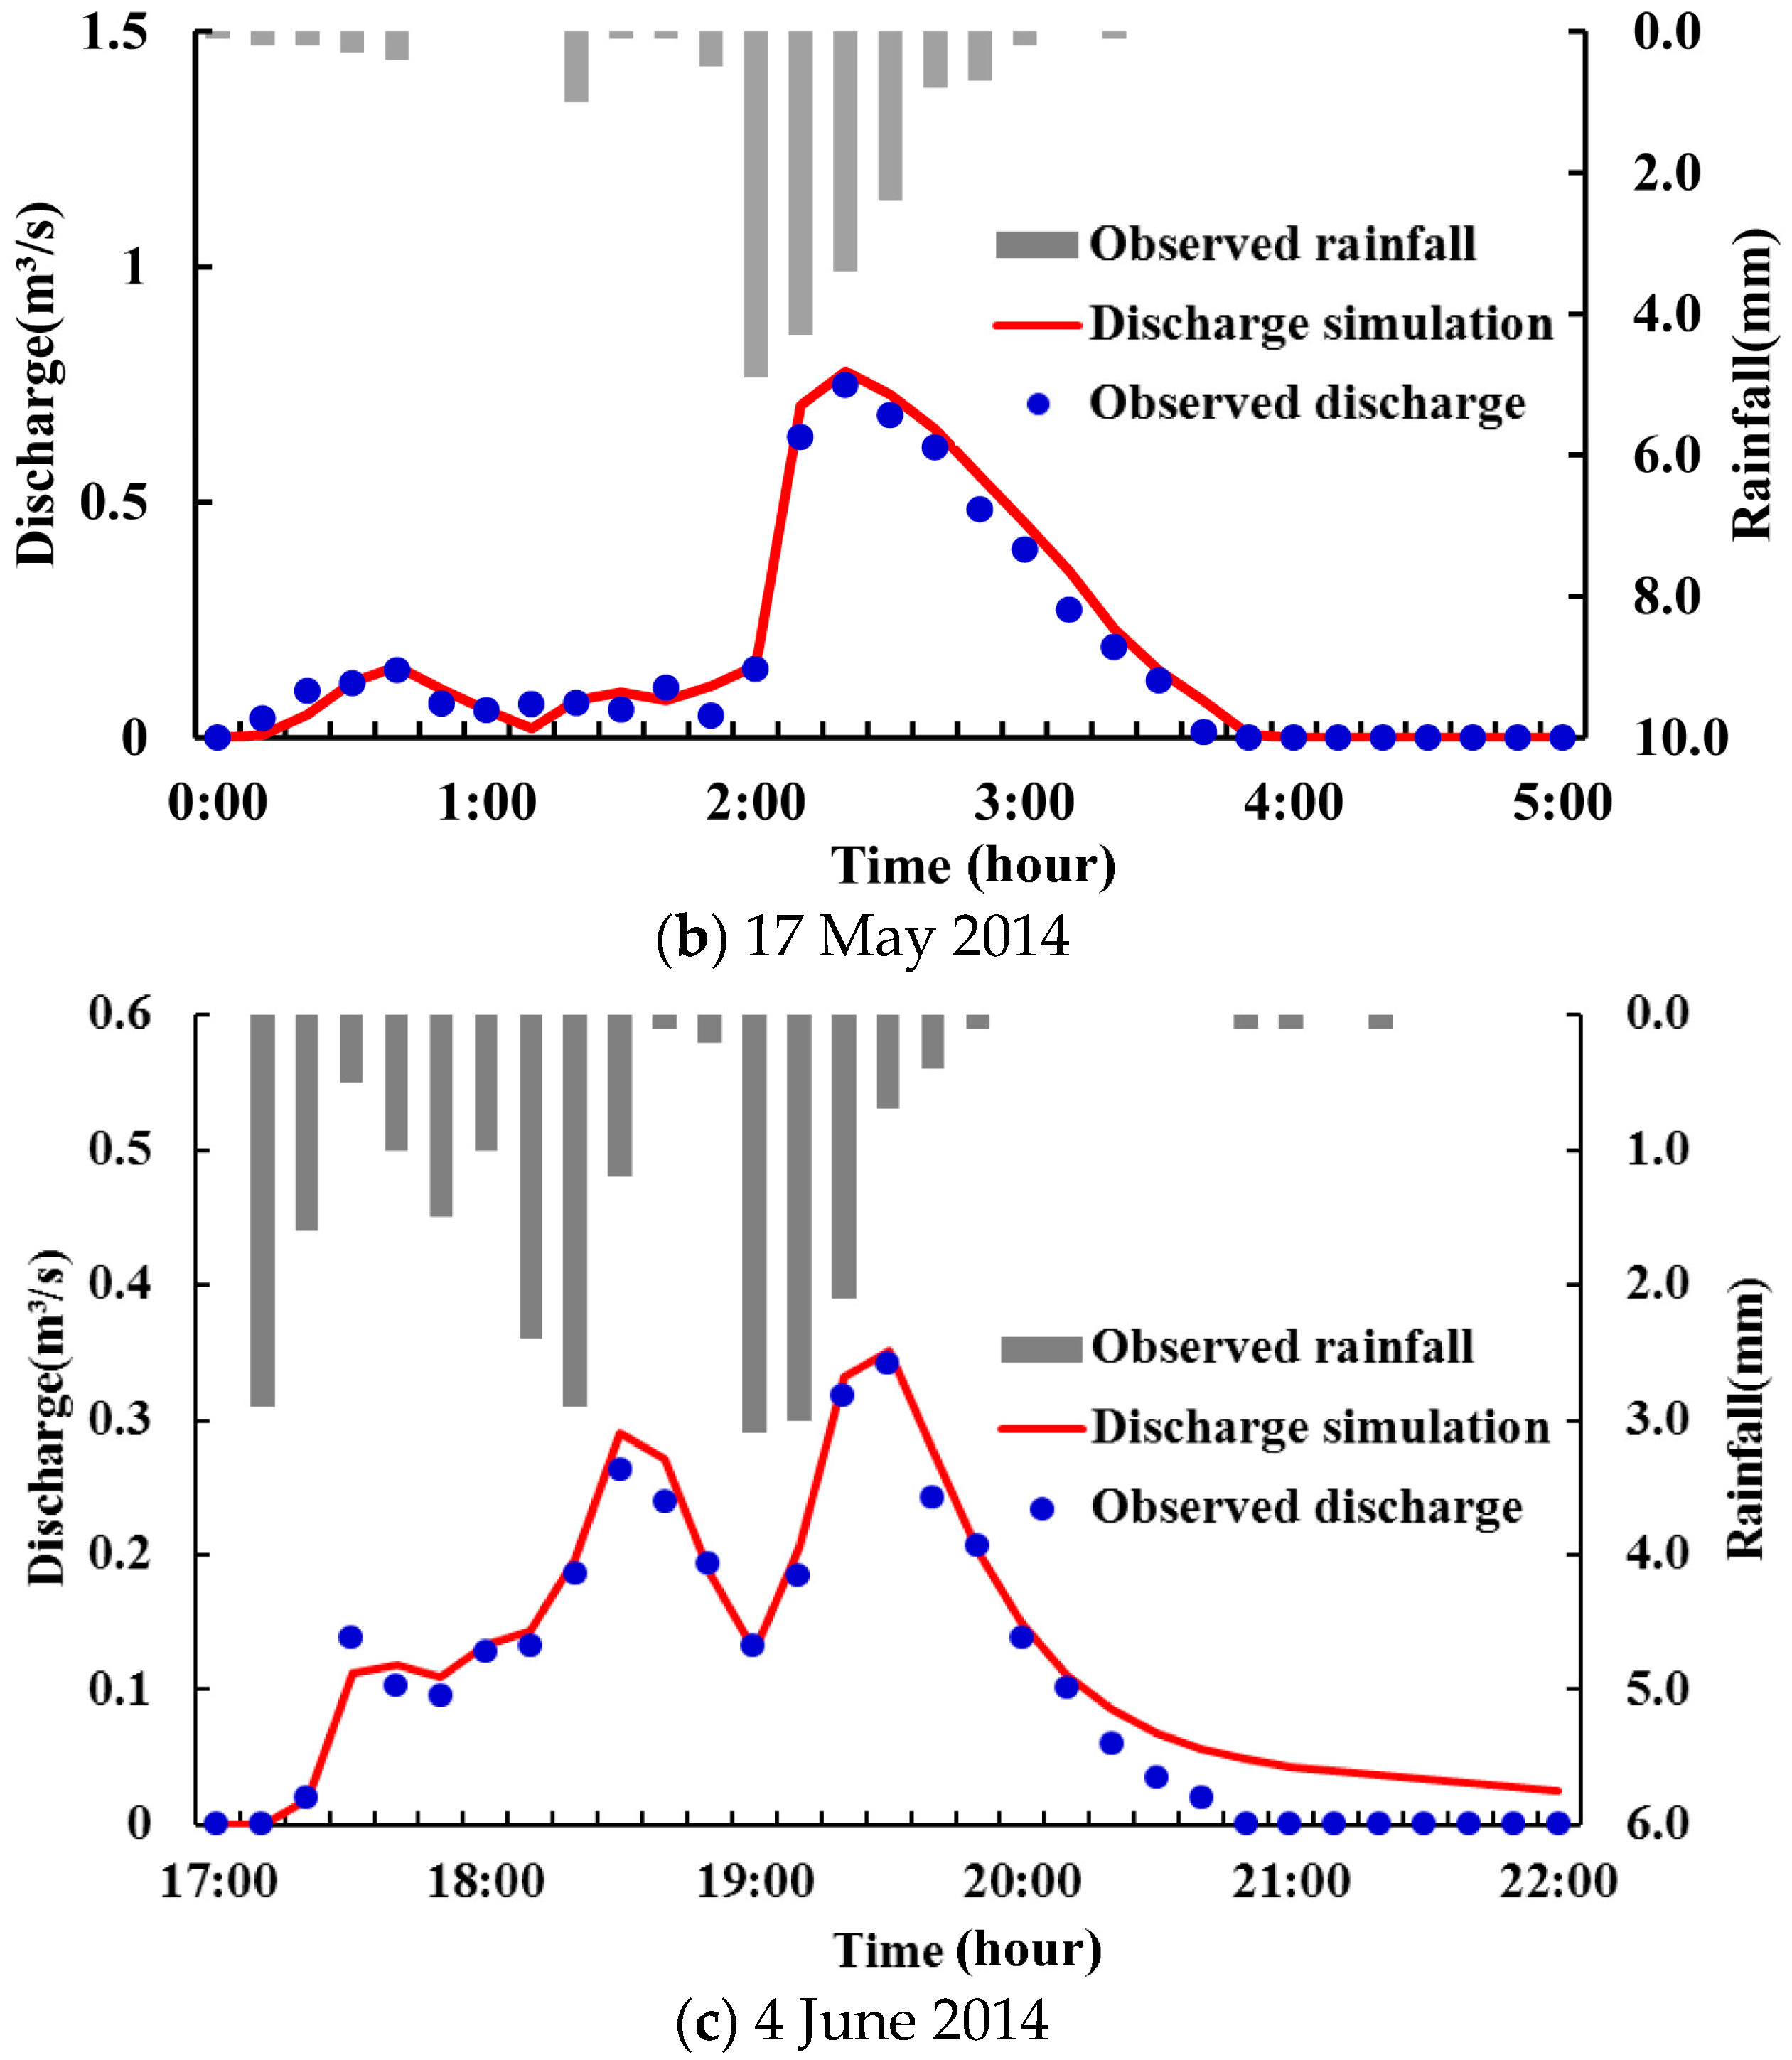
4.1. Calibration and Verification of Model Parameters
4.2. Analyze the Existing Situation of the Drainage System
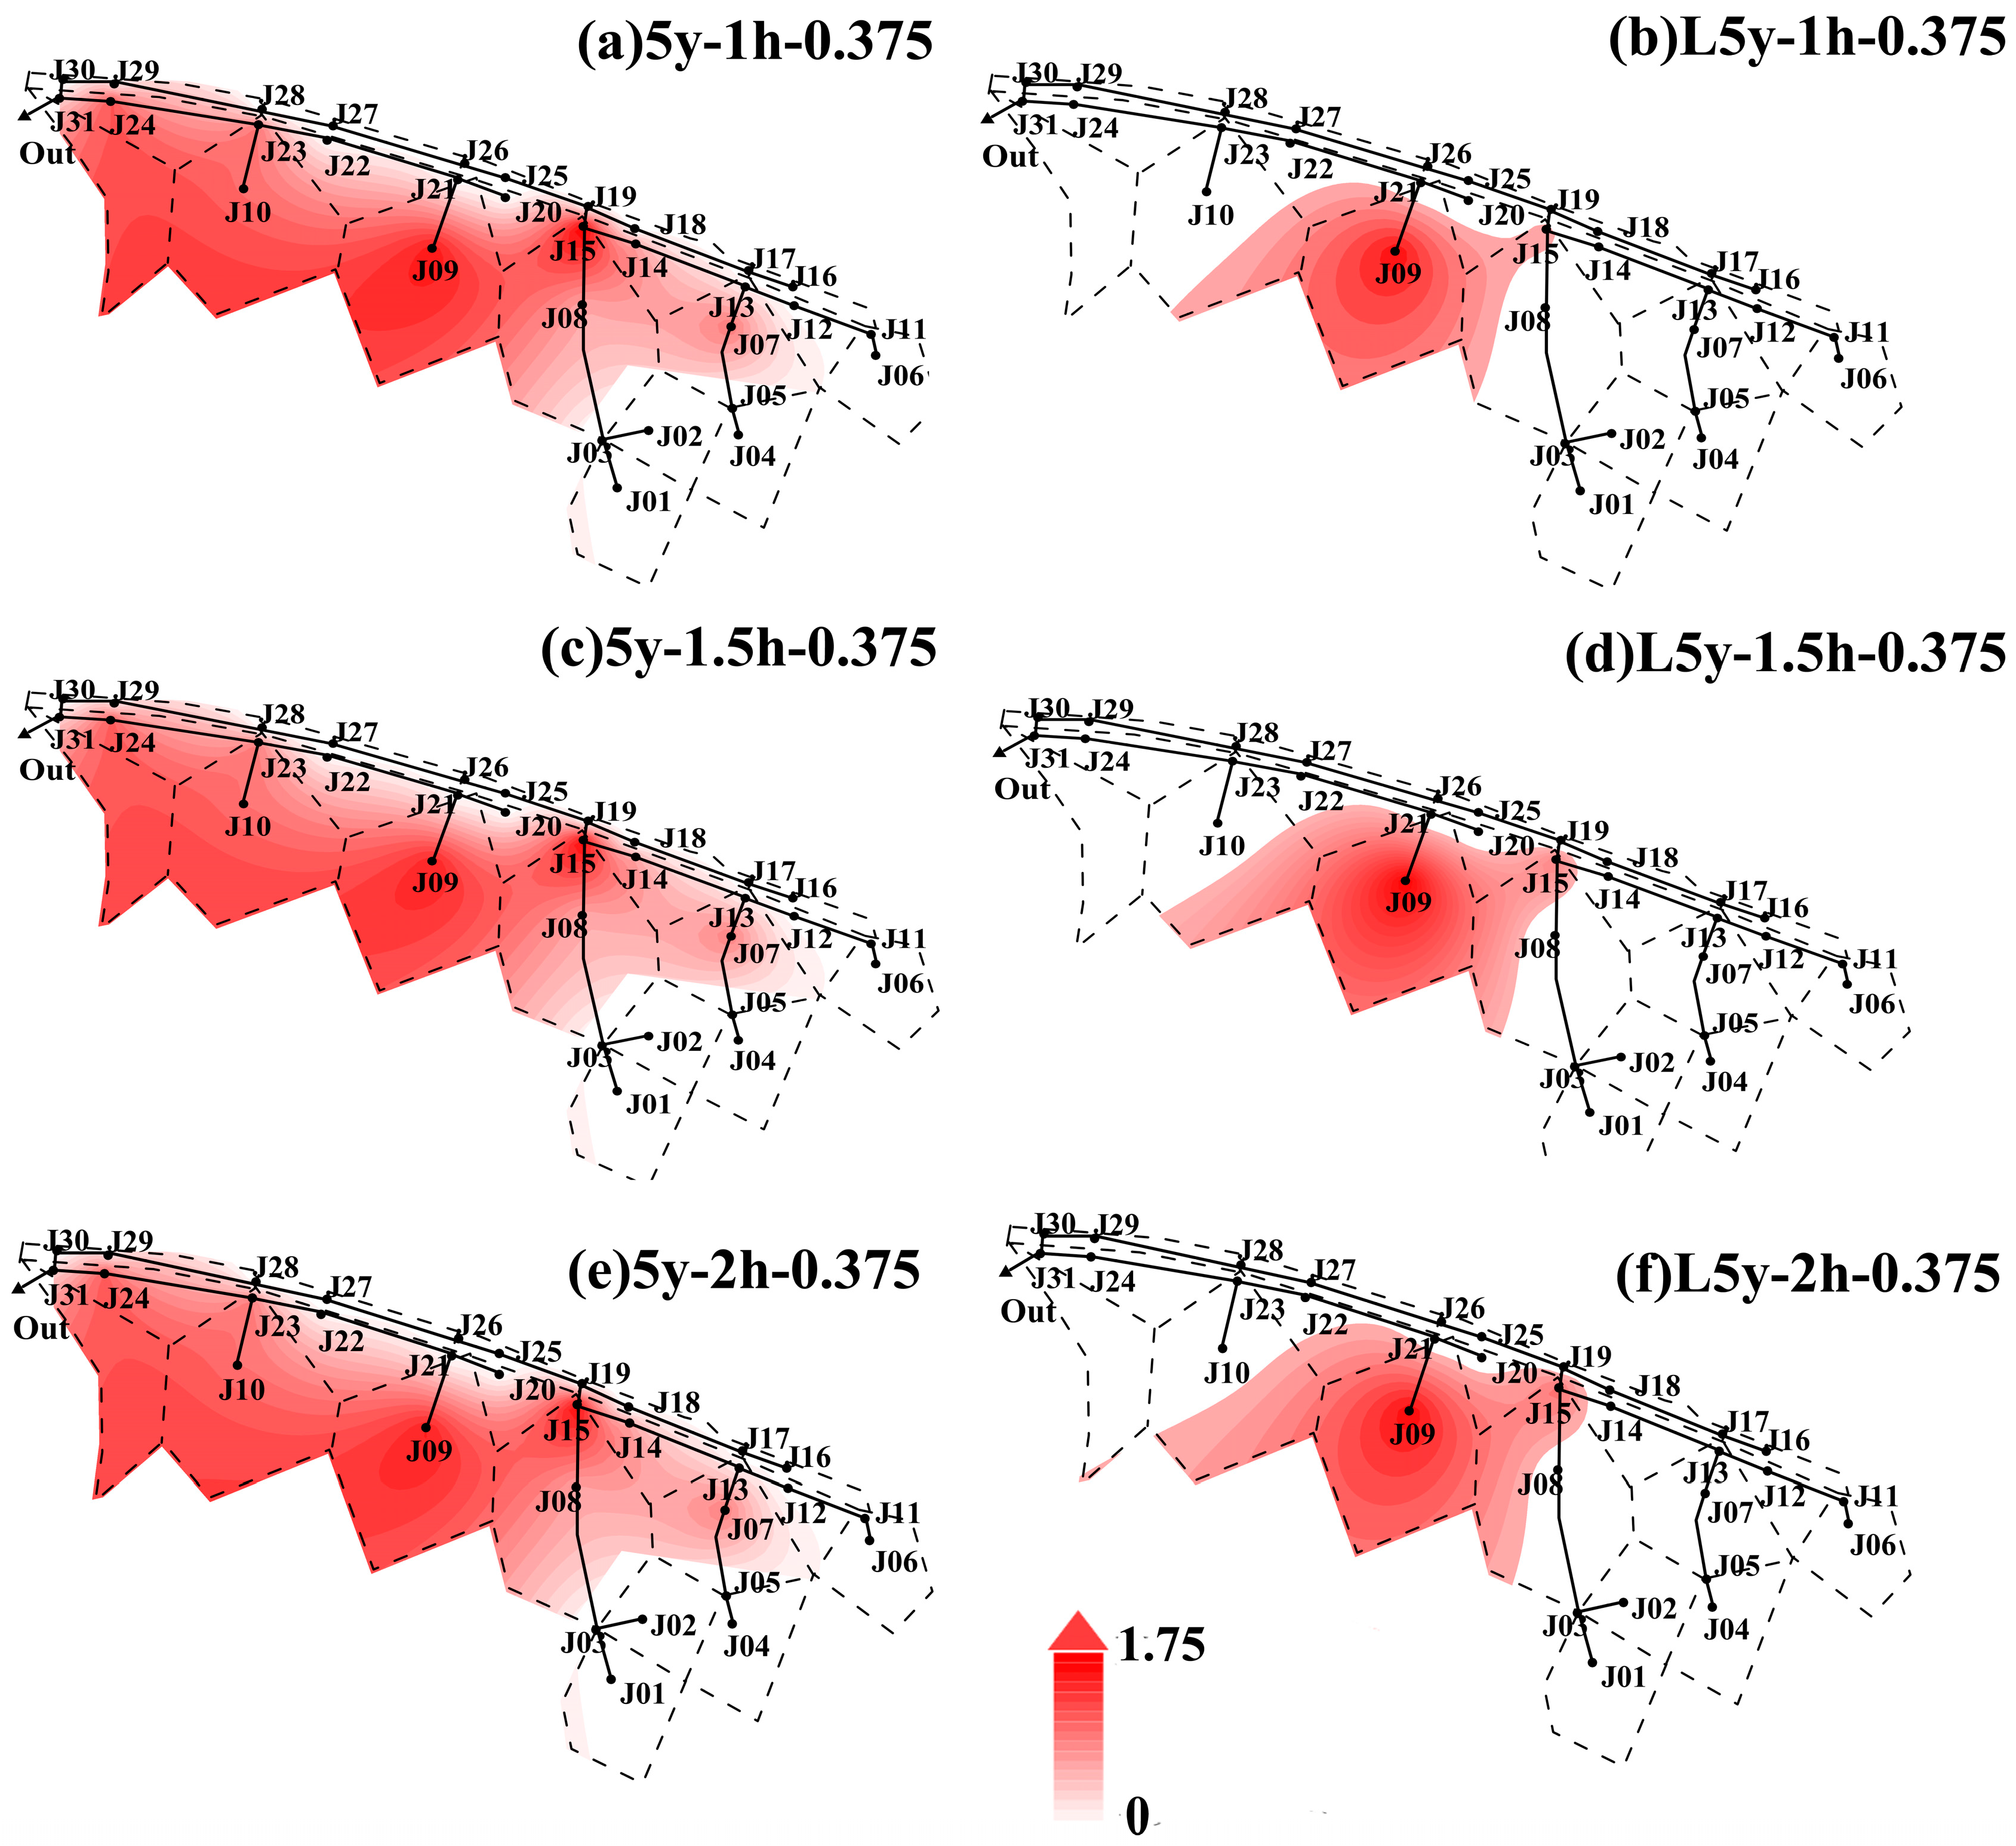
4.3. Control Characteristics of LID Practices under Complex Scenarios
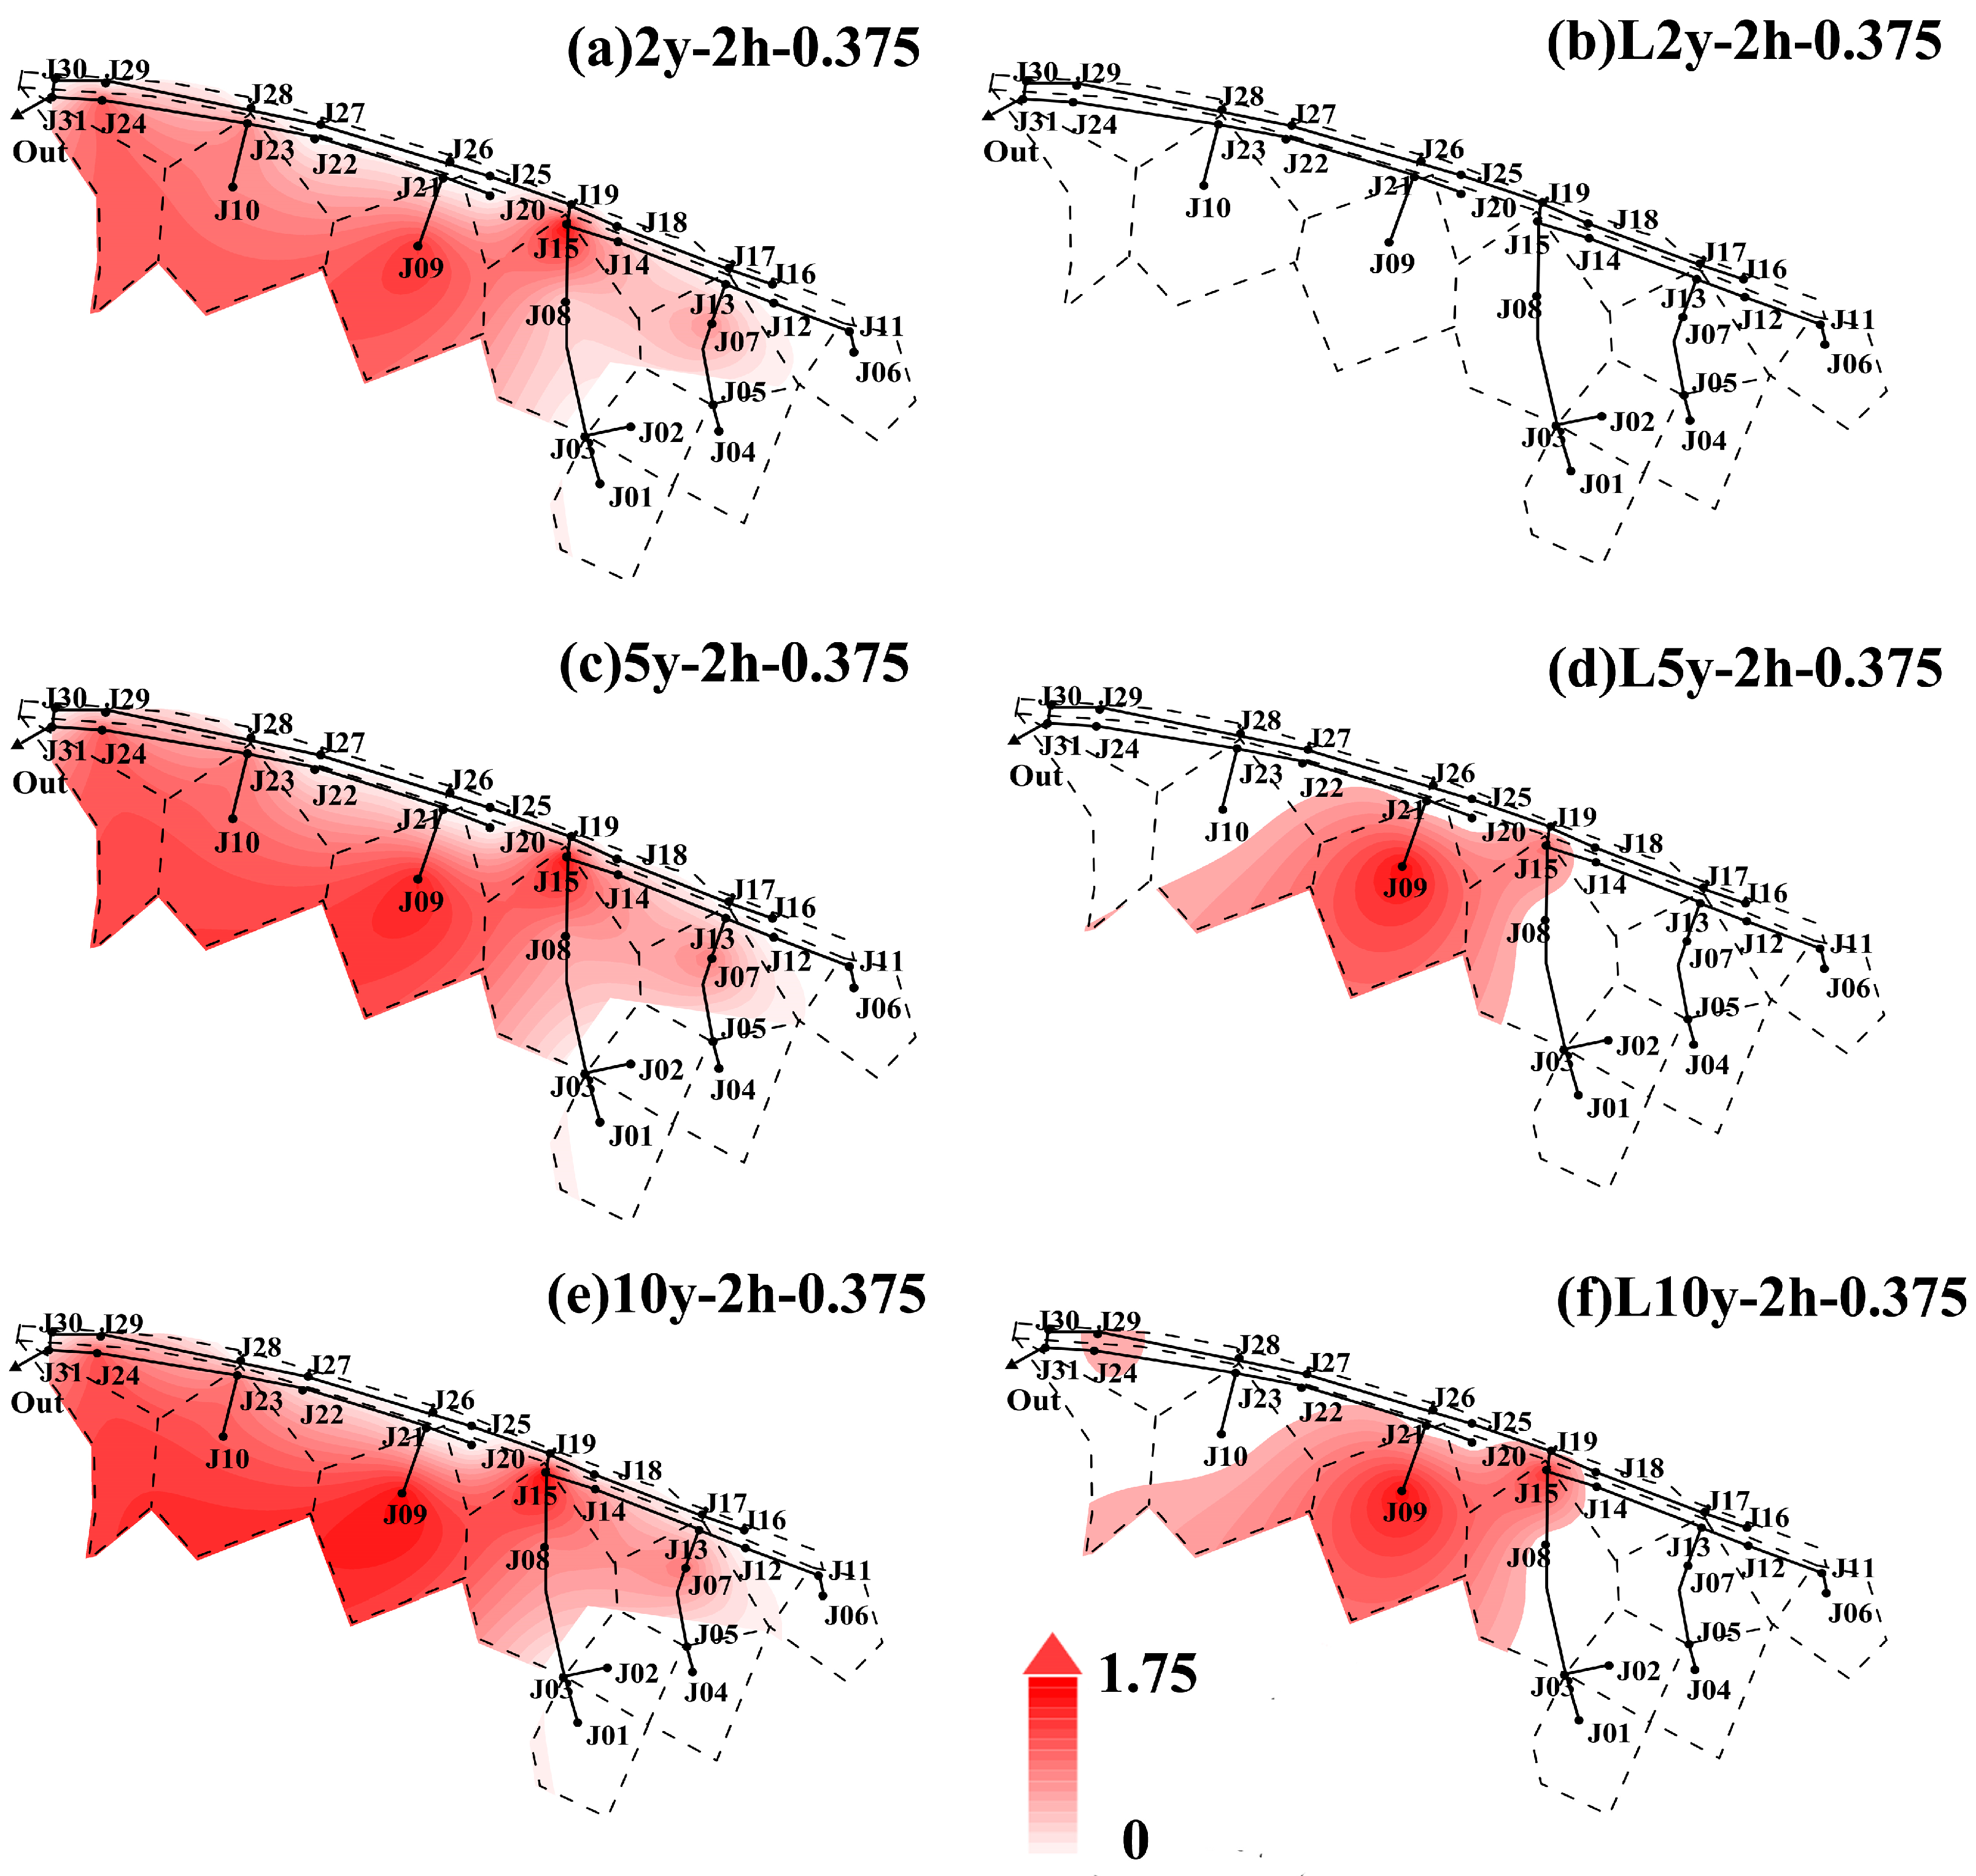
4.3.1. Influence of Rainfall Intensity on Flooding and LID Practices
4.3.2. Influence of Rainfall Duration on Flooding and LID Practices
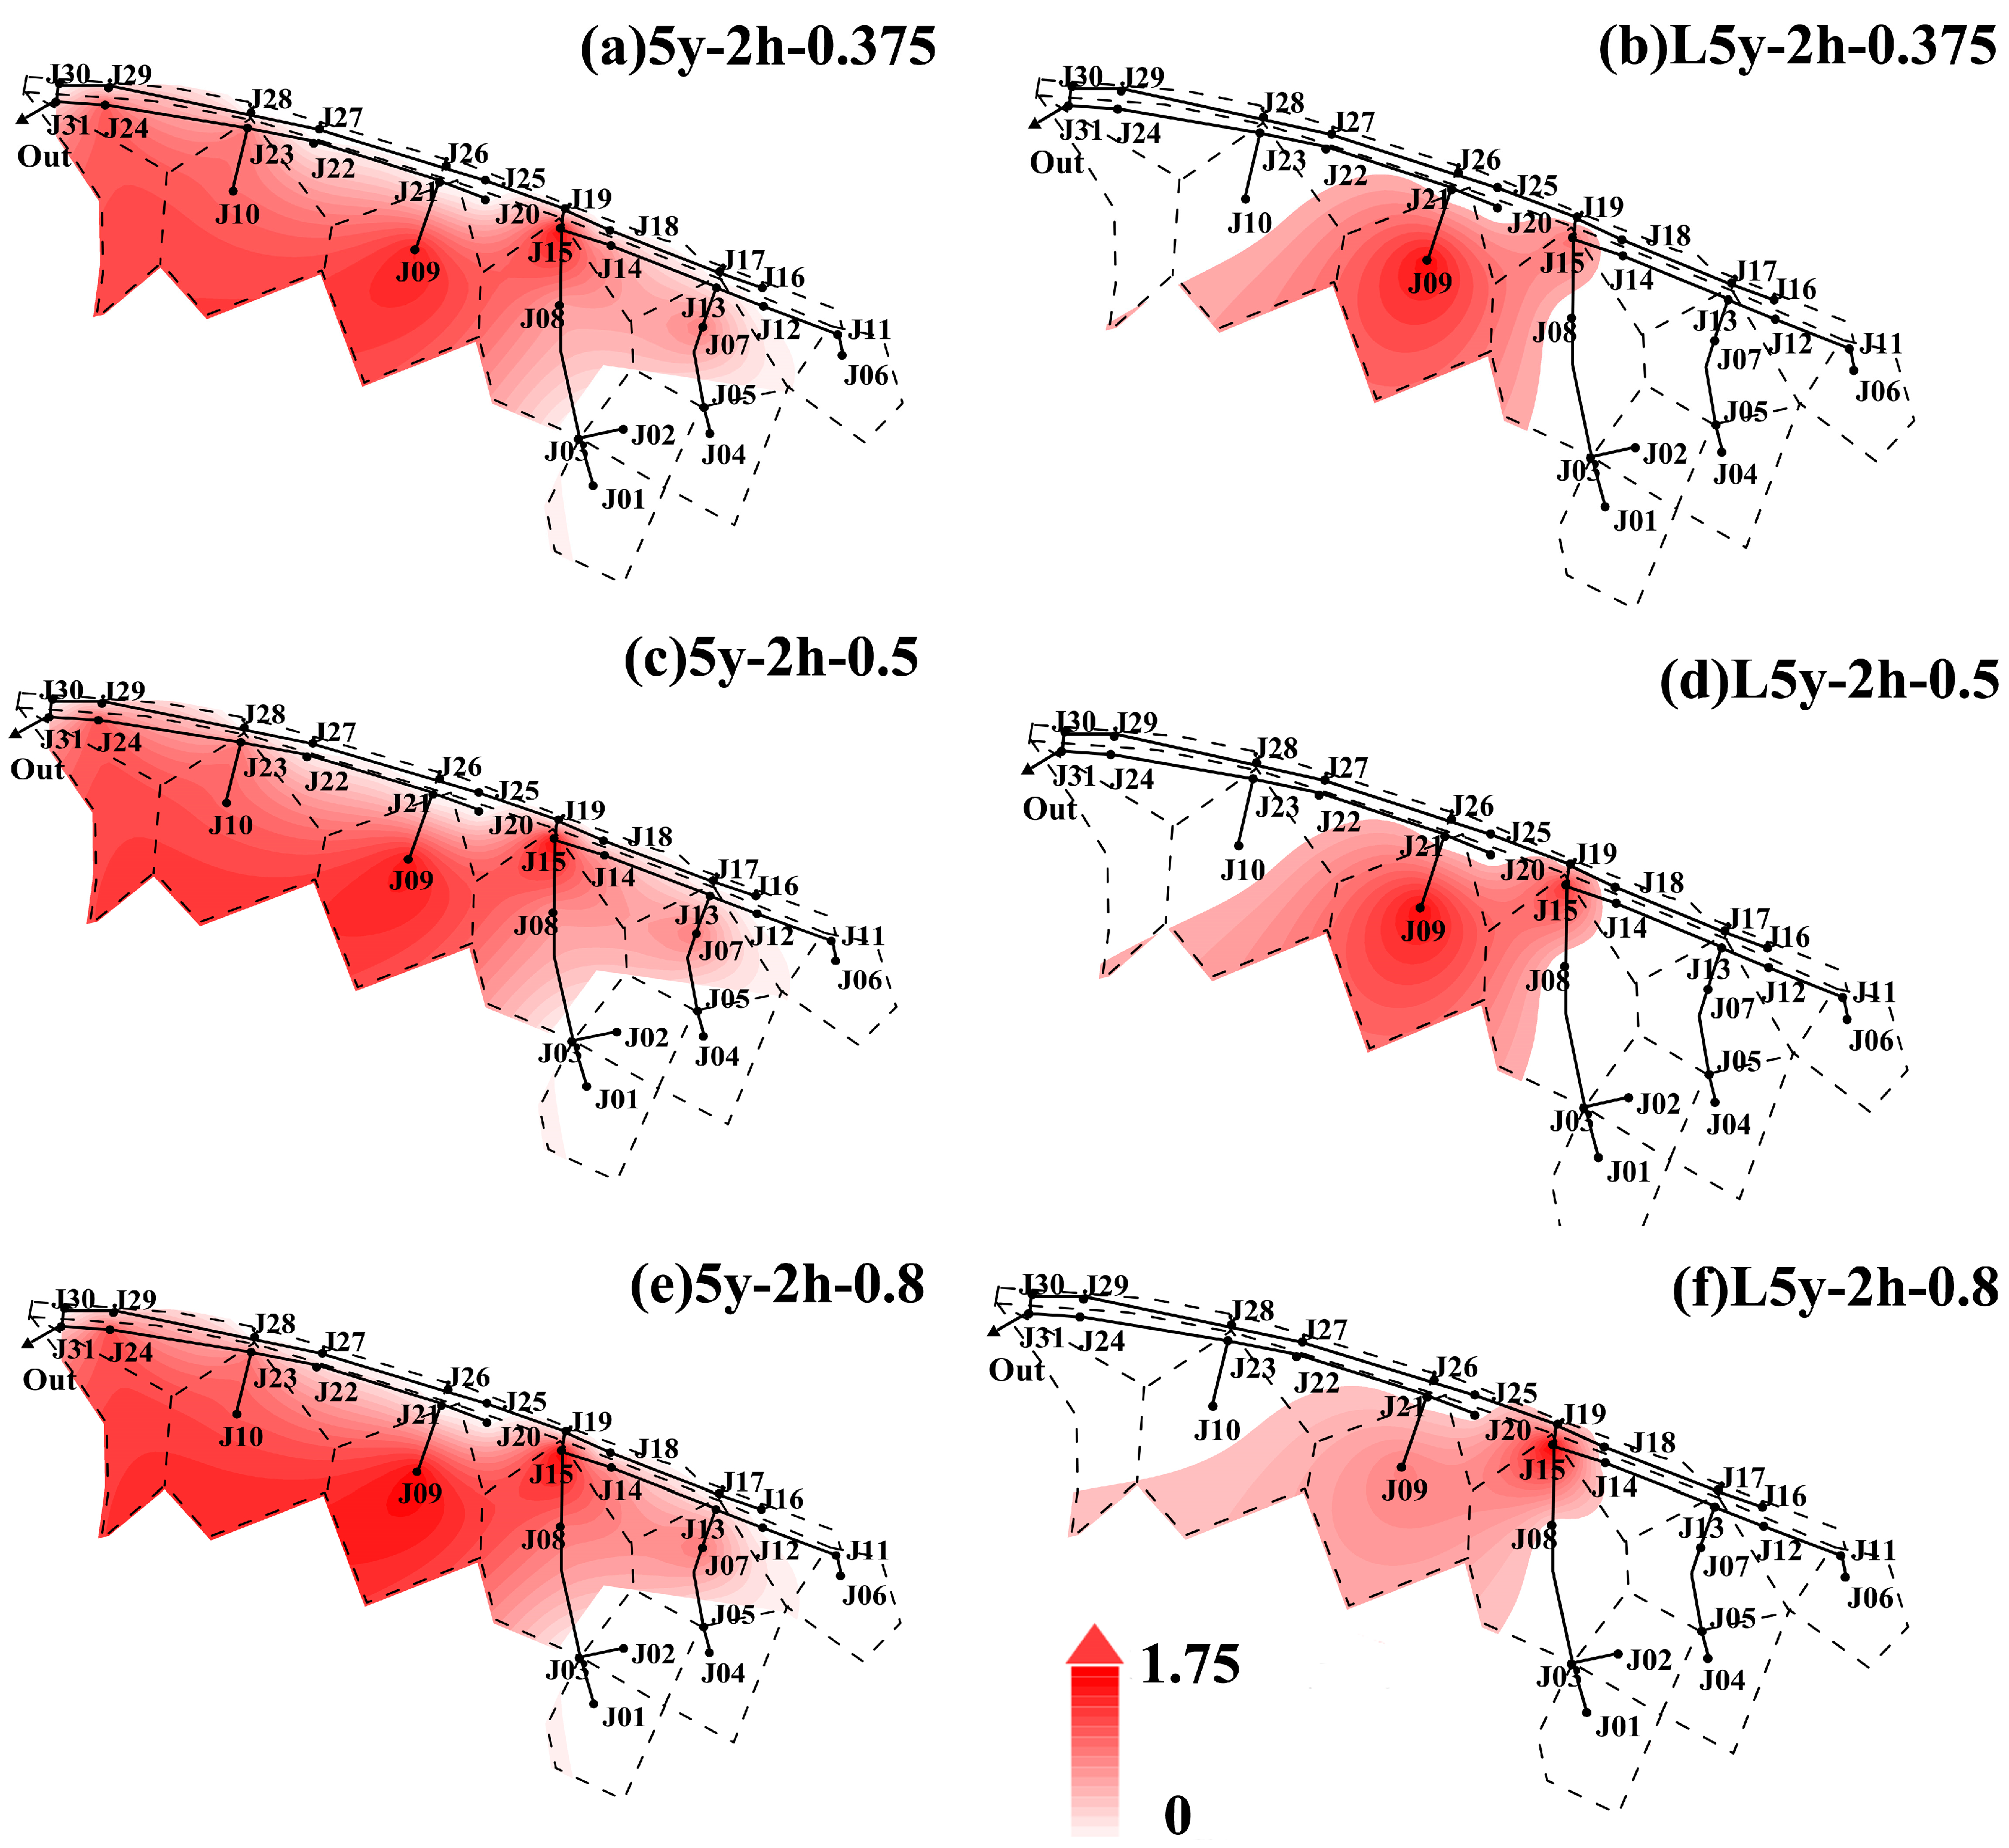
4.3.3. Influence of Rainfall Peak Coefficient on Flooding and LID Practices
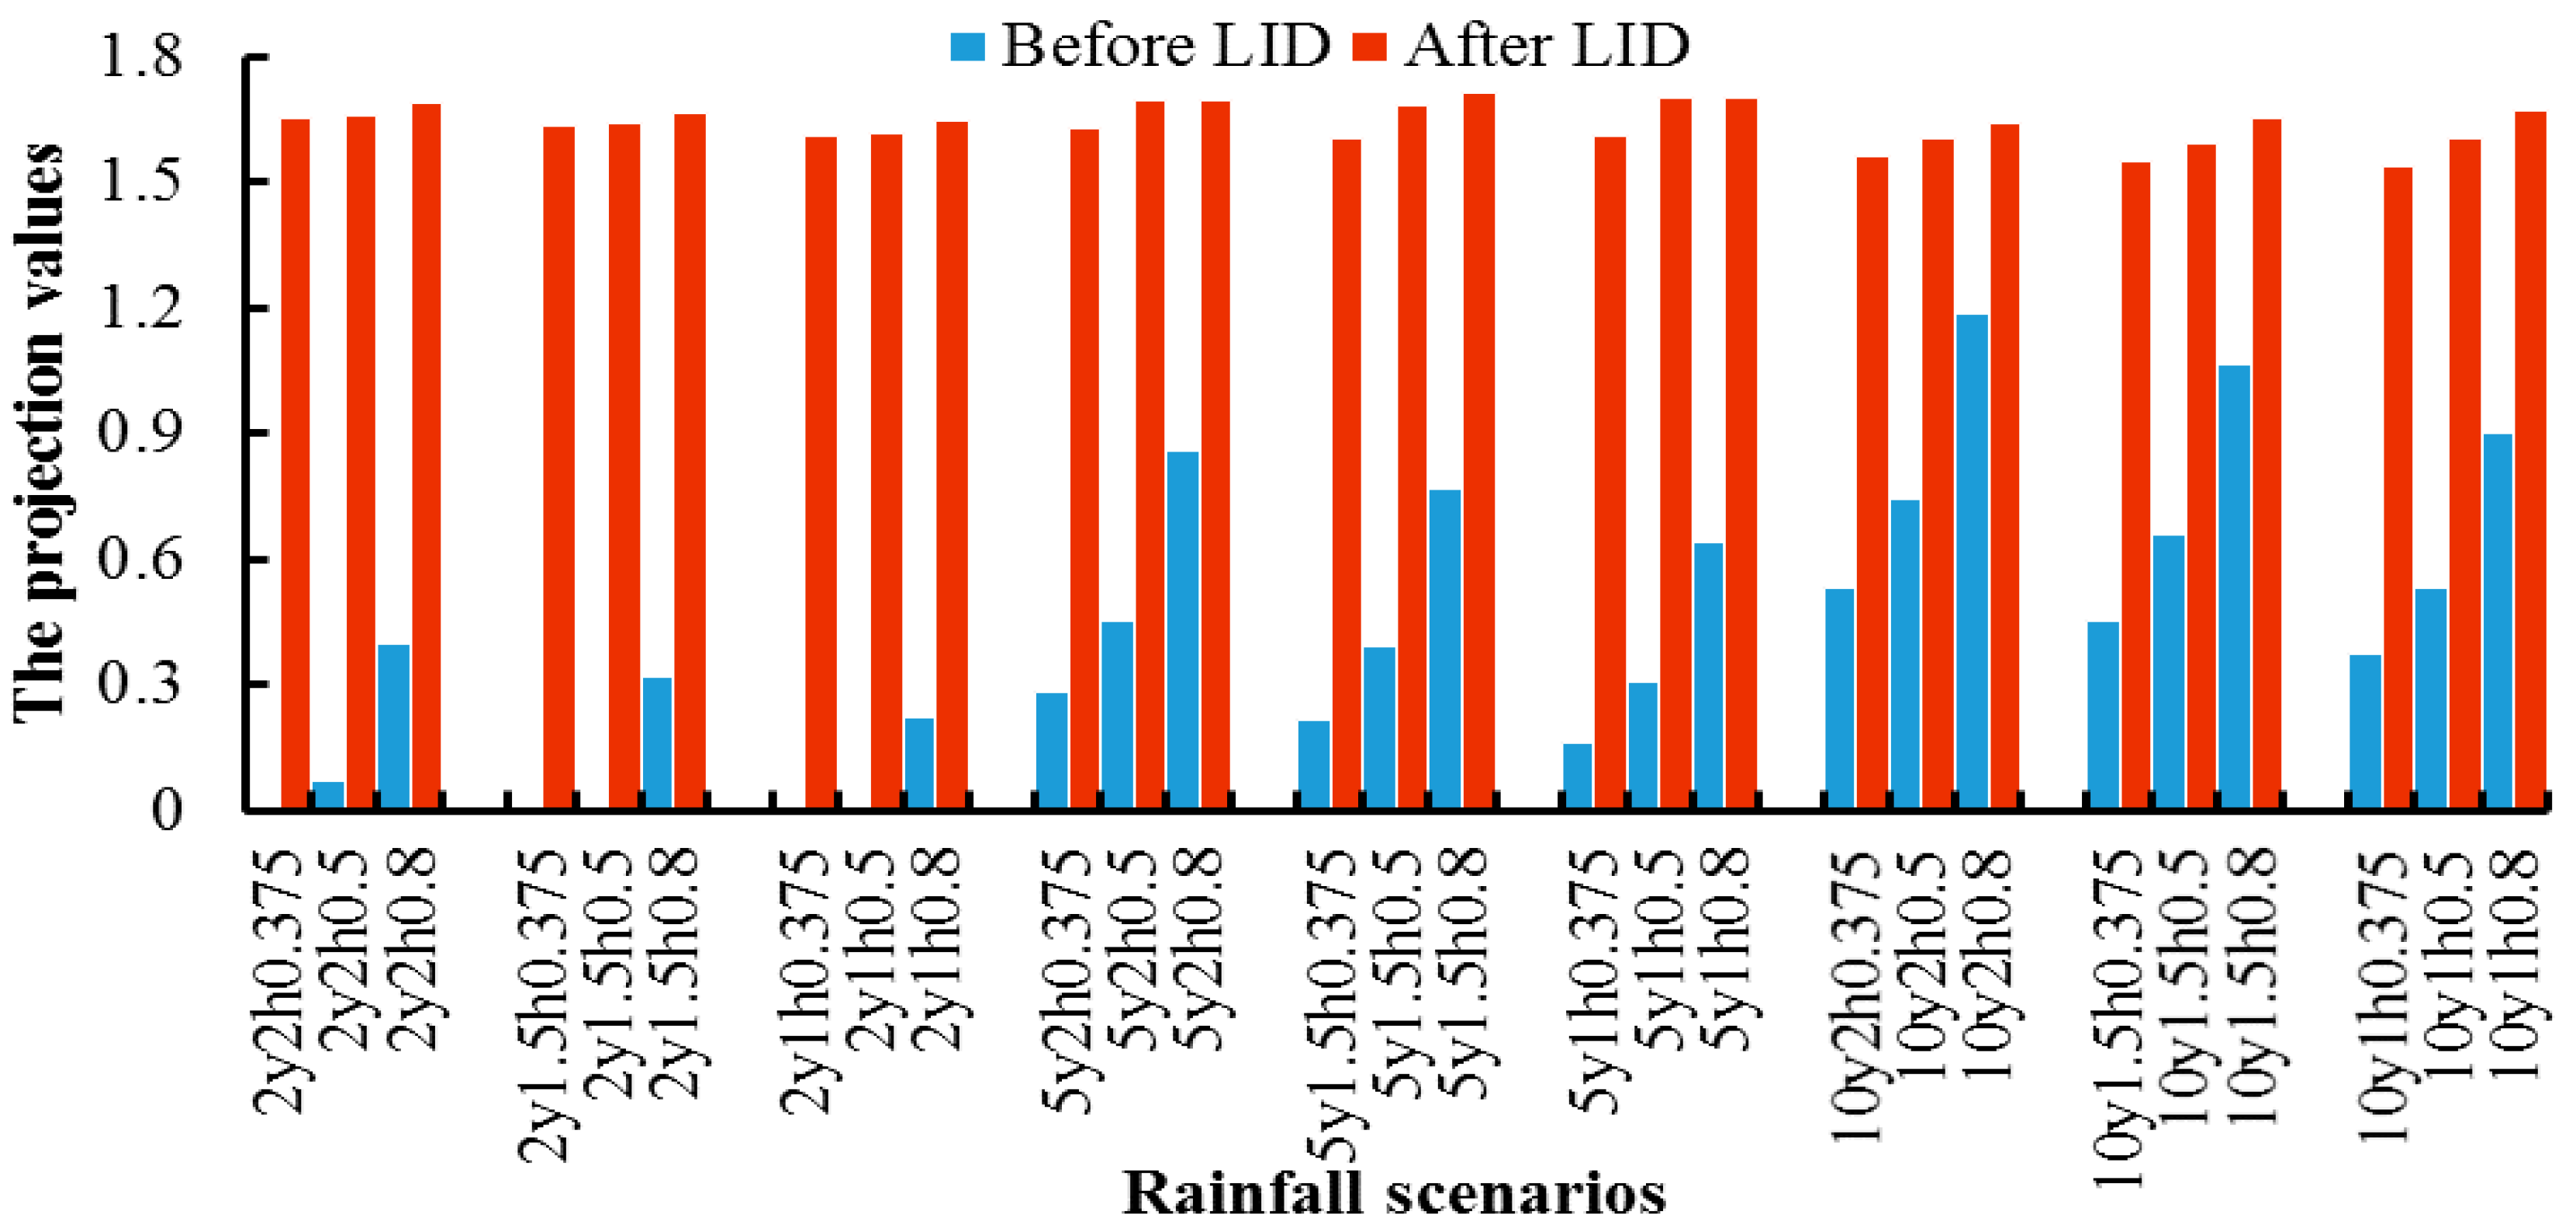
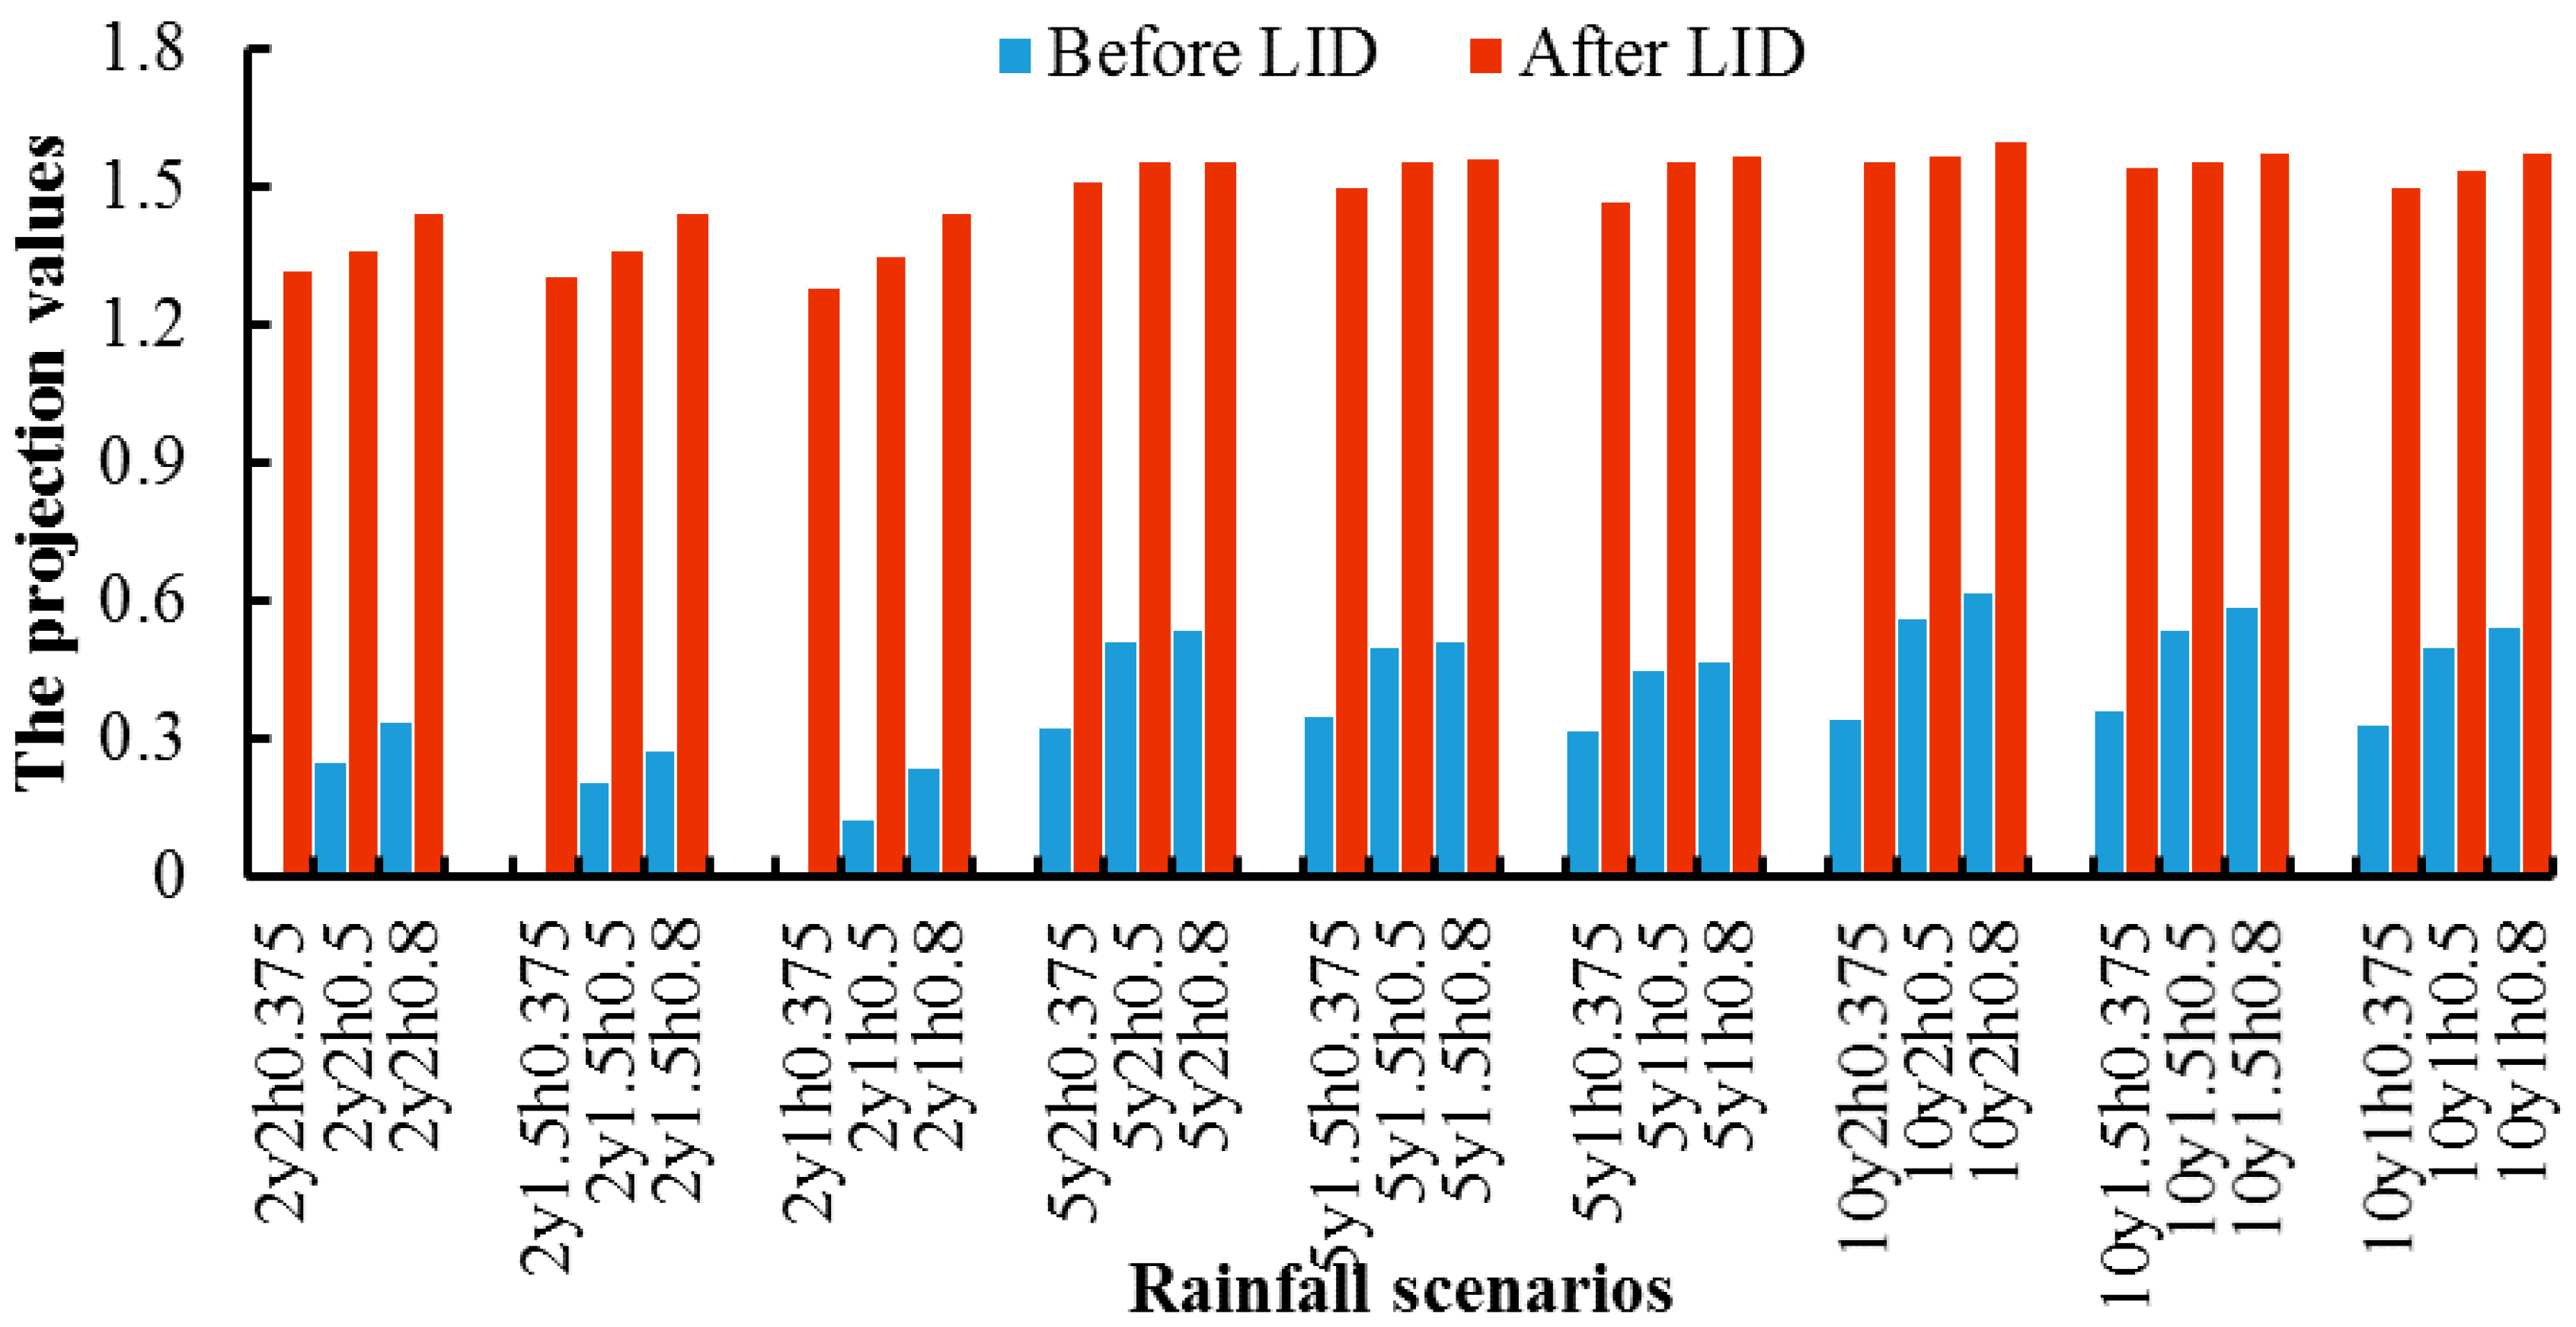
4.3.4. Changes in the Comprehensive Flood and LID Control Characteristics under Different Rainfall Scenarios
5. Conclusions
Acknowledgments
Author Contributions
Conflicts of Interest
References
- Albano, R.; Sole, A.; Mirauda, D.; Adamowski, J. Modelling large floating bodies in urban area flash-floods via a Smoothed Particle Hydrodynamics model. J. Hydrol. 2016, 541, 344–358. [Google Scholar] [CrossRef]
- Guinot, V.; Sanders, B.F.; Schubert, J.E. Dual integral porosity shallow water model for urban flood modelling. Adv. Water Resour. 2017, 103, 16–31. [Google Scholar] [CrossRef]
- Duan, W.L.; He, B.; Takara, K.; Luo, P.P.; Nover, D.; Yamashiki, Y.; Huang, W.R. Anomalous atmospheric events leading to Kyushu’s flash floods, 11–14 July 2012. Nat. Hazards 2014, 73, 1255–1267. [Google Scholar] [CrossRef]
- Public Utilities Board of Singapore. Report on Key Conclusions and Recommendations of the Expert Panel on Drainage Design and Flood Protection Measures; PUB: Singapore, 2012.
- Escuder-Bueno, I.; Castillo-Rodríguez, J.T.; Zechner, S.; Jöbstl, C.; Perales-Momparler, S.; Petaccia, G. A quantitative flood risk analysis methodology for urban areas with integration of social research data. Nat. Hazards Earth Syst. Sci. 2012, 12, 2843–2863. [Google Scholar] [CrossRef] [Green Version]
- Parliamentary Office of Science and Technology. Urban Flooding; Postnote Number 289; POST: London, UK, 2007. [Google Scholar]
- Chen, S.Y.; Xue, Z.C.; Li, M.; Zhu, X.P. Variable sets method for urban flood vulnerability assessment. Sci. China Technol. Sci. 2013, 56, 3129–3136. [Google Scholar] [CrossRef]
- Bubeck, P.; Botzen, W.J.W.; Aerts, J.C.J.H. A review of risk perceptions and other factors that influence flood mitigation behavior. Risk Anal. 2012, 32, 1481–1495. [Google Scholar] [CrossRef] [PubMed] [Green Version]
- Lee, J.Y.; Moon, H.J.; Kim, T.I.; Kim, H.W.; Han, M.Y. Quantitative analysis on the urban flood mitigation effect by the extensive green roof system. Environ. Pollut. 2013, 181, 257–261. [Google Scholar] [CrossRef] [PubMed]
- Wang, J.; Gao, W.; Xu, S.Y.; Yu, L.Z. Evaluation of the combined risk of sea level rise, land subsidence, and storm surges on the coastal areas of Shanghai, China. Clim. Chang. 2012, 115, 537–558. [Google Scholar] [CrossRef]
- Zhu, G.W. Ponderation over the Flood Control Functions of the Artifical Landforms in PRD. Trop. Geogr. 2012, 32, 378–384. [Google Scholar]
- Wesselink, A.; Warner, J.; Syed, M.A.; Chan, F.; Tran, D.D.; Huq, H.; Huthoff, F.; Thuy, N.L.; Pinter, N.; Staveren, M.V.; et al. Trends in flood risk management in deltas around the world: Are we going ‘soft’? Int. J. Water Gov. 2015, 3, 25–46. [Google Scholar] [CrossRef]
- Tortajada, C.; Joshi, Y.; Biswas, A.K. The Singapore Water Story: Sustainable Development in an Urban City State; Routledge: London, UK; New York, NY, USA, 2013. [Google Scholar]
- Chui, S.K.; Leung, J.K.Y.; Chu, C.K. The development of a comprehensive flood prevention strategy for Hong Kong. Int. J. River Basin Manag. 2006, 4, 5–15. [Google Scholar] [CrossRef]
- Dietz, M.E. Low impact development practices: A review of current research and recommendations for future directions. Water Air Soil Pollut. 2007, 186, 351–363. [Google Scholar] [CrossRef]
- Fletcher, T.D.; Shuster, W.; Hunt, W.F.; Ashley, R.; Butler, D.; Arthur, S.; Trowsdale, S.; Barraud, S.; Semadeni-Davies, A.; Bertrand-Krajewski, J.L.; et al. SUDS, LID, BMPs, WSUD and more. The evolution and application of terminology surrounding urban drainage. Urban Water J. 2015, 12, 525–542. [Google Scholar] [CrossRef]
- Ahiablame, L.M.; Engel, B.A.; Chaubey, I. Effectiveness of low impact development practices in two urbanized watersheds: Retrofitting with rain barrel/cistern and porous pavement. J. Environ. Manag. 2013, 119, 151–161. [Google Scholar] [CrossRef] [PubMed]
- Seo, M.; Jaber, F.; Srinivasan, R.; Jeong, J.H. Evaluating the Impact of Low Impact Development (LID) Practices on Water Quantity and Quality under Different Development Designs Using SWAT. Water 2017, 9, 193. [Google Scholar] [CrossRef]
- PRC Ministry of Construction. Guiding Technology on Constructing the Sponge Cities—Constructing the Rainwater System Based on Low Impact Development; PRC Ministry of Construction: Beijing, China, 2014.
- Lim, H.S.; Lu, X.X. Sustainable urban stormwater management in the tropics: An evaluation of Singapore’s ABC Waters Program. J. Hydrol. 2016, 538, 842–862. [Google Scholar] [CrossRef]
- Silva, M.M.; Costa, J.P. Flood adaptation measures applicable in the design of urban public spaces: Proposal for a conceptual framework. Water 2016, 8, 284. [Google Scholar] [CrossRef]
- Xia, J.; Zhang, Y.Y.; Xiong, L.H.; He, S.; Wang, L.F.; Yu, Z.B. Opportunities and challenges of the Sponge City construction related to urban water issues in China. Sci. China Earth Sci. 2017, 60, 652–658. [Google Scholar] [CrossRef]
- Li, T.; Shan, S.C.; Liu, J.; She, N.; Chen, B.N.; Wu, L.Y. Applying New Features of Low-Impact Development Techniques in the Master Planning of Guangzhou Educational Town. Int. Low Impact Dev. 2015. [Google Scholar] [CrossRef]
- Chang, C.G.V. Reimagining Urban Drainage in the World’s Biggest Construction Sites: Three LID Stories in Eastern. China Int. Low Impact Dev. 2015. [Google Scholar] [CrossRef]
- Jia, H.; Yao, H.; Yu, S.L. Advances in LID BMPs research and practice for urban runoff control in China. Front. Environ. Sci. Eng. 2013, 7, 709–720. [Google Scholar] [CrossRef]
- Li, P.; Liu, J.; Fu, R.; Liu, X.; Zhou, Y.Y.; Luan, M. The performance of LID (low impact development) practices at different locations with an urban drainage system: A case study of Longyan, China. Water Pract. Technol. 2015, 10, 739–746. [Google Scholar] [CrossRef]
- Rossman, L.A. Storm Water Management Model User’s Manual, Version 5.0; National Risk Management Research Laboratory, Office of Research and Development, US Environmental Protection Agency: Cincinnati, OH, USA, 2010.
- Burszta-Adamiak, E.; Mrowiec, M. Modelling of green roofs’ hydrologic performance using EPA’s SWMM. Water Sci. Technol. 2013, 68, 36–42. [Google Scholar] [CrossRef] [PubMed]
- Qin, H.P.; Li, Z.X.; Fu, G. The effects of low impact development on urban flooding under different rainfall characteristics. J. Environ. Manag. 2013, 129, 577–585. [Google Scholar] [CrossRef] [PubMed] [Green Version]
- Alfredo, K.; Montalto, F.; Goldstein, A. Observed and modeled performances of prototype green roof test plots subjected to simulated low-and high-intensity precipitations in a laboratory experiment. J. Hydrol. Eng. 2010, 15, 444–457. [Google Scholar] [CrossRef]
- Niu, S.; Cao, L.; Li, Y.; Huang, J.H. Long-Term Simulation of the Effect of Low Impact Development for Highly Urbanized Areas on the Hydrologic Cycle in China. Int. J. Environ. Sci. Dev. 2016, 7, 225–228. [Google Scholar] [CrossRef]
- Bedan, E.S.; Clausen, J.C. Stormwater runoff quality and quantity from traditional and low impact development watersheds. J. Am. Water Res. Assoc. 2009, 45, 998–1008. [Google Scholar] [CrossRef]
- Jia, H.; Lu, Y.; Yu, S.L.; Chen, Y. Planning of LID–BMPs for urban runoff control: The case of Beijing Olympic Village. Sep. Purif. Technol. 2012, 84, 112–119. [Google Scholar] [CrossRef]
- Huang, C.L.; Hsu, N.S.; Wei, C.C.; Luo, W.J. Optimal spatial design of capacity and quantity of rainwater harvesting systems for urban flood mitigation. Water 2015, 7, 5173–5202. [Google Scholar] [CrossRef]
- Du, S.Q.; Shi, P.J.; Van Rompaey, A.; Wen, J.H. Quantifying the impact of impervious surface location on flood peak discharge in urban areas. Nat. Hazards 2015, 76, 1457–1471. [Google Scholar] [CrossRef]
- Zhou, Q.; Leng, G.; Huang, M. Impacts of future climate change on urban flood risks: Benefits of climate mitigation and adaptations. Hydrol. Earth Syst. Sci. Discuss. 2016. [Google Scholar] [CrossRef]
- Fang, F.; Qiao, L.L.; Cao, J.S.; Li, Y.; Xie, W.M.; Sheng, G.P.; Yu, H.Q. Quantitative evaluation of A2O and reversed A2O processes for biological municipal wastewater treatment using a projection pursuit method. Sep. Purif. Technol. 2016, 166, 164–170. [Google Scholar] [CrossRef]
- Guangzhou Water Affairs Bureau. The Calculation Formulas and Diagrams of Urban Stormy of Guangzhou; Guangzhou Water Affairs Bureau: Guangzhou, China, 2011.
- Chen, Z.H.; Yin, L.; Chen, X.H.; Wei, S.; Zhu, Z.H. Research on the characteristics of urban rainstorm pattern in the humid area of Southern China: A case study of Guangzhou City. Int. J. Climatol. 2015, 35, 4370–4386. [Google Scholar] [CrossRef]
- Barco, J.; Wong, K.M.; Stenstrom, M.K. Automatic calibration of the US EPA SWMM model for a large urban catchment. J. Hydraul. Eng. 2008, 134, 466–474. [Google Scholar] [CrossRef]
- Granata, F.; Gargano, R.; de Marinis, G. Support vector regression for rainfall-runoff modeling in urban drainage: A comparison with the EPA’s Storm Water Management Model. Water 2016, 8, 69. [Google Scholar] [CrossRef]
- Jang, S.; Cho, M.; Yoon, J.; Yoon, Y.; Kim, S.; Kim, G.; Kim, L.; Aksoy, H. Using SWMM as a tool for hydrologic impact assessment. Desalination 2007, 212, 344–356. [Google Scholar] [CrossRef]
- Pushpalatha, R.; Perrin, C.; Le Moine, N.; Andréassian, V. A review of efficiency criteria suitable for evaluating low-flow simulations. J. Hydrol. 2012, 420, 171–182. [Google Scholar] [CrossRef]
- Dechmi, F.; Burguete, J.; Skhiri, A. SWAT application in intensive irrigation systems: Model modification, calibration and validation. J. Hydrol. 2012, 470, 227–238. [Google Scholar] [CrossRef] [Green Version]
- Yang, X.L.; Zhu, B.; Li, Y.L.; Hua, K.K. Simulation of nonpoint source nitrogen transport in two separated catchments in the hilly area of purple soil. J. Hydraul. Eng. 2013, 44, 1197–1203. [Google Scholar]
- Zhao, J.; Jin, J.L.; Guo, Q.Z.; Liu, L.; Chen, Y.Q.; Pan, M. Dynamic risk assessment model for flood disaster on a projection pursuit cluster and its application. Stoch. Environ. Res. Risk Assess. 2014, 28, 2175–2183. [Google Scholar] [CrossRef]
- Zhou, Y.; Guo, S.; Xu, C.Y.; Liu, D.; Chen, L.; Ye, Y. Integrated optimal allocation model for complex adaptive system of water resources management (I): Methodologies. J. Hydrol. 2015, 531, 964–976. [Google Scholar] [CrossRef]
- Pei, W.; Fu, Q.; Liu, D.; Li, T.X.; Cheng, K. Assessing agricultural drought vulnerability in the Sanjiang Plain based on an improved projection pursuit model. Nat. Hazards 2016, 82, 683–701. [Google Scholar] [CrossRef]
- Yang, G.; Guo, S.L.; Li, L.P.; Hong, X.J.; Wang, L. Multi-objective operating rules for Danjiangkou reservoir under climate change. Water Res. Manag. 2016, 30, 1183–1202. [Google Scholar] [CrossRef]
- Poli, R.; Rennedy, J.; Blackwell, T. Particle swarm optimization. Swarm Intell. 2007, 1, 33–57. [Google Scholar] [CrossRef]
- Gao, Y.; Du, W.B.; Yan, G. Selectively-informed particle swarm optimization. Sci. Rep. 2015, 5, 9295. [Google Scholar] [CrossRef] [PubMed]
- Shi, Y. Particle swarm optimization: Developments, applications and resources. In Proceedings of the 2001 Congress on Evolutionary Computation, Seoul, South Korea, 27–30 May 2001; IEEE: New York, NY, USA; Volume 1, pp. 81–86. [Google Scholar]
- Zhu, Z.H.; Chen, Z.H.; Chen, X.H.; He, P.Y. Approach for evaluating inundation risks in urban drainage systems. Sci. Total Environ. 2016, 553, 1–12. [Google Scholar] [CrossRef] [PubMed]
- Eberhart, R.C.; Shi, Y. Comparing inertia weights and constriction factors in particle swarm optimization. In Proceedings of the 2000 Congress on Evolutionary Computation, La Jolla, CA, USA, 16–19 July 2000; IEEE: New York, NY, USA; Volume 1, pp. 84–88. [Google Scholar]
- Wang, Y.C.; Lv, J.; Zhu, L.; Ma, Y.M. Crystal structure prediction via particle-swarm optimization. Phys. Rev. B 2010, 82, 094116. [Google Scholar] [CrossRef]
- Guangzhou Water Affairs Bureau. The Calculation Formulas and Diagrams of Urban Stormy of Guangzhou; Guangzhou Water Affairs Bureau: Guangzhou, China, 1993.


| LID Practices | Functions | Cost | Scenic Effect | |||
|---|---|---|---|---|---|---|
| Storage | Transportation | Reducing Runoff Peak Rate | Construction Cost | Maintenance Cost | ||
| Rain garden | A | A | A | C | B | A |
| Dry bioretention swales | C | A | A | A | A | A |
| Wet bioretention swales | C | A | C | B | A | A |
| Green roof | C | C | C | C | B | A |
| Porous pavement | C | B | B | A | A | - |
| Subsided Green space | C | B | B | A | A | B |
| Wet pond | A | B | A | C | B | A |
| Vegetative filter strip | C | C | C | A | A | B |
| P | i |
|---|---|
| P = 2 | |
| P = 5 | |
| P = 10 |
| Parameter | Recommended Parameter Range [27] | Parameter Range of the Rainfall–Runoff Model | |
|---|---|---|---|
| Flow Width | / | 10 m~277 m | |
| Imperviousness | 0~100% | 25% | |
| The Manning roughness coefficient | Impervious area Manning’s roughness | 0.015 | 0.011~0.015 |
| Pervious area Manning’s roughness | 0.4 | 0.014~0.8 | |
| Roughness | 0.01~0.013 | 0.01~0.012 | |
| Depth of depression storage | Impervious area depression storage | 1 mm | 0.2 mm~2 mm |
| Pervious area depression storage | 10 mm~11 mm | 2 mm~13 mm | |
| Horton | Maximum infiltration volume | 103.81 mm/h | 50 mm/h~150 mm/h |
| Minimum infiltration volume | 11.44 mm/h | 0~20 mm/h | |
| Drying Time | 2~7 day | 7 day | |
| Event | Rainfall Duration (min) | Rainfall (mm) | NSE | Discharge Relative Error (%) | Flood Peak Relative Error (%) | |
|---|---|---|---|---|---|---|
| Calibrated events | 140 | 21.4 | 0.92 | 0.93 | 2.84 | 2.18 |
| 260 | 25 | 0.91 | 0.92 | 2.91 | 1.54 | |
| 210 | 19.7 | 0.92 | 0.98 | 4.52 | 3.14 | |
| 320 | 17.9 | 0.90 | 0.94 | 4.01 | 3.38 | |
| 200 | 16.8 | 0.91 | 0.93 | 4.12 | 3.55 | |
| Validated events | 540 | 43.3 | 0.78 | 0.911 | 4.01 | 3.56 |
| 840 | 51.9 | 0.72 | 0.885 | 3.85 | 4.35 | |
| 110 | 8.3 | 0.74 | 0.889 | 5.82 | 3.78 | |
| 480 | 23.9 | 0.71 | 0.884 | 5.91 | 4.08 | |
| 650 | 34.6 | 0.73 | 0.867 | 6.88 | 7.08 |
| Rainfall Scenarios | 2y-2h-0.375 | 2y-2h-0.5 | 2y-2h-0.8 | 2y-1.5h-0.375 | 2y-1.5h-0.5 | 2y-1.5h-0.8 | 2y-1h-0.375 | 2y-1h-0.5 | 2y-1h-0.8 |
|---|---|---|---|---|---|---|---|---|---|
| Number of overload pipes | 7 | 7 | 10 | 7 | 7 | 10 | 7 | 7 | 9 |
| Flood duration (hour) | 1.88 | 1.91 | 1.96 | 1.83 | 1.88 | 1.90 | 1.79 | 1.81 | 1.84 |
| Flood volume (m3) | 2651 | 2789 | 2954 | 2552 | 2733 | 2804 | 2412 | 2629 | 2693 |
© 2017 by the authors. Licensee MDPI, Basel, Switzerland. This article is an open access article distributed under the terms and conditions of the Creative Commons Attribution (CC BY) license (http://creativecommons.org/licenses/by/4.0/).
Share and Cite
Zhu, Z.; Chen, X. Evaluating the Effects of Low Impact Development Practices on Urban Flooding under Different Rainfall Intensities. Water 2017, 9, 548. https://doi.org/10.3390/w9070548
Zhu Z, Chen X. Evaluating the Effects of Low Impact Development Practices on Urban Flooding under Different Rainfall Intensities. Water. 2017; 9(7):548. https://doi.org/10.3390/w9070548
Chicago/Turabian StyleZhu, Zhihua, and Xiaohong Chen. 2017. "Evaluating the Effects of Low Impact Development Practices on Urban Flooding under Different Rainfall Intensities" Water 9, no. 7: 548. https://doi.org/10.3390/w9070548
APA StyleZhu, Z., & Chen, X. (2017). Evaluating the Effects of Low Impact Development Practices on Urban Flooding under Different Rainfall Intensities. Water, 9(7), 548. https://doi.org/10.3390/w9070548