Article

Comparing the Spectroscopic and Molecular Characteristics of Different Dissolved Organic Matter Fractions Isolated by Hydrophobic and Anionic Exchange Resins Using Fluorescence Spectroscopy and FT-ICR-MS

Department of Environment and Energy, Sejong University, Seoul 05006, Korea
*
Author to whom correspondence should be addressed.
Water 2017, 9(8), 555; https://doi.org/10.3390/w9080555
Submission received: 13 June 2017 / Revised: 18 July 2017 / Accepted: 20 July 2017 / Published: 25 July 2017

Abstract

:
Despite the environmental significance of dissolved organic matter (DOM), characterizing DOM is still challenging due to its structural complexity and heterogeneity. In this study, three different chemical fractions, including hydrophobic acid (HPOA), transphilic acid (TPIA), and hydrophilic neutral and base (HPIN/B) fractions, were separated from bulk aquatic DOM samples, and their spectral features and the chemical composition at the molecular level were compared using both fluorescence excitation emission matrix-parallel factor analysis (EEM-PARAFAC) and Fourier transform ion cyclotron resonance mass spectrometry (FT-ICR MS). The HPIN/B fraction was distinguished from the two acidic fractions (i.e., HPOA and TPIA) by the EEM-PARAFAC, while the TPIA fraction was discriminated by using the molecular parameters derived from the FT-ICR MS analyses. Statistical comparison suggests that the spectral dissimilarity among the three chemical fractions might result from the acido-basic properties of DOM samples, while the differences in molecular composition were more likely to be affected by the hydrophobicity of the DOM fractions. The non-metric multidimensional scaling map further revealed that the HPOA was the most heterogeneous among the three fractions. The number of overlapping formulas among the three chemical fractions constituted only <5% of all identified formulas, and those between two different fractions ranged from 2.0% to 24.1%, implying relatively homogeneous properties of the individual chemical fractions with respect to molecular composition. Although employing chemical fractionation achieved a lowering of the DOM heterogeneity, prevalent signatures of either acido-basic property or the hydrophobic nature of DOM on the characteristics of three chemical isolated fractions were not found for this study.

1. Introduction

Dissolved organic matter (DOM) plays important roles in aquatic environments as a key component of global and local carbon cycles. Even small changes in its molecular size and/or chemical composition may impose a substantial impact on an array of aquatic biogeochemical processes, such as binding with heavy metals or persistent organic pollutants and nutrient cycling [1,2]. DOM is a highly complex mixture of several thousands of polyfunctional, polyelectrolytic, and polydisperse molecules [3]. Characterizing the chemical and molecular composition of DOM can thus provide essential information for a complete picture of global carbon and nutrient cycles, aiding a better understanding of the environmental roles of organic carbon in aquatic systems. However, characterizing DOM is still challenging due to its complex and heterogeneous nature.
Chemical fractionation of DOM may reduce its inherent structural complexity. This leads to a better understanding of sources, transport, and the environmental behaviors of DOM in aquatic environments, because relatively homogeneous (or well-characterized) structures can be matched with specific chemical and molecular fingerprints more easily than their complex and heterogeneous counterparts [4]. Thus, there is no doubt that separating relatively homogeneous fractions from bulk DOM samples with respect to the chemical characteristics/composition would provide great benefits for DOM studies. In practice, this approach has been widely used as a pre-treatment method prior to further characterization of DOM structures [5,6,7]. The most common technique used to isolate chemically homogeneous DOM structures is via a sequence of fractionation through different types of resins with respect to hydrophobicity (or polarity). Chemical fractionation has been conducted mainly with a non-ionic resin followed by a cation-exchange resin [5,8,9,10].
Both fluorescence spectroscopy and excitation emission matrix-parallel factor analysis (EEM-PARAFAC) have been widely employed to probe the optical properties of DOM and to identify different fluorescent components from bulk samples [11,12,13,14]. The practical usefulness of EEM-PARAFAC has been tested successfully for many different environmental samples, such as wastewater, rivers, groundwater, lakes, rainwater, and oceans [15,16,17,18]. It is now considered a popular, powerful, and standard technique for DOM characterization. However, there are unavoidable limitations in probing all DOM constituents due to the significant presence of non-fluorescent structures [19]. Recently, high resolution Fourier transform ion cyclotron resonance mass spectrometry (FT-ICR MS) has emerged as a reliable tool for the in-depth molecular characterization of DOM, which covers a massive number of the molecular compounds missed by fluorescence spectroscopy. It can determine accurate mass to charge (m/z) ratios by assigning molecular formulas to the thousands of peaks detected in the mass spectrum of a complex mixture of DOM [20,21,22].
Using the chemical fractionation of DOM samples in tandem with the above-mentioned advanced analytical tools can provide valuable information on the complex composition of DOM. For example, He and Hur [5] applied fluorescence spectroscopy to the chemical fractions of surface water samples separated using the resin fractionation method in order to evaluate the conservative nature of the individually identified fluorescent components. Meanwhile, there were two recent reports of combining chemical fractionation with FT-ICR MS to further characterize refinery-processed and reservoir water samples [6,23]. These studies found significant differences in chemically fractionated DOM in terms of their fluorescent features and molecular composition, highlighting the advantages of utilizing multiple tools simultaneously to unravel the complexity and heterogeneity of DOM.
In this study, bulk surface water DOM samples were chemically separated into three different sub-groups through resin adsorbents, which included hydrophobic acids (HPOA), transphilic acids (TPIA), and hydrophilic neutrals and bases (HPIN/B). Resin fractionation has long been used for DOM characterization, and the three fractions can all be considered typical DOM chemical fractions comparable with those reported in prior DOM studies [5,10,24,25]. The main objectives of this study were (1) to compare different chemical fractions of aquatic DOM samples using fluorescence spectroscopy and FT-ICR MS, and (2) to identify the unique structural and chemical compositions as surrogate characteristics to distinguish one fraction from another. This effort could broaden the current knowledge about DOM composition, in turn extending the applicability of EEM-PARAFAC and FT-ICR MS to many other DOM studies. To the best knowledge of the authors, this is the first study to characterize different chemical sub-fractions of aquatic DOM samples using both fluorescence spectroscopy and FT-ICR MS.

2. Material and Methods

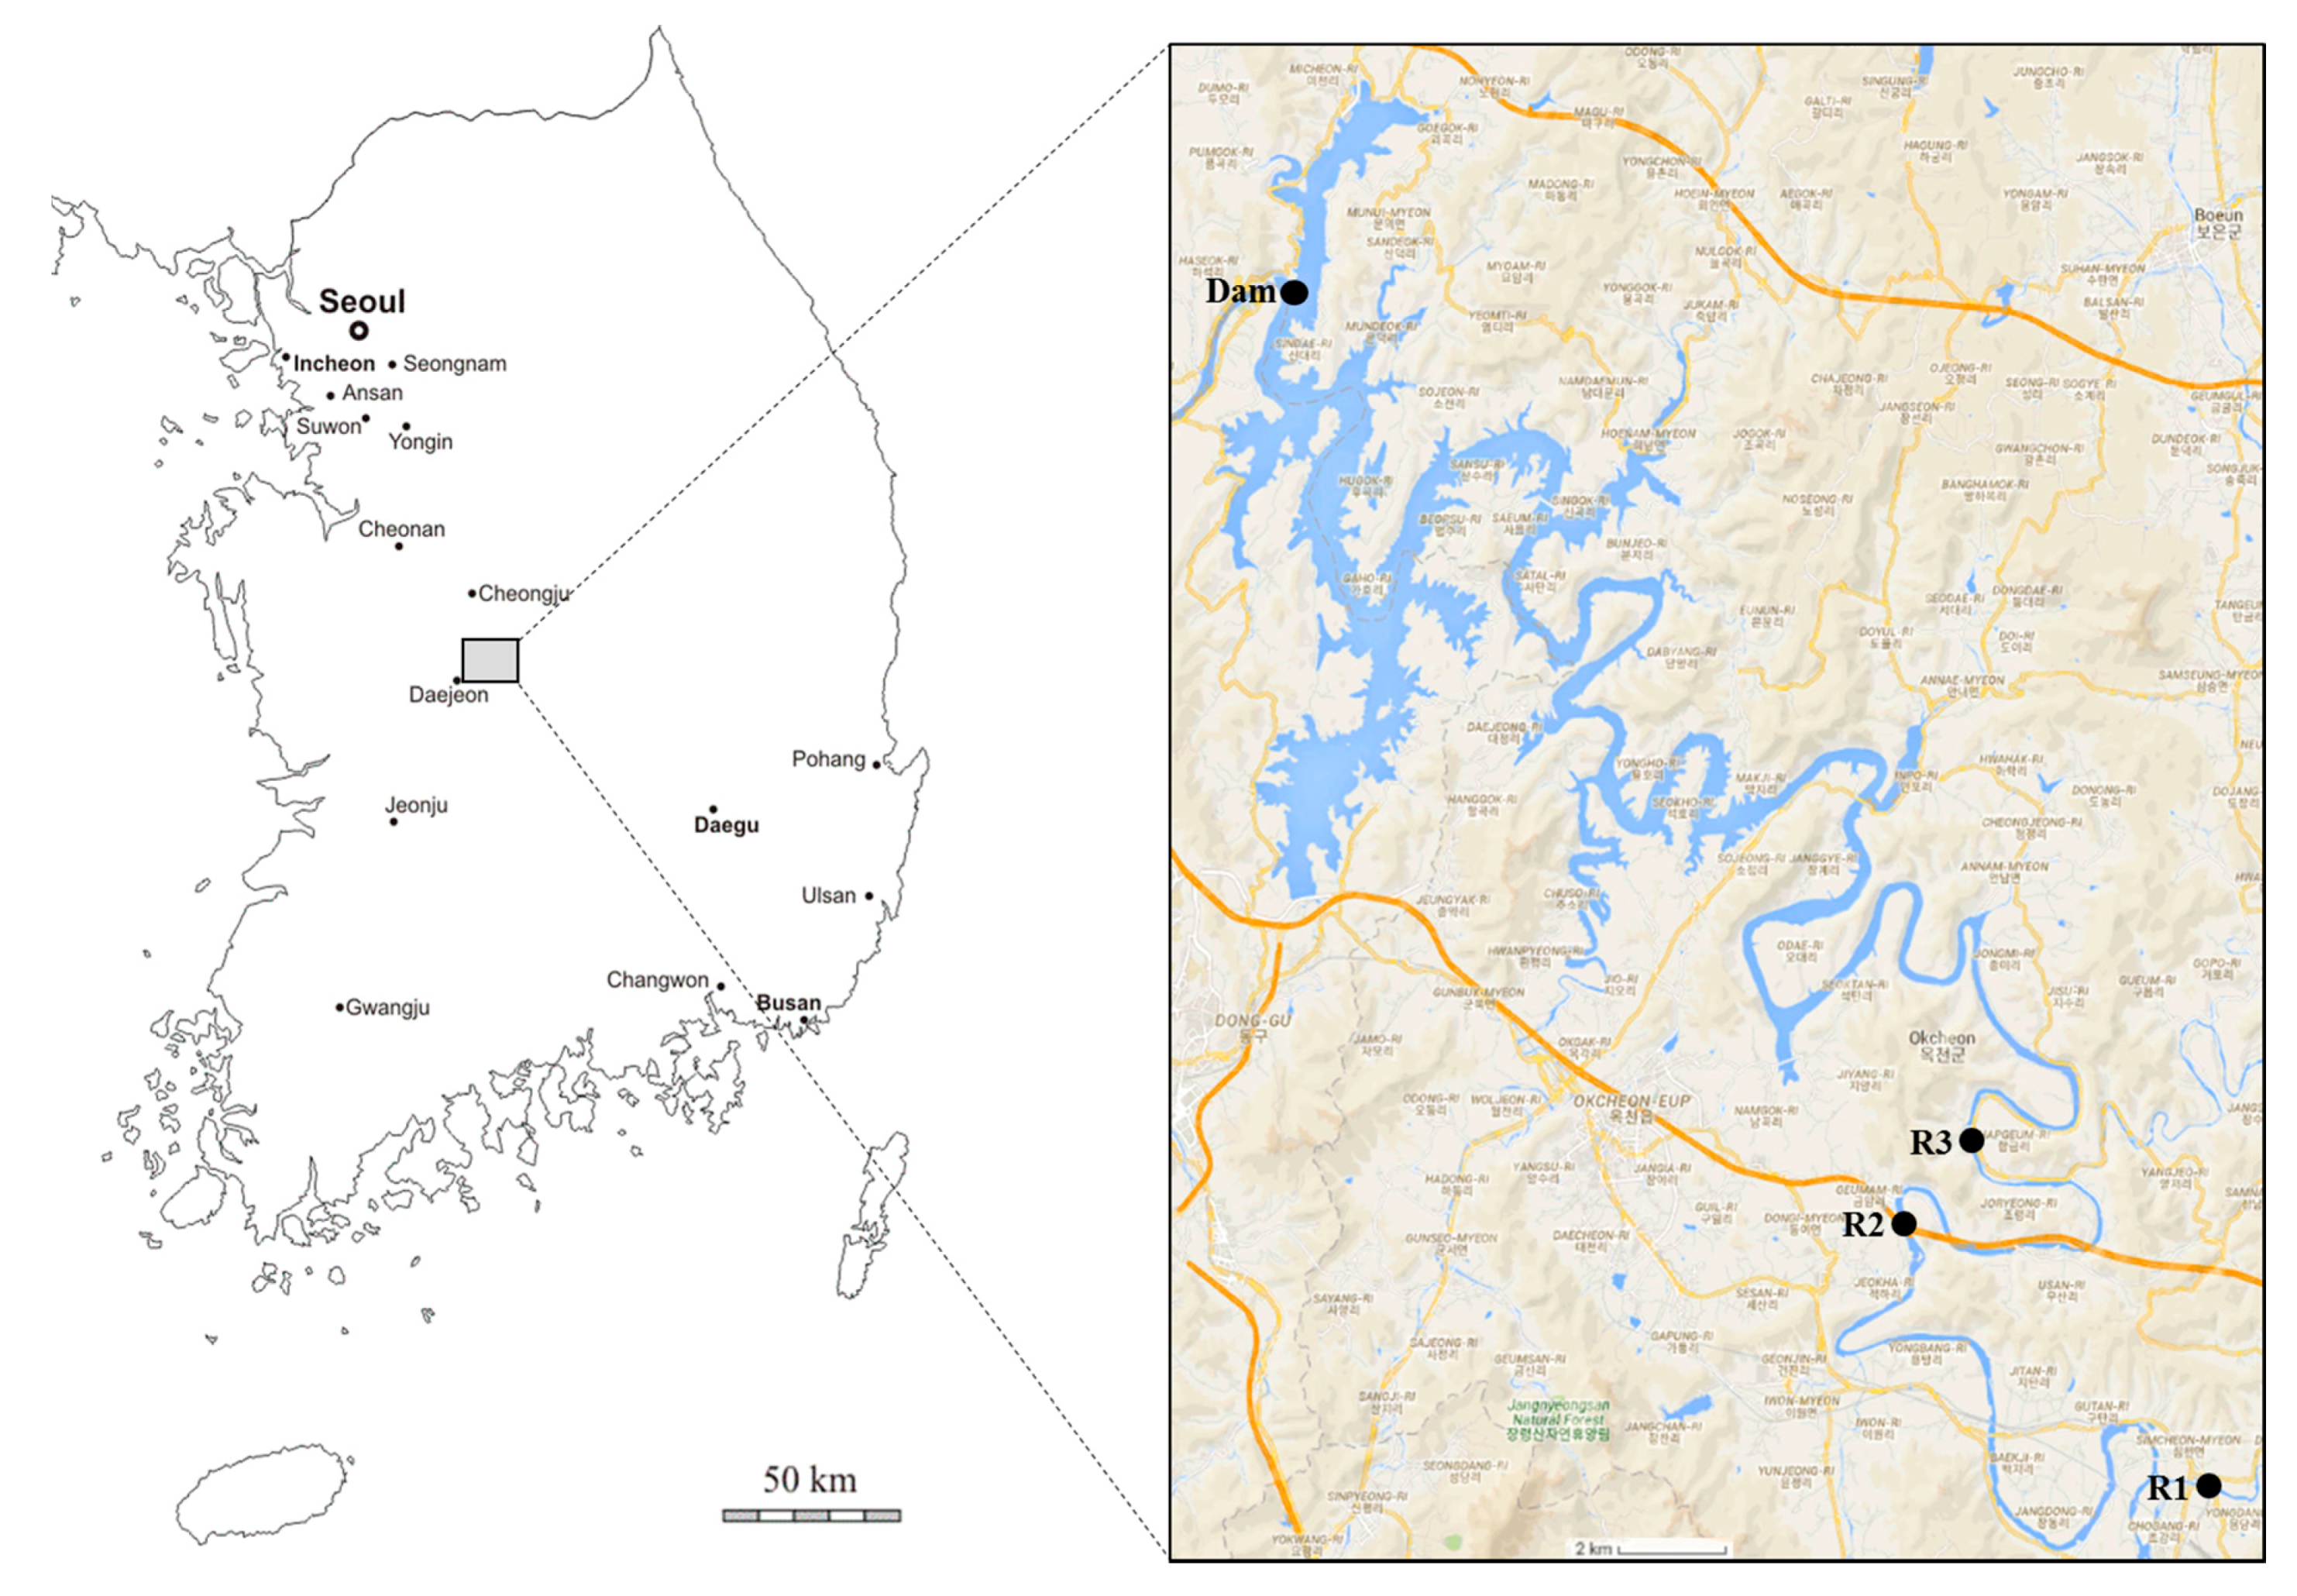
2.1. Study Area and Sampling

The Daecheong Reservoir spans an area of over 72.8 km2, runs for a length of 80 km, and has a maximum water storage volume of 1.5 billion tons. The reservoir is the third largest lake in Korea (Figure 1). It is used as a source of drinking water as well as for irrigation, hydropower generation, flood control, and fisheries [26]. The catchment area is 4166 km2, the land use of which consists of forest and hilly areas (74.5%), agricultural land such as rice paddies and other crops (16.3%), and urban areas (9.2%) [27]. Upstream, the river is joined by five major tributaries. The reservoir exhibits a dendritic drainage pattern (Figure 1). The catchment receives an annual average rainfall of 1400 mm, of which more than 50% is recorded during the summer monsoon months from July to September.
Water samples were collected at six different locations, including one dam site at three different depths (0, 20, and 40 m) and three upstream sites, in November 2016 (Supplementary Materials Table S1). The samples were filtered through a pre-washed 0.45 mm membrane filter (cellulose acetate, Toyo Roshi Kaisha, Ltd., Tokyo, Japan) for further fractionation and analyses.

2.2. Resin Fractionation

Resin fractionation was carried out on the filtered samples based on a modification of Kim and Dempsey’s method [10], which produced three different types of chemical fractions. Before fractionation, the pH of the samples was adjusted to ~2 by adding a 6 N HCl solution. The samples were then passed through a non-ionic DAX-8 resin (Amberlite, 20–60 mesh, Supelco, Sigma-Aldrich, St Louis, MO, USA). The retained fraction (hydrophobic acid fraction, or HPOA) was subsequently eluted in the reverse direction with a 0.1 M NaOH solution. The eluted fraction was subsequently passed through a XAD-4 resin (Amberlite, 20–60 mesh, Supelco, Sigma-Aldrich, St Louis, MO, USA), on which the transphilic acid fraction (TPIA) was absorbed. The non-retained fraction, after pH adjustment to ~8.0, was further passed through an IRA-67 resin (Amberlite, 500–750 μm, Supelco, Sigma-Aldrich, St Louis, MO, USA) to obtain a hydrophilic neutral and base fraction (HPIN/B) as the eluted fraction [10]. The HPOA and TPIA fractions were passed through a cation exchange resin (Dowex 50WX8-100, Supelco, Sigma-Aldrich, St Louis, MO, USA) to remove potential salts. To minimize contamination, all the resins were rigorously cleaned before use. The DAX-8 and XAD-4 resins were kept in a 0.1 N NaOH solution for five days, washed with distilled water, and cleaned using Soxhlet extraction with different solvents (i.e., methanol, diethyl ether, acetonitrile, methanol) for 24 h. The resins were rinsed successively by distilled water and 0.1 N NaOH, and preconditioned in 0.1 N HCl. The IRA-67 resin was washed sequentially with a 1 N NaOH solution, distilled water, a 1 N HCl solution, and then again with distilled water and a 1 N NaOH solution until the pH reached ~7.0. Blank samples for DAX-8, XAD-4, and IRA were also collected from the fractionation experiments.

2.3. Measurements of Dissolved Organic Carbon, Absorption, and Fluorescence Spectra

Dissolved organic carbon (DOC) concentrations were measured using a Shimadzu V-CPH TOC (Shimadzu, Kyoto, Japan) analyzer with a relative precision of <3% [14]. Absorption spectra were scanned from 200 to 800 nm at 1 nm intervals using an ultraviolet-visible (UV-vis) spectrometer (Shimadzu UV-1300, Kyoto, Japan). Specific UV absorbance (SUVA254), a rough measure of humic substance (HS) aromaticity, was calculated based on the DOC concentration–normalized UV absorption coefficient at 254 nm, multiplied by a factor of 100. Fluorescence EEMs were scanned on a luminescence spectrometer (Hitachi F7000, Tokyo, Japan) with the excitation wavelengths (Ex) stepping from 220 to 500 nm at 5 nm increments, and the emission wavelengths (Em) from 280 to 550 nm at 1 nm intervals. Both slit widths were set to 10 nm, and the scanning speed was 12,000 nm/min. Blank subtraction and Raman peak normalization were performed following the procedures proposed by Murphy et al. [28].
Before the EEM measurements, the samples were sufficiently diluted with ultra-pure water (ThermoFisher Scientific, Waltham, MA, USA), until the UV absorption coefficient at 254 nm was below 0.05 cm−1 [29], which made inner-filter correction unnecessary. The pH was set around 3.0 for all samples in this study to minimize potential interference from different pH conditions [5]. A total of 48 EEMs were collected for PARAFAC modeling. The procedure is well described in the protocol suggested by Stedmon and Bro [30]. The modeling was carried out in MATLAB R2013b (Mathworks, Natick, MA, USA) with the DOMFluor toolbox [30] (Stedmon and Bro, http://www.models.life.ku.dk). The maximum fluorescence intensities (Fmax) of identified components were used to represent their relative concentrations.
The fluorescence index (FI), humification index (HIX), and biological index (BIX) were all calculated as fluorescence indicators for the samples. The FI, a proxy of aquatic HS sources (i.e., microbial versus terrestrial sources), was measured using the ratio of the emission intensity at 450 nm to that at 500 nm at an Ex of 370 nm [31]. The humification index (HIX), an indicator of the degree of DOM humification, was estimated using the ratio of the areas under the emission spectra over 435–480 nm to 300–345 nm at an Ex of 255 nm [32]. The biological index (BIX), an index of recent autochthonous and biological contribution, was calculated by the ratio of the fluorescence intensity at an Em of 380 nm to 430 nm at 310 nm (Ex) [33].

2.4. FT-ICR MS Analysis

Solid phase extraction (SPE) was performed following the procedure previously described in He et al. [18]. After rigorously washing the SPE cartridge (Agilent Bond Elut PPL, Santa Clara, CA, USA), the acidified samples (pH = 2) were discharged through the cartridge at a flow rate of 10 mL/min and then eluted with 6 mL of methanol. The same steps were repeated for the blanks. All the samples and blanks were immediately stored at −20 °C until the FT-ICR MS analysis was conducted.
Molecular analysis for DOM was made using a 15-T FT-ICR MS interfaced with an Apollo II electrospray ionization source (ESI, Bruker Daltonik GmbH, Leipzig, Germany), located at the Korea Basic Science Institute (KBSI) in Ochang (South Korea). The samples in methanol were injected into the electrospray ionization (ESI) source at 2 µL/min, and analyzed in negative mode with a m/z range of 160–1000. The experimental parameters were set to +5.0 kV for capillary voltage, 180 °C for drying gas temperature, 4.0 L/min for flow rate, and −20 V for skimmer voltage. Ions were accumulated in an argon-filled collision cell for one second and then transferred to the ICR cell, in which 100 transient scans (collected with a 4 MWord time domain) were co-added. An average resolving power (m/∆m50%) of >400,000 was routinely achieved at the m/z of ~400. Solvent blanks were run before and after each sample to clean up the ion source and to avoid cross-contamination and/or a carryover from the precedent samples. All ions were singly charged, as confirmed by the isotopic spacing pattern (1.00335 daltons) of the corresponding 12Cn and 13C12Cn−1 mass peaks. The spectra were examined in the mass range of m/z 200–600. Only the peaks with an S/N ratio of ≥4 were taken into account for this study.
Molecular formula assignments were made based on several guidelines suggested by Koch et al. (2008) [21]. The assigned formulas were further examined using the van Krevelen diagram [34] and modified aromatic index (AImod = (1 + C-0.5O-S-0.5H)/(C-0.5O-S-N-P) [35]. They were categorized into eight different compound classes. The selected criteria of the compound classes are listed in Table S2. Several indices, including intensity weighted average (wa) molecular masses, elemental ratios, AImod, and DBE, were also calculated from the normalized peak intensities.

2.5. Statistical Analysis

In order to identify the unique characteristics of individual DOM chemical fractions, non-metric multidimensional scaling (NMDS) was applied for all the measured samples using the parameters presented in Table 2. Missing values were replaced by the average values presented in Table 2. NMDS was performed with the statistical programming software R (v3.3.2, Bell Labs, Murray Hill, NJ, USA) and using the “metaMDS” function from the package Vegan (Vegan 2.4-1, http://r-forge.r-project.org/projects/vegan/).

3. Results and Discussion

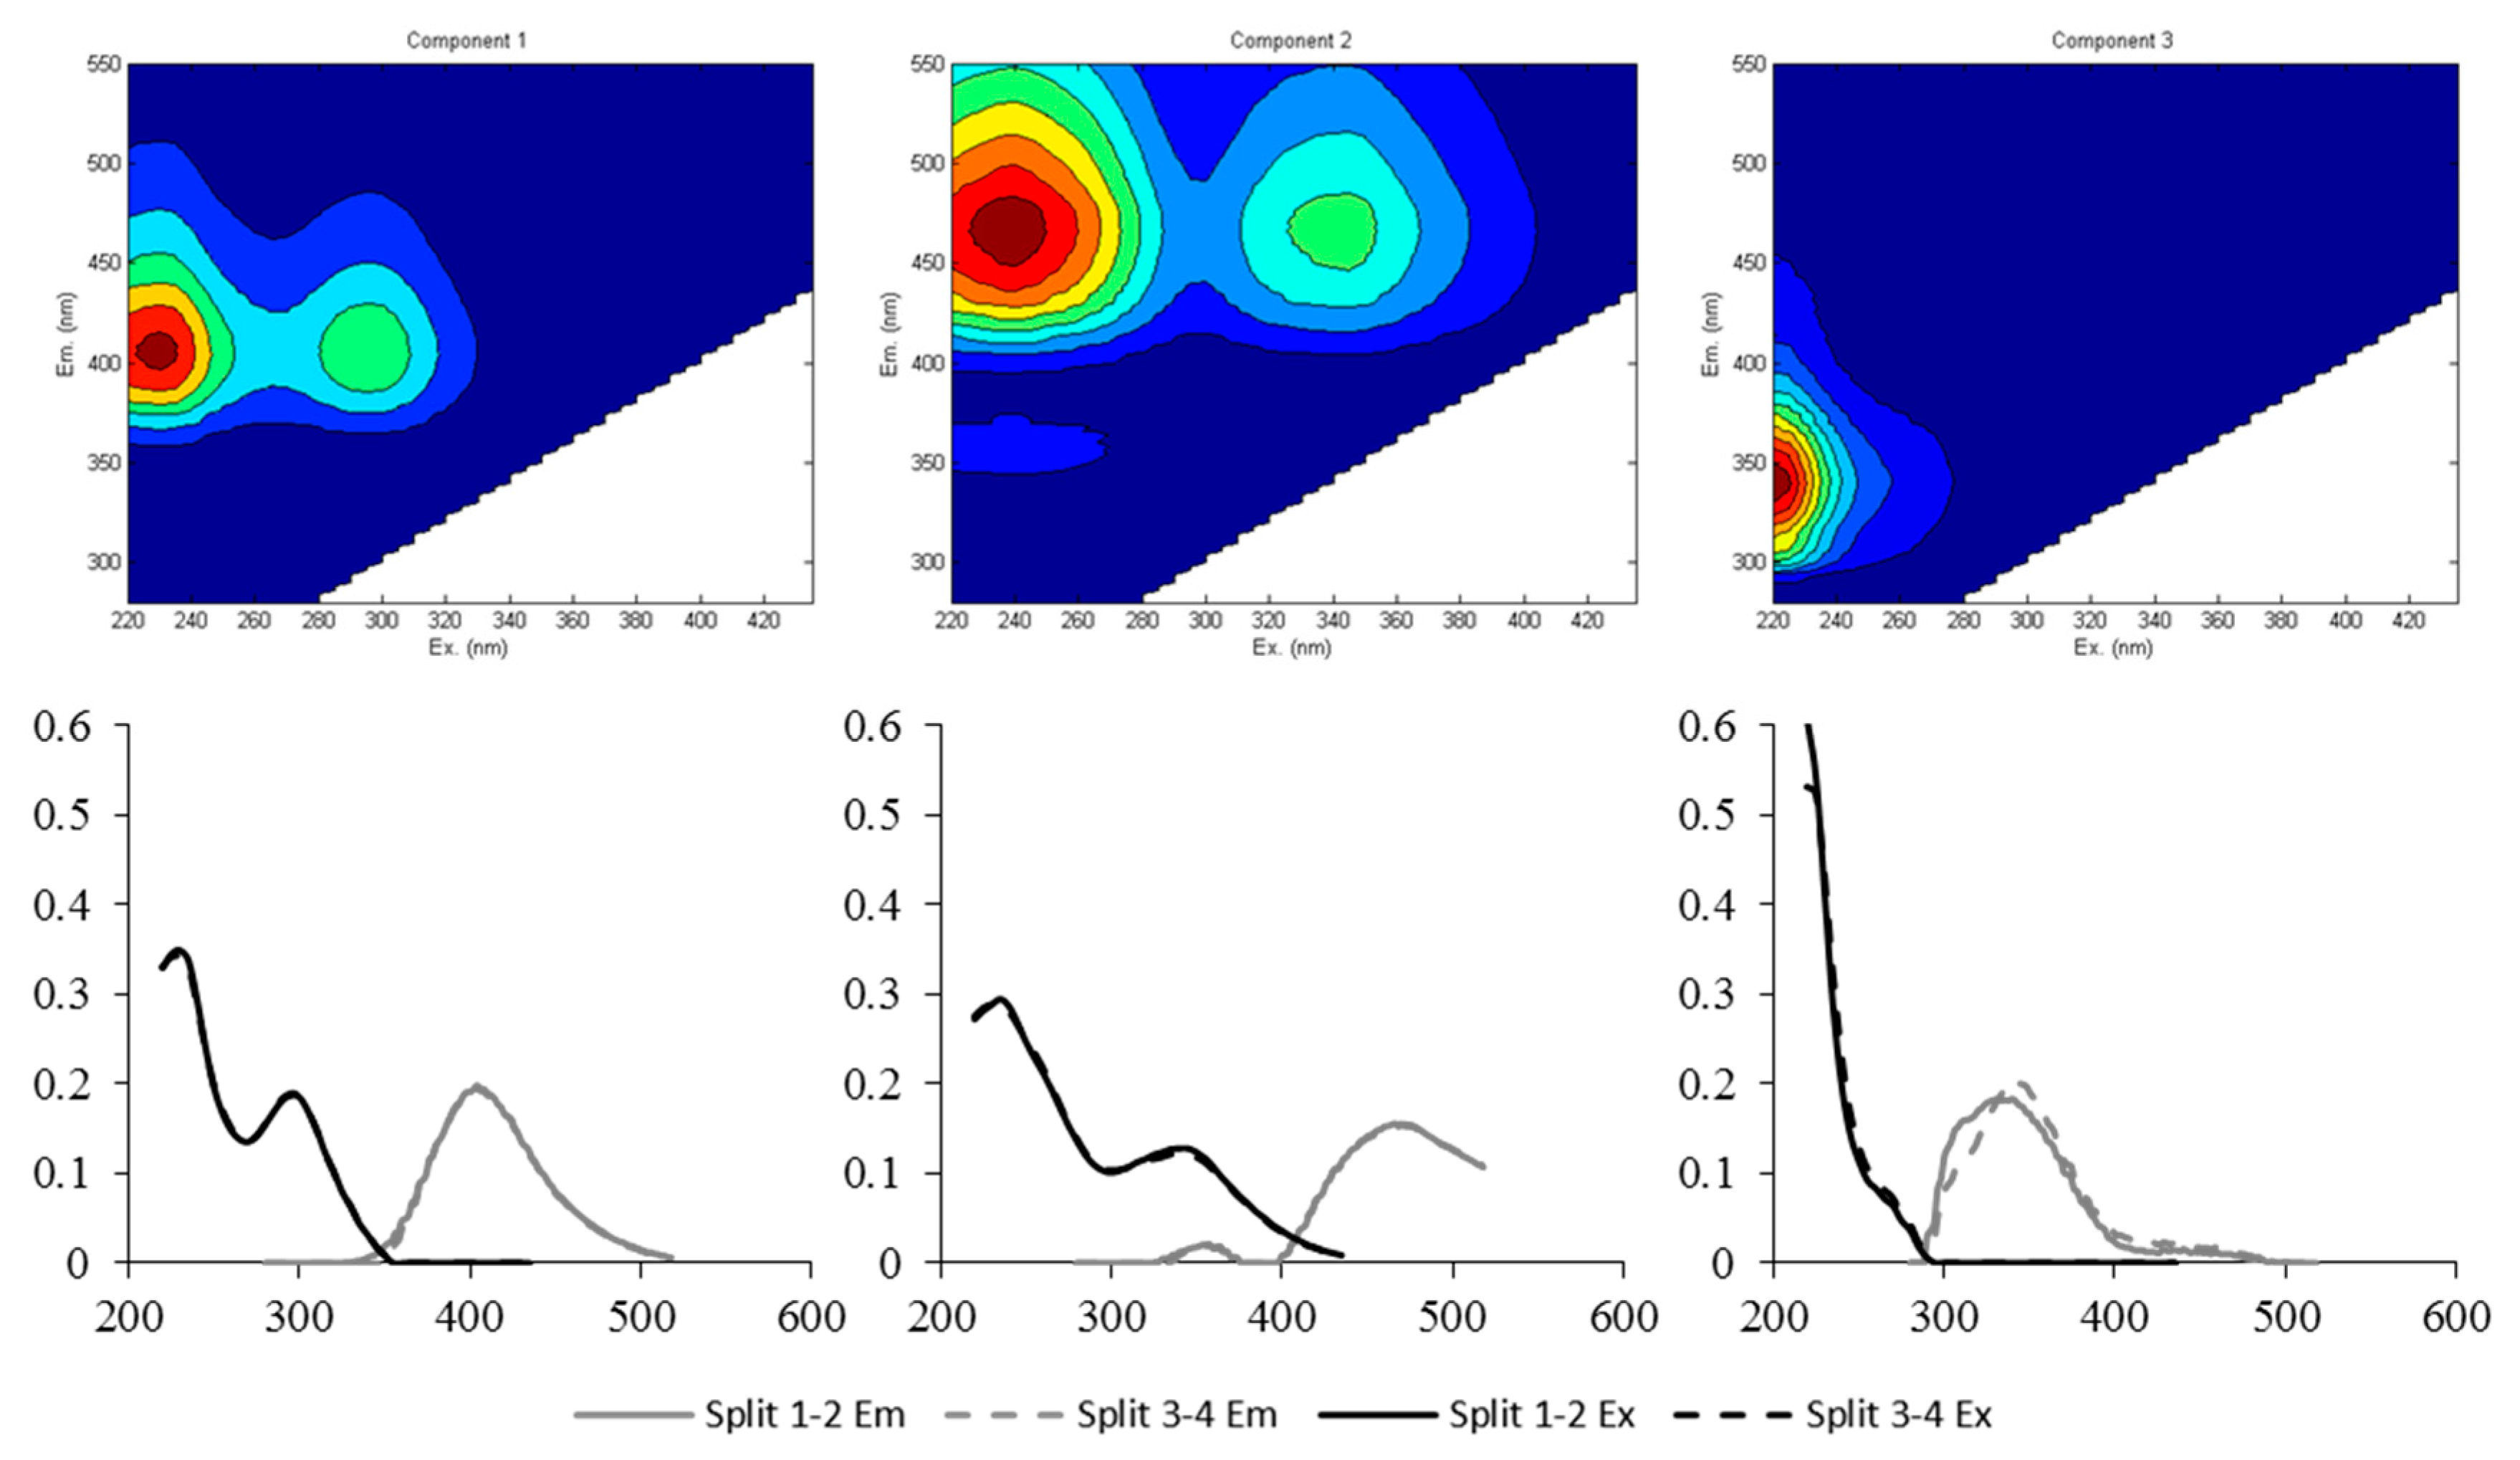
3.1. Identification of Fluorescent Components from EEM-PARAFAC

The number of different fluorescent DOM (FDOM) components was determined based on split-half validation and Tucker’s congruence coefficients (>0.95). Three components were finally identified (Figure 2). Component 1 (C1) had the Ex/Em maxima at 230–295/404 nm, while component 2 (C2) exhibited the peak at 240–345/466 nm (Ex/Em). The maximum peak of component 3 (C3) appeared at 220/340 nm (Ex/Em). All the identified components were consistent with those previously reported, and well-matched with the Open Fluor database with similarity scores of >0.96 [18,36,37,38]. For this study, C1 and C2 were both assigned to terrestrial humic-like components, but the possible transformation of the terrestrial humic-like source could be taken into account for C1 [36,37]. Lee et al. [39] identified similar FDOM components, and they reported the tendency of a preferential composition of smaller molecular-sized substances for humic-like FDOM components, with the peak shifted at shorter emission wavelengths. In some previous studies, these two humic-like components (C1 and C2) have been assigned to fulvic-like and humic-like components, respectively [40,41]. Meanwhile, C3 resembled protein-like or tryptophan-like components [18].

3.2. Fluorescence Properties of Three Different Chemical Fractions

The relative abundances in FDOM components, expressed by the ratio of each component in Fmax over the sum of the Fmax values of the three components (i.e., %C1, %C2, and %C3), showed similar trends among the different chemical fractions, in particular between the fractions of HPOA and TPIA where the average values were nearly the same (Table 1, Figure S1). Irrespective of the chemical fractions, C3 was present as the main component, followed by C1 and C2, with average relative abundances of 53.0 ± 6.8%, 57.0 ± 11.3%, and 72.0 ± 2.0% for the HPOA, TPIA, and HPIN/B fractions, respectively. The distribution of C1 ranged from 14.4% to 35.3% in the three chemical fractions, with the lowest abundance shown for the HPIN/B fraction. C2 constituted the lowest portions, ranging from 3.6% to 21.5%. The highest and the lowest average values of C2 were observed for HPOA (16.8 ± 3.3%) and HPIN/B (6.3 ± 1.0%), respectively. It was interesting to observe that the most prominent component in HPOA was not either of the two humic-like components (i.e., C1 and C2), but the protein-like component (C3). Thus, the relatively hydrophobic acid fractions extracted from aquatic DOM samples in this study are likely to be associated with the humified materials originating from autochthonous or microbial sources [42]. Meanwhile, the possibility cannot be ruled out that polyphenol-like substances may make major contributions to protein-like components (C3). Polyphenols are derived from lignin and tannins (i.e., allochthonous sources) and they are similar to tyrosine and tryptophan in their fluorescence EEMs [43,44]. High contributions of protein-like components have also been observed in lignin samples from freshwater [44].
The relative ratios of different FDOM components (i.e., C1/C2, C1/C3, and C2/C3) were also calculated and compared for the three chemical fractions. The C1/C2 ratios tended to increase at lower degrees in the hydrophobicity of the chemical fractions with the values of 1.8 ± 0.2, 2.6 ± 0.6, and 3.6 ± 0.7 for HPOA, TPIA, and HPIN/B, respectively (Table 1). In contrast, the ratios of C2/C3 exhibited the opposite trend with respect to the fraction’s hydrophobicity. The C1/C3 ratios presented similar values between the two acidic fractions (i.e., ~0.6) and the lower value was exhibited for HPIN/B (Table 1), suggesting that the FDOM ratio (i.e., C1/C3) could be used for discriminating the acidic properties of aquatic DOM (p = 0.016 between TPIA and HPIN/B, and 0.004 between HPOA and HPIN/B based on the student t-test; Table 2).
The DOM samples with algal and/or microbial sources typically exhibit relatively high ranges of the FI and BIX values (e.g., FI ~ 1.8 and BIX > 1) [31,32]. Our results of the relatively high values of the two indices in the HPIN/B fraction indicate that algal/microbial sources may be dominantly present in the fraction (Table 1). As expected, the average HIX exhibited higher values in more hydrophobic chemical fractions in the order of HPOA > TPIA > HPIN/B, although no statistical difference was found between HPOA and TPIA (p = 0.06 based on the student t-test) (Table 2, Figure S1).

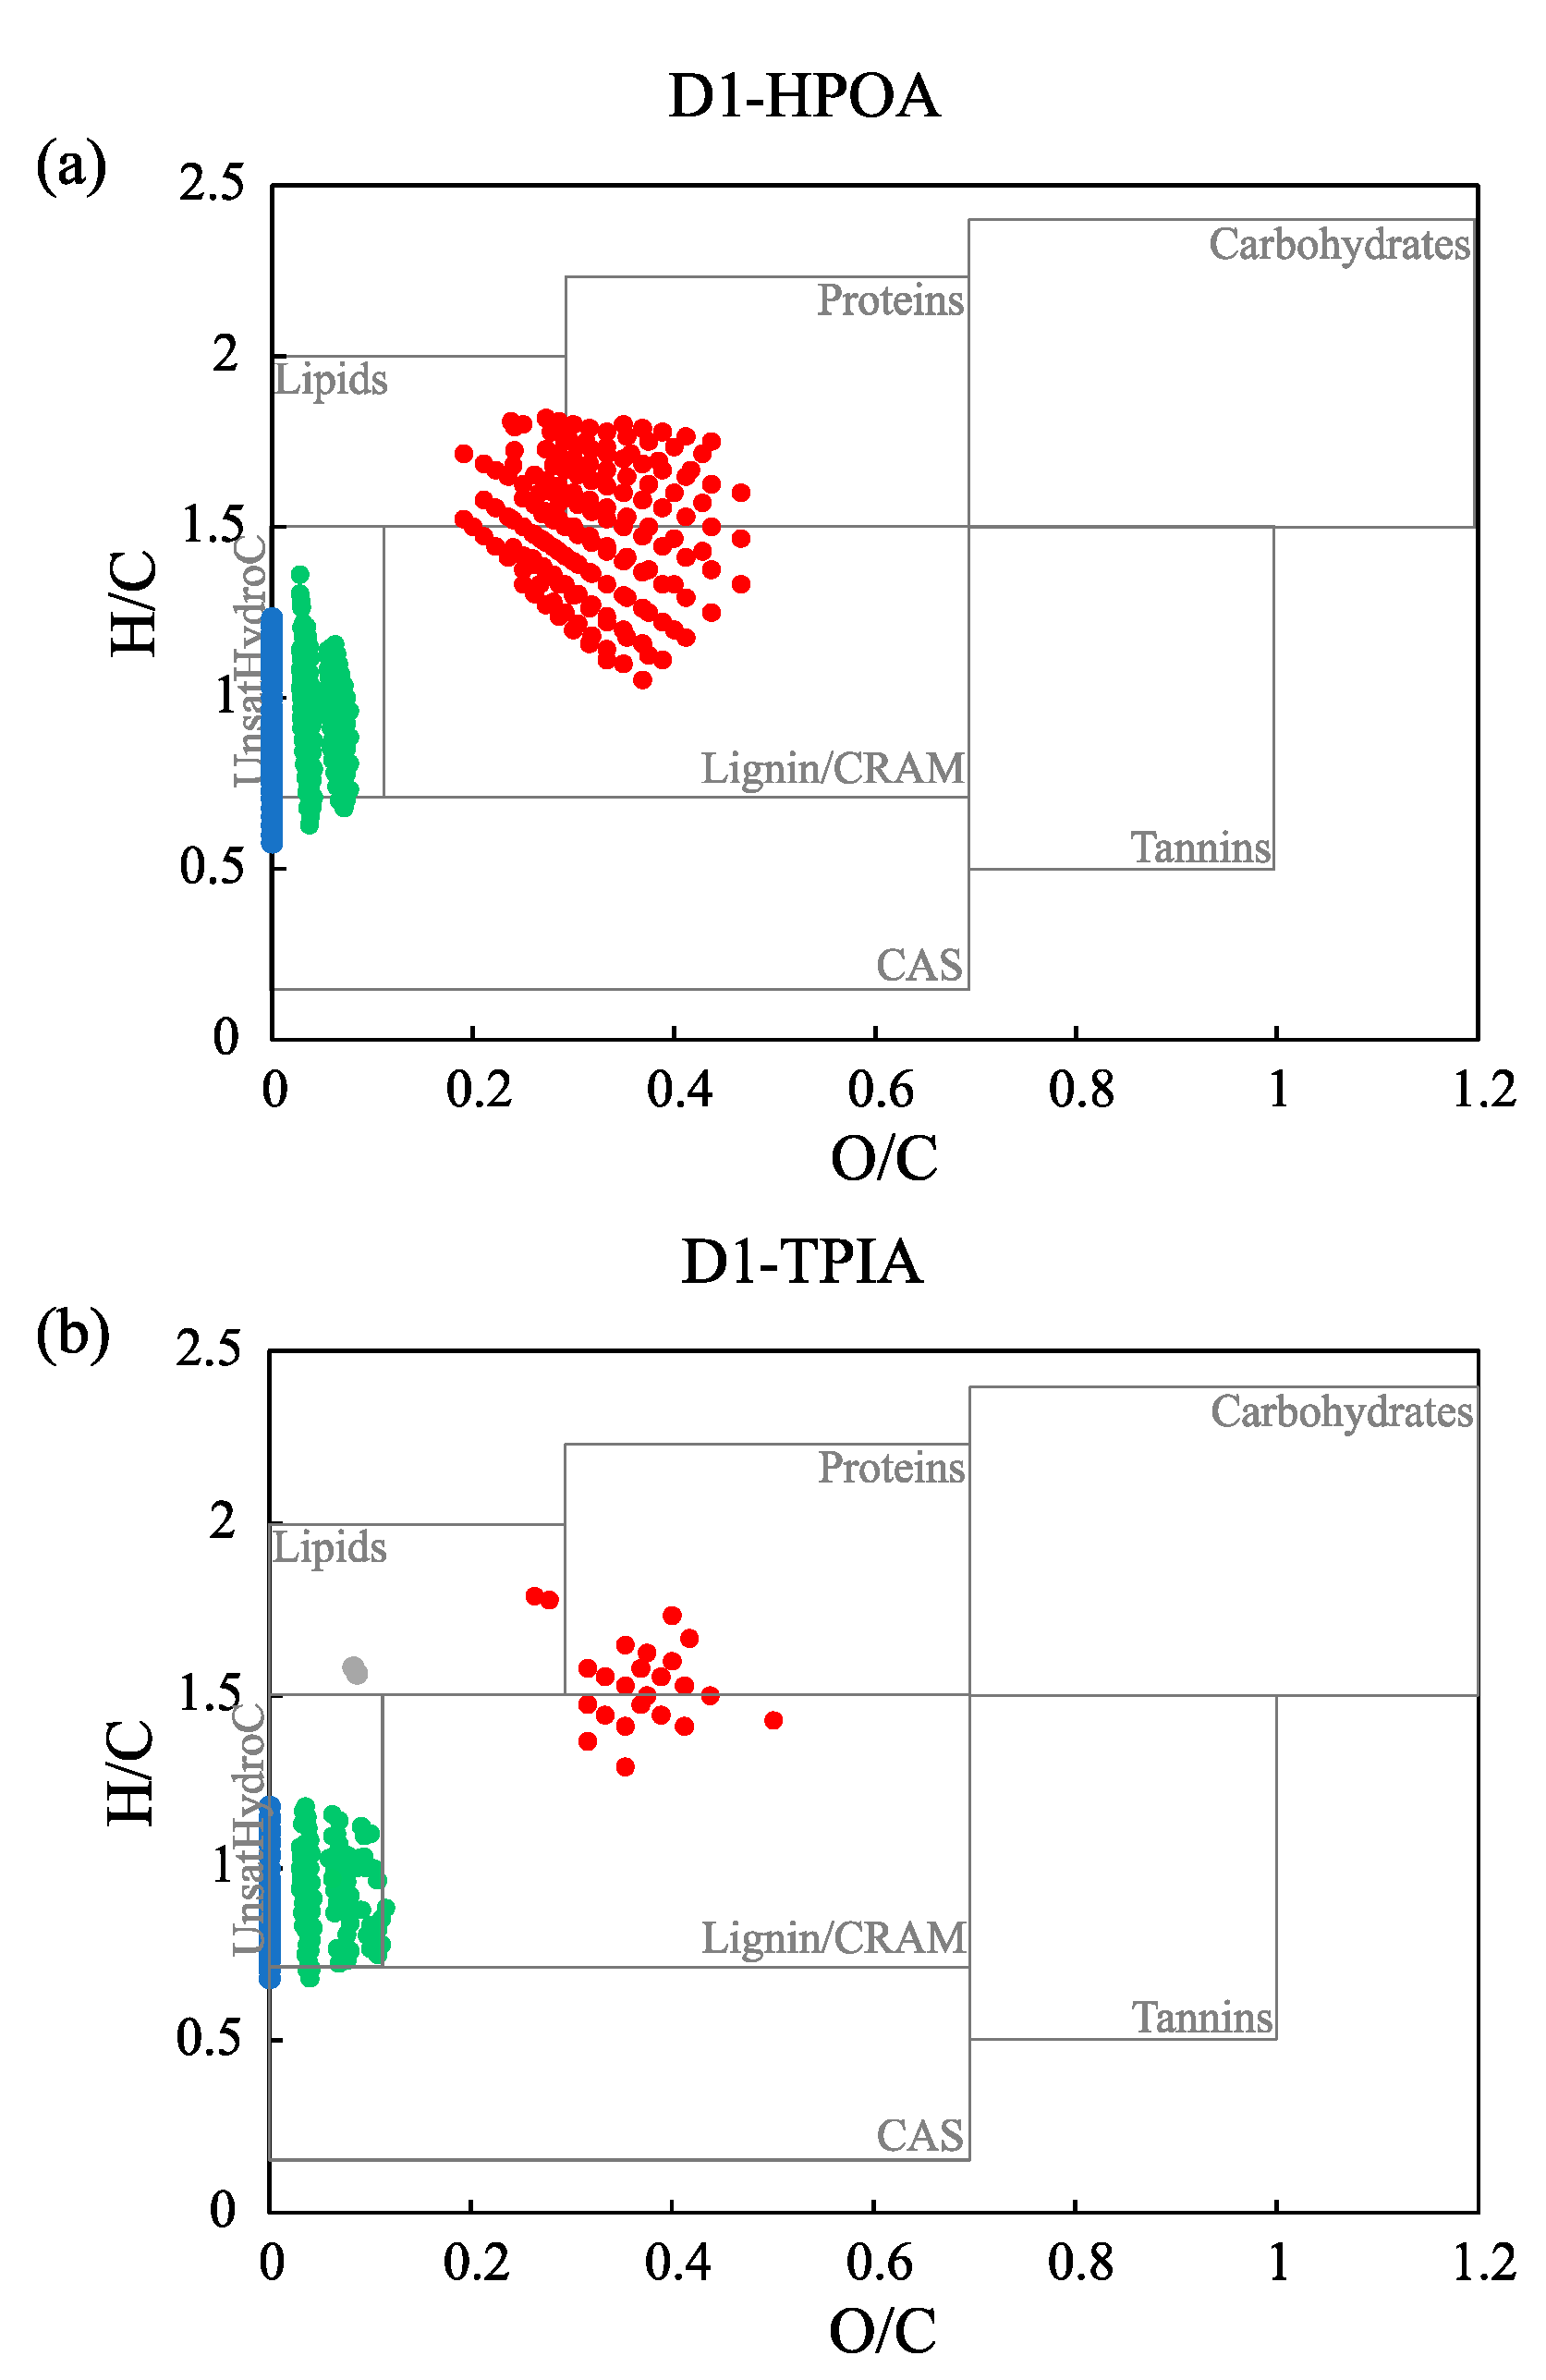
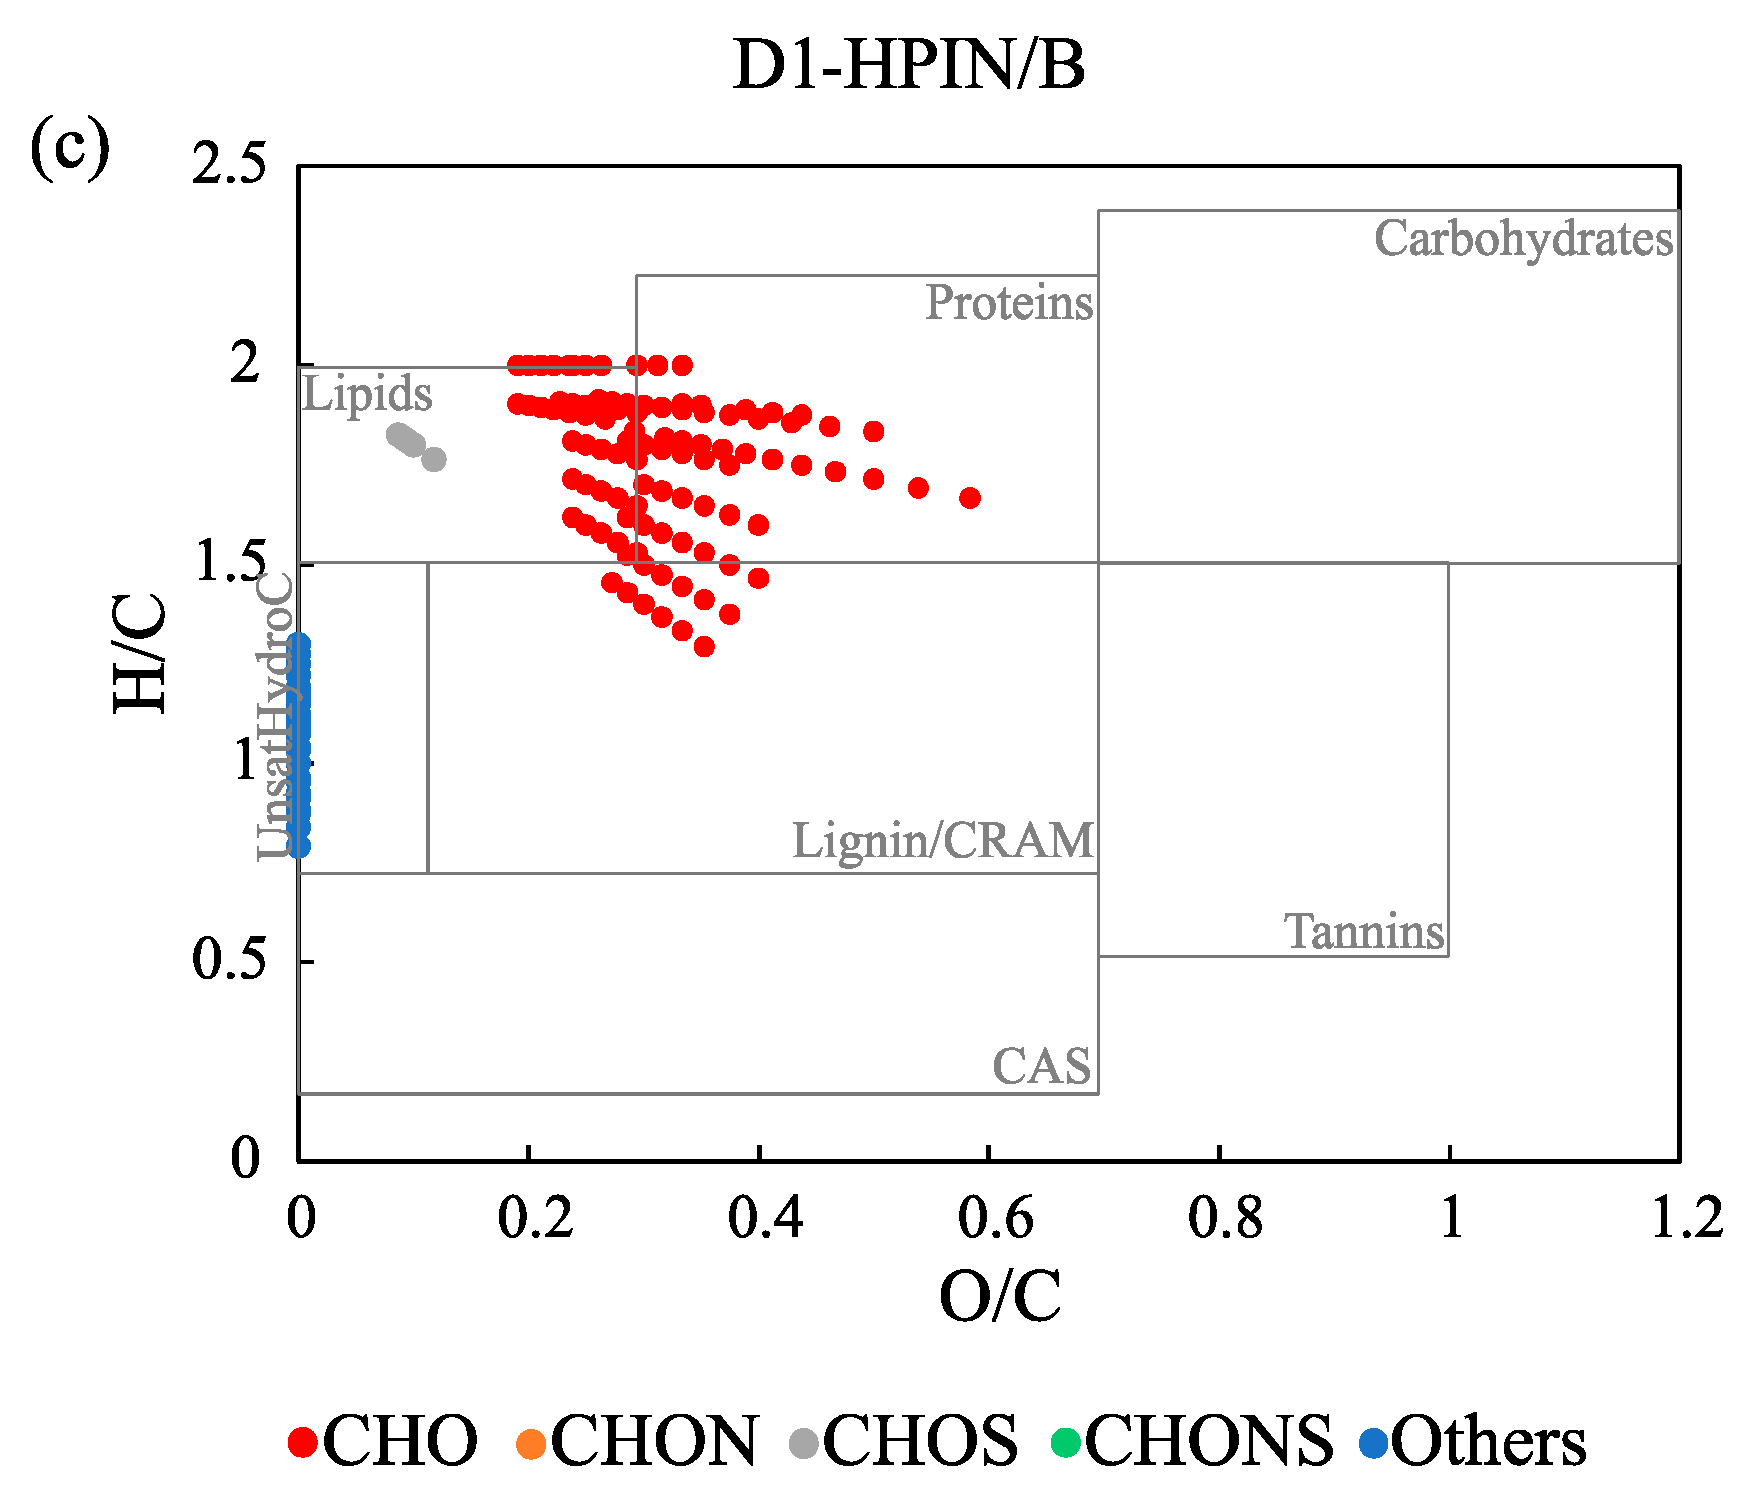
3.3. Comparison of Molecular Composition of the Three Chemical Fractions

The average values of 27 selected molecular properties are displayed for each chemical fraction in Table 1. The details are described in Table S3. The HPOA fraction, except for sample D1, showed relatively low numbers of formulas (e.g., an average value of 82 ± 145). This could be ascribed to instrumental artifacts. One of the prevailing problems in FT-ICR MS analysis is the formation of adducts and/or multimers during ionization [22,45]. Although adduct formation is a more common phenomenon in the positive versus the negative ionization mode, it can also occur in the negative mode, especially when samples contain significant amounts of inorganic salts and oxyanions [46]. These adducts may interfere with ionization in the electrospray process, resulting in a low-ion intensity of the analyte and contributing to low molecular detection [45,47]. In this study, however, salts were sufficiently removed from the HPOA and TPIA fractions, since they were passed through a cation-exchange resin after extraction. Therefore, this possibility can be excluded. Another possibility, but one less frequently observed, is the effect of samples’ hydrophobic nature on ionization efficiency. Typically, hydrophobic compounds generate a higher level of ionization efficiency than their hydrophilic counterparts because more hydrophobic compounds tend to increase ion abundance in the mass spectrum [48,49]. However, the opposite behavior has also been reported for hydrophobic peptides/proteins, especially those with aliphatic structures, due to their inherent insolubility in the buffers with electrospray [50,51,52].
Two distinctive trends were observed for the average distribution in the elemental composition (e.g., C, H, O, N and, S) and the average elemental ratios among the three different chemical fractions. The HPOA and the HPIN/B fractions showed greater numbers of H (e.g., 33.8 ± 5.0 and 30.1 ± 2.3, respectively) relative to C, resulting in the relatively high H/C ratios, than the TPIA fraction (average H/C ratio = 1.13 ± 0.02) showed. The two fractions also presented higher values of O (e.g., 4.39 ± 1.40 and 4.17 ± 0.54, respectively) compared to the TPIA fraction, with a value of 2.92 ± 0.39. However, there was no statistical difference in the O/C ratios for the pair of HPOA versus TPIA (Table 2). Regarding the composition of N and S, the higher values were found in the TPIA fraction, with values of 0.61 ± 0.02 for both, while 0.37 ± 0.33 and 0.25 ± 0.26 were shown, respectively, for the HPOA fraction, and 0.15 ± 0.04 and 0.27 ± 0.09 for the HPIN/B fraction. The relatively high number of N and S in the TPIA fraction implies that the base and neutral compounds could be substantially present for even the acidic fraction. In fact, N and S are typically enriched in amines and/or proteins and/or surfactants in aquatic DOM samples [6,9]. The variations of the N/C and H/C ratios were very limited among the three chemical fractions, ranging from 0.01 to 0.02 for both ratios.
The three chemical fractions exhibited average DBE and AImod values ranging from 6.8 ± 1.9 to 12.3 ± 0.5, and from 0.2 ± 0.1 to 0.4 ± 0.0, respectively, with the highest values observed for the TPIA fraction. Considering that the AImod values of <0.5 correspond to aliphatic and olefinic compounds [53], aliphatic structures appear to be prevalent in all the fractions. As such, the low values of DBE (i.e., <10) suggest that aromatic compounds may not be enriched in the HPOA and HPIN/B fractions. Such relatively low DBE values have also been reported for the HPOA fraction in other studies [6,7]. Although the TPIA fraction showed the highest DBE (12.3) among the three chemical fractions for this study, the fraction is not likely to contain a large amount of aromatic compounds, especially in condensed structures, because the DBE/C (0.5) was lower than threshold value of >0.7, which represents molecules with condensed aromatic rings [35].
The relative abundances of the eight compounds classes, based on the molecular criteria presented in Table S2, were also compared for the different chemical fractions. Carbohydrates and tannins were the compound classes that were not detected or detected at a very low presence, irrespective of the chemical fractions. The low detection or absence of carbohydrate compounds could be constrained by the low ionization efficiency of polysaccharides in the negative ion mode during the FT-ICR MS analysis [54]. Meanwhile, tannins have been previously reported as potential missing compounds after SPE [55,56]. Except for the two compound classes, the distributions of the rest of the compound classes were consistent with previous observations and/or inferences from the fraction’s characteristics. For example, the most abundant molecular groups in the HPOA and the TPIA fractions were found to be unsaturated hydrocarbons (e.g., 43.1% ± 32.8% and 58.1% ± 14.9%, respectively), aromatic formulas (AF) (e.g., 32.5% ± 25.3% and 46.4% ± 10.0%, respectively) and lignin/CRAM (carboxyl-rich alicycyclic molecules) (e.g., 22.4% ± 35.7% and 20.9% ± 9.2%, respectively). The main differences between these two acidic fractions were in the abundances of condensed aromatic structures (CAS) (e.g., 0.5% ± 1.2% and 10.5% ± 9.0%, HPOA and TPIA respectively) and lipids (e.g., 28.5% ± 33.2% and 3.3% ± 1.3%, respectively). By contrast, the HPIN/B fraction presented a relatively high distributions of proteins (25.7% ± 7.5%) and lipids (29.4% ± 9.7%). This fraction also contains substantial amounts of lignin/CRAM (17.6% ± 4.6%), AF (14.5% ± 5.5%) and CAS (10.4% ± 10.9%). The overall distributions of the molecular groups among the different chemical fractions agreed with the general characteristics of the fractions previously reported in other studies [6,9].
Five different formula groups of CHO, CHON, CHOS, CHONS, and “others” were identified from the different chemical fractions (Table 1 and Table S3). The average distributions of the formula groups differed by the chemical fractions. CHO and the “others” formula groups were the major groups in the HPOA fraction, with relative abundances of 37.6% ± 32.1% and 33.4% ± 27.9%, respectively. The three other formula groups were detected with lower abundances ranging from 2.9% ± 6.5% (CHOS) to 16.7% ± 37.3% (CHON). The TPIA fraction was composed of 41.5% ± 13.6% CHONS, 29.5% ± 8.3% CHO, and 25.5% ± 14.5% for “others” as the major molecular composition, while the CHOS and CHON formula groups were present in low amounts (<2%). The HPIN/B fraction was dominated by the CHO group, with a relative abundance of 74.7% ± 6.3%. “Others” was the second major group. The heteroatoms formula groups of CHON, CHOS, and CHONS showed low abundances (<4%).
The van Krevelen diagrams showed that some formulas were located along the axis of H/C in the diagram (e.g., the formulas not containing oxygen atoms), and these were assigned to “others” (Figure 3 and Figure S2). This result suggests that the “others” group may correspond to short and/or long chain n-alkanes derived from planktons and/or higher plants [57]. Irrespective of the chemical fractions, CHO formulas were included in the molecular groups of lipids, proteins, lignin/CRAM, and CAS, which represent the organic matter structures of lignin and its microbial products, as well as algal-derived DOM. CHONS can be primarily assigned to unsaturated hydrocarbons, and these compounds were only found in the HPOA and TPIA fractions (except in R2; Figure S2). This result could be explained by the potential presence of linear alkylbenzene sulfonates (LAS) or their metabolites in the aquatic samples, which was also reported by Song et al. [6]. In contrast, the heteroatoms formulas, such as CHON and CHOS, were detected in low amounts (Table 1), both of which were assigned to different compound classes based on their locations in the van Krevelen diagrams (i.e., CHON to proteins, carbohydrates, tannins, and lignin/CRAM; CHOS to CAS, lipids and lignin/CRAM).

3.4. Comparison Between the Different Chemical Fractions

The differences among the three chemical fractions were further explored in three ways. First, the p-values between different chemical fractions were compared for the three pairs (i.e., HPOA vs. TPIA, TPIA vs. HPIN/B, and HPOA vs. HPIN/B) with respect to the fluorescence and the molecular parameters examined here (Table 2). Among the three pairs, the highest number of p-values below 0.05 (i.e., significant differences) was observed for the pair of TPIA versus HPIN/B (27 out of 37), while only 12 parameters exhibited significant differences (i.e., p < 0.05) for the pairs of HPOA versus TPIA, and HPOA versus HPIN/B. In detail, except for C1/C2 and SUVA254, all selected fluorescence parameters failed to discriminate between the HPOA and the TPIA fractions, while the pairs of acidic fractions (either HPOA or TPIA) and the HPIN/B fraction were statistically distinguished from each other by nearly all the selected fluorescence parameters (Table 2). The results above indicate that the fluorescence parameters may serve as good indices to discriminate between different acido-basic properties of aquatic DOM samples. Regarding the molecular parameters derived from the FT-ICR MS results, the comparison between the TPIA and the HPIN/B resulted in the highest number (19) of the parameters with p-values below 0.05. In contrast, only two molecular parameters (i.e., CHO and proteins) exhibited statistical differences between the HPOA and the HPIN/B fractions.
Using NMDS based on all selected parameters was another method to explore the relevant parameters to identify the three different chemical fractions (Figure 4). The stress value of the NMDS was 0.053, which is considered an excellent representation in reduced dimensions [58]. The three different chemical fractions were clustered and well separated on the map. A wide range of heterogeneity was found for the HPOA fraction (Figure 4), which had a high association with C2, HIX, C1/C3, C2/C3 and Lignin/CRAM. The TPIA fraction was mostly linked with only two molecular parameters, including the compound group “Others” and AI (Aromatic Index). Meanwhile, there was no particular parameter that can be directly related to the HPIN/B as shown by the absence of the parameters inside the boundary of the data points for the HPIN/B fraction in the map. The closest parameters to this fraction were the BIX and C1/C2 ratio (Figure 4). The distinction between the two acidic fractions, HPOA and TPIA, seems to be determined by their degree of aromaticity as the parameter of AI is placed between the two clusters in the map. In contrast, the distinction between the HPOA and HPIN/B fractions was mainly influenced by the distribution in elemental composition (C, H, O, H/C, O/C) and their refractory character (DBE), as well as by their source (FI, C3) and biological activity (BIX). By contrast, no parameters were located in between the TPIA and the HPIN/B fractions in the map.
Lastly, a Venn diagram was created to highlight the molecular differences and to clarify the overlapped formulas between the three pairs of the different chemical fractions (e.g., HPOA, TPIA, and HPIN/B) for each sample (Figure 5). The diagrams demonstrated only small percentages in the number of the overlapped formulas among the three chemical fractions, ranging from 0% (D3, R1, and R2) to 5.2% only (D1), supporting the successful separation of the relatively homogeneous fractions (i.e., decreased chemical heterogeneity) of aquatic DOM samples through chemical fractionation. This result was consistent with those of Song et al. [6], in which <5% of formula overlapping was found for four different chemical fractions (i.e., hydrophobic neutrals and bases and amphiphilic neutrals and bases). For the river samples (i.e., R1, R2, and R3), HPOA was the most easily discriminated from the other two fractions with the low abundance of overlapped formulas (0% to 1.9%). Although the same formulas do not directly indicate a structural match (Song et al. [6]), the comparison of the overlapped formulas between the two chemical fractions revealed that aquatic HS (i.e., HPOA) with allochthonous sources might have a unique molecular composition distinguishable from the other chemical fractions obtained from the same DOM samples. Regarding the dam samples (i.e. D1, D2, and D3), the lowest abundance of overlapped formulas (e.g., ranging from 2.0% to 23.7%) was observed for the HPIN/B fraction (except for D3, the water obtained from the bottom of the dam). The differences observed for the river versus dam samples may relate to their origins (i.e., allochthonous vs. autochthonous). However, no significant differences were observed based on the fluorescence and the molecular parameters between each source pair (i.e., river vs. dam) for the same chemical fraction (Table S4).

4. Conclusions

Three different chemical fractions (i.e., HPOA, TPIA and HPIN/B fractions) were isolated from river and reservoir samples, and the representative parameters were derived from fluorescence spectroscopy and FT-ICR MS analysis. The ratios of different FDOM components revealed the best discrimination indices to distinguish the HPIN/B fraction from other acidic fractions. In particular, the C1/C2 ratio showed its potential capability to discriminate between the acidic fractions and the HPIN/B fraction. The TPIA and the HPIN/B fractions were the most discriminated by the molecular parameters from the FT-ICR MS. The discrimination for the three chemical fractions using the fluorescence parameters seems to be affected by the acido-basic properties of DOM, while the molecular parameters are more likely to be influenced by the hydrophobic nature of the fractions. The NMDS based on 37 parameters provided further insight into identifying the unique characteristics of the individual chemical fractions. The HPOA fraction was the most characterized by the parameters represented by humic-like structures, while the TPIA was dominated by an enriched aromatic composition. The unique parameters describing the HPIN/B fraction were not identified from the NMDS. The Venn diagram revealed that only <6% of formulas were overlapped among the three chemical fractions, indicating that the lower heterogeneity in the molecular composition was achieved by the resin fractionation. Nevertheless, no prevalent effects of hydrophobicity or acido-basic properties were identified with the fluorescence and the molecular parameters of aquatic DOM samples.

Supplementary Materials

The following are available online at www.mdpi.com/2073-4441/9/8/555/s1, Table S1: Samples description including site name, type of area, depth, date of sampling, geographical coordinates and samples names, Table S2: Characteristics of compound classes used for categorizing FT-ICR MS molecular formulas, Table S3: Values of chemical, spectroscopic and molecular characteristics of the three chemical fractions for the 6 water samples from Deacheong Reservoir, Table S4: p-values of all the chemical, fluorescence and molecular parameters for each chemical fraction between the dam and river samples. p-values < 0.05 are in bold font, Figure S1: Average percentage of the component and ratios of these components for each fractions, Figure S2: Van Krevelen diagram of the identified formulas group of the three chemical fraction for the D2, D3, R1, R2, and R3 samples assigned by the FT-ICR MS. Overlain rectangular are used as broad indicators of the compound classes defined in Table S2.

Acknowledgments

This work was supported by a National Research Foundation of Korea (NRF) grant funded by the Korean government (MSIP) (No. 2014R1A2A2A09049496). It was also funded by the National Institute of Environmental Research, Republic of Korea. The views expressed are not necessarily those of NIER.

Author Contributions

Morgane Derrien, Yun Kyung Lee, and Jin Hur conceived and designed the experiments; Yun Kyung Lee performed the experiments; Morgane Derrien analyzed the data; Yun Kyung Lee contributed reagents/materials/analysis tools; Morgane Derrien and Jin Hur wrote the paper.

Conflicts of Interest

The authors declare no conflict of interest.

References

  1. Cole, J.J.; Prairie, Y.T.; Caraco, N.F.; McDowell, W.H.; Tranvik, L.J.; Striegl, R.G.; Duarte, C.M.; Kortelainen, J.A.; Downing, J.A.; Middelburg, J.J.; et al. Plumbing the global carbon cycle: Integrating inland waters into the terrestrial carbon budget. Ecosystems 2007, 10, 172–185. [Google Scholar] [CrossRef]
  2. Tranvik, L.J.; Downing, J.A.; Cotner, J.B.; Loiselle, S.A.; Striegl, R.G.; Ballatore, T.J.; Dillon, P.; Finlay, K.; Fortino, K.; Knoll, L.B.; et al. Lakes and reservoirs as regulators of carbon cycling and climate. Limnol. Oceanogr. 2009, 54, 2298–2314. [Google Scholar] [CrossRef]
  3. Melendez-Perez, J.J.; Martinez-Mejia, M.J.; Taj Awan, A.; Fadini, P.S.; Mozeto, A.A.; Ngueira Eberlin, M. Characterization and comparison of riverine, lacustrine, marine and estuarine dissolved organic matter by ultra-high resolution and accuracy Fourier transform mass spectrometry. Org. Geochem. 2016, 101, 99–107. [Google Scholar] [CrossRef]
  4. Dilling, J.; Kaiser, K. Estimation of the hydrophobic fraction of dissolved organic matter in water samples using UV photometry. Water Res. 2002, 36, 5037–5044. [Google Scholar] [CrossRef]
  5. He, W.; Hur, J. Conservative behavior of fluorescence EEM-PARAFAC components in resin fractionation processes and its applicability for characterizing dissolved organic matter. Water Res. 2015, 83, 217–226. [Google Scholar] [CrossRef] [PubMed]
  6. Song, G.; Mesfioui, R.; Dotson, A.; Westerhoff, P.; Hatcher, P. Comparison of hydrophobic and amphiphilic fractions of dissolved organic matter from a water reservoir by Fourier transform ion cyclotron resonance mass spectrometry. J. Soils Sediments 2016. [Google Scholar] [CrossRef]
  7. Fang, Z.; He, C.; Li, Y.; Chung, K.H.; Xu, C.; Shi, Q. Fractionation and characterization of dissolved organic matter (DOM) in refinery wastewater by revised phase retention and ion-exchange adsorption solid phase extraction followed by ESI FT-ICR MS. Talanta 2017, 162, 466–473. [Google Scholar] [CrossRef] [PubMed]
  8. Leenheer, J. Comprehensive approach to preparative isolation and fractionation of dissolved organic carbon from natural waters and wastewaters. Environ. Sci. Technol. 1981, 15, 578–587. [Google Scholar] [CrossRef] [PubMed]
  9. Imai, A.; Fukushima, T.; Matsushige, K.; Kim, Y.H. Fractionation and characterization of dissolved organic matter in a shallow eutrophic lake, its inflowing rivers, and other organic sources. Water Res. 2001, 35, 4019–4028. [Google Scholar] [CrossRef]
  10. Kim, H.-C.; Dempsey, B.A. Comparison of two fractionation strategies for characterization of wastewater effluent organic matter and diagnosis of membrane fouling. Water Res. 2012, 46, 3714–3722. [Google Scholar] [CrossRef] [PubMed]
  11. Stedmon, C.A.; Markager, S.; Bro, R. Tracing dissolved organic matter in aquatic environments using a new approach to fluorescence spectroscopy. Mar. Chem. 2003, 82, 239–254. [Google Scholar] [CrossRef]
  12. Murphy, K.R.; Stedmon, C.A.; Waite, T.D.; Ruis, G.M. Distinguishing between terrestrial and autochthonous organic matter sources in marine environments using fluorescence spectroscopy. Mar. Chem. 2008, 108, 40–58. [Google Scholar] [CrossRef]
  13. Singh, S.; D’Sa, E.J.; Swenson, E.M. Chromophoric dissolved organic matter (CDOM) variability in Barataria Basin using excitation-emission matrix (EEM) fluorescence and parallel factor analysis (PARAFAC). Sci. Total Environ. 2010, 408, 3211–3222. [Google Scholar] [CrossRef] [PubMed]
  14. Yang, L.; Hur, L. Critical evaluation of spectroscopic indices for organic matter source tracing via end member mixing analysis based on two contrasting sources. Water Res. 2014, 59, 80–89. [Google Scholar] [CrossRef] [PubMed]
  15. Hur, J.; Williams, M.A.; Schlautman, M.A. Evaluating spectroscopic and chromatographic techniques to resolve dissolved organic matter via end member mixing analysis. Chemosphere 2006, 63, 387–402. [Google Scholar] [CrossRef] [PubMed]
  16. Inamdar, S.; Singh, S.; Dutta, S.; Levia, D.; Mitchell, M.; Scott, D.; Bais, H.; McHale, P. Fluorescence characteristics and sources of dissolved organic matter for stream water during storm events in a forested mid-Atlantic watershed. J. Geophys. Res. 2011, 116G03043. [Google Scholar] [CrossRef]
  17. Fichot, C.G.; Kaiser, K.; Hooker, S.B.; Amon, R.M.W.; Babin, M.; Bélanger, S.; Walker, S.A.; Benner, R. Pan-Arctic distributions of continental runoff in the Arctic Ocean. Sci. Rep. 2013, 3. [Google Scholar] [CrossRef] [PubMed]
  18. He, W.; Chen, M.; Park, J.E.; Hur, J. Molecular diversity of riverine alkaline-extractable sediment organic matter and its linkages with spectral indicators and molecular size distributions. Water Res. 2016, 100, 222–231. [Google Scholar] [CrossRef] [PubMed]
  19. Derrien, M.; Yang, L.; Hur, J. Lipid biomarkers and spectroscopic indices for identifying organic matter sources in aquatic environments: A review. Water Res. 2017, 112, 58–71. [Google Scholar] [CrossRef] [PubMed]
  20. Marshall, A.G.; Hendrickson, C.L. Fourier transform ion cyclotron resonance detection: Principles and experimental configurations. Int. J. Mass Spectrom. 2002, 215, 59–75. [Google Scholar] [CrossRef]
  21. Koch, B.P.; Ludwichowski, K.U.; Kattner, G.; Dittmar, T.; Witt, M. Advanced characterization of marine dissolved organic matter by combining reversed-phase liquid chromatography and FT-ICR-MS. Mar. Chem. 2008, 111, 233–241. [Google Scholar] [CrossRef]
  22. Sleighter, R.L.; Hatcher, P.G. Fourier transform mass spectrometry for the molecular level characterization of natural organic matter: Instrument capabilities, applications, and limitations. In Fourier Transforms-Approach to Scientific Principles; Nikolic, G., Ed.; InTech: Rijeka, Croatia, 2011. [Google Scholar]
  23. Li, Y.; Xu, C.; Chung, K.H.; Shi, Q. Molecular characterization of dissolved organic matter and its subfractions in refinery process water by Fourier Transform Ion Cyclotron Resonance Mass Spectrometry. Energy Fuel 2015, 29, 2923–2930. [Google Scholar]
  24. Leenheer, J.A.; Croue, J.P. Peer reviewed: Characterizing aquatic dissolved organic matter. Environ. Sci. Technol. 2003, 37, 18–26. [Google Scholar] [CrossRef]
  25. Wei, L.-L.; Zhoa, Q.-L.; Xue, S.; Jia, T. Removal and transformation of dissolved organic matter in secondary effluent during granular activated carbon treatment. J. Zhejiang Uni. SCIENCE A 2008, 9, 994–1003. [Google Scholar] [CrossRef]
  26. Chung, S.W.; Hipsey, M.R.; Imberger, J. Modelling the propagation of turbid density inflows into a stratified lake: Daecheong Reservoir, Korea. Environ. Model. Softw. 2009, 24, 1467–1482. [Google Scholar] [CrossRef]
  27. Yu, S.J.; Lee, J.Y.; Ha, S.R. Effect of the seasonal diffuse pollution migration on natural organic matter behavior in a stratified dam reservoir. J. Environ. Sci. 2010, 22, 908–914. [Google Scholar] [CrossRef]
  28. Murphy, K.R.; Butler, K.D.; Spencer, R.G.M.; Stedmon, C.A.; Boehme, J.R.; Aiken, G.R. Measurement of dissolved organic matter fluorescence in aquatic environments: An interlaboratory comparison. Environ. Sci. Technol. 2010, 44, 9405–9412. [Google Scholar] [CrossRef] [PubMed]
  29. Hur, J.; Hwang, S.J.; Shin, J.K. Using synchronous fluorescence technique as a water quality monitoring tool for an urban river. Water Air Soil Pollut. 2008, 191, 231–243. [Google Scholar] [CrossRef]
  30. Stedmon, C.A.; Bro, R. Characterizing dissolved organic matter fluorescence with parallel factor analysis: A tutorial. Limnol. Oceanogr. Methods 2008, 6, 572–579. [Google Scholar] [CrossRef]
  31. McKnight, D.M.; Boyer, E.W.; Westerhoff, P.K.; Doran, P.T.; Kulbe, T.; Andersen, D.T. Spectrofluorometric characterization of dissolved organic matter for indication of precursor organic material and aromaticity. Limnol. Oceanogr. 2001, 46, 38–48. [Google Scholar] [CrossRef]
  32. Zsolnay, A.; Baigar, E.; Jimenez, M.; Steinweg, B.; Saccomandi, F. Differentiating with fluorescence spectroscopy the sources of dissolved organic matter in soils subjected to drying. Chemosphere 1999, 38, 45–50. [Google Scholar] [CrossRef]
  33. Huguet, A.; Vacher, L.; Relexans, S.; Saubusse, S.; Froidefond, J.-M.; Parlanti, E. Properties of fluorescent dissolved organic matter in the Gironde Estuary. Org. Geochem. 2009, 40, 706–719. [Google Scholar] [CrossRef]
  34. Kim, S.; Kramer, R.W.; Hatcher, G.H. Graphical method for analysis of ultrahigh-resolution broadband mass spectra of natural organic matter, the Van Krevelen Diagram. Anal. Chem. 2003, 72, 5336–5344. [Google Scholar] [CrossRef]
  35. Koch, B.P.; Dittmar, T. From mass to structure: An aromaticity index for high-resolution mass data of natural organic matter. Rapid Commun. Mass Spectrom. 2006, 20, 926–932. [Google Scholar] [CrossRef] [Green Version]
  36. Lapierre, J.F.; del Giorgio, P.A. Partial coupling and differential regulation of biologically and photochemically labile dissolved organic carbon across boreal aquatic networks. Biogeosciences 2014, 11, 5969–5985. [Google Scholar] [CrossRef]
  37. Shutova, Y.; Baker, A.; Bridgeman, J.; Henderson, R.K. Spectroscopic characterization of dissolved organic matter changes in drinking water treatment: From PARAFAC analysis to online monitoring wavelengths. Water Res. 2014, 54, 159–169. [Google Scholar] [CrossRef] [PubMed]
  38. Murphy, K.R.; Stedmon, C.A.; Wenig, P.; Bro, R. OpenFluor—An online spectral library of auto-fluorescence by organic compounds in the environment. Anal. Meth. 2014, 6, 658–661. [Google Scholar] [CrossRef]
  39. Lee, B.-M.; Deo, Y.-S.; Hur, J. Investigation of adsorptive fractionation of humic acid on graphene oxide using fluorescence Eemparafac. Water Res. 2015, 73, 242–251. [Google Scholar] [CrossRef] [PubMed]
  40. Stedmon, C.A.; Martager, S. Resolving the variability in dissolved organic matter fluorescence in a temperate estuary and its catchment using Parafac analysis. Limnol. Oceanogr. 2005, 50, 686–697. [Google Scholar] [CrossRef]
  41. Lu, Y.; Bauer, J.E.; Canuel, E.A.; Yamashita, Y.; Chambers, R.M.; Jaffe, R. Photochemical and microbial alteration of dissolved organic matter in temperate headwater streams associated with different land use. J. Geophys. Res. Biogeosci. 2013, 118, 566–580. [Google Scholar] [CrossRef]
  42. Singh, S.; Inamdar, S.; Scott, D. Comparison of two PARAFAC models of dissolved organic matter fluorescence for a mid-atlantic forested watershed in the USA. J. Ecosyst. 2013, 2013, 532424. [Google Scholar] [CrossRef]
  43. Mai, N.; Scully, N.M.; Pisani, O.; Jaffe, R. Composition of a protein-like fluorophore of dissolved organic matter in coastal wetland and estuarine ecosystems. Water Res. 2007, 41, 563–570. [Google Scholar] [CrossRef] [PubMed]
  44. Hernes, P.J.; Bergamaschi, B.A.; Eckard, R.S.; Spencer, R.G.M. Fluorescence-based proxies for lignin in freshwater dissolved organic matter. J. Geophys. Lett. 2009, 114, G00F03. [Google Scholar] [CrossRef]
  45. Reemtsma, T. Determination of molecular formulas of natural organic matter molecules by (ultra-) high-resolution mass spectrometry Status and needs. J. Chromatogr. A 2009, 1216, 3687–3701. [Google Scholar] [CrossRef] [PubMed]
  46. Novotny, N.R.; Capley, E.N.; Stenson, A.C. Fact or artifact: The representativeness of ESI-MS for complex natural organic mixtures. J. Mass Spectrom. 2014, 49, 316–326. [Google Scholar] [CrossRef] [PubMed]
  47. Brown, T.L.; Rice, J.A. Effect of experimental parameters on the ESI FT-ICR Mass Spectrum of fulvic acid. Anal. Chem. 2000, 72, 384–390. [Google Scholar] [CrossRef] [PubMed]
  48. Frahm, J.L.; Muddiman, D.C. Leveling response factors in the electrospray ionization process using a heated capillary interface. J. Am. Soc. Mass. Spectrom. 2005, 16, 772–778. [Google Scholar] [CrossRef] [PubMed]
  49. Wilm, M. Principles of Electrospray Ionization. Mol. Cell. Prot. 2011, 10, M111.009407. [Google Scholar] [CrossRef] [PubMed]
  50. Banerjee, S.; Mazumdar, S. Electrospray ionization mass spectrometry: A technique to access the information beyond the molecular weight of the analyte. Int. J. Anal. Chem. 2012, 2012, 282574. [Google Scholar] [CrossRef] [PubMed]
  51. Bagag, A.; Jault, J.-M.; Sidahmed-Adrar, N.; Refregiers, M.; Giuliani, A.; Le Naour, F. Characterization of Hydrophobic Peptides in the Presence of Detergent by Photoionization Mass Spectrometry. PLoS ONE 2013, 8, e79033. [Google Scholar] [CrossRef] [PubMed]
  52. Osaka, I.; Takayama, M. Influence of hydrophobicity on positive- and negative-ion yields of peptides in electrospray ionization mass spectrometry. Rapid Commun. Mass Spctrom. 2014, 28, 2222–2226. [Google Scholar] [CrossRef] [PubMed]
  53. Willoughby, A.S.; Wozniak, A.S.; Hatcher, P.G. A molecular-level approach for characterizing water-insoluble components of ambient organic aerosol particulates using ultrahigh-resolution mass spectrometry. Atmos. Chem. Phys. 2014, 14, 10299–10314. [Google Scholar] [CrossRef]
  54. Derrien, M.; Lee, Y.K.; Park, J.-E.; Li, P.; Chen, M.; Lee, S.H.; Lee, S.H.; Lee, J.-B.; Hur, J. Spectroscopic and molecular characterization of humic substances (HS) from soils and sediments in a watershed: Comparative study of HS chemical fractions and the origins. Environ. Sci. Pollut. Res. 2017, 24, 16933–16945. [Google Scholar] [CrossRef] [PubMed]
  55. Chen, M.; Kim, S.; Park, J.-E.; Jung, H.-J.; Hur, H. Structural and compositional changes of dissolved organic matter upon solid-phase extraction tracked by multiple analytical tools. Anal. Bioanal. Chem. 2016, 23, 6249–6258. [Google Scholar] [CrossRef] [PubMed]
  56. Lv, J.; Zhang, S.; Luo, L.; Cao, D. Solid-phase extraction-stepwise elution (SPE-SE) procedure for isolation of dissolved organic matter prior to ESI-FT-ICR-MS analysis. Anal. Chim. Acta 2016, 948, 55–61. [Google Scholar] [CrossRef] [PubMed]
  57. Gireeshkumar, T.R.; Deepulal, P.M.; Chandramohanakumar, N. Distribution and sources of aliphatic hydrocarbons and fatty acids in surface sediments of a tropical estuary south west coast of India (Cochin estuary). Environ. Monit. Assess. 2015, 187, 1–17. [Google Scholar] [CrossRef] [PubMed]
  58. Clarke, K.R. Non-parametric multivariate analyses of changes in community structure. Aust. J. Ecol. 1993, 18, 117–143. [Google Scholar] [CrossRef]
Figure 1. Map of the Daecheong Reservoir with the four sampling locations indicated.
Water 09 00555 g001
Figure 2. Contour plots of the three fluorescent components identified from excitation emission matrix-parallel factor analysis (EEM-PARAFAC). The emission (Em) and the excitation (Ex) loading are shown for the first and the second split-halves.
Water 09 00555 g002
Figure 3. Van Krevelen diagrams of the formulas group for the three chemical fractions ((a) HPOA fraction, (b) TPIA fraction, and (c) HPIN/B fraction) of a selected sample (D1) assigned by the Fourier transform ion cyclotron resonance mass spectrometry (FT-ICR MS). The overlain rectangles are used as the rough indicators of the compound classes defined in Table S2.
Water 09 00555 g003aWater 09 00555 g003b
Figure 4. Non-metric multidimensional scaling (NMDS) of the three chemical fractions (i.e., HPOA, TPIA, and HPIN/B) for each sample based on all the fluorescence and the molecular parameters examined in this study.
Water 09 00555 g004
Figure 5. Venn diagrams based on the identified formulas of the three chemical fractions (i.e., HPOA, TPIA, and HPIN/B) for each aquatic sample. The HPOA, TPIA, and HPIN/B fractions are indicated by green, orange, and gray, respectively. The numbers in normal font in the overlapped spaces represent the percentages of similar formulas between the two chemical fractions. The numbers in bold font in the overlapped spaces represent the percentages of similar formulas among the three chemical fractions.
Water 09 00555 g005
Table 1. The statistics (mean, standard deviation (std), minimum, maximum, and the ranges) of spectroscopic and molecular characteristics for the three chemical fractions (n = 6).
SampleHPOATPIAHPIN/B
AverageMinMaxRangeAverageMinMaxRangeAverageMinMaxRange
SUVA2543.8 ± 1.91.95.934.10.4 ± 0.10.20.60.400.2 ± 0.20.10.60.5
%C130.1 ± 3.824.135.311.230.4 ± 7.314.435.320.921.7 ± 1.719.623.94.4
%C216.8 ± 3.312.221.59.312.7 ± 4.13.615.311.76.3 ± 1.04.77.62.9
%C353.0 ± 6.843.261.718.557.0 ± 11.350.682.031.472.0 ± 2.068.574.66.1
FI1.2 ± 0.01.11.20.11.2 ± 0.11.21.30.21.6 ± 0.11.51.70.2
HIX2.5 ± 0.61.73.41.61.7 ± 0.60.52.11.60.8 ± 0.20.41.00.6
BIX0.8 ± 0.10.70.90.21.0 ± 0.20.91.50.61.9 ± 0.71.43.52.1
C1/C21.8 ± 0.21.52.20.72.6 ± 0.62.14.01.93.6 ± 0.73.15.01.9
C1/C30.6 ± 0.10.40.80.40.6 ± 0.20.20.70.50.3 ± 0.10.30.30.1
C2/C30.3 ± 0.10.20.50.30.2 ±0.10.00.30.20.1 ± 0.00.10.10.0
Number of formulas82 ± 1451403402378 ± 29542939897203 ± 53134267133
m/zwa392.47 ± 38.22346.37441.2994.92383.21 ± 14.17354.68398.2243.54356.07 ± 10.75346.42376.6530.23
Cwa22.97 ± 2.4919.0227.007.9823.61 ± 0.8321.9224.472.5520.76 ± 0.8519.6621.892.22
Hwa33.79 ± 4.9329.5042.0012.5025.23 ± 0.9523.1925.952.7630.05 ± 2.3226.9333.436.50
Owa4.39 ± 1.402.667.004.342.92 ± 0.392.473.531.054.17 ± 0.543.345.181.83
Nwa0.37 ± 0.330.001.001.000.61 ± 0.050.540.680.140.15 ± 0.040.090.210.12
Swa0.25 ± 0.260.000.700.700.61 ± 0.050.520.690.170.27 ± 0.090.110.380.27
H/Cwa1.51 ± 0.171.311.750.441.13 ± 0.021.111.160.051.53 ± 0.141.351.730.38
O/Cwa0.21 ± 0.060.140.290.150.16 ± 0.020.140.180.040.23 ± 0.030.180.280.10
N/Cwa0.01 ± 0.010.000.040.040.02 ± 0.000.020.030.000.01 ± 0.000.010.010.00
S/Cwa0.01 ± 0.010.000.030.030.02 ± 0.000.020.030.010.01 ± 0.000.010.020.01
DBEwa7.3 ± 2.63.710.06.212.3 ± 0.511.612.91.36.8 ± 1.94.09.45.4
DBEwa/Cwa0.3 ± 0.10.20.40.30.5 ± 0.00.50.50.00.3 ± 0.10.20.40.2
AImod,wa0.2 ± 0.10.00.30.30.4 ± 0.00.40.40.00.2 ± 0.10.10.30.2
CHO (%)37.6 ± 32.10.0100.0100.029.5 ± 8.314.038.624.674.7 ± 6.366.086.220.2
CHON (%)16.7 ± 37.30.0100.0100.01.9 ± 4.20.011.211.20.7 ± 1.00.02.42.4
CHOS (%)2.9 ± 6.50.017.517.51.7 ± 1.70.04.84.83.1 ± 2.00.06.76.7
CHONS (%)9.4 ± 14.10.036.236.241.5 ± 13.614.355.240.93.8 ± 6.40.017.817.8
Others (%)33.4 ± 27.90.070.070.025.5 ± 14.511.154.843.717.6 ± 8.07.528.120.7
AF (%)32.5 ± 25.30.070.070.046.4 ± 10.028.361.633.314.5 ± 5.56.021.815.9
CAS (%)0.5 ± 1.20.03.23.210.5 ± 9.00.920.819.910.4 ± 10.90.028.028.0
Lignin/CRAM (%)22.4 ± 35.70.0100.0100.020.9 ± 9.27.135.628.417.6 ± 4.69.524.615.1
Protein (%)6.8 ± 6.80.014.314.310.7 ± 2.27.614.87.225.7 ± 7.519.139.620.5
Carbohydrate (%)0.0 ± 0.00.00.00.00.0 ± 0.00.00.00.00.3 ± 0.40.01.01.0
Lipid (%)28.5 ± 33.20.0100.0100.03.3 ± 1.31.65.23.629.4 ± 9.79.739.429.7
UnsatHydroC (%)43.1 ± 32.80.090.090.058.1 ± 14.932.379.146.821.2 ± 7.310.627.917.3
Tannin (%)0.0 ± 0.00.00.00.00.0 ± 0.00.00.00.00.3 ± 0.60.01.61.6
Note: wa-intensity-weighted average, DBE-Double Bond Equivalent, AImod-modified Aromatic Index, AF-Aromatic Formulas, CAS-Condensed Aromatic Structures, UnsatHydroC-Unsaturated HydroCarbons, CHO-only elements C, H, and O in the formulas, CHON-only elements C, H, O, and N in the formulas, CHOS-only elements C, H, O, and S in the formulas, CHONS-only elements C, H, O, N, and S in the formulas, and others-the remaining formulas excluding the previous four groups.
Table 2. p-values of all the fluorescence and molecular parameters between pairs of chemical fractions (p-values < 0.05 are in bold font).
Fluorescence and Molecular Parametersp-Value
HPOA vs. TPIATPIA vs. HPIN/BHPOA vs. HPIN/B
SUVA2540.00060.13150.0004
%C10.94540.04360.0027
%C20.10460.01250.0002
%C30.51950.02570.0004
FI0.10410.00000.0000
HIX0.06440.00470.0001
BIX0.08110.03180.0089
C1/C20.02640.06010.0007
C1/C30.86590.01630.0041
C2/C30.16720.00700.0013
Number of formulas0.07200.22350.1080
m/zwa0.62240.00660.0675
Cwa0.59940.00030.0896
Hwa0.00340.00160.1542
Owa0.04690.00190.7518
Nwa0.14290.00000.1674
Swa0.01160.00000.8574
H/Cwa0.00070.00010.8665
O/Cwa0.08790.00050.4691
N/Cwa0.12480.00000.2131
S/Cwa0.01420.00050.5865
DBEwa0.00150.00010.7634
DBEwa/Cwa0.00090.00030.8337
AImod,wa0.00150.00000.6707
CHO (%)0.59360.00000.0298
CHON (%)0.39810.56890.3618
CHOS (%)0.68930.24680.9512
CHONS (%)0.00420.00020.4418
Others (%)0.58480.31420.2524
AF (%)0.27870.00010.1509
CAS (%)0.03350.98700.0717
Lignin/CRAM (%)0.92630.49420.7702
Protein (%)0.25270.00160.0020
Carbohydrate (%)/0.14920.1492
Lipid (%)0.12200.00010.9522
UnsatHydroC (%)0.37590.00060.1740
Tannin (%)/0.34090.3409

