Effects on Infiltration and Evaporation When Adding Rapeseed-Oil Residue or Wheat Straw to a Loam Soil

1
College of Water Resources and Architectural Engineering, Northwest A&F University, Yangling 712100, China
2
Key Laboratory for Agricultural Soil and Water Engineering in Arid Area of Ministry of Education, Northwest A&F University, Yangling 712100, China
*
Author to whom correspondence should be addressed.
Water 2017, 9(9), 700; https://doi.org/10.3390/w9090700
Submission received: 11 July 2017
/
Revised: 8 September 2017
/
Accepted: 11 September 2017
/
Published: 14 September 2017
(This article belongs to the Special Issue Water and Solute Transport in Vadose Zone)
Abstract
:The application of additives (e.g., wheat straw (WS) or rapeseed-oil residue (RR)) to soils is a common agronomic practice, used for improving soil water retention. Through a laboratory investigation, this study examined the effects of RR and WS on infiltration, evaporation, water distribution, and water retention. The results indicated that the migration rate of the wetting front, as well as the accumulative infiltration and evaporation, decreased with the amount of applied additives. RR was more effective than WS for infiltration and evaporation suppression. Furthermore, in the Kostiakov model, the value of a decreased with an increasing amount of additive, becoming smaller than the corresponding control treatment (CK) value; by contrast, the value of n decreased with increasing amount of applied additive, remaining larger than the CK value. In the Rose model, the values of A for the soils mixed with additives were smaller than those of the CK, and decreased with increasing amount of additive. Moreover, compared with the CK, the maximum water content for the RR-applied soils increased by 17.84% after infiltration and by 47.66% after evaporation. In addition, the water retention coefficients (calculated as the soil moisture after evaporation divided by that after infiltration) for soils mixed with RR were the highest, indicating that RR is more effective than WS for improving the water retention of the soil layer.
1. Introduction
Soil water is a component of soil, a vital water resource, and a frequent subject of soil physics investigations. An improved understanding of water movement and distribution in soil profile would benefit field irrigation determination and water use efficiency [1,2]. However, droughts often occur in many parts of the world, and they usually have devastating effects on crop growth and production [3]. In arid and semiarid regions, low levels of rainfall, high rates of atmospheric evaporation, and weak water retention often result in cultivated soils having poor production [4,5]. Reducing water loss and extending the duration for which water is maintained in soil could help crops to absorb moisture, thereby improving water use efficiency. Infiltration and evaporation are key factors resulting in water loss from soil [5]; as inalienable parts of the water cycle, both processes determine the soil water balance and the degree of effective utilization of irrigation water. They are also key factors restricting agricultural planting [6]. Therefore, investigations of water distribution due to infiltration and evaporation are required to develop effective approaches to enhance soil water-holding capacity and promote the healthy development of farming [7,8].
In field agriculture, to restrain water loss and increase water storage through surficial protective covering, water-retaining mulches (e.g., crop straw, gravel sand, and plastic film) are laid on the ground [9,10,11,12,13,14,15,16]. However, a high volume of straw on the ground may hinder activity, causing difficulties in sowing [17], and long-term sand coverage may destroy cultivated soils, largely through soil desertification. Moreover, plastic films may become damaged during and after crop growth, resulting in a considerable amount of residual plastic film being left in the soil, and thereby further limiting water retention and damaging the soil structure [18,19]. Considerable research has focused on the effects of soil additives on infiltration or evaporation; however, this effect has been ignored with regard to water distribution features. Xing et al. [20] indicated that, in descending order of effectiveness, rapeseed-oil residue (RR), wheat straw (WS), and wheat husk all help to enhance water retention.
Given the shortcomings of soil-surface coverage, this study selected RR and WS, pulverized these selected materials, and uniformly mixed them with soil samples for testing. The main objectives of these one-dimensional soil column experiments were (1) to investigate the effects of different amounts of RR and WS on infiltration, evaporation, and soil water movement; and (2) to propose an effective parameter for evaluating water retention under infiltration–evaporation conditions. Ultimately, this study can provide a valuable reference for farmland management regarding the use of soil additive application methods for enhancing water retention.
2. Materials and Methods
2.1. Experimental Materials and Design
Experimental soil samples were collected from a cultivated field on the Loess Plateau of China (about 34°17′ N and 108°04′ E) to a depth of 50 cm. The soil within 50 cm depth was loam (based on the USDA Soil Taxonomy System) with particle size distributions of 16.32% 0–0.002 mm, 34.56% 0.002–0.02 mm, and 49.12% 0.02–2 mm. The experimental soils were air dried and then sieved through a 2-mm mesh for standby application. The initial moisture content of the experimental dry soil was about 2.47%. Two types of unleavened soil additives, namely RR and WS, were individually air dried, pulverized, and uniformly mixed with dry soil samples. According to the agronomic measurements widely adopted by local farmers, the mass fractions of RR was set to 1%, 2%, 3%, and 5% (RR-1%, RR-2%, RR-3%, and RR-5%), and the mass fractions of WS was set to 1%, 2%, and 3% (WS-1%, WS-2%, and WS-3%). Pure soil samples without additives were used as a control treatment (CK). The saturated water content for the soils mixed with the additives was higher than that for the control 0.56–0.58 cm3·cm−3 for RR and 0.55–0.56 cm3·cm−3 for WS versus 0.48 cm3·cm−3 for CK. Three sample replicates were compacted into plexiglass soil columns (height: 60 cm; inner diameter: 15 cm) at a 1.35 g·cm−3 bulk density to simulate the in situ bulk density of a local cultivated field. In total, 8 treatments and 24 soil columns were included in the final analysis.
We collected experimental loam samples from a local wheat-maize rotation field, and individually mixed them with RR and WS powder, and then conducted steady-head infiltration and evaporation experiments. During infiltration and evaporation, the effects of the types and quantities of the soil additives on the accumulative infiltration and evaporation was quantitatively analyzed. Finally, water retention was evaluated based on the soil water distribution.
2.2. Experimental Method
- (1)
- After the soils were compacted into soil column and left standing for 24 h, the infiltration experiment was conducted. A graduated Mariotte bottle was connected to the soil column to maintain a steady infiltration head at 5 cm and a continuous water supply. The water level in the Mariotte bottle was recorded to calculate accumulative infiltration; the lower distance of the wetting front was also recorded regularly. The infiltration ended when the lower distance of the wetting front was 50 cm. The water supply was then cut off and the surface water was drained. Finally, moderate amounts of the soils were collected from small holes (inner diameter: 1 cm) on the sides of the soil columns at a depth of 0 (soil surface) as well as at 5, 15, 25, 35, and 45 cm. The soil water content was obtained through the oven-drying method, and the average water content at 5–45 cm was then calculated as the average value of the water content at each depth layer (5, 15, 25, 35, and 45 cm).
- (2)
- The soil column was weighed after infiltration and then placed beneath an infrared lamp (275 W), at which point the following evaporation experiment started. The vertical distance between the lamp and soil surface was maintained at a constant 40 cm. The mean room temperature was 24.5 ± 0.5 °C. During evaporation, the soil column was weighed regularly for evaporation calculation (i.e., water loss), and after 7 days’ continuous day-and-night illumination, moderate quantities of soil were collected from small holes at depths of 0, 5, 15, 25, 35, and 45 cm depth to measure the soil water content and calculate the average water content at 5–45 cm.
- (3)
- The variability coefficient (CV), calculated as the sample standard deviation divided by the sample average [21], reflects the degree of data dispersion. CV was therefore selected in the present study to analyze the degree of variation in the soil water distribution resulting from infiltration and evaporation, with a larger CV value representing a greater degree of variation.
2.3. Model Application
Two widely used infiltration models (the Kostiakov and Philip models; Equations (1) and (2)) and evaporation models (the Rose and Gardner models; Equations (3) and (4)) were selected for the infiltration and evaporation simulations.
where I and E represent accumulative infiltration and evaporation (cm), respectively, t is time (min), S is soil sorptivity (cm·min−0.5), a and n are empirical constants (n = 0.3–0.8), and A, B, and C are evaporation coefficients.
2.4. Model Performance Evaluation
The following four statistical indicators (Equations (5)–(8)), namely the relative root mean square error (RRMSE), coefficient of residual mass (CRM), Nash–Sutcliffe efficiency coefficient (NS), and determination coefficient (R2), were applied for the evaluation of the models. The NS and CRM adequately reflect the model simulation performance, with higher simulation efficiency represented when the CRM was closer to 0 and NS was closer to 1 [22].
where n is the sample size, Mi is the measured infiltration or evaporation, and Si is the estimated infiltration or evaporation using the models.
3. Results
3.1. Evaluation of Infiltration Affected by RR and WS
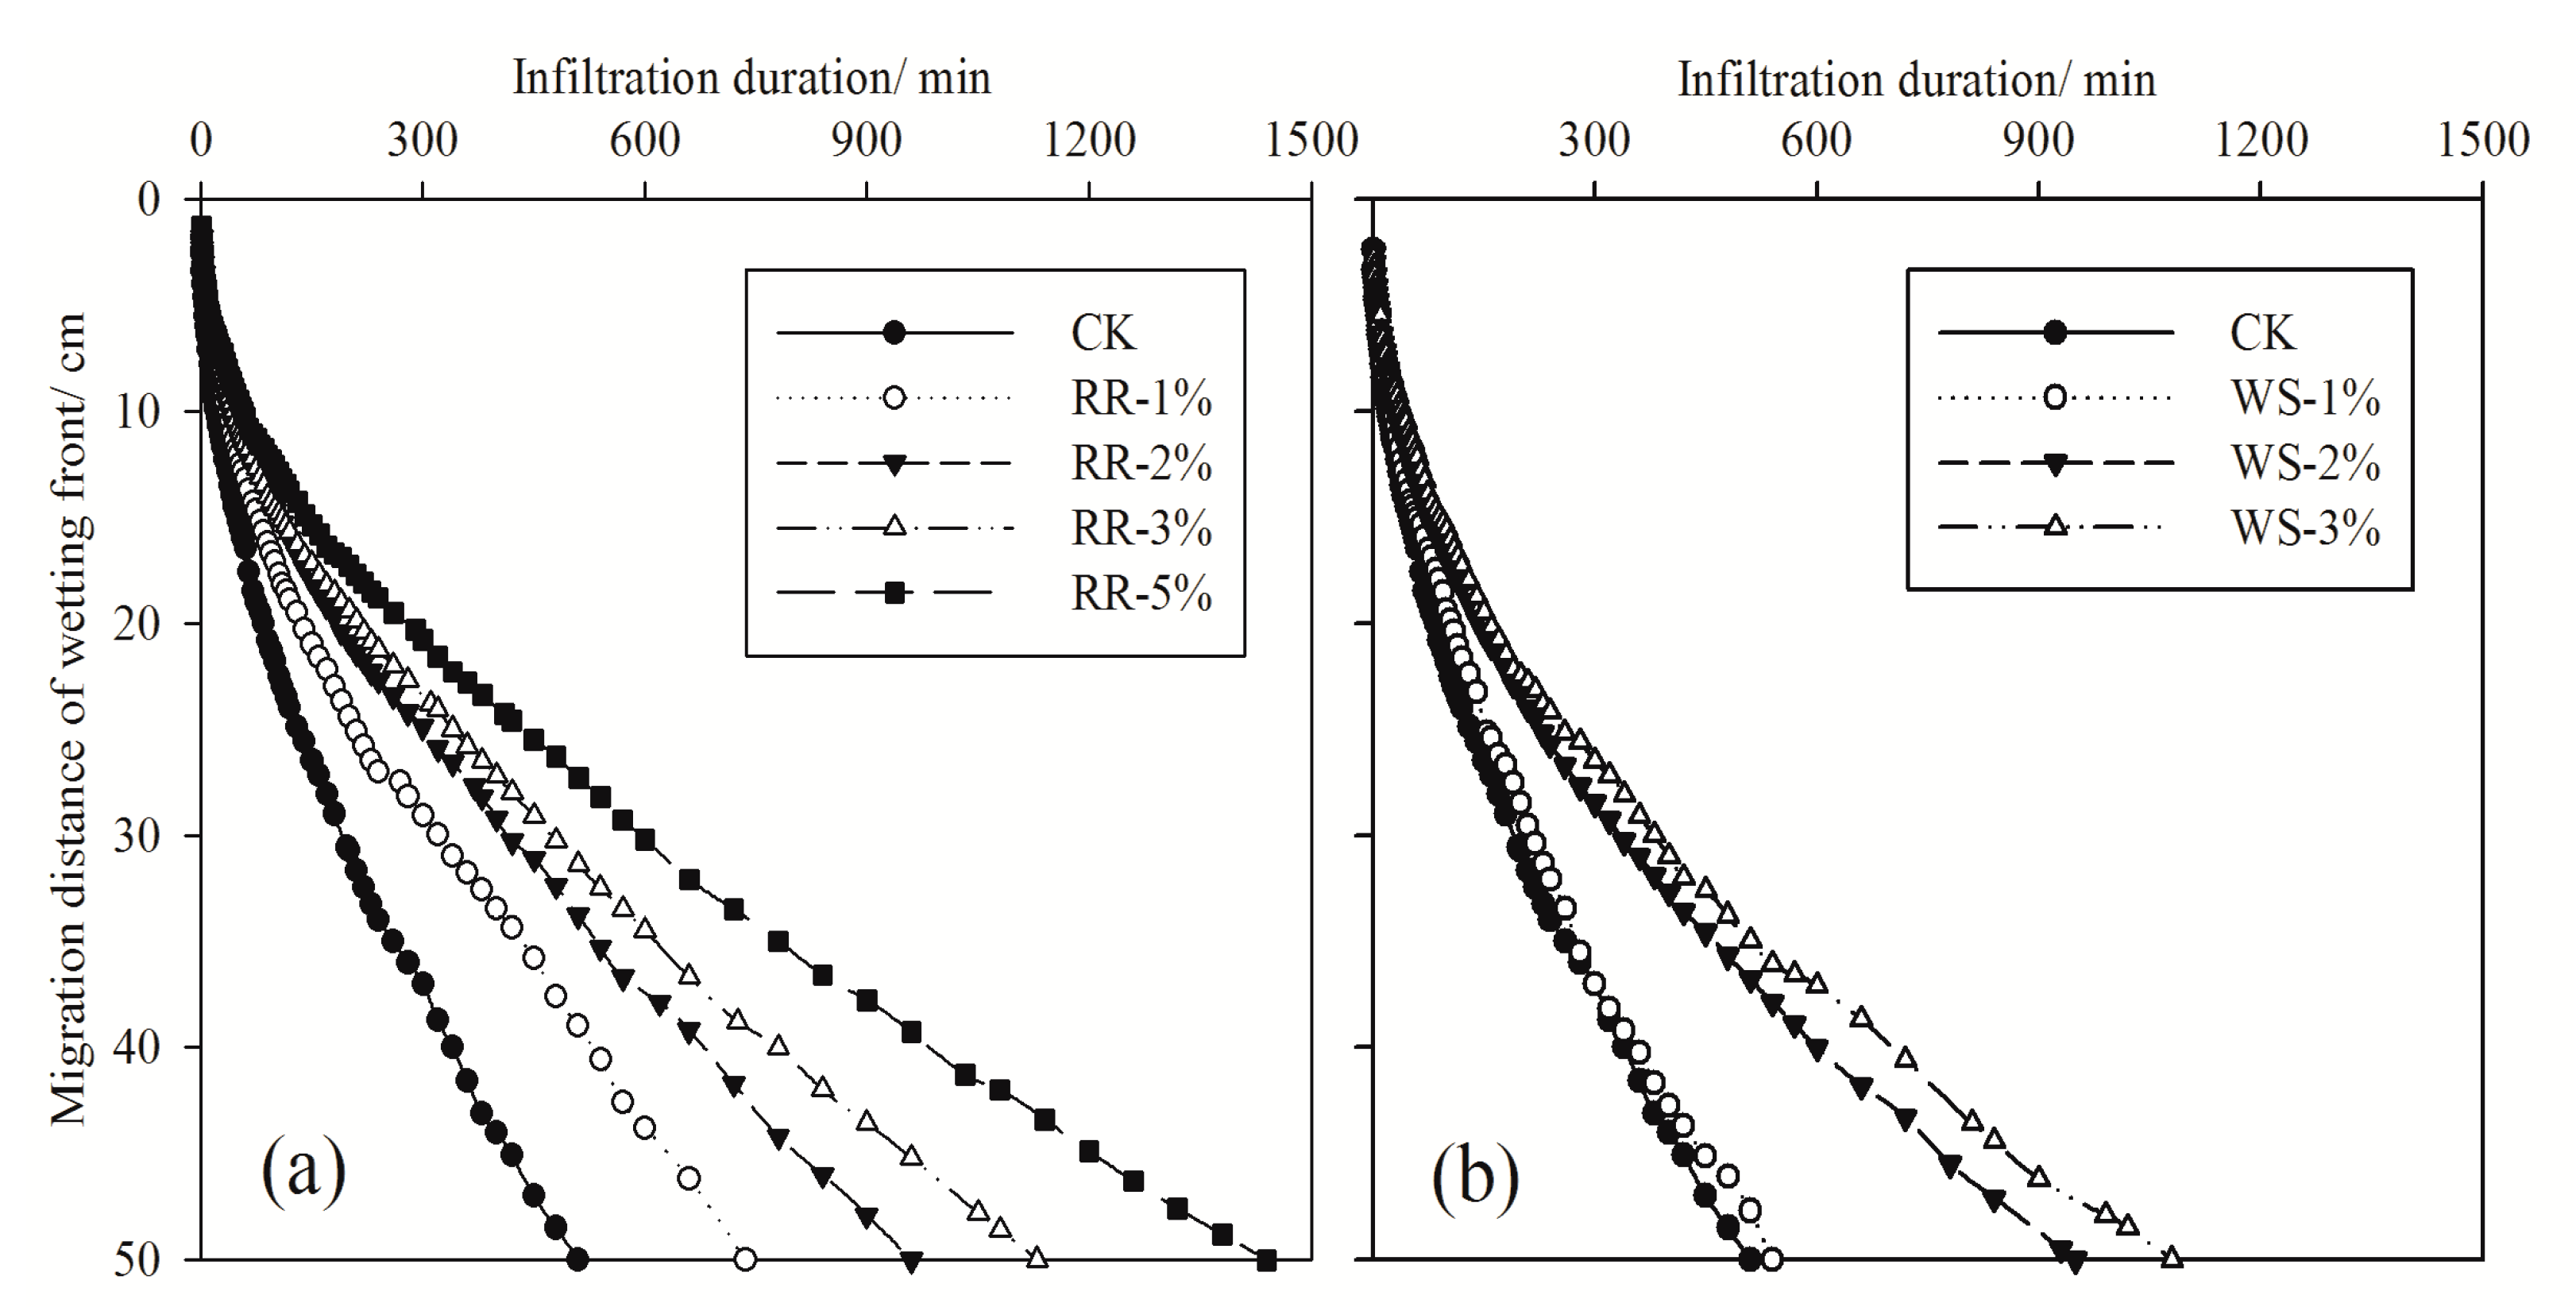
The infiltration process was influenced by the type and amount of applied soil additives, resulting in differences in wetting front migration (Figure 1) and accumulative infiltration (Figure 2) for the treatments mixed with various quantities of RR and WS. The vertical wetted depth increased with infiltration duration. The different durations of the wetting front reaching the bottom of the soil column (DWFs) are shown in Figure 1. For the treatments mixed with RR (TRRs), the DWFs for RR-1%, RR-2%, RR-3%, and RR-5% were approximately 736, 960, 1130, and 1440 min, respectively. For the treatments mixed with WS (TWSs), the DWFs for WS-1%, WS-2%, and WS-3% were approximately 540 min, 950 min, and 1080 min, respectively. Therefore, all durations were longer than that of the CK (510 min), indicating that RR and WS can prevent water infiltration. Furthermore, the migration rate of the wetting front gradually decreased with increasing amounts of applied RR and WS. Specifically, the wetting front migration rates for RR-1%, RR-2%, RR-3%, and RR-5% were 0.0679, 0.0521, 0.0442, and 0.0347 cm·min−1, respectively. The wetting front migration rates for WS-1%, WS-2%, and WS-3% were 0.0926, 0.0526, and 0.0463 cm·min−1, respectively; Figure 1a indicated that RR uniformly reduced the wetting front migration rate. The inhibition effect of 1% WS on infiltration was initially weak, but markedly strengthened by subsequently increasing the quantity to 2% (Figure 1b), although this requires further verification.
Under the same infiltration duration conditions, the migration distances of the wetting front decreased as the amounts of applied soil additives increased. This indicated that, to some extent, both RR and WS enhanced water retention and reduced infiltration rates. Furthermore, RR exerted a greater effect than WS on the migration distance of the wetting front. In other words, the migration distances of the wetting front for TRRs and TWSs were ranked in the following order: RR-1% < WS-1%, RR-2% < WS-2%, and RR-3% < WS-3%.
A power function (F = a·tb) was selected to fit the relationship between the migration distance of the wetting front (F) and infiltration duration (t). As shown in Table 1, the CRM was always close to 0 and the NS was always larger than 0.9 (almost always larger than 0.99), indicating that the selected power function was highly accurate for describing the relationship between F and t for the soils mixed with RR and WS, which can also be attributed to an extremely small RRMSE and large R2 (>0.99).
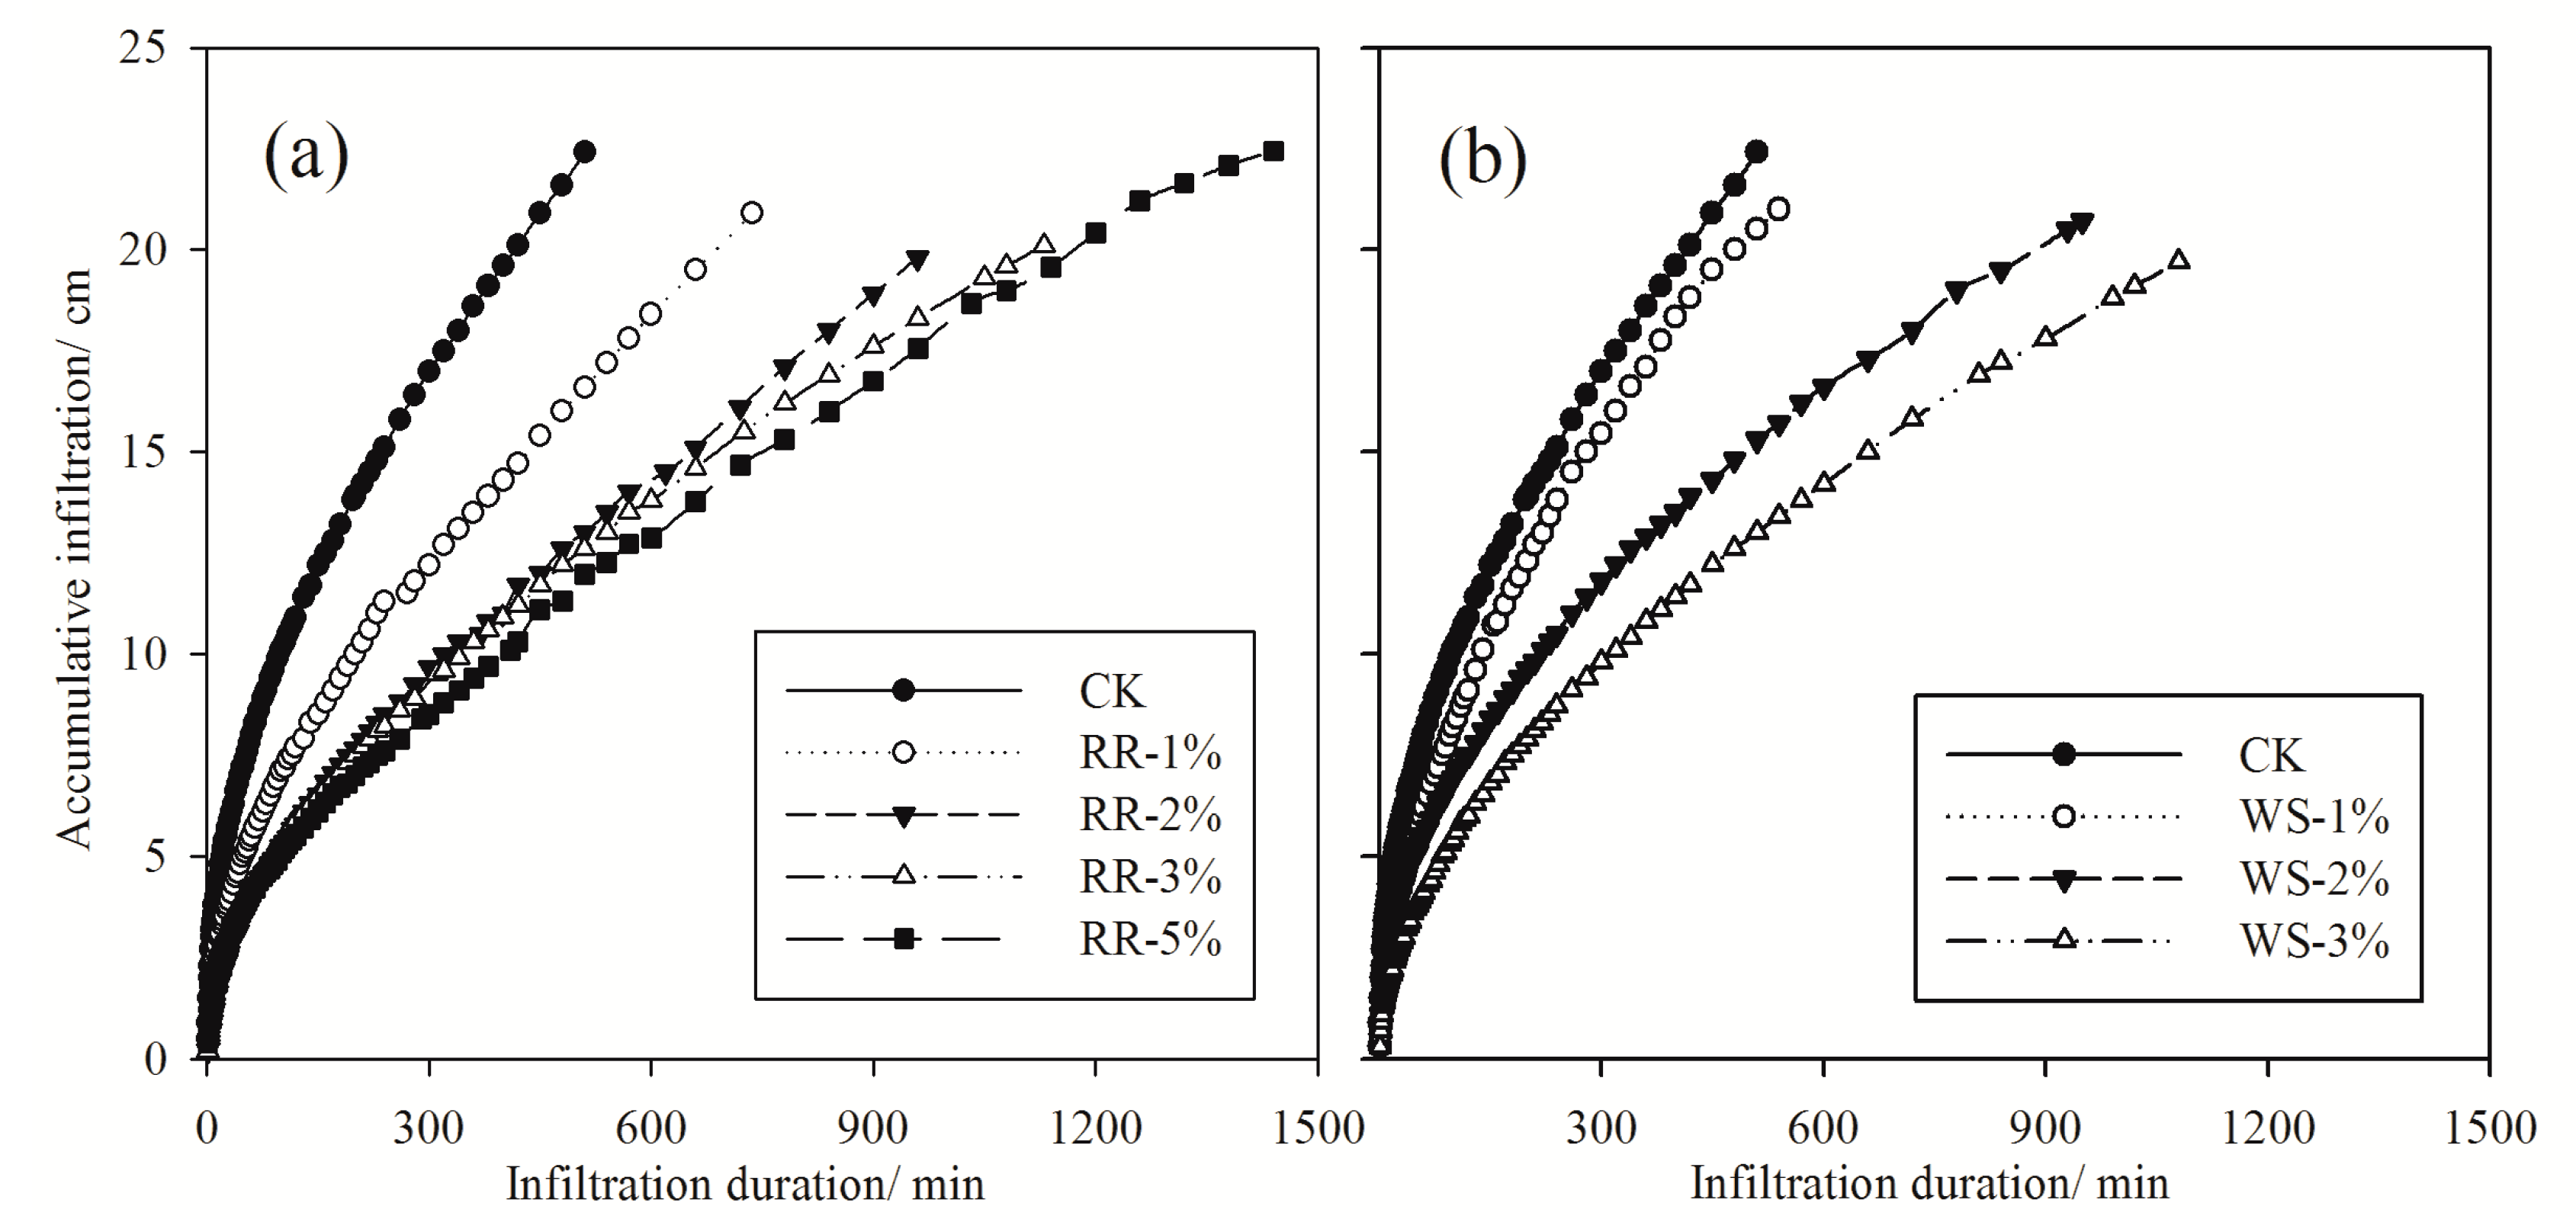
Accumulative infiltration gradually increased with the infiltration duration (Figure 2). Under the same infiltration duration conditions, the accumulative infiltration of both TRRs and TWSs were smaller than that of CK. Furthermore, the accumulative infiltration decreased with increases in the amounts of applied soil additives. The accumulative infiltration for CK was 22.4 cm (DWF = 510 min), and compared with CK, the accumulative infiltrations for RR-1%, RR-2%, RR-3%, and RR-5% were reduced by 25.89%, 41.98%, 43.75%, and 46.56%, respectively, and the accumulative infiltrations for WS-1%, WS-2%, and WS-3% were reduced by 8.48%, 31.70%, and 41.96%. This indicated that RR was more available than WS for reducing water infiltration, and that this inhibiting effect on infiltration gradually became stronger with increasing amounts of applied additives.
The model simulation results (Table 2) indicated that the Kostiakov model was more effective than the Philip model for determining the relationship between accumulative infiltration and duration for soils mixed with different amounts of RR and WS, owing to its smaller RRMSE and CRM, and larger NS. For the fitted parameters a and n (Table 3), the value of a decreased and that of n increased as the amounts of applied soil additives increased. Furthermore, the value of a was smaller and that of n was larger for soils mixed with additives than for CK.
3.2. Evaluation of Evaporation Affected by RR and WS
The evaporation process was influenced by the type and amount of applied soil additives, resulting in accumulative evaporation differences for the treatments mixed with different quantities of RR and WS (Figure 3). Increases in the duration of evaporation caused accumulative evaporation to increase gradually at a decreasing rate. Under the same evaporation duration conditions, the soil water loss of both TRRs and TWSs were smaller than that of CK. Furthermore, the evaporation decreased with increasing amounts of applied soil additives. The accumulative evaporation for soils mixed with additives was 7.47–43.62% lower than that of CK (94.0 mm). Specifically, the accumulative evaporation values for RR-1%, RR-2%, RR-3%, and RR-5% were approximately 85.1 mm, 70.8 mm, 64.0 mm, and 53.0 mm, respectively, and the accumulative evaporation for WS-1%, WS-2%, and WS-3% were approximately 87.2 mm, 76.3 mm, and 63.7 mm. This indicated that water loss could be effectively weakened by applying RR or WS to soils; furthermore, RR was observed to be more effective than WS for the inhibition of water evaporation.
Model simulation results (Table 2) showed that the Rose model was more effective than the Gardner model for determining the relationship between the accumulative evaporation and duration for soils mixed with different amounts of RR and WS because of its smaller RRMSE and CRM, and larger NS. For the fitted parameter A shown in Table 3, its value decreased with increases in the amounts of applied RR and WS, and was smaller than that for CK. Whereas the B value for soils mixed with additives was smaller than that for CK, the relationship between the B value and the amount of additive still requires further calibration on the basis of extensive tests.
3.3. Evaluation of Soil Water Distribution Affected by RR and WS
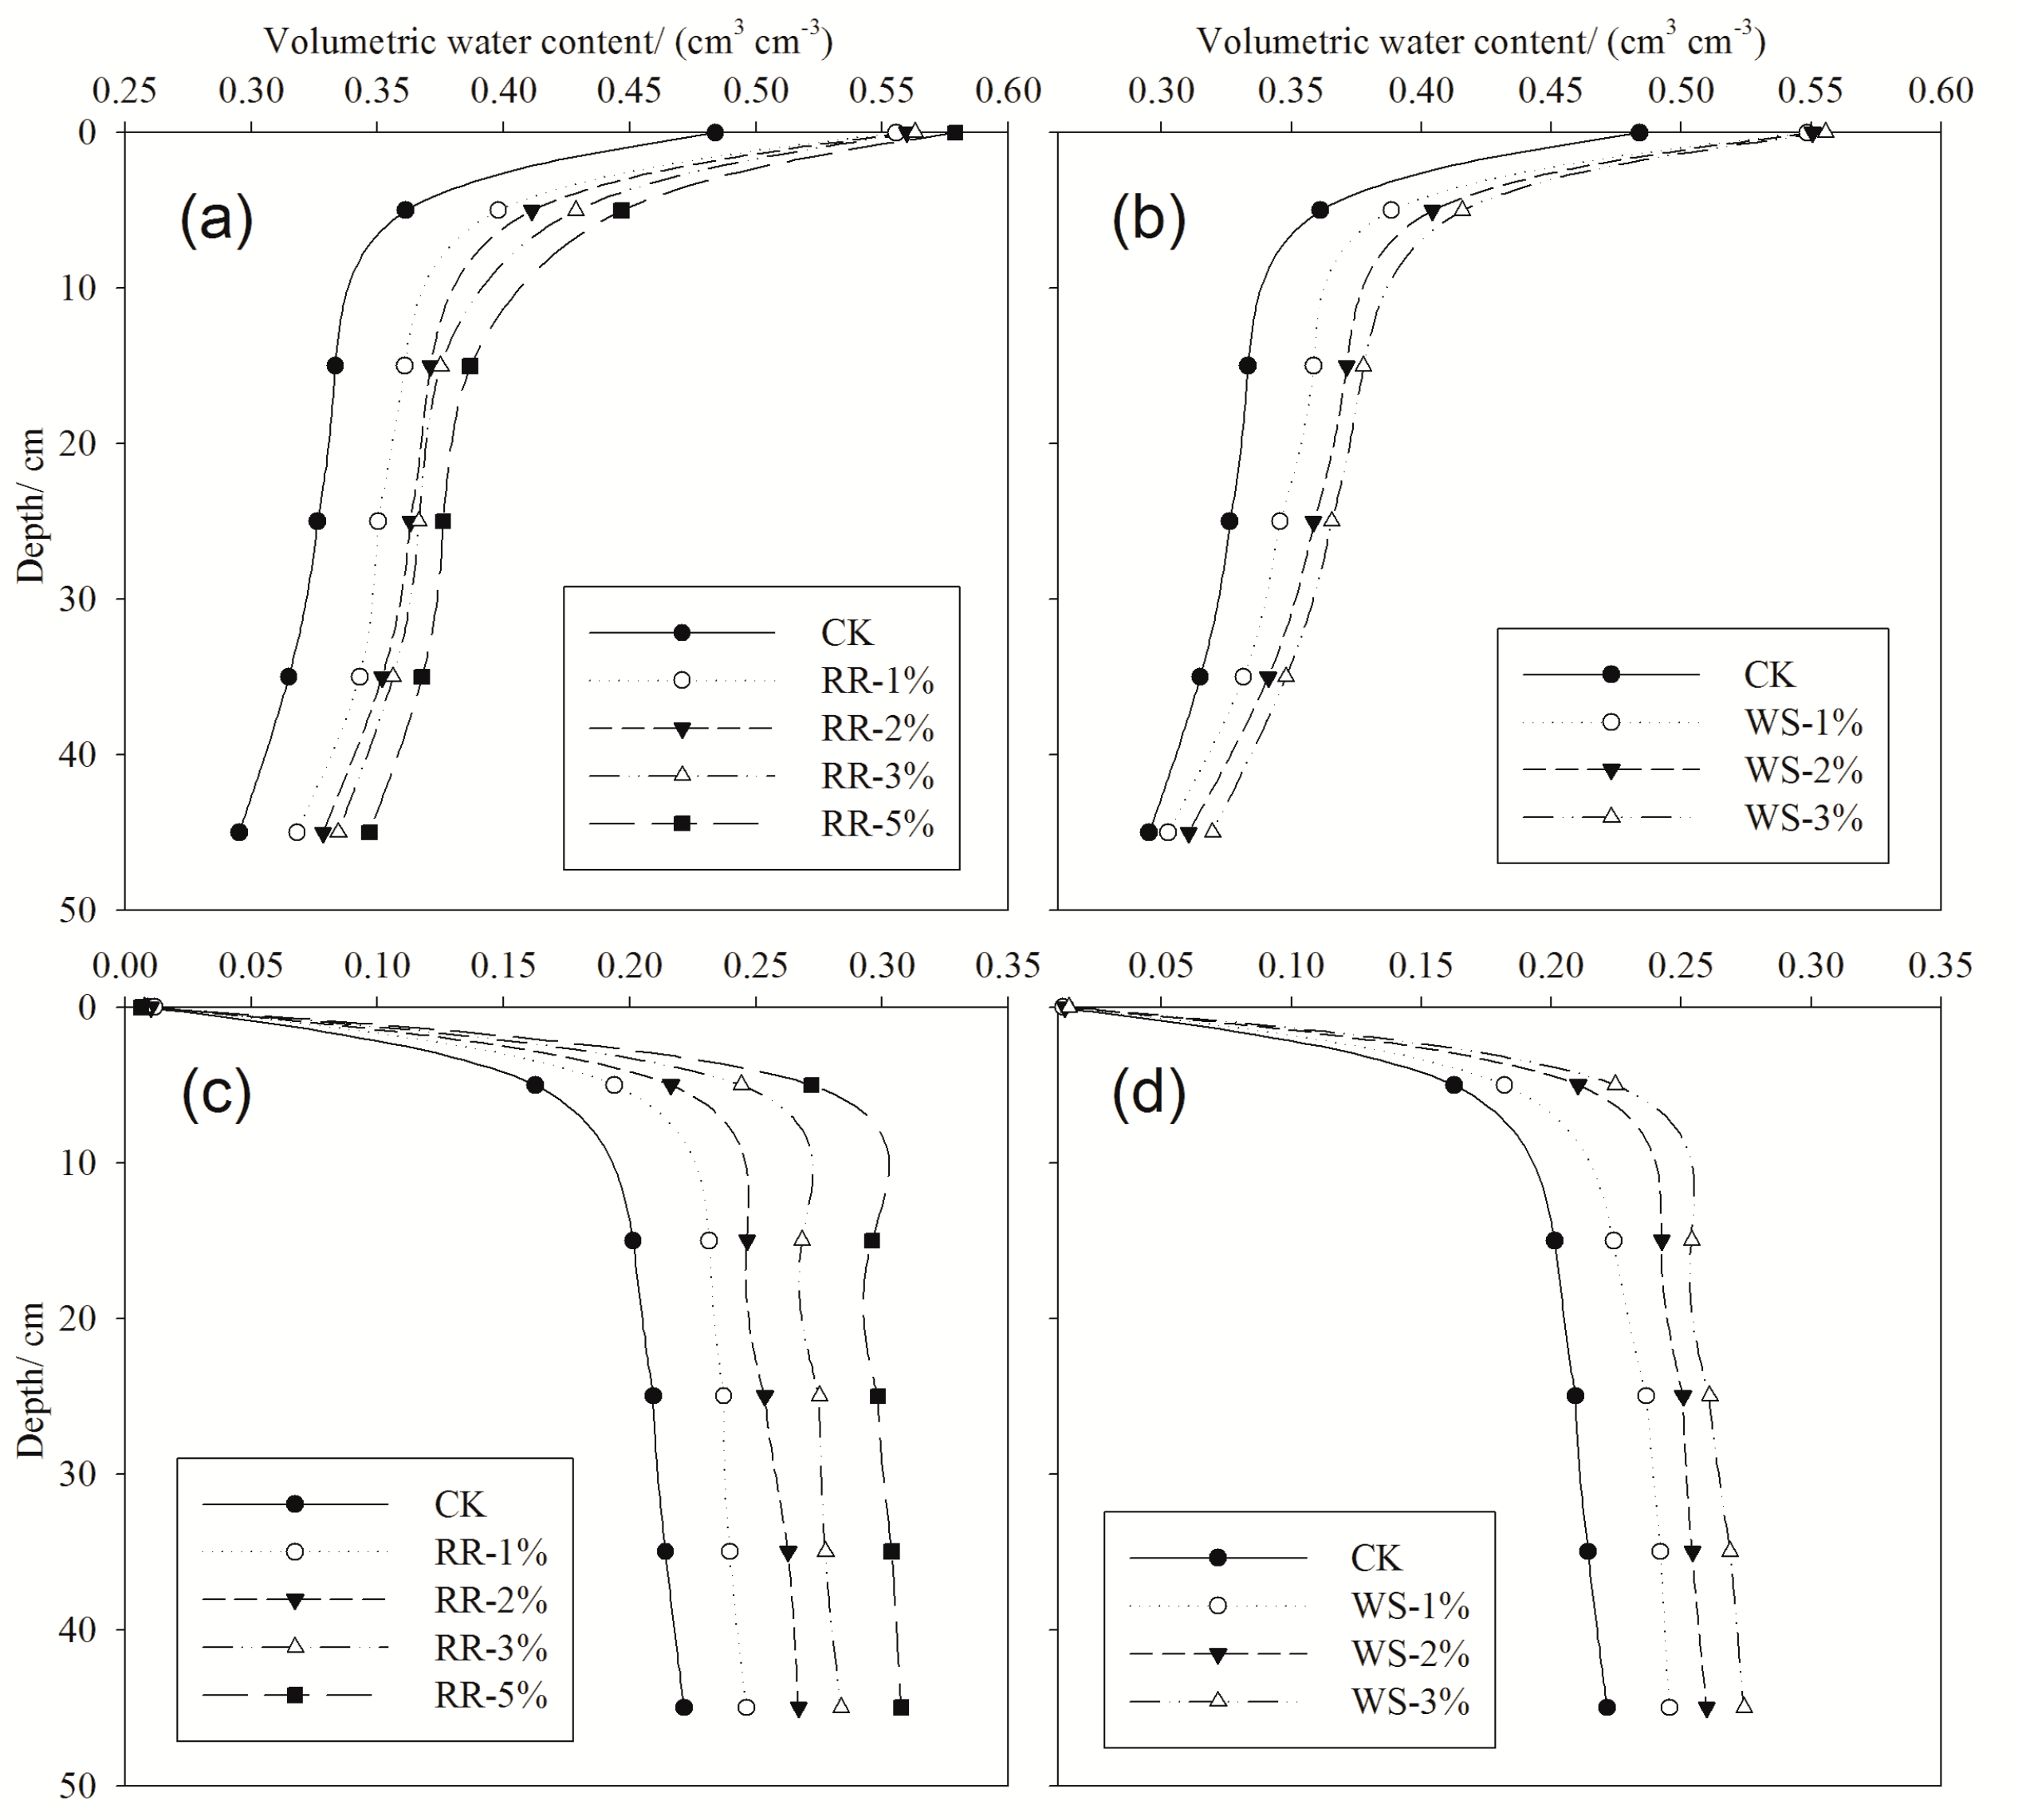
After infiltration, the soil water content decreased with increasing depth, but increased with the amounts of applied RR and WS. The water content of shallow soils was markedly higher than that of deep soils; furthermore, the soil water content decreased rapidly at depths of 0–5 cm, but slowly at depths of 5–45 cm (Figure 4a,b). For the CK, the topsoil volumetric water content was about 0.48 cm3·cm−3, and the average volumetric water content at depths of 5–45 cm was about 0.33 cm3·cm−3. Compared with the CK, the topsoil water content values for RR-1%, RR-2%, RR-3%, and RR-5% were respectively 14.82%, 15.67%, 16.34%, and 19.63% higher (on average), and the average water content amounts at depths of 5–45 cm were 8.50%, 11.87%, 13.97%, and 17.84% higher, respectively; furthermore, the topsoil water content values for WS-1%, WS-2%, and WS-3% were 13.34%, 13.76%, and 14.79% higher (on average) and the corresponding average water contents at depths of 5–45 cm were 5.76%, 9.34%, and 11.84% higher.
After evaporation, topsoil moisture was rapidly lost, resulting in extremely low water content, which caused the topsoil to harden (Figure 4c,d). The water content increased with the depth and amount of applied RR and WS. Furthermore, the soil water content in the 5 cm soil layer was approximately 14–30 times that of the topsoil, but the soil water content increased slowly at depths of 5–45 cm. For the CK, the average volumetric water content at depths of 5–45 cm was about 0.20 cm3·cm−3. Compared with the CK, the average water content values in the 5–45 cm soil layers for RR-1%, RR-2%, RR-3%, and RR-5% were 14.14%, 23.97%, 34.50%, and 47.66% higher, respectively; moreover, the average water content values in the 5–45 cm soil layers for WS-1%, WS-2%, and WS-3% were 12.03%, 21.15%, and 27.64% higher.
The preceding information indicated that RR was more effective than WS at improving soil water content and weakening the ascent and decent of soil water in the soil profiles, resulting in stronger water retention.
3.4. Variability of Vertical Water Distribution Affected by RR and WS
After infiltration, the CV value of the water content in the soil profile was larger for both TRRs and TWSs than for CK (CV = 0.1928), and decreased as the amounts of the soil additives increased. Specifically, the CV values of the water content for RR-1%, RR-2%, RR-3%, and RR-5% were 0.2227, 0.2113, 0.2079, and 0.2064, respectively, and 0.2313, 0.2180, and 0.2115 for WS-1%, WS-2%, and WS-3%. However, after evaporation, the CV values of the water content in the soil profile were smaller for both TRRs and TWSs than for CK (CV = 0.4793). With increases in the amounts of applied soil additives, the CV values of the water content for the soils mixed with RR exhibited increasing tendencies and those with WS exhibited decreasing tendencies. Specifically, the CV values for RR-1%, RR-2%, RR-3%, and RR-5% were 0.4703, 0.4737, 0.4774, and 0.4792, respectively, and the CV values for WS-1%, WS-2%, and WS-3% were 0.4747, 0.4672, and 0.4645, respectively.
This information indicated that both RR and WS generally strengthened the variability of vertical water distribution during infiltration, but weakened it during evaporation.
4. Discussion
4.1. Inhibitory Effect of Additives on Infiltration
The application of RR and WS to soils can effectively reduce accumulative infiltration and infiltration rates, thereby increasing soil moisture and storage capacity in the root zone. This helps to decrease deep percolation and nutrient loss to a large extent, resulting in improved water and fertilizer use efficiency as well as reducing the risk of groundwater pollution. Therefore, applying additives such as RR and WS to soils before seeding has practical benefits.
The water content of soils mixed with additives was higher than that of CK, largely owing to higher saturated water content resulting from RR and WS. The inhibitory effect on infiltration is largely attributed to the following: First, large pores and some medium or small pores in shallow layers are gradually blocked by additives during infiltration, thereby cutting off the infiltrative surface, resulting in lower conductivity. In deeper layers, the number of passages for water penetration decreases because of the soil additives [23], thereby promoting the formation of a dense structure and a moisture-control layer, ultimately preventing infiltration [24]. Second, RR is a type of organic matter, and it therefore causes an increase in the organic matter content in the soil, which is one of the main determinants inducing soil water repellency [25,26]. In addition, soil water repellency has direct and potential adverse impacts on soil hydraulic properties [27]. Therefore, water is prevented from entering soil, resulting in low soil permeability.
The effect of RR on soil may be similar to those of polyglutamic acid (γ-PGA), carboxymethylcellulose, and polyacrylamide [28,29,30,31]. Hydrogel generates in soils after saturation, and further slows water infiltration. Further analysis of the molecular structure of RR is required to elucidate its behavior.
4.2. Water Retention for Soils Mixed with Additives
Surface evaporation is one of the main actions involved in soil water loss. The reduction of surface evaporation has positive effects on the improvement of storage capacity and water use efficiency. Reducing surface evaporation also helps to reduce the risk of the secondary salinization of soil in arid and semiarid regions [32,33]. This study revealed that the water content in the soil profiles for TRRs and TWSs was higher than that for CK, demonstrating the potential of RR and WS for improving water retention. In the present study, the evaporation process began after sample collection and following the infiltration process, which is consistent with actual field situations.
The soil moisture in the vertical profiles at the end of infiltration could be viewed as the initial soil moisture of evaporation. Therefore, a parameter named the water retention coefficient (CWR) was introduced to quantitatively evaluate the soil water-holding capacity, calculated as the soil moisture after evaporation divided by the soil moisture after infiltration. The CWRs at depths of 5–45 cm for RR-1%, RR-2%, RR-3%, and RR-5% were about 0.66, 0.69, 0.73, and 0.77, respectively, and about 0.65, 0.68, and 0.71 for WS-1%, WS-2%, WS-3%. The CWRs of both TRRs and TWSs were larger than that for CK (CWR = 0.63), indicating that RR was more effective than WS in strengthening water retention, and they became more effective with gradual increases in the amounts of additives applied. This is in accordance with previous observations, thereby justifying the use of the parameter CWR for the quantitative evaluation of water retention.
After evaporation, the average gravimetric water content values at depths of 5–45 cm for RR-1%, RR-2%, RR-3%, and RR-5% were 22.97% ± 2.07%, 24.92% ± 2.00%, 26.56% ± 1.26%, and 29.56% ± 2.59%, respectively; for WS-1%, WS-2%, and WS-3%, the values were 22.60% ± 2.59%, 24.35% ± 1.96%, and 25.64% ± 1.94%, respectively. These levels of soil moisture are suitable for crop growth, and confirm that RR and WS reduce evaporation loss.
4.3. Application and Promotion of RR and WS
RR and WS can reduce infiltration; however, they may also prevent rainwater or irrigation water entering into soils to some extent, resulting in low use efficiency of rainwater and irrigation water. Therefore, the application condition of additives requires further clarification.
For soils with more favorable soil moisture states, reduced infiltration could benefit storage capacity and water uptake in the root zone, ultimately improving soil water use efficiency. For soils with poorer soil moisture states, it is necessary to improve infiltration to promote irrigation water infiltration, resulting in high irrigation water use efficiency. Compared with drip irrigation, flood irrigation easily causes water waste. Under such circumstances, additives (e.g., RR and WS) should be applied in deep instead of shallow soil layers to increase the water reserves in the root zone. For drip irrigation, dripper discharge is easily controlled, resulting in a negligible loss of irrigation water. Therefore, additives are effective means for managing crop water uptake. Furthermore, for regions with greater rainfall, applying additives may lead to increasing surface runoff because of weak soil infiltration capacity, resulting in low rainwater utilization. In addition, lower water infiltration may help to alleviate insufficient soil water after rainfall events [16]. This information indicates that, in field operations, overall assessments of soil moisture, regional precipitation, and irrigation mode should be made to determine whether to apply additives to soils.
The present study demonstrated that RR improves water retention and water storage more effectively than WS does (Figure 1, Figure 2, Figure 3 and Figure 4). It can be applied to soil during plowing and can be easily produced without complex or high-cost operations, thus reducing the ratio of agricultural value to cost. Achieving this reduction is a top priority for farmers. Moreover, RR is a byproduct of vegetable oil extraction obtained from crops, and has positive benefits for soil; it enables a considerable decrease in fertilizer use, improving soil quality and reducing environmental pollution. Thus, RR has many potential applications, and could be popularized. During agricultural sustainable development, the usage of plastic film is not encouraged due to its potential pollution risk. RR is a type of organic matter that can act as soil fertilizer; therefore, it is potentially preferable for the improvement of moisture maintenance and soil cultivability. As soil water is a crucial water resource and fundamental for the survival of terrestrial plants [34], RR can promote the increasing stability of vegetated soils, and supporting the farmland crops. They help to reduce surface runoff and soil pollution, which is valuable for developing ecological agriculture [35,36,37]. Furthermore, applying RR into soils benefits root water uptake, which effectively alleviates soil drought. This would increase water use efficiency, further improving the survival rate of vegetation, which is of practical relevance for enhancing the stability of agro-ecosystems [38,39].
5. Conclusions
The selection of a suitable additive has considerable practical significance for cultivated soils when aiming to maximize water retention and water storage.
On the basis of this indoor one-dimensional soil column experiment, it can be concluded that both RR and WS are effective means of conserving soil water and improving water retention. Furthermore, RR was observed to be more effective than WS for infiltration and evaporation suppression, and became more effective as the applied quantity increased. The Kostiakov and Rose models were respectively suitable for describing the infiltration and evaporation processes, owing to a large R2 and NS (very close to 1), and a small CRM (very close to 0) and RRMSE. In the Kostiakov model, a was smaller and n was larger for the soils mixed with additives compared with the corresponding values for CK; moreover, a decreased and n increased with increasing application amounts. In the Rose model, the value of A for soils mixed with additives was smaller than that for CK, and decreased with the increasing application amount.
RR was proven to be more effective than WS in improving the water maintenance based on soil water distribution after infiltration and evaporation. Therefore, the CWR parameter has potential in quantitative evaluations of water retention.
Acknowledgments
This work was financially supported by the 13th Five-Year Plan for the Key Project of Research and Development (grant No. 2016YFC0400203), National Natural Science Foundation of China (grant No. 51279167) and Special Fund for Agro-scientific Research in the Public Interest (grant No. 201503124).
Author Contributions
Xuguang Xing and Xiaoyi Ma conceived and designed the experiments; Xuguang Xing and Yibo Li performed the experiments; Xuguang Xing analyzed the data; Xiaoyi Ma contributed reagents/materials/analysis tools; Xuguang Xing wrote the paper.
Conflicts of Interest
The authors declare no conflict interest.
Abbreviations
| RR | rapeseed-oil residue |
| WS | wheat straw |
| DWF | duration of wetting front reaching the bottom of soil column |
| TRR | treatment mixed with rapeseed-oil residue |
| TWS | treatment mixed with wheat straw |
| CWR | water-retention coefficient |
References
- García, G.M.; Pachepsky, Y.A.; Vereecken, H. Effect of soil hydraulic properties on the relationship between the spatial mean and variability of soil moisture. J. Hydrol. 2014, 516, 154–160. [Google Scholar]
- Hu, W.; Shao, M.; Wan, L.; Si, B. Spatial variability of soil electrical conductivity in a small watershed on the loess plateau of China. Geoderma 2014, 230–231, 212–220. [Google Scholar]
- Glantz, M.H. Drought in Africa. Sci. Am. 1987, 256, 34–40. [Google Scholar] [CrossRef]
- Xing, X.; Ma, X.; Shi, W. Daytime and nighttime groundwater contributions to soils with different surface conditions. Hydrogeol. J. 2015, 23, 1719–1729. [Google Scholar]
- Pernitsky, T.; Hu, W.; Si, B.; Barbour, L. Effects of petroleum hydrocarbon concentration and bulk density on the hydraulic properties of lean oil sand overburden. Can. J. Soil Sci. 2016, 96, 435–446. [Google Scholar]
- Zhao, W.; Yu, P.; Ma, X.; Sheng, J.; Zhou, C. Numerical simulation of soil evaporation with sand mulching and inclusion. Water 2017, 9, 294–303. [Google Scholar]
- Sorrenti, G.; Ventura, M.; Toselli, M. Effect of biochar on nutrient retention and nectarine tree performance: A three-year field trial. J. Plant Nutr. Soil Sci. 2016, 179, 336–346. [Google Scholar] [CrossRef]
- Li, B.; Gao, J.; Wang, X.; Ma, L.; Cui, Q.; Vest, M. Effects of biological soil crusts on water infiltration and evaporation Yanchi Ningxia, Maowusu Desert, China. Int. J. Sediment Res. 2016, 31, 311–323. [Google Scholar] [CrossRef]
- Bezborodov, G.A.; Shadmanov, D.K.; Mirhashimov, R.T.; Yuldashev, T.; Qureshi, A.S.; Noble, A.D.; Qadir, M. Mulching and water quality effects on soil salinity and sodicity dynamics and cotton productivity in central Asia. Agric. Ecosyst. Environ. 2010, 138, 95–102. [Google Scholar] [CrossRef]
- Chen, Y.; Liu, T.; Tian, X.; Wang, X.; Li, M.; Wang, S.; Wang, Z. Effects of plastic film combined with straw mulch on grain yield and water use efficiency of winter wheat in loess plateau. Field Crops Res. 2015, 172, 53–58. [Google Scholar] [CrossRef]
- Li, S.X.; Wang, Z.H.; Li, S.Q.; Gao, Y.J.; Tian, X.H. Effect of plastic sheet mulch, wheat straw mulch, and maize growth on water loss by evaporation in dryland areas of China. Agric. Water Manag. 2012, 116, 39–49. [Google Scholar] [CrossRef]
- Ma, Y.; Li, X. Water accumulation in soil by gravel and sand mulches: Influence of textural composition and thickness of mulch layers. J. Arid Environ. 2011, 75, 432–437. [Google Scholar] [CrossRef]
- Materechera, S.A. Aggregation in a surface layer of a hardsetting and crusting soil as influenced by the application of amendments and grass mulch in a South African semi-arid environment. Soil Tillage Res. 2009, 105, 251–259. [Google Scholar] [CrossRef]
- Qin, Y.; Yi, S.; Chen, J.; Ren, S.; Ding, Y. Effects of gravel on soil and vegetation properties of alpine grassland on the Qinghai-Tibetan plateau. Ecol. Eng. 2015, 74, 351–355. [Google Scholar] [CrossRef]
- Zhang, X.; Zhang, S.; Zhao, H.; Zhu, Q.; Bai, R.; Yang, Y.; Wang, M.; Wang, J.; Wei, C. Effect of HCO3− equation image on rice growth and iron uptake under flood irrigation and drip irrigation with plastic film mulch. J. Plant Nutr. Soil Sci. 2015, 178, 944–952. [Google Scholar] [CrossRef]
- Zhao, Y.; Pang, H.; Wang, J.; Huo, L.; Li, Y. Effects of straw mulch and buried straw on soil moisture and salinity in relation to sunflower growth and yield. Field Crops Res. 2014, 161, 16–25. [Google Scholar] [CrossRef]
- Zhang, Y.; Wang, Q.; Hu, H.; Chen, W.; Wang, X.; Rasaily, R.G. Effect of maize straw mulching on water and soil conservation in sandy soil and loam soil of north China. Trans. Chin. Soc. Agric. Mach. 2016, 47, 138–145, 154. (In Chinese) [Google Scholar]
- Dong, H.; Wang, D.; Wang, Y.; Tong, J.; Liu, T. Spatial and temporal distribution characteristics of mulch residues in cotton field in Shihezi, Xinjiang. J. Arid Land Resour. Environ. 2013, 27, 182–186. (In Chinese) [Google Scholar]
- Wang, Z.; Li, X.; Shi, H.; Sun, M.; Ding, T.; Wang, C. Effects of residual plastic film on soil hydrodynamic parameters and soil structure. Trans. Chin. Soc. Agric. Mach. 2015, 46, 101–106, 140. (In Chinese) [Google Scholar]
- Xing, X.; Liu, Y.; Ma, X. Effects of soil additive on soil-water characteristic curve and soil shrinkage. Adv. Water Sci. 2016, 27, 40–48. (In Chinese) [Google Scholar]
- Liu, Z.; Zhou, W.; Shen, J.; He, P.; Lei, Q.; Liang, G. A simple assessment on spatial variability of rice yield and selected soil chemical properties of paddy fields in South China. Geoderma 2014, 235–236, 39–47. [Google Scholar] [CrossRef]
- Niu, W.; Zou, H.; Liu, J.; Zhang, M.; Lü, W.; Gu, J. Effects of residual plastic film mixed in soil on water infiltration, evaporation and its uncertainty analysis. Trans. Chin. Soc. Agric. Eng. 2016, 32, 110–119. (In Chinese) [Google Scholar]
- He, L.; Fan, G.; Ji, J. Influence of fine particulate matter sneaking into soil on infiltration capacity. J. Irrig. Drain. 2015, 34, 102–104. (In Chinese) [Google Scholar]
- Martin, W.D.; Kaye, N.B.; Putman, B.J. Effects of aggregate masking on soil infiltration under an aggregate bed. J. Irrig. Drain. Eng. 2015, 141, 879–884. [Google Scholar] [CrossRef]
- Wijewardana, N.S.; Müller, K.; Moldrup, P.; Clothier, B.; Komatsu, T.; Hiradate, S.; de Jonge, L.W.; Kawamoto, K. Soil-water repellency characteristic curves for soil profiles with organic carbon gradients. Geoderma 2016, 264, 150–159. [Google Scholar] [CrossRef]
- Zheng, W.; Morris, E.K.; Lehmann, A.; Rillig, M.C. Interplay of soil water repellency, soil aggregation and organic carbon. A meta-analysis. Geoderma 2016, 283, 39–47. [Google Scholar] [CrossRef]
- Diamantopoulos, E.; Durner, W.; Reszkowska, A.; Bachmann, J. Effect of soil water repellency on soil hydraulic properties estimated under dynamic conditions. J. Hydrol. 2013, 486, 175–186. [Google Scholar] [CrossRef]
- Busscher, W.J.; Bjorneberg, D.L.; Sojka, R.E. Field application of PAM as an amendment in deep-tilled us southeastern coastal plain soils. Soil Tillage Res. 2009, 104, 215–220. [Google Scholar] [CrossRef]
- Gonzales, D.; Fan, K.; Sevoian, M. Synthesis and swelling characteristics of a poly (γ-glutamic acid) hydrogel. J. Polym. Sci. Polym. Chem. 1996, 34, 2019–2027. [Google Scholar] [CrossRef]
- Shi, W.; Liang, J.; Tao, W.; Tan, S.; Wang, Q. γ-PGA additive decreasing soil water infiltration and improving water holding capacity. Trans. Chin. Soc. Agric. Eng. 2015, 31, 94–100. (In Chinese) [Google Scholar]
- Tang, J.; Fan, C.; Lin, Q.; Zhou, X. Smooth, stable and optically transparent microcapsules prepared by one-step method using sodium carboxymethyl cellulose as protective colloid. Colloids Surf. A 2014, 459, 65–73. [Google Scholar] [CrossRef]
- He, B.; Cai, Y.; Ran, W.; Jiang, H. Spatial and seasonal variations of soil salinity following vegetation restoration in coastal saline land in eastern China. Catena 2014, 118, 147–153. [Google Scholar] [CrossRef]
- Xing, X.; Ma, X.; Shi, W. Lysimeter observation and model simulation of groundwater evaporation under bare and film-covered ground conditions. Fresenius Environ. Bull. 2016, 25, 1494–1501. [Google Scholar]
- Xing, X.; Kang, D.; Ma, X. Differences in loam water retention and shrinkage behavior: Effects of various types and concentrations of salt ions. Soil Tillage Res. 2017, 167, 61–72. [Google Scholar] [CrossRef]
- Leung, A.K.; Garg, A.; Ng, C.W.W. Effects of plant roots on soi-water retention and induced suction in vegetated soil. Eng. Geol. 2015, 193, 183–197. [Google Scholar] [CrossRef]
- Garg, A.; Ng, C.W.W. Investigation of soil density effect on suction induced due to root water uptake by schefflera heptaphylla. J. Plant Nutr. Soil Sci. 2015, 178, 586–591. [Google Scholar] [CrossRef]
- Garg, A.; Leung, A.K.; Ng, C.W.W. Transpiration reduction and root distribution functions for a non-crop species schefflera heptaphylla. Catena 2015, 135, 78–82. [Google Scholar] [CrossRef]
- Leung, A.K.; Garg, A.; Coo, J.L.; Ng, C.W.W.; Hau, B.C.H. Effects of the roots of cynodon dactylon and schefflera heptaphylla on water infiltration rate and soil hydraulic conductivity. Hydrol. Process. 2015, 29, 3342–3354. [Google Scholar] [CrossRef] [Green Version]
- Ng, C.W.W.; Garg, A.; Leung, A.K.; Hau, B.C.H. Relationships between leaf and root area indices and soil suction induced during drying-wetting cycles. Ecol. Eng. 2016, 91, 113–118. [Google Scholar] [CrossRef] [Green Version]
Figure 1.
Relationship between migration distance of the wetting front and duration with various quantities of applied rapeseed-oil residue (RR) and wheat straw (WS): (a) Represents the treatments mixed with RR; (b) Represents the treatments mixed with WS.
Figure 1.
Relationship between migration distance of the wetting front and duration with various quantities of applied rapeseed-oil residue (RR) and wheat straw (WS): (a) Represents the treatments mixed with RR; (b) Represents the treatments mixed with WS.

Figure 2.
Relationship between accumulative infiltration and duration with various quantities of applied rapeseed-oil residue (RR) and wheat straw (WS): (a) Represents the treatments mixed with RR; (b) Represents the treatments mixed with WS.
Figure 2.
Relationship between accumulative infiltration and duration with various quantities of applied rapeseed-oil residue (RR) and wheat straw (WS): (a) Represents the treatments mixed with RR; (b) Represents the treatments mixed with WS.

Figure 3.
Relationship between accumulative evaporation and duration with various quantities of applied rapeseed-oil residue (RR) and wheat straw (WS): (a) Represents the treatments mixed with RR; (b) Represents the treatments mixed with WS.
Figure 3.
Relationship between accumulative evaporation and duration with various quantities of applied rapeseed-oil residue (RR) and wheat straw (WS): (a) Represents the treatments mixed with RR; (b) Represents the treatments mixed with WS.
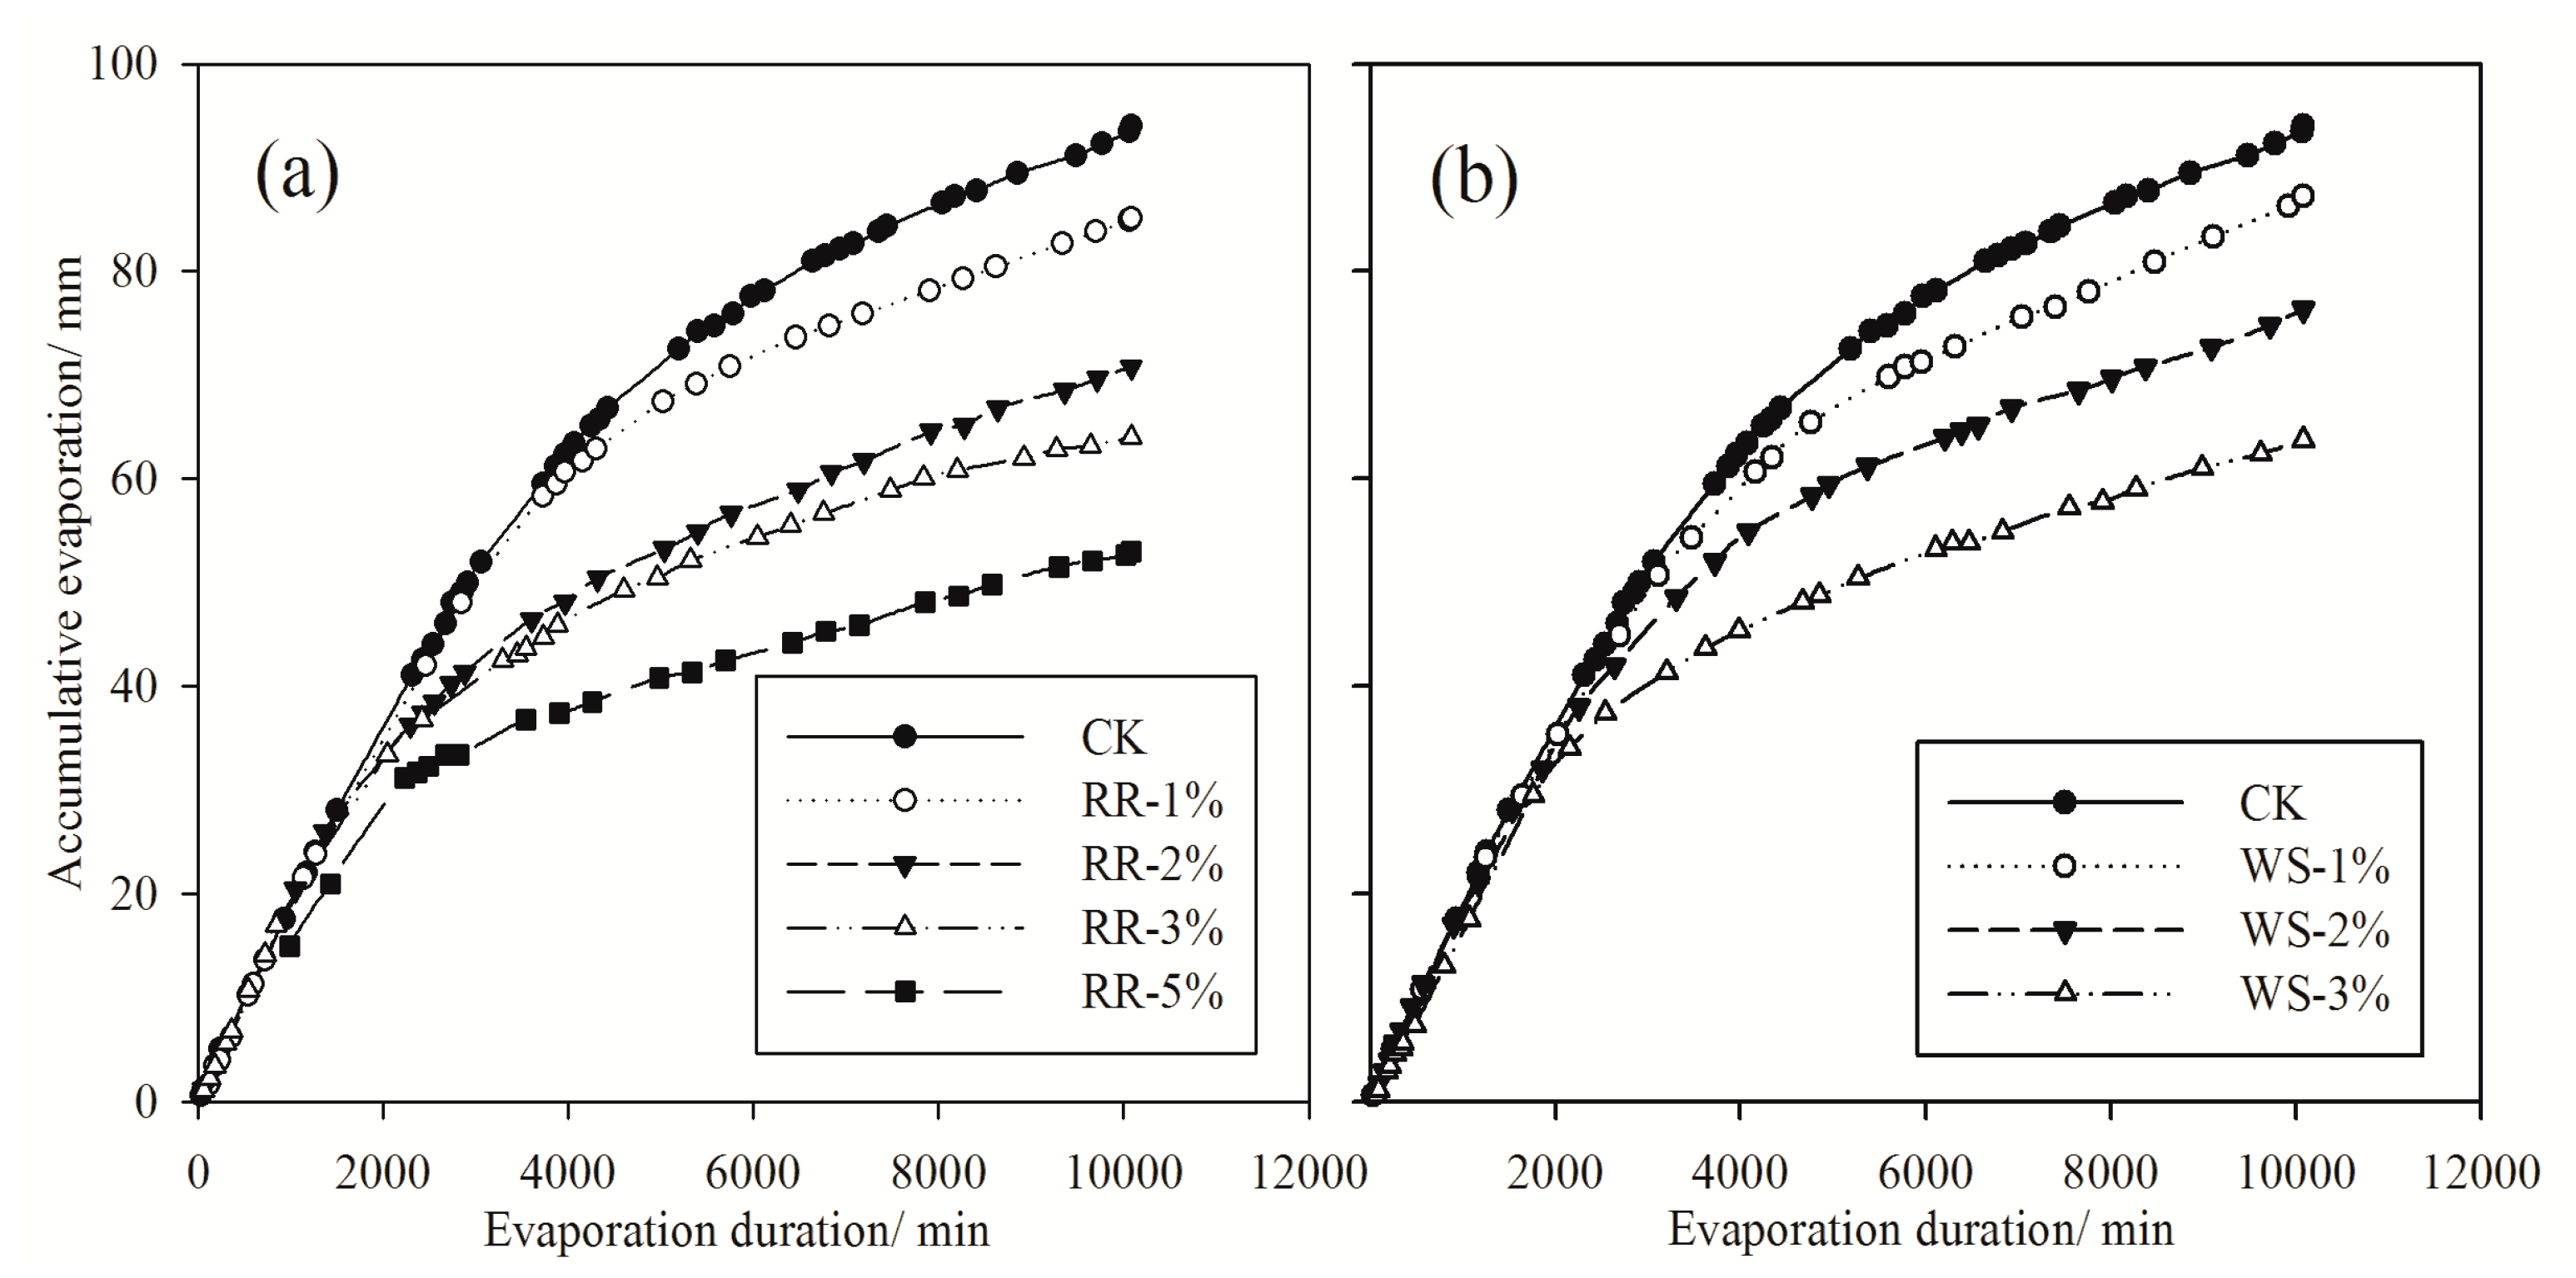
Figure 4.
Soil water distribution for each treatment after infiltration and evaporation: (a) Represents the water distribution after infiltration for the treatments mixed with RR; (b) Represents the water distribution after infiltration for the treatments mixed with WS; (c) Represents the water distribution after evaporation for the treatments mixed with RR; (d) Represents the water distribution after evaporation for the treatments mixed with WS.


Table 1.
Fitting parameters and error analysis of the relationship between wetting front migration distance (F) and infiltration duration (t) (described as F = a·tb).
Table 1.
Fitting parameters and error analysis of the relationship between wetting front migration distance (F) and infiltration duration (t) (described as F = a·tb).
| Treatments | a | b | R2 | RRMSE | CRM | NS |
|---|---|---|---|---|---|---|
| CK | 2.29 | 0.49 | 0.9993 | 0.0214 | 0.0037 | 0.9987 |
| RR-1% | 1.71 | 0.50 | 0.9988 | 0.0362 | 0.0040 | 0.9969 |
| RR-2% | 1.74 | 0.47 | 0.9975 | 0.0674 | 0.0078 | 0.9899 |
| RR-3% | 1.72 | 0.47 | 0.9976 | 0.0652 | 0.0087 | 0.9909 |
| RR-5% | 1.57 | 0.46 | 0.9952 | 0.0730 | 0.0089 | 0.9895 |
| WS-1% | 2.30 | 0.47 | 0.9950 | 0.0785 | 0.0156 | 0.9844 |
| WS-2% | 1.96 | 0.47 | 0.9986 | 0.0132 | 0.0018 | 0.9996 |
| WS-3% | 2.04 | 0.45 | 0.9946 | 0.0446 | 0.0099 | 0.9953 |
Table 2.
Error analysis of Philip, Kostiakov, Gardner, and Rose models.
| Treatments | Philip/Kostiakov Model | Gardner/Rose Model | ||||||
|---|---|---|---|---|---|---|---|---|
| R2 | RRMSE | CRM | NS | R2 | RRMSE | CRM | NS | |
| CK | 0.9993 (0.9990) | 0.0344 (0.0184) | 0.0159 (0.0018) | 0.9963 (0.9989) | 0.9755 (0.9670) | 0.0718 (0.0658) | −0.0159 (−0.0103) | 0.9672 (0.9724) |
| RR-1% | 0.9971 (0.9979) | 0.0863 (0.0305) | 0.0608 (0.0045) | 0.9822 (0.9978) | 0.9785 (0.9712) | 0.1233 (0.1202) | −0.0384 (−0.0311) | 0.9600 (0.9619) |
| RR-2% | 0.9953 (0.9987) | 0.2616 (0.0272) | 0.1665 (0.0025) | 0.8793 (0.9987) | 0.9852 (0.9929) | 0.0422 (0.0331) | 0.0024 (−0.0021) | 0.9847 (0.9906) |
| RR-3% | 0.9969 (0.9986) | 0.1590 (0.0282) | 0.1017 (0.0035) | 0.9535 (0.9985) | 0.9837 (0.9776) | 0.0836 (0.0835) | −0.0200 (−0.0215) | 0.9772 (0.9773) |
| RR-5% | 0.9912 (0.9949) | 0.2353 (0.0596) | 0.1571 (0.0142) | 0.9066 (0.9940) | 0.9785 (0.9864) | 0.0693 (0.0266) | 0.0168 (0.0023) | 0.9064 (0.9863) |
| WS-1% | 0.9986 (0.9995) | 0.1927 (0.0148) | 0.1262 (−0.0012) | 0.9183 (0.9995) | 0.9808 (0.9749) | 0.0781 (0.0746) | −0.0152 (−0.0080) | 0.9634 (0.9666) |
| WS-2% | 0.9990 (0.9984) | 0.0353 (0.0263) | 0.0162 (0.0042) | 0.9969 (0.9983) | 0.9846 (0.9791) | 0.1039 (0.1011) | −0.0332 (−0.0244) | 0.9701 (0.9717) |
| WS-3% | 0.9987 (0.9997) | 0.1231 (0.0123) | 0.0780 (0.0021) | 0.9710 (0.9997) | 0.9789 (0.9766) | 0.1174 (0.1170) | −0.0346 (−0.0311) | 0.9665 (0.9667) |
Note: The figures outside brackets are the error results of the Philip (four left columns) and Gardner (four right columns) models; the figures inside brackets are the error results of the Kostiakov (four left columns) and Rose (four right columns) models.
Table 3.
Parameters in Kostiakov and Rose models for different treatments.
| Treatments | Kostiakov Model | Rose Model | ||
|---|---|---|---|---|
| a | n | A | B (×10−3) | |
| CK | 1.176 | 0.469 | 0.8353 | 1.60 |
| RR-1% | 0.645 | 0.520 | 0.7986 | 0.80 |
| RR-2% | 0.448 | 0.545 | 0.7004 | 0.20 |
| RR-3% | 0.394 | 0.560 | 0.6288 | 0.50 |
| RR-5% | 0.340 | 0.580 | 0.5517 | 0.20 |
| WS-1% | 0.883 | 0.501 | 0.8147 | 0.90 |
| WS-2% | 0.651 | 0.512 | 0.7170 | 0.80 |
| WS-3% | 0.460 | 0.543 | 0.6364 | 0.40 |
© 2017 by the authors. Licensee MDPI, Basel, Switzerland. This article is an open access article distributed under the terms and conditions of the Creative Commons Attribution (CC BY) license (http://creativecommons.org/licenses/by/4.0/).
Share and Cite
MDPI and ACS Style
Xing, X.; Li, Y.; Ma, X. Effects on Infiltration and Evaporation When Adding Rapeseed-Oil Residue or Wheat Straw to a Loam Soil. Water 2017, 9, 700. https://doi.org/10.3390/w9090700
AMA Style
Xing X, Li Y, Ma X. Effects on Infiltration and Evaporation When Adding Rapeseed-Oil Residue or Wheat Straw to a Loam Soil. Water. 2017; 9(9):700. https://doi.org/10.3390/w9090700
Chicago/Turabian StyleXing, Xuguang, Yibo Li, and Xiaoyi Ma. 2017. "Effects on Infiltration and Evaporation When Adding Rapeseed-Oil Residue or Wheat Straw to a Loam Soil" Water 9, no. 9: 700. https://doi.org/10.3390/w9090700
Note that from the first issue of 2016, this journal uses article numbers instead of page numbers. See further details here.