A Novel Calendar-Based Method for Visualizing Water Quality Change: The Case of the Yangtze River 2006–2015


Abstract
:1. Introduction
2. Materials and Methods
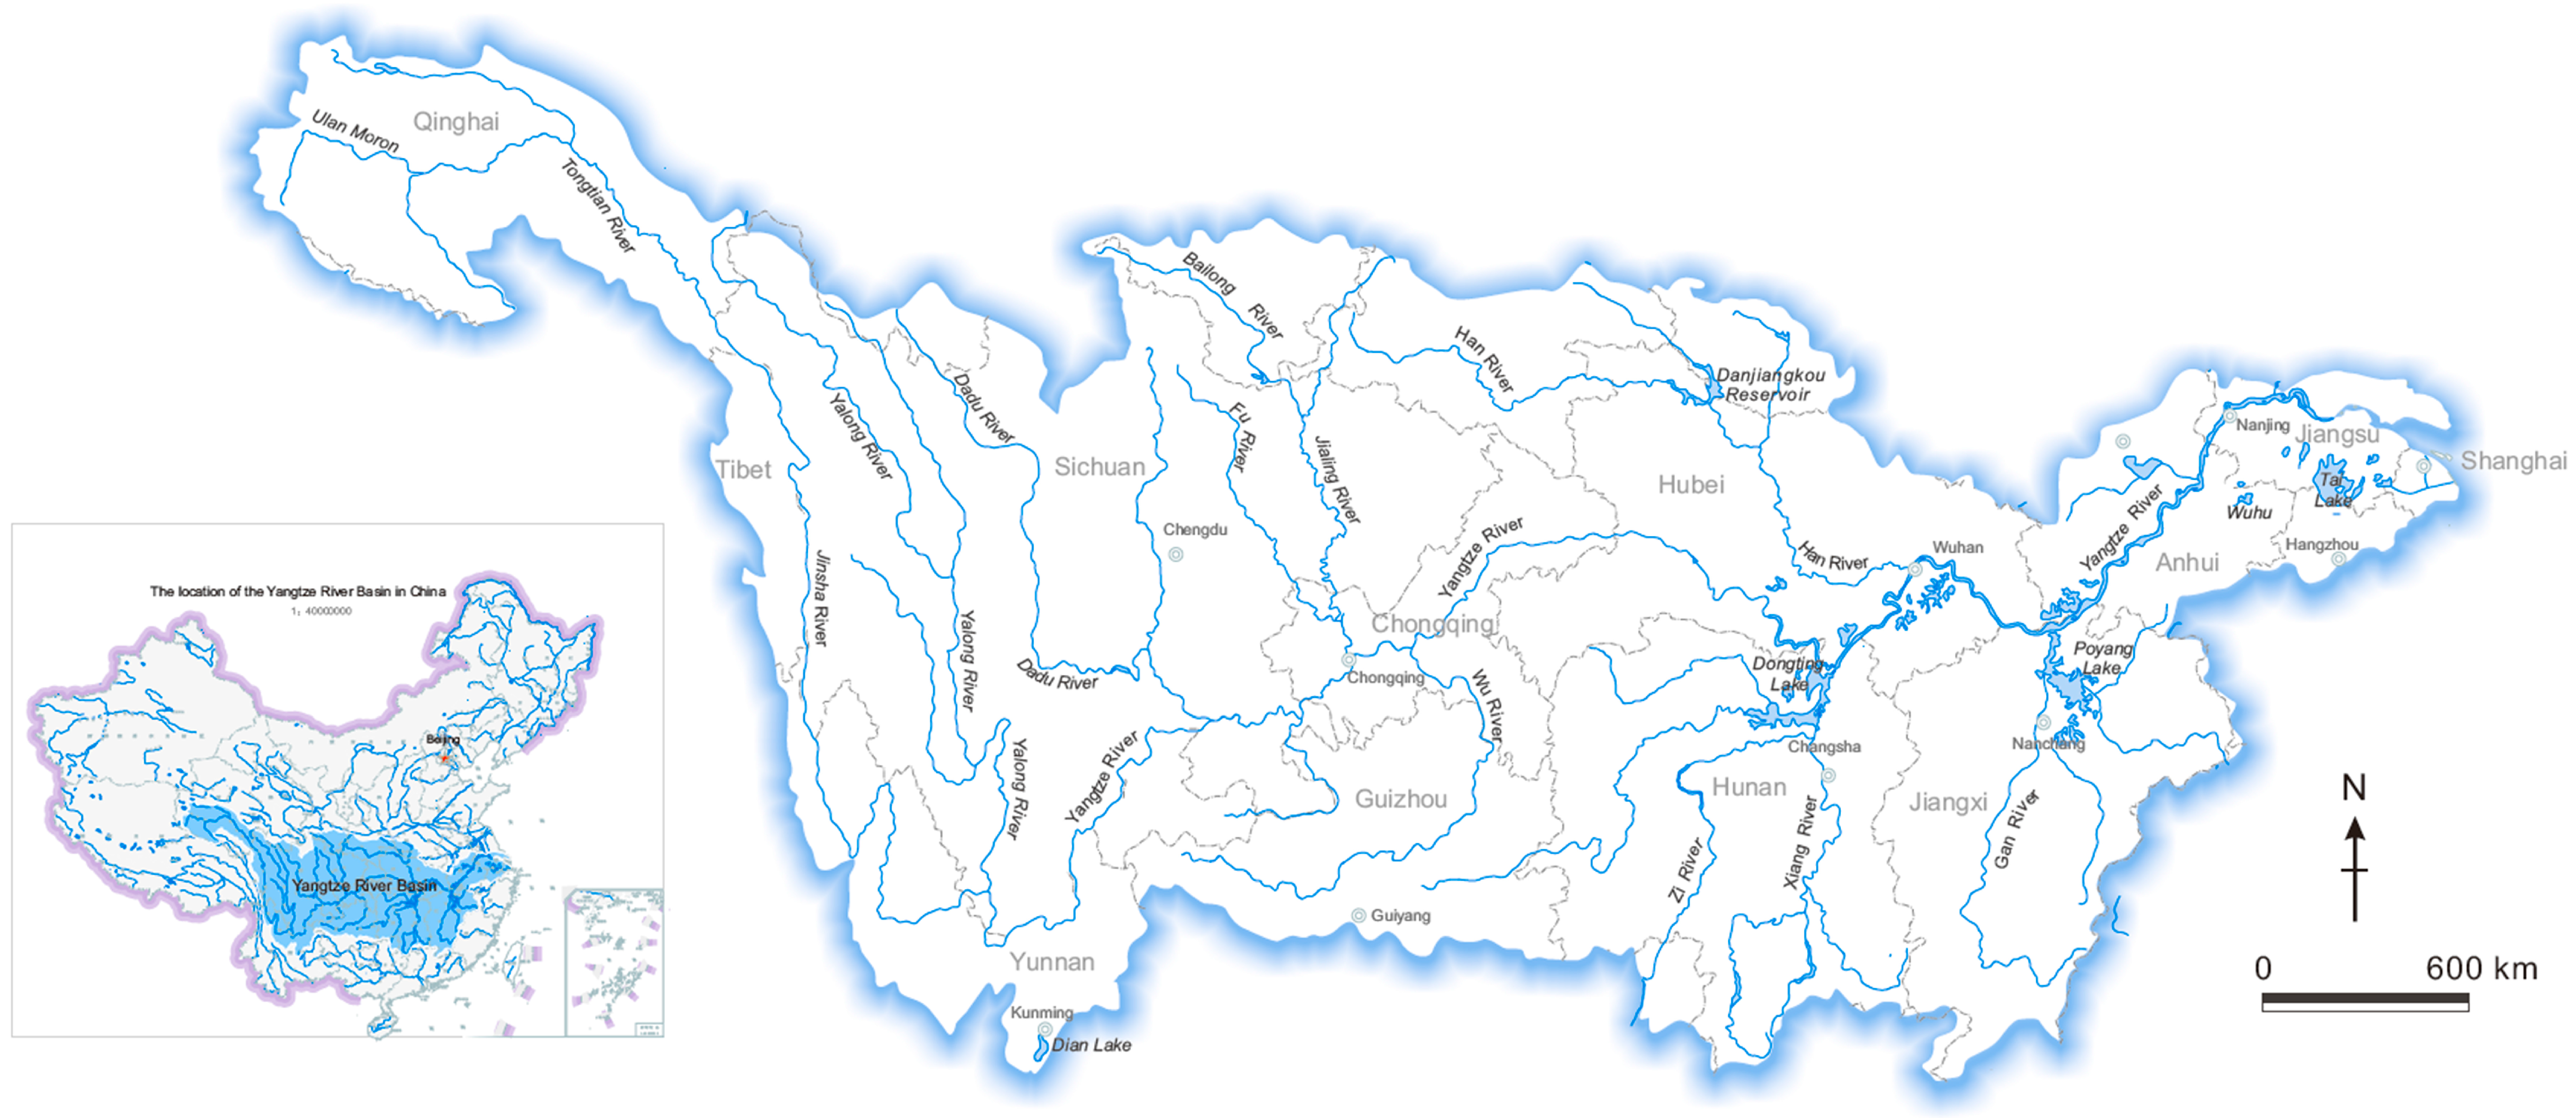
2.1. Materials
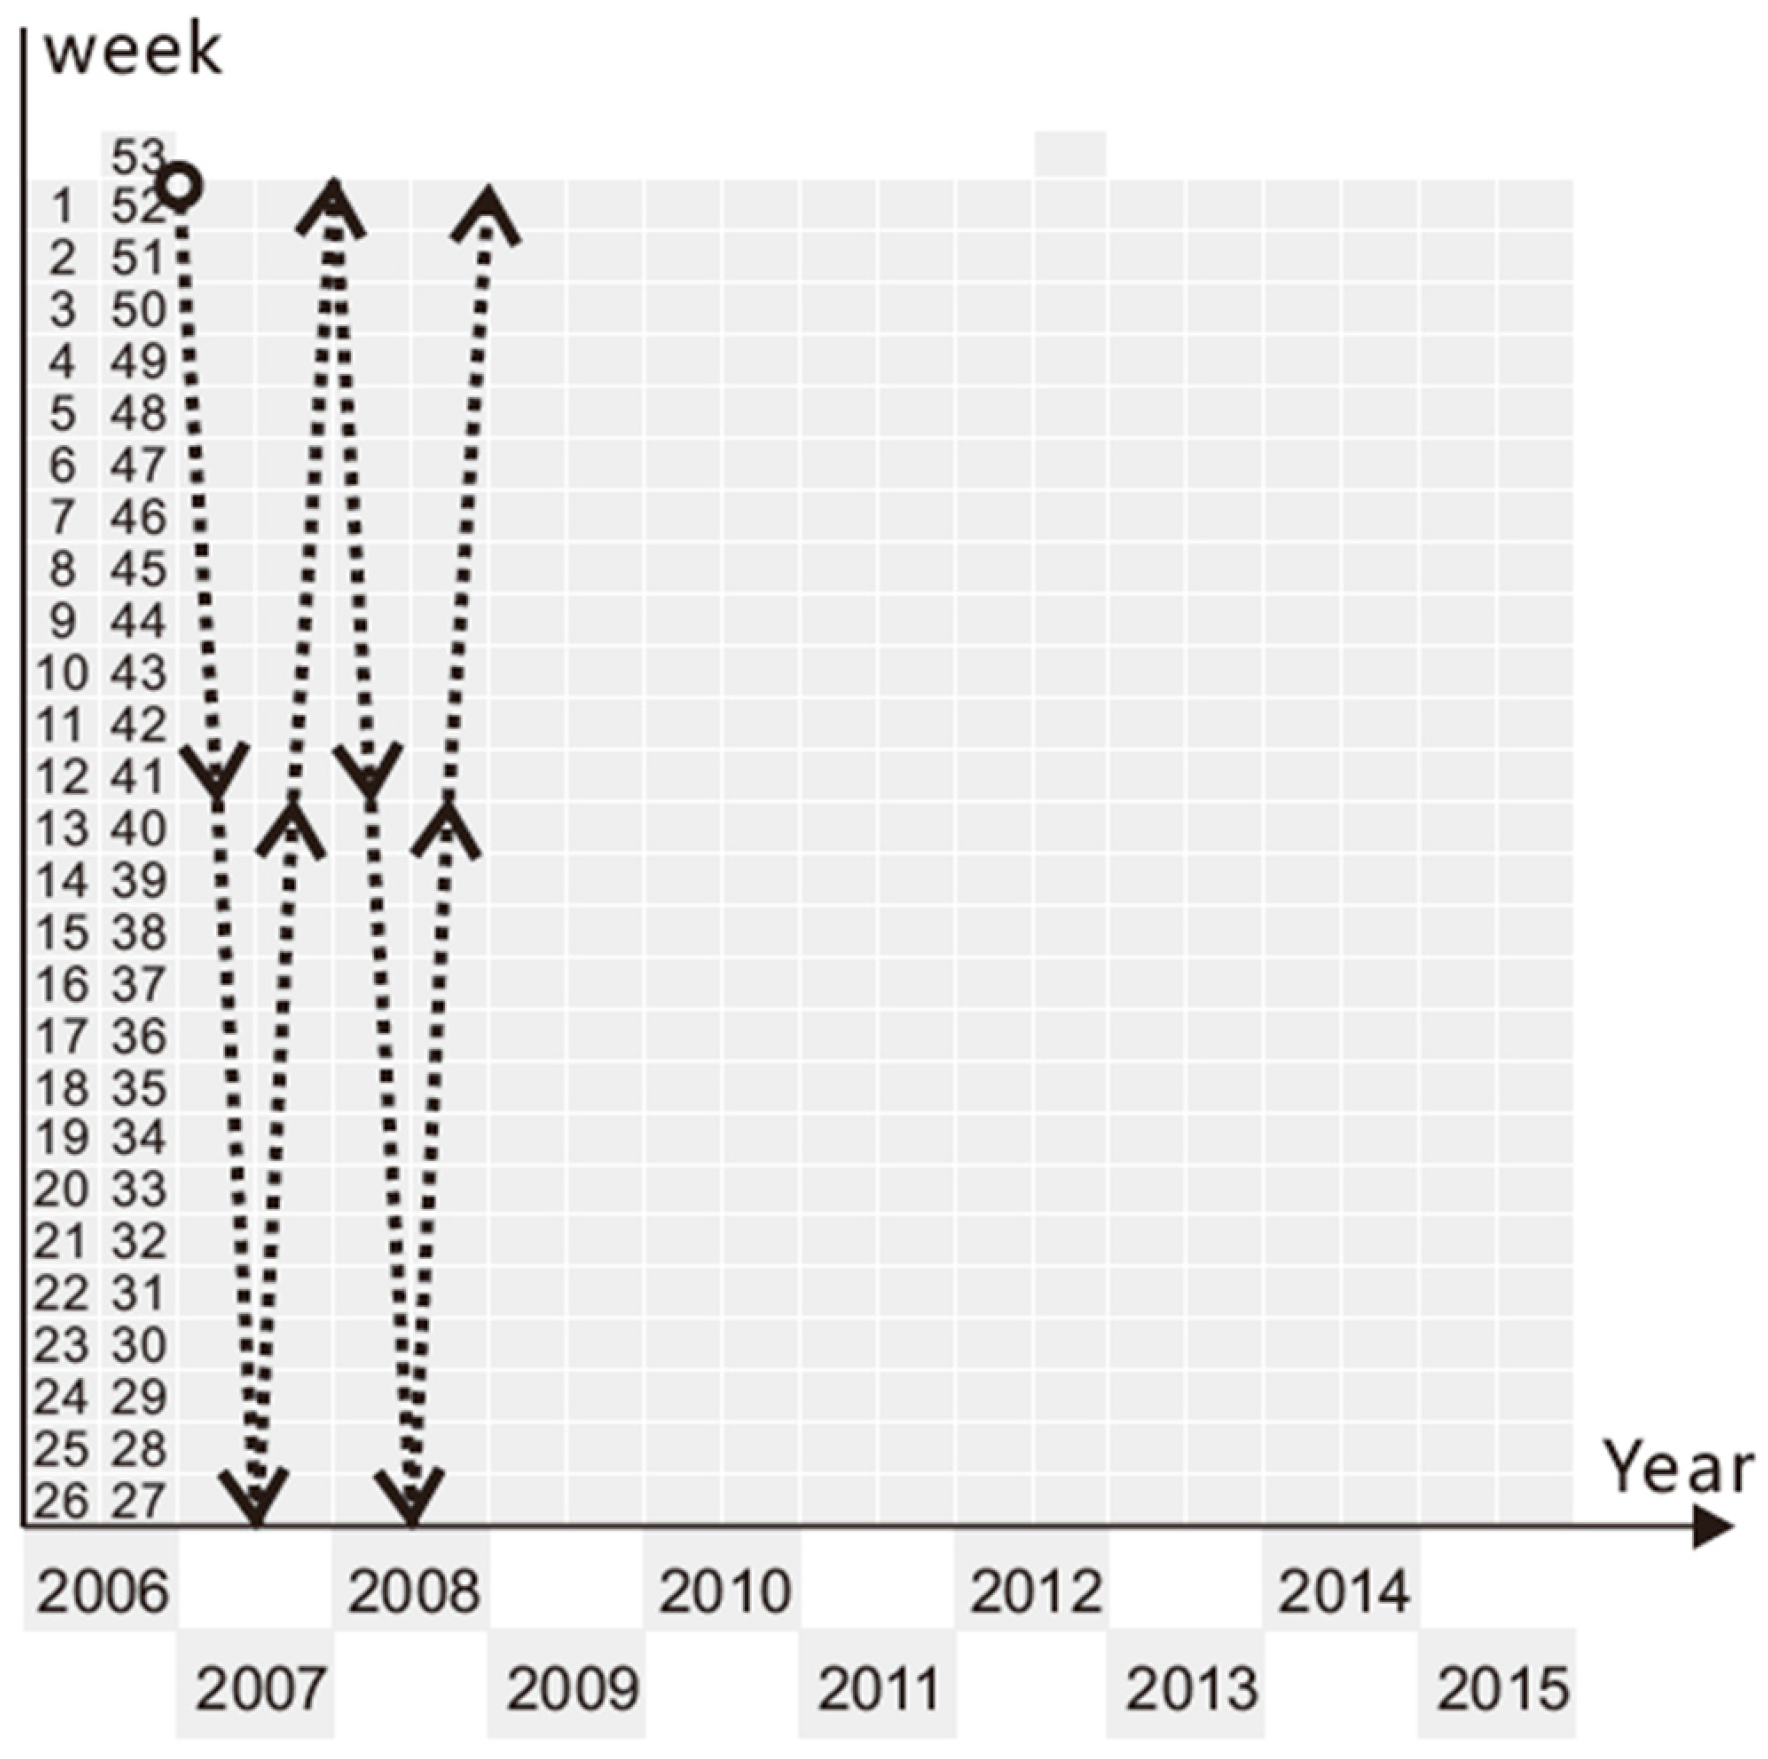
2.2. Calendar Construction
2.3. Rendering Rule
3. Results and Discussion
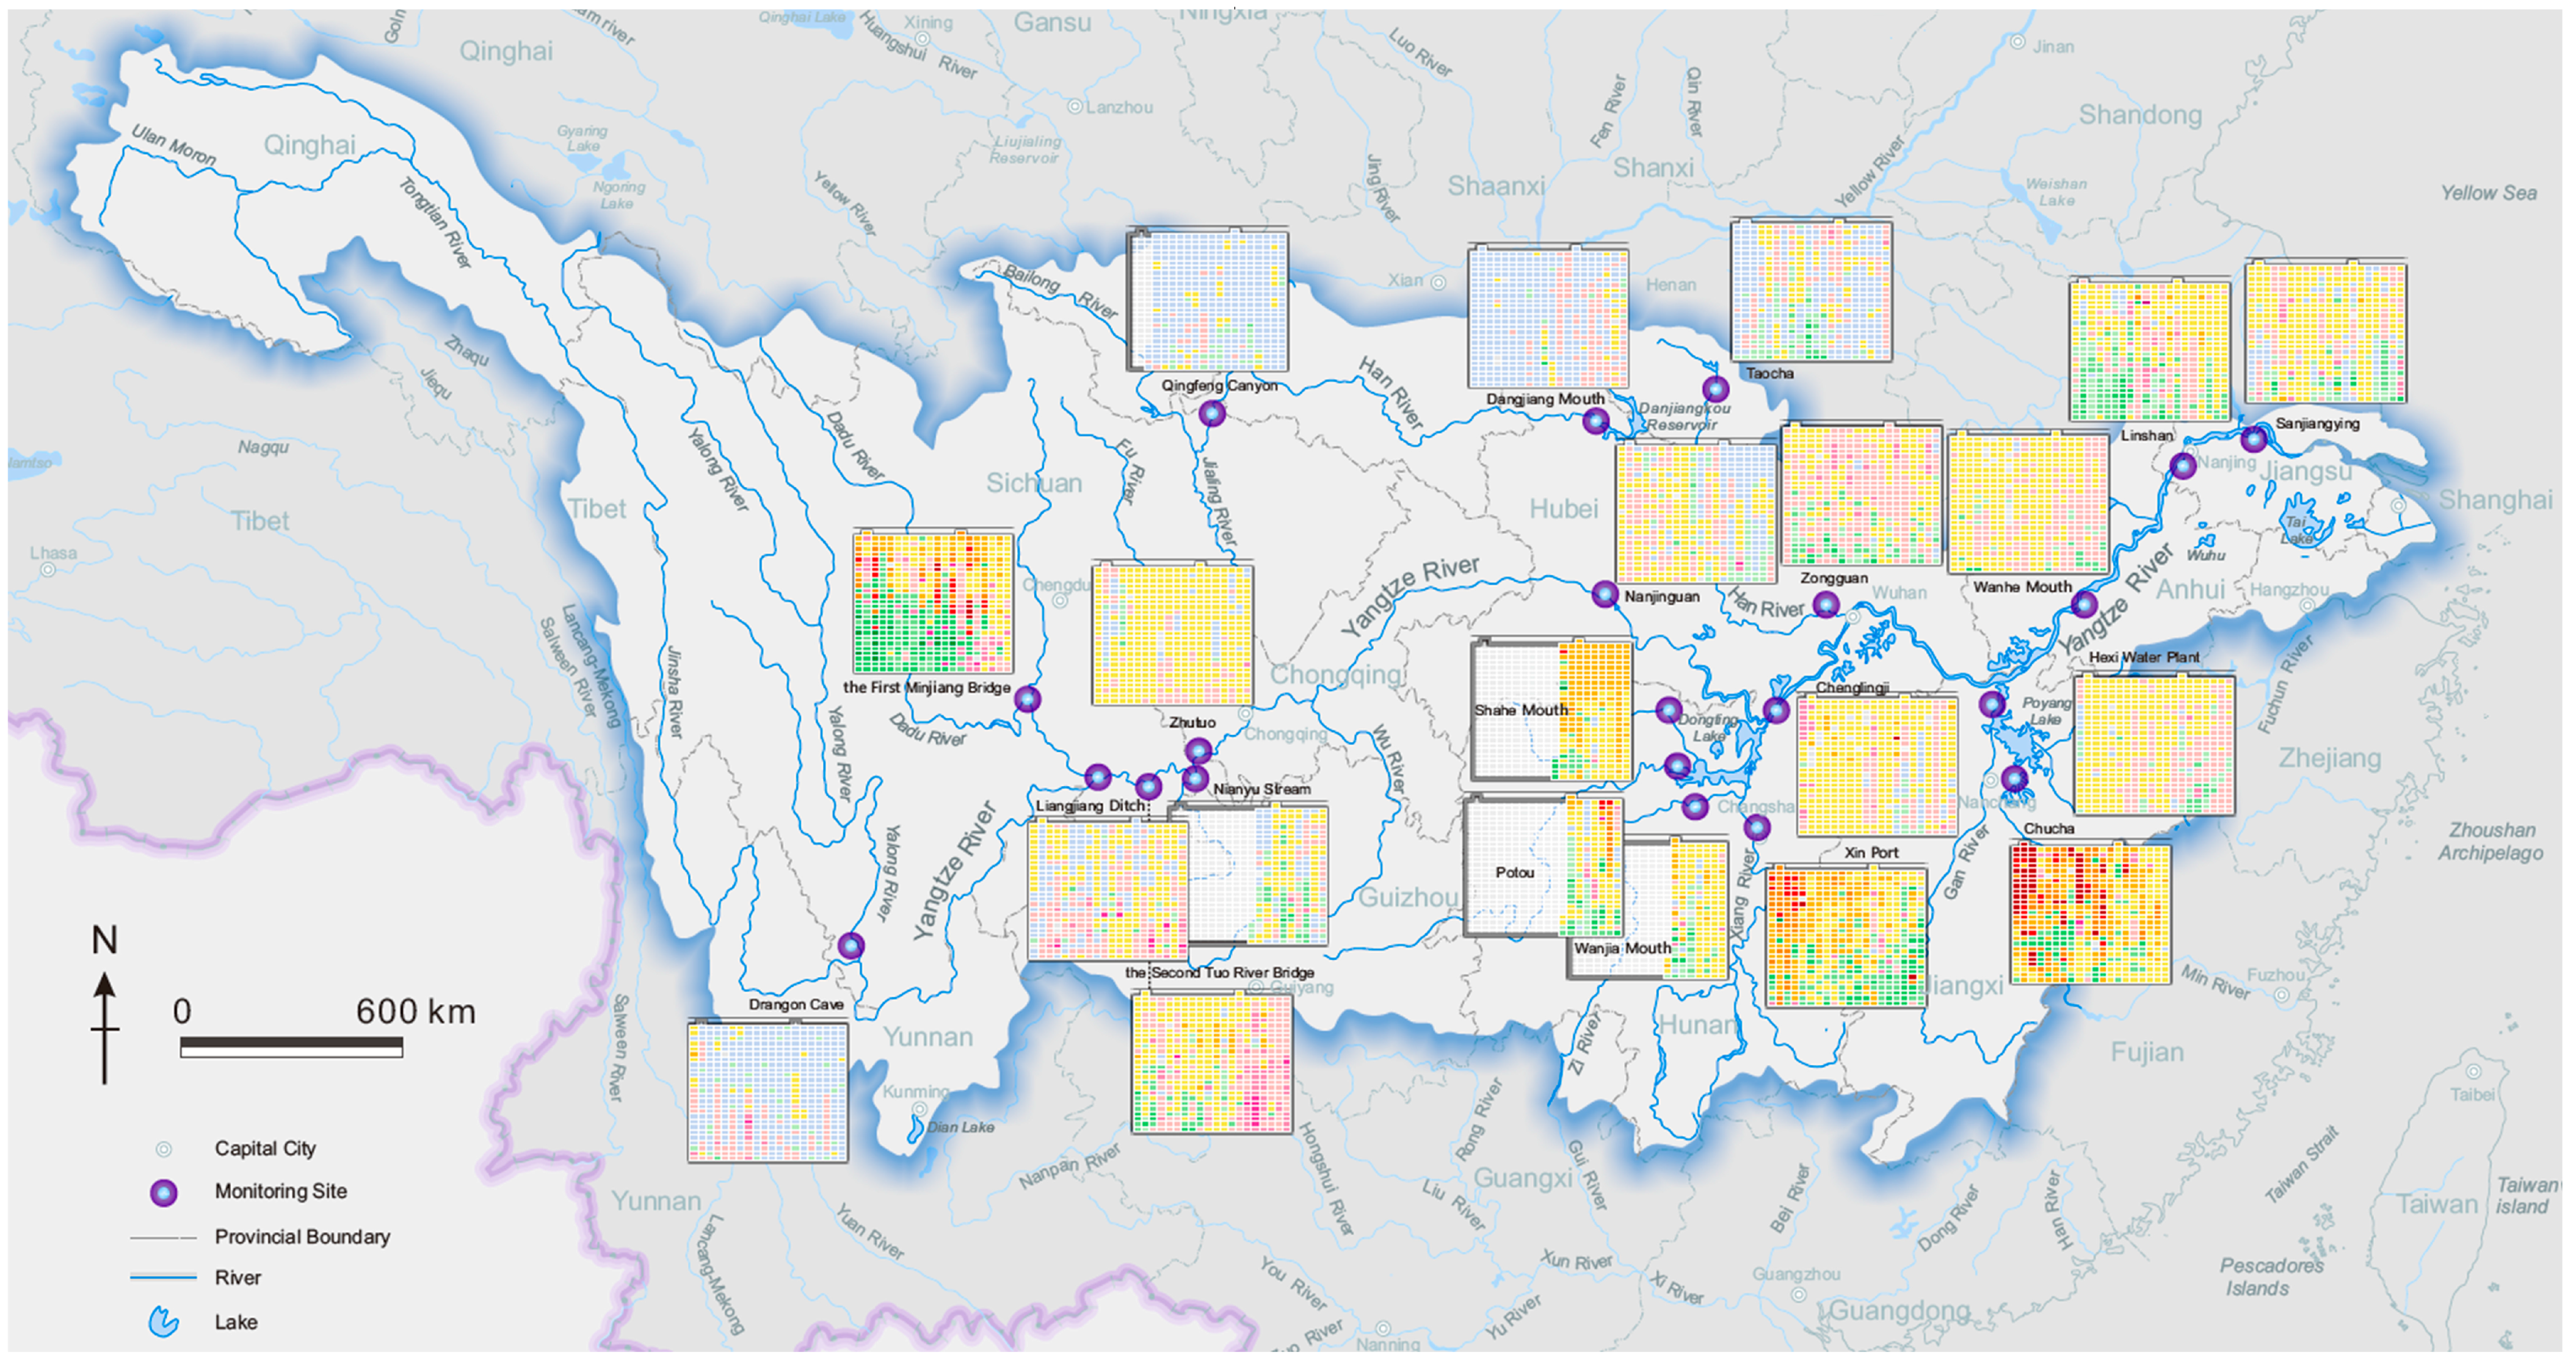
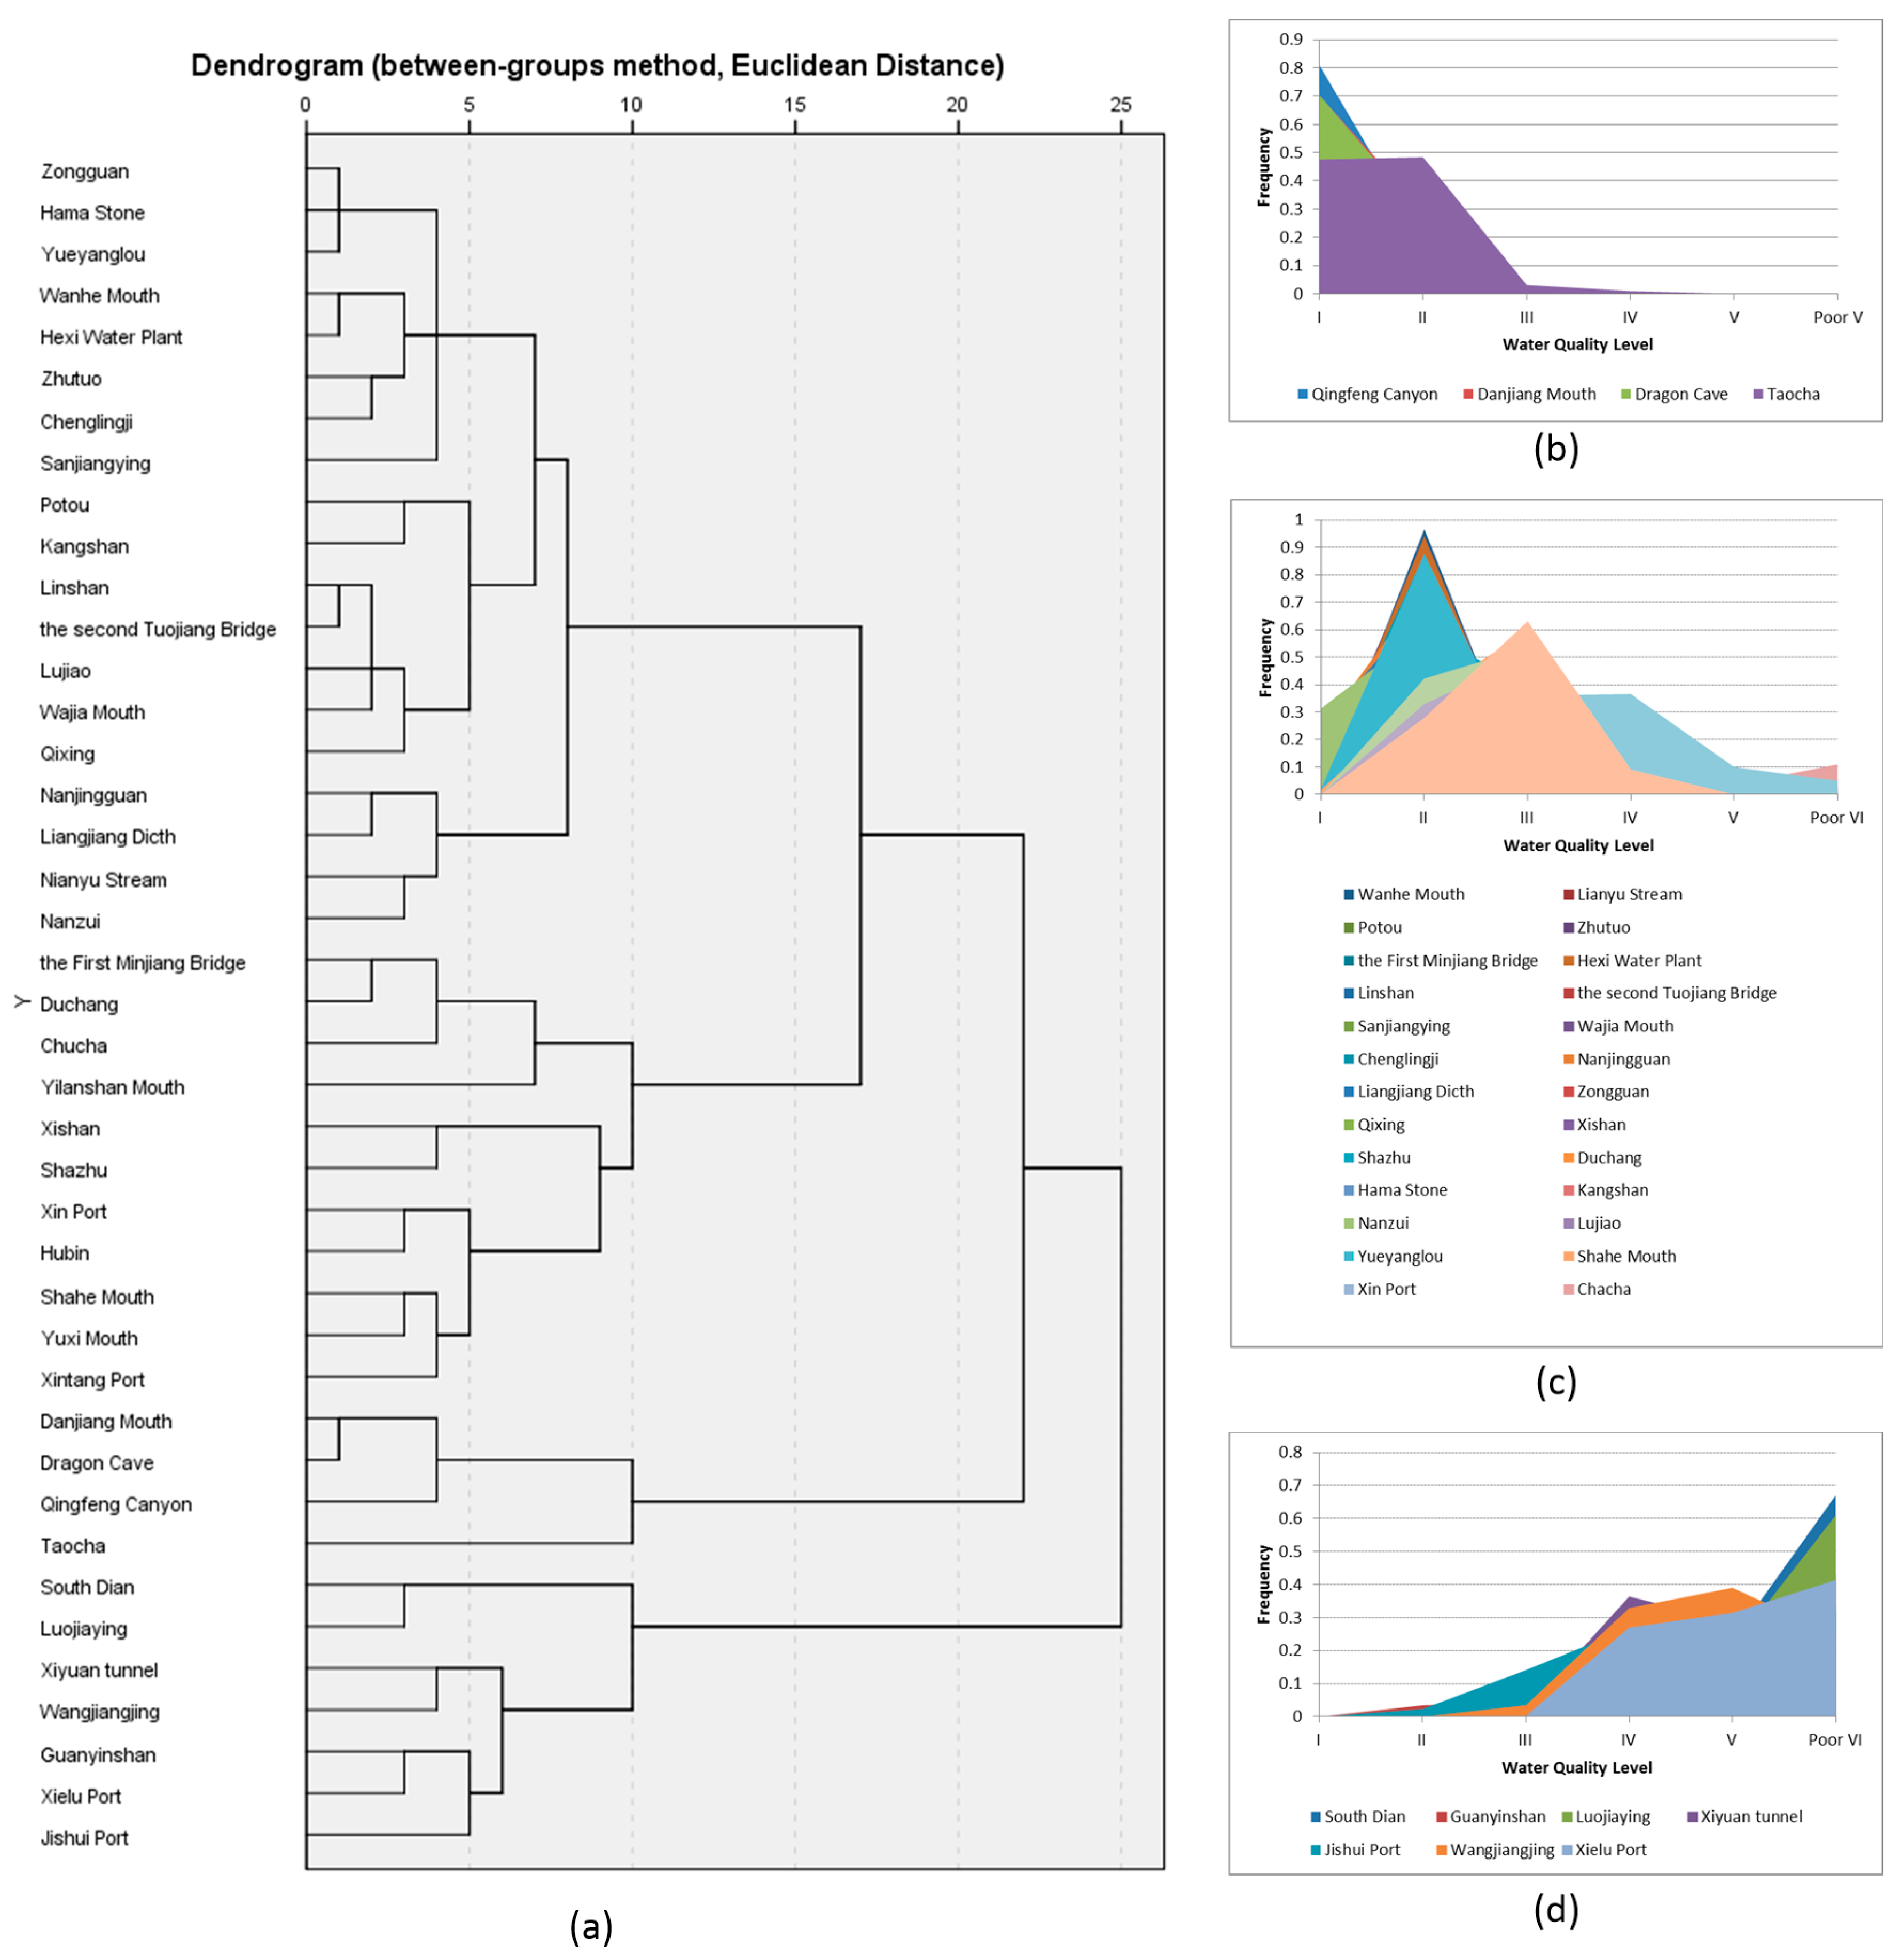
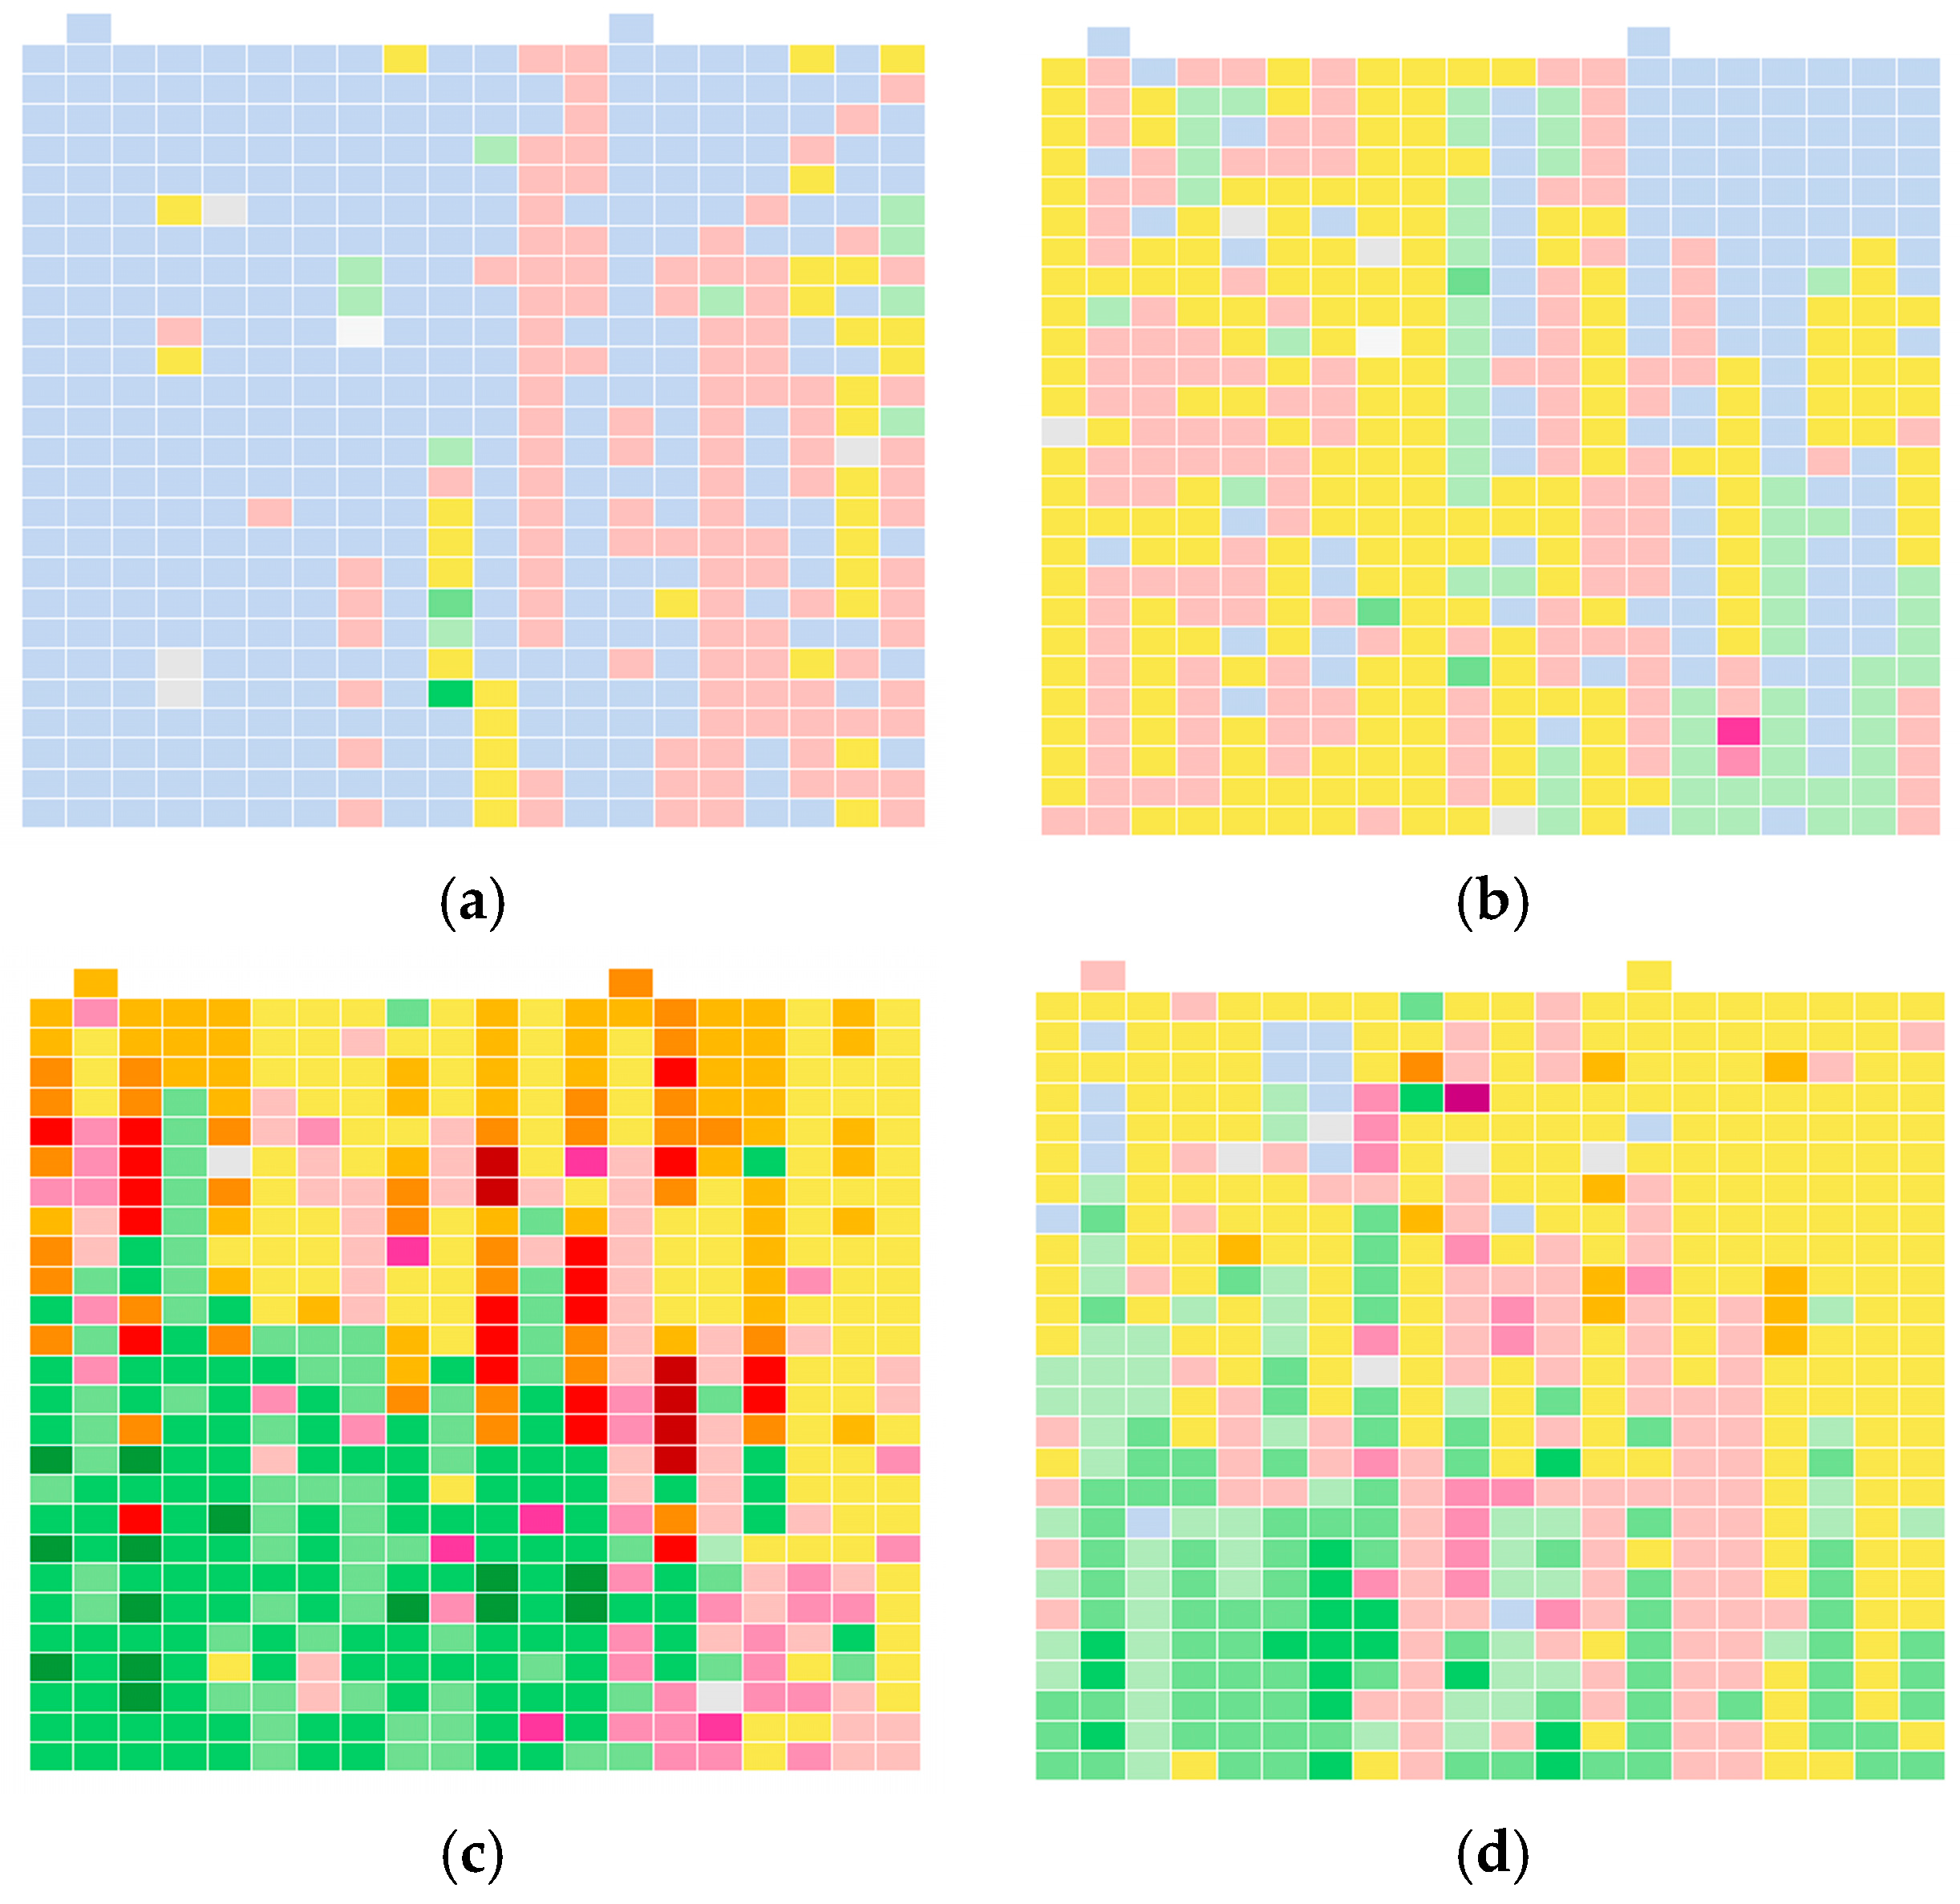
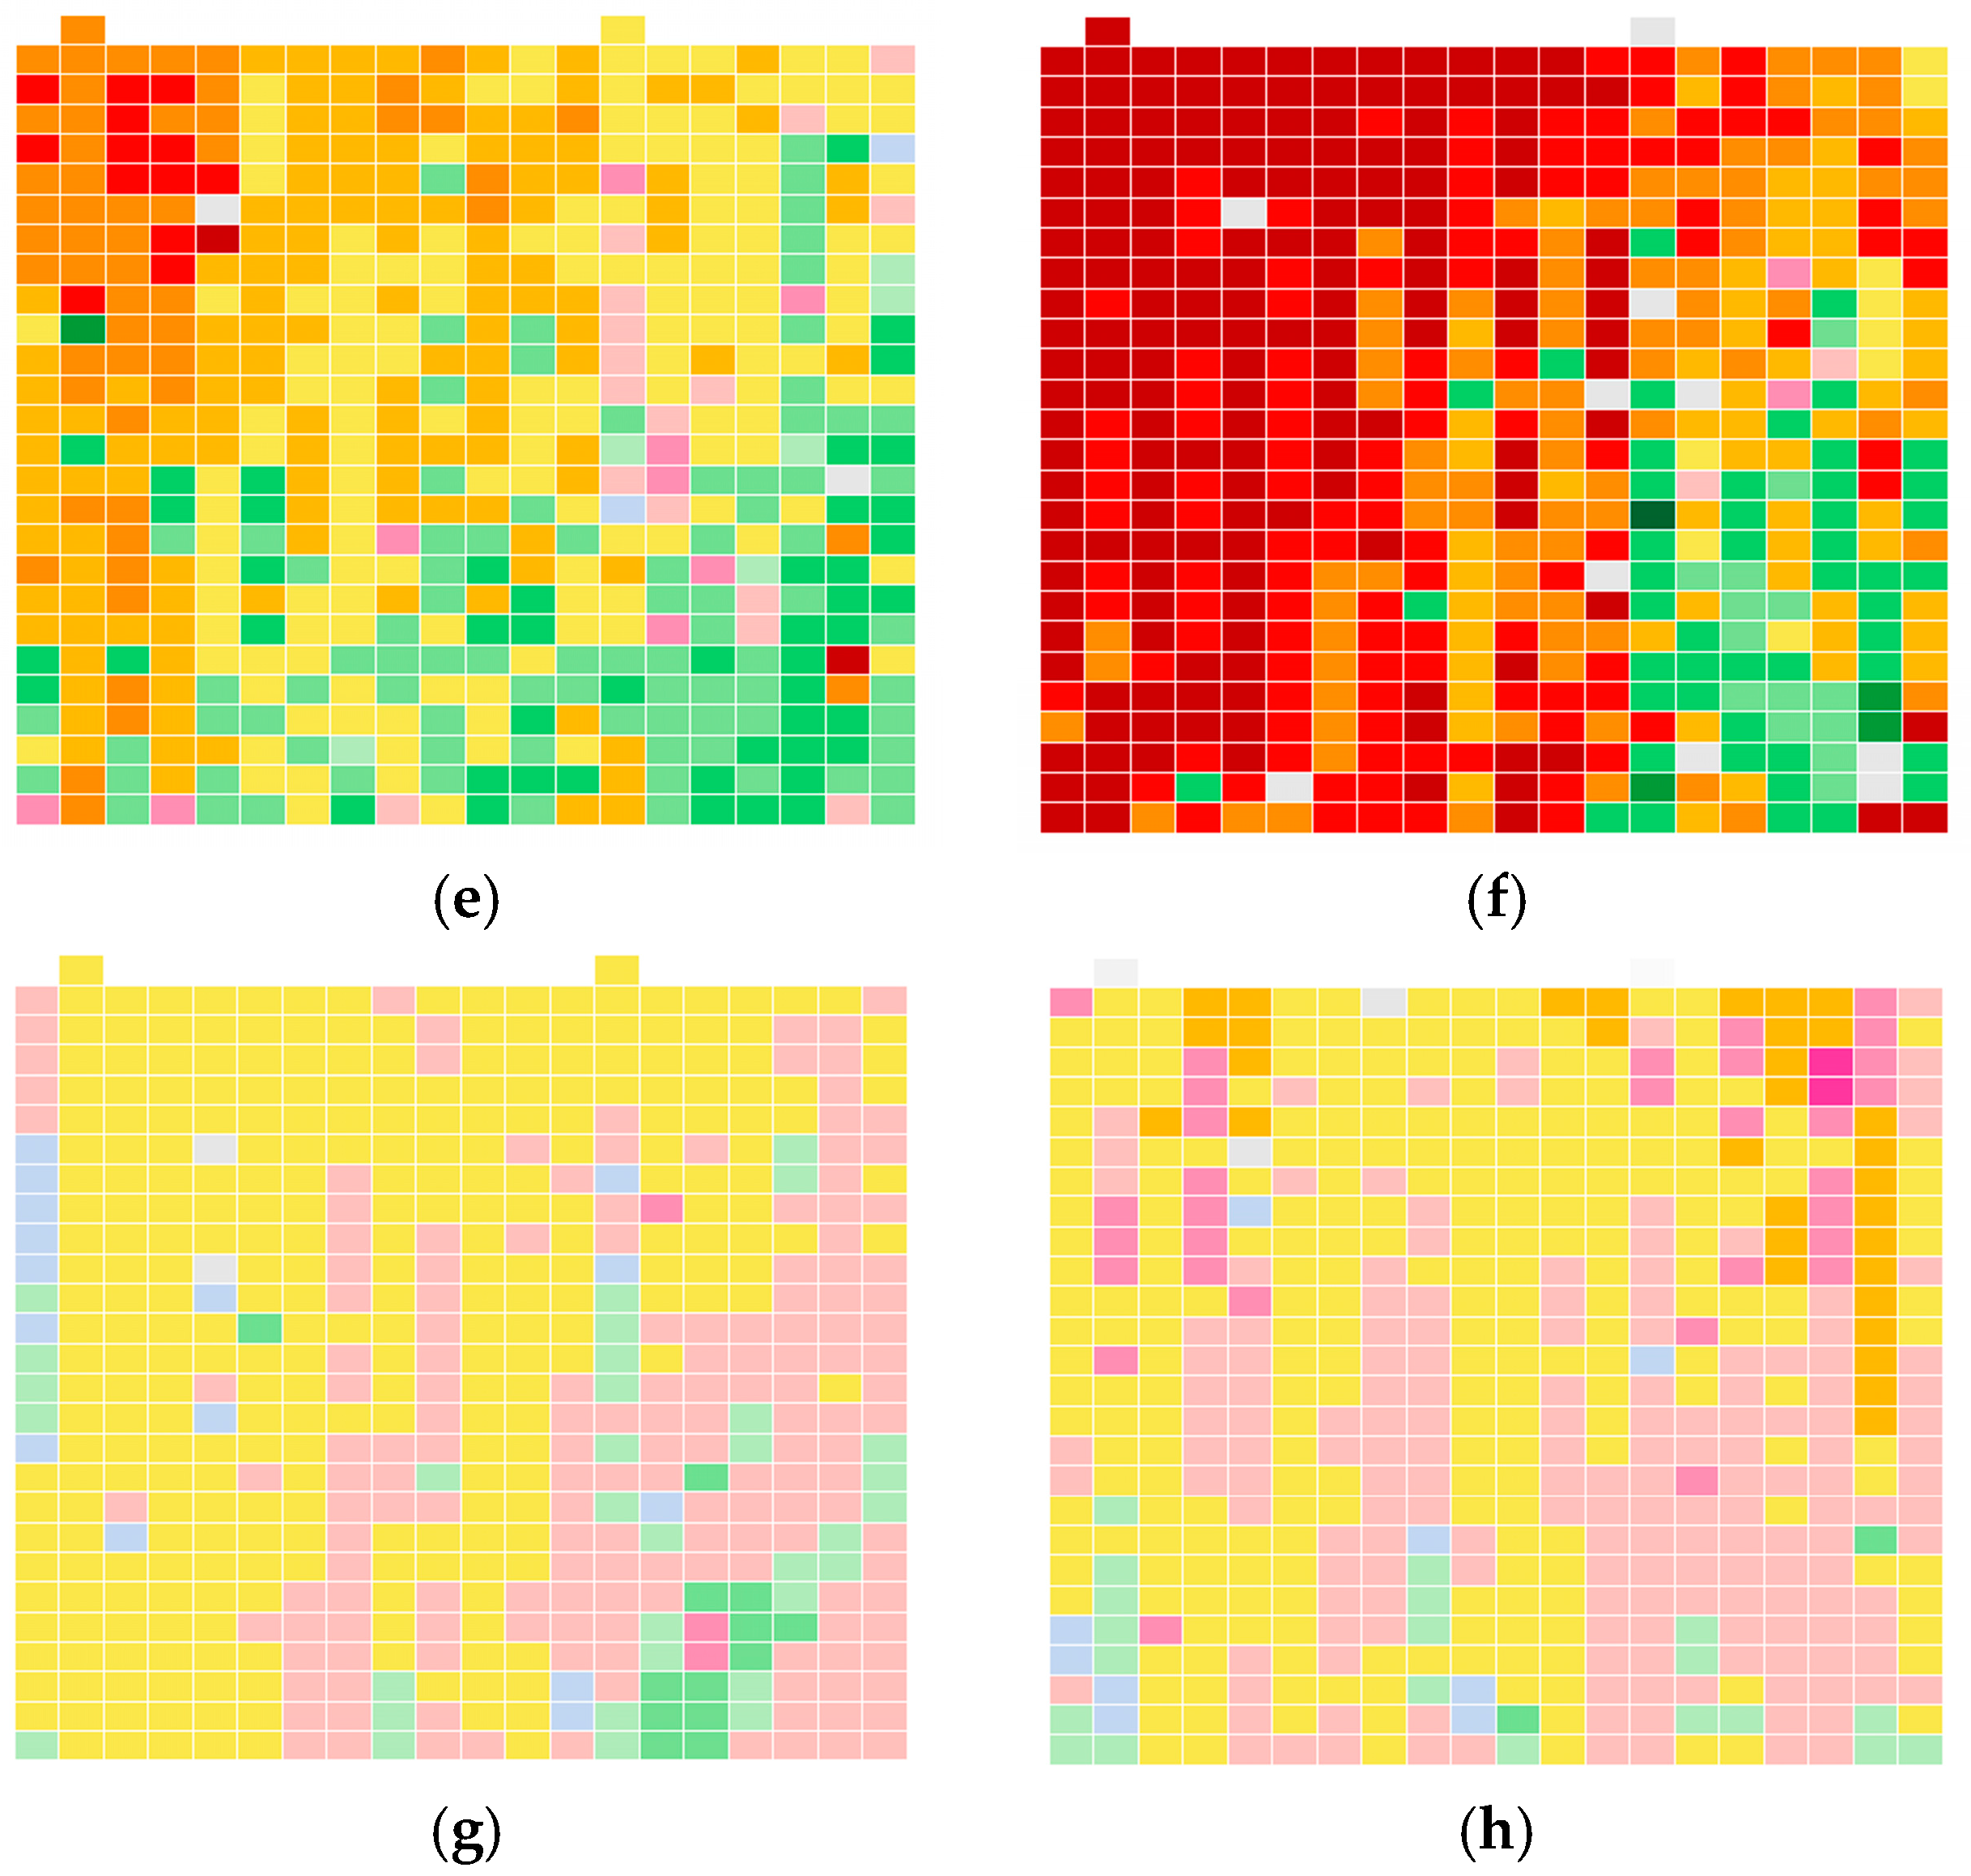
3.1. Spatial Change of the Water Quality
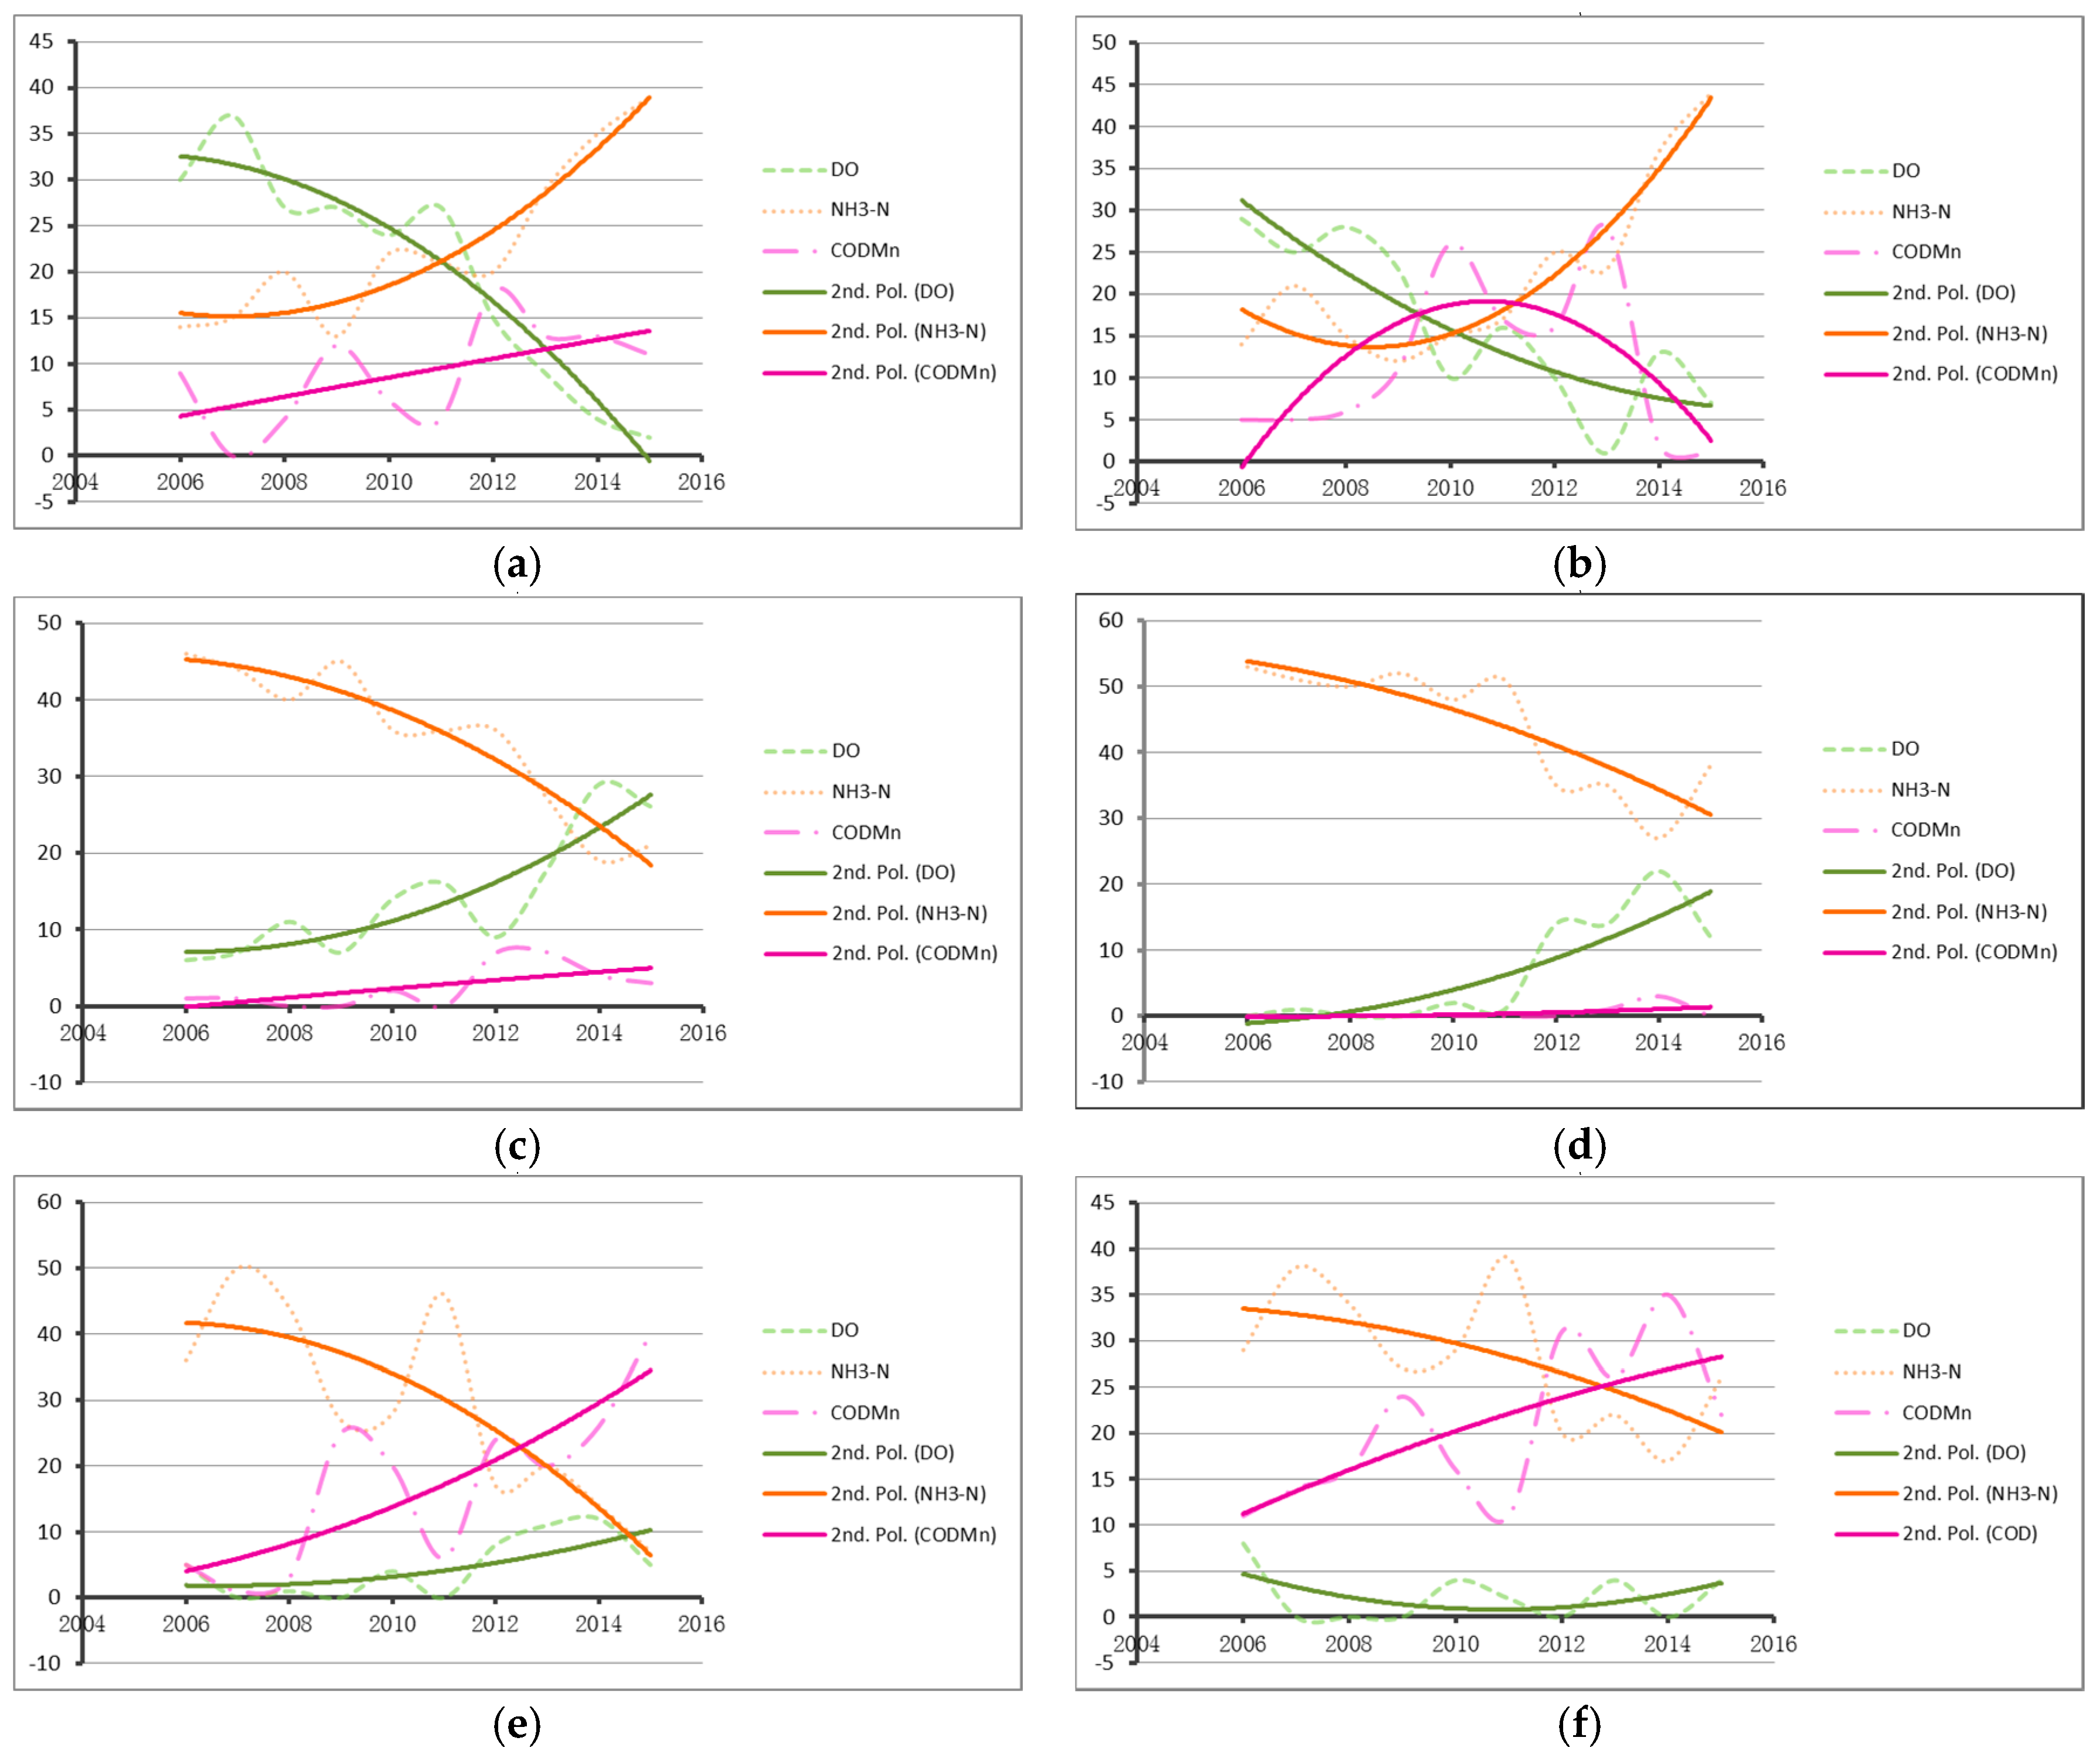
3.2. Temporal Change of the Water Quality
4. Conclusions
- (1)
- The calendar-based map provides a promising visual analytic approach to identify the water quality issues of the Yangtze River. Using the calendar, it is possible to reveal the spatial and temporal patterns in the massive monitoring data without using complex analysis models.
- (2)
- According to the map, the upper reaches of the Yangtze River and tributaries have relatively good water quality, while the other sections, especially where urban agglomerations are developing, e.g., South Dian and Guanyinshan in Kunming, Xielu Port in Jiaxing, and Jishui Port in Qingpu, are seriously polluted.
- (3)
- The major pollutants in the Yangtze River have multi-scale temporal patterns. At the seasonal scale, DO is the major pollutant in the summer and autumn, and NH3-N tends to be serious in the spring and winter. At the annual scale, at least three patterns can be observed, i.e., from alternating between DO and NH3-N to mainly in NH3-N, from mainly NH3-N to alternating between DO and NH3-N, and switching from NH3-N to CODMn.
Supplementary Materials
Acknowledgments
Author Contributions
Conflicts of Interest
References
- Ma, X.; Wang, L.; Wu, H.; Li, N.; Ma, L.; Zeng, C.; Zhou, Y.; Yang, J. Impact of yangtze river water transfer on the water quality of the Lixia River watershed, China. PLoS ONE 2015, 10, e0119720. [Google Scholar] [CrossRef] [PubMed]
- Hang, X.; Wang, H.; Zhou, J.; Ma, C.; Du, C.; Chen, X. Risk assessment of potentially toxic element pollution in soils and rice (oryza sativa) in a typical area of the Yangtze River delta. Environ. Pollut. 2009, 157, 2542–2549. [Google Scholar] [CrossRef] [PubMed]
- Müller, B.; Berg, M.; Yao, Z.P.; Zhang, X.F.; Wang, D.; Pfluger, A. How polluted is the Yangtze River? Water quality downstream from the three gorges dam. Sci. Total Environ. 2008, 402, 232–247. [Google Scholar] [CrossRef] [PubMed]
- Qin, C.; Tian, Y.; Wu, Y.; Huang, J.; Ndakeva, H. International Conference on Environmental Science and Information Application Technology. In Research on the Human-Water Relationship in the Middle Reaches of Yangtze River, Proceedings of the International Conference on Environmental Science and Information Application Technology, Wuhan, China, 4–5 July 2009; Guerrero, J.E., Ed.; IEEE Computer Society: Washington, DC, USA, 2009; pp. 15–19. [Google Scholar]
- Liu, C.; Watanabe, M.; Wang, Q. Changes in nitrogen budgets and nitrogen use efficiency in the agroecosystems of the Changjiang River basin between 1980 and 2000. Nutr. Cycl. Agroecosyst. 2007, 80, 19–37. [Google Scholar] [CrossRef]
- Holbach, A.; Wang, L.; Chen, H.; Hu, W.; Schleicher, N.; Zheng, B.; Norra, S. Water mass interaction in the confluence zone of the Daning River and the Yangtze River—A driving force for algal growth in the three gorges reservoir. Environ. Sci. Pollut. Res. 2013, 20, 7027–7037. [Google Scholar] [CrossRef] [PubMed]
- Zhao, Y.; Xia, X.H.; Yang, Z.F.; Wang, F. Assessment of water quality in Baiyangdian Lake using multivariate statistical techniques. Procedia Environ. Sci. 2012, 13, 1213–1226. [Google Scholar] [CrossRef]
- Zhao, D.; Cheng, S.; Wu, B.; Zhang, Y.; Zhang, X.; Li, W.; Cui, Y. Toxicity of the Yangtze River source of drinking water on reproductive system of male mice (Mus musculus). Ecotoxicology 2009, 18, 729–735. [Google Scholar] [CrossRef] [PubMed]
- Hu, X.; Shi, W.; Cao, F.; Hu, G.; Hao, Y.; Wei, S.; Wang, X.; Yu, H. Bioanalytical and instrumental analysis of estrogenic activities in drinking water sources from Yangtze River delta. Chemosphere 2013, 90, 2123–2128. [Google Scholar] [CrossRef] [PubMed]
- Wang, Q.; Koshikawa, H.; Liu, C.; Otsubo, K. 30-year changes in the nitrogen inputs to the Yangtze River basin. Environ. Res. Lett. 2014, 9, 115005. [Google Scholar] [CrossRef]
- Jia, C.-R.; Zhang, J. Based on fuzzy weight matter element to evaluate the water quality of Jialing River in Nanchong, China. Procedia Environ. Sci. 2011, 11, 631–636. [Google Scholar]
- Qu, B.; Sillanpää, M.; Zhang, Y.; Guo, J.; Wahed, M.S.M.A.; Kang, S. Water chemistry of the headwaters of the Yangtze River. Environ. Earth Sci. 2015, 74, 1–16. [Google Scholar] [CrossRef]
- Naddeo, V.; Scannapieco, D.; Zarra, T.; Belgiorno, V. River water quality assessment: Implementation of non-parametric tests for sampling frequency optimization. Land Use Policy 2013, 30, 197–205. [Google Scholar] [CrossRef]
- Xin, X.K.; Li, K.F.; Finlayson, B.; Yin, W. Evaluation, prediction, and protection of water quality in Danjiangkoureservoir, China. Water Sci. Eng. 2015, 8, 30–39. [Google Scholar] [CrossRef]
- Bouza-Deaño, R.; Ternero-Rodríguez, M.; Fernández-Espinosa, A.J. Trend study and assessment of surface water quality in the Ebro River (Spain). J. Hydrol. 2008, 361, 227–239. [Google Scholar] [CrossRef]
- Alberto, W.D.; Diaz, M.d.P.; Amé, M.V.; Fabiana, P.S.; Hued, A.C.; De Los Ángeles, B.M. Pattern recognition techniques for the evaluation of spatial and temporal variations in water quality. A case study: Suquı́a River basin (Córdoba–Argentina). Water Res. 2001, 35, 2881–2894. [Google Scholar] [CrossRef]
- Singh, K.P.; Malik, A.; Mohan, D.; Sinha, S. Multivariate statistical techniques for the evaluation of spatial and temporal variations in water quality of Gomti River (India)—A case study. Water Res. 2004, 38, 3980–3992. [Google Scholar] [CrossRef] [PubMed]
- Dunn, G.; Henrich, N.; Holmes, B.; Harris, L.; Prystajecky, N. Microbial water quality communication: Public and practitioner insights from British Columbia, Canada. J. Water Health 2014, 12, 584–595. [Google Scholar] [CrossRef] [PubMed]
- Demir, I.; Jiang, F.; Walker, R.V.; Parker, A.K.; Beck, M.B. Information systems and social legitimacy scientific visualization of water quality. In Proceedings of the IEEE International Conference on Systems, Man and Cybernetics, San Antonio, TX, USA, 11–14 October 2009; pp. 1067–1072. [Google Scholar]
- Srivastava, P.K.; Mukherjee, S.; Gupta, M.; Singh, S.K. Characterizing monsoonal variation on water quality index of River Mahi in India using geographical information system. Water Qual. Expo. Health 2011, 2, 193–203. [Google Scholar] [CrossRef]
- Best, D.M.; Lewis, R.R. Gwvis: A tool for comparative ground-water data visualization. Comput. Geosci. 2010, 36, 1436–1442. [Google Scholar] [CrossRef]
- Demir, I.; Krajewski, W.F. Towards an integrated flood information system: Centralized data access, analysis, and visualization. Environ. Model. Softw. 2013, 50, 77–84. [Google Scholar] [CrossRef]
- Halls, J.N. River run: An interactive GIS and dynamic graphing website for decision support and exploratory data analysis of water quality parameters of the lower Cape Fear river. Environ. Model. Softw. 2003, 18, 513–520. [Google Scholar] [CrossRef]
- Ziolkowska, J.R.; Reyes, R. Geological and hydrological visualization models for digital earth representation. Comput. Geosci. 2016, 94, 31–39. [Google Scholar] [CrossRef]
- Aigner, W.; Miksch, S.; Müller, W.; Schumann, H.; Tominski, C. Visual methods for analyzing time-oriented data. IEEE Trans. Vis. Comput. Graph. 2008, 14, 47–60. [Google Scholar] [CrossRef] [PubMed]
- Van Wijk, J.J.; Van Selow, E.R. Information Visualization. In Cluster and Calendar Based Visualization of Time Series Data, Proceedings of the IEEE Symposium on Information Visualization (INFOVIS'99), San Francisco, California, CA, USA, 24–29 October 1999; Wills, G., Keim, D., Eds.; IEEE Computer Society: Washington, DC, USA, 1999; pp. 4–9. [Google Scholar]
- Zhou, M.; Wang, R.; Mai, S.; Tian, J. Spatial and temporal patterns of air quality in the three economic zones of China. J. Maps 2016, 1–7, 156–162. [Google Scholar] [CrossRef]
- Brewer, C.A.; Hatchard, G.W.; Harrower, M.A. Colorbrewer in print: A catalog of color schemes for maps. Cartogr. Geogr. Inf. Sci. 2003, 30, 5–32. [Google Scholar] [CrossRef]
- JS. Available online: www.javascript.com (accessed on 15 September 2017).
- D3 Data-Driven Documents. Available online: d3js.org (accessed on 15 September 2017).
- Corel. Available online: www.corel.com/cn/ (accessed on 15 September 2017).
- Hu, Y.; Cheng, H. Water pollution during China’s industrial transition. Environ. Dev. 2013, 8, 57–73. [Google Scholar] [CrossRef]
- Zhao, H.; Duan, X.; Stewart, B.; You, B.; Jiang, X. Spatial correlations between urbanization and river water pollution in the heavily polluted area of Taihu Lake basin, China. J. Geogr. Sci. 2013, 23, 735–752. [Google Scholar] [CrossRef]
- Stone, R. China aims to turn tide against toxic lake pollution. Science 2011, 333, 1210–1211. [Google Scholar] [CrossRef] [PubMed]
- Yamamoto, A.; Fujita, T.; Tateno, N.; Hareyama, M. Data visualization and web map server (WMS) system for Kaguya (Selene). In Proceedings of the 42nd Lunar and Planetary Science Conference (2011), The Woodlands, TX, USA, 7–11 March 2011. [Google Scholar]
- Walker, D.; Jakovljević, D.; Savić, D.; Radovanović, M. Multi-criterion water quality analysis of the Danube River in Serbia: A visualisation approach. Water Res. 2015, 79, 158–172. [Google Scholar] [CrossRef] [PubMed]


| WQL | Category | pH | DO (≥ mg/L) | CODMn (≤ mg/L) | NH3-N (≤ mg/L) | TP (≤ mg/L) | TN (≤ mg/L) |
|---|---|---|---|---|---|---|---|
| I | Excellent | 6~9 | 7.5 | 2 | 0.15 | 0.02 | 0.2 |
| II | Lightly polluted | 6 | 4 | 0.5 | 0.1 | 0.5 | |
| III | Moderately polluted | 5 | 6 | 1.0 | 0.2 | 1.0 | |
| IV | Seriously polluted | 3 | 10 | 1.5 | 0.3 | 1.5 | |
| V | Terrible polluted | 2 | 15 | 2.0 | 0.4 | 2.0 | |
| Poor V | Cannot be used | - 1 | <2 | >15 | >2.0 | >0.4 | >2.0 |
| I | II | III | IV | V | Poor V | No Data | |
|---|---|---|---|---|---|---|---|
| pH | - | ||||||
| DO |  |  |  |  |  | ||
| CODMn |  |  |  |  |  |  |  |
| NH3-N |  |  |  |  |  | ||
© 2017 by the authors. Licensee MDPI, Basel, Switzerland. This article is an open access article distributed under the terms and conditions of the Creative Commons Attribution (CC BY) license (http://creativecommons.org/licenses/by/4.0/).
Share and Cite
Huang, L.; Zhong, M.; Gan, Q.; Liu, Y. A Novel Calendar-Based Method for Visualizing Water Quality Change: The Case of the Yangtze River 2006–2015. Water 2017, 9, 708. https://doi.org/10.3390/w9090708
Huang L, Zhong M, Gan Q, Liu Y. A Novel Calendar-Based Method for Visualizing Water Quality Change: The Case of the Yangtze River 2006–2015. Water. 2017; 9(9):708. https://doi.org/10.3390/w9090708
Chicago/Turabian StyleHuang, Lina, Mengyin Zhong, Qiyao Gan, and Yanfang Liu. 2017. "A Novel Calendar-Based Method for Visualizing Water Quality Change: The Case of the Yangtze River 2006–2015" Water 9, no. 9: 708. https://doi.org/10.3390/w9090708
APA StyleHuang, L., Zhong, M., Gan, Q., & Liu, Y. (2017). A Novel Calendar-Based Method for Visualizing Water Quality Change: The Case of the Yangtze River 2006–2015. Water, 9(9), 708. https://doi.org/10.3390/w9090708