Article

Spatiotemporal Variation Characteristics of Ecosystem Carbon Storage in Henan Province and Future Multi-Scenario Simulation Prediction

College of Resources and Environmental Sciences, Henan Agricultural University, Zhengzhou 450046, China
*
Author to whom correspondence should be addressed.
Land 2024, 13(2), 185; https://doi.org/10.3390/land13020185
Submission received: 28 December 2023 / Revised: 29 January 2024 / Accepted: 30 January 2024 / Published: 4 February 2024

Abstract

:
In response to a series of problems brought about by rapid economic development, such as global warming and the continuous deterioration of the ecological environment, China has taken the initiative to shoulder the responsibility of a major country and continued to contribute Chinese wisdom and Chinese solutions to the goal of “carbon peak and carbon neutrality” at an early date. In this paper, Henan Province has been selected as the study area, and the changes in land use and carbon storage in Henan Province from 2000 to 2020 have been analyzed spatially and temporally. The PLUS model is used to predict future land use changes under different scenarios, and the InVEST model is used to estimate carbon storage under the corresponding scenarios. The results showed that (1) During 2000–2020, the farmland in Henan Province has been in a decreasing trend, grassland and construction land showed a decreasing trend and then an increasing trend, and woodland showed a decreasing trend. From 2000 to 2020, Henan’s overall carbon storage showed a downward trend each year, with storage mainly in the western and southern regions of the province, with a spatial distribution of high storage in the west and low storage in the east. (2) Under the normal development scenario (SSP2-RCP4.5) from 2030 to 2050, the area of farmland and woodland basically showed a continuous downward trend, while construction land showed an upward trend annually, and farmland and construction land showed an increasing trend under the normal development scenario (SSP2-RCP4.5) and economic priority scenario (SSP5-RCP8.5). The decreasing trend of carbon storage was the smallest under the normal development scenario (SSP2-RCP4.5) and the ecological protection scenario (SSP1-RCP2.6). The results provide a basis for decision-making regarding low-carbon and circular developments and rational and optimal land use in Henan.

1. Introduction

With rapid economic development, the trend of global warming cannot be ignored. At the UN (United Nations) General Assembly in 2020, the Chinese government proposed, for the first time, to strive to reach the peak of CO2 emissions before 2030, and achieve the goal of “carbon peak and carbon neutrality” by 2060, which means that CO2 emissions are offset by ecological protection. The carbon storage function of ecosystems is one of the most important functions of ecosystem services, and carbon storage in terrestrial ecosystems plays a key role in mitigating climate change and achieving the strategic goal of “carbon neutrality” [1]. There is a strong relationship between carbon storage in terrestrial ecological systems and land use, and changes in carbon storage tend to be accompanied by changes in land use types. Research on carbon storage based on changes in land use has non-trivial practical implications.
The study of carbon storage began in the early 1960s. Due to the relatively backward technology, scholars in various fields mainly used mathematical statistics to calculate carbon storage [2,3]. For example, Rubey (1951) used soil profile data in the United States to estimate carbon storage. Despite its high accuracy, this method is time-consuming and laborious and can only be studied in small areas. Until the late 1990s, with the development of 3S technology (remote sensing technology, geographic information system, global positioning system), mathematical models such as soil mapping technology [4], the geographically weighted regression model (GWR) [5], and the CASA (Carnegie–Ames–Stanford Approach) model [6] came into being and became a common means to estimate carbon storage. These models require more data but produce less data. The integrated assessment model of ecosystem services and trade-offs (InVEST) model, jointly developed by Stanford University, the Nature Conservancy (TNC) and the World-Wide Fund for Nature (WWF), has been widely used for its accurate and intuitive visualization results with less demand for data and large output data [7,8]. Assessing the impact of land use change on carbon storage is an important condition for reducing carbon emissions and mitigating climate change [9].
In recent years, related studies often predict future carbon storage by modeling future land use and cover. Common models include the CA-Markov (cellular automata—Markov) model [10], the CA-ANN (Cellular automata—Artificial Neural Network) model [11], the CLUE-S (Conversion of Land Use and its Effects at Small Region Extent) model [12], the FLUS (Future land use simulation) model [13,14], etc. However, such models have shortcomings in simulating the spatial–temporal evolution of different land use types at the patch scale, and it is difficult to explain the deep relationship between different land use types [15]. Subsequently, some scholars began to use the coupling of the land use change model and the carbon storage estimation model to predict carbon storage [16], among which the FLUS-InVEST (future land use simulation model–integrated valuation of ecosystem services and tradeoffs) model [17] and the PLUS-InVEST (patch-generating land use simulation–integrated valuation of ecosystem services and tradeoffs) model [18,19,20,21] were most commonly used to simulate the spatial–temporal evolution characteristics of carbon storage under different land use scenarios. In addition, multiple models can be coupled like the PLUS–InVEST–Geodector model coupled by Mao to quantitatively reveal the cause mechanism of carbon storage change from the perspective of land use change and the complex relationship between natural and social economies [22]. From the perspective of carbon storage, according to studies by relevant scholars, the total carbon storage supply in Henan gradually declined and the total carbon storage demand increased annually during 1995–2015 [23].
A major agricultural province in the middle and lower reaches of the Yellow River, Henan is China’s largest province in terms of population, economy and carbon emissions. At the same time, Henan, as the birthplace of Chinese civilization, is also an important part of China’s national strategy for the ecological protection and high-quality development of the Yellow River basin. Few studies have been conducted with Henan as a subject. Wang divided forest carbon storage in Henan Province into five categories from the perspective of forest inventory to estimate it [24]. Xiao calculated the carbon storage capacity of Henan from the perspective of four major river basins across Henan to coordinate the construction of ecological cities [25]. Based on the analysis of carbon balance, Li analyzed the carbon storage in Henan and gave suggestions for spatial optimization [23]. However, predictions of carbon storage in Henan Province under different future scenarios are still lacking.
In view of this, this study took Henan Province as an example, based on land use data from 2000 to 2020, taking into account the impact of natural factors, socio-economic factors, transportation and other factors, combined with the PLUS and InVEST model, and analyzed the land use change in Henan Province in the historical period and predicted the carbon storage change in the next 30 years under different scenarios. It is expected to enrich Henan’s research progress on carbon storage and provide Henan with a basis for achieving peak carbon balance, ecological security protection, land optimization and other scientific decisions. The main research objectives of this paper include the following: (1) The spatial and temporal changes of land use and carbon storage distribution during the three decades from 2000 to 2020 were analyzed. (2) The effects of land use change on carbon storage in Henan Province from 2000 to 2020 were analyzed. (3) The changes in land use and carbon storage in 2030–2050 were simulated and predicted under three different scenarios.

2. Materials and Methods

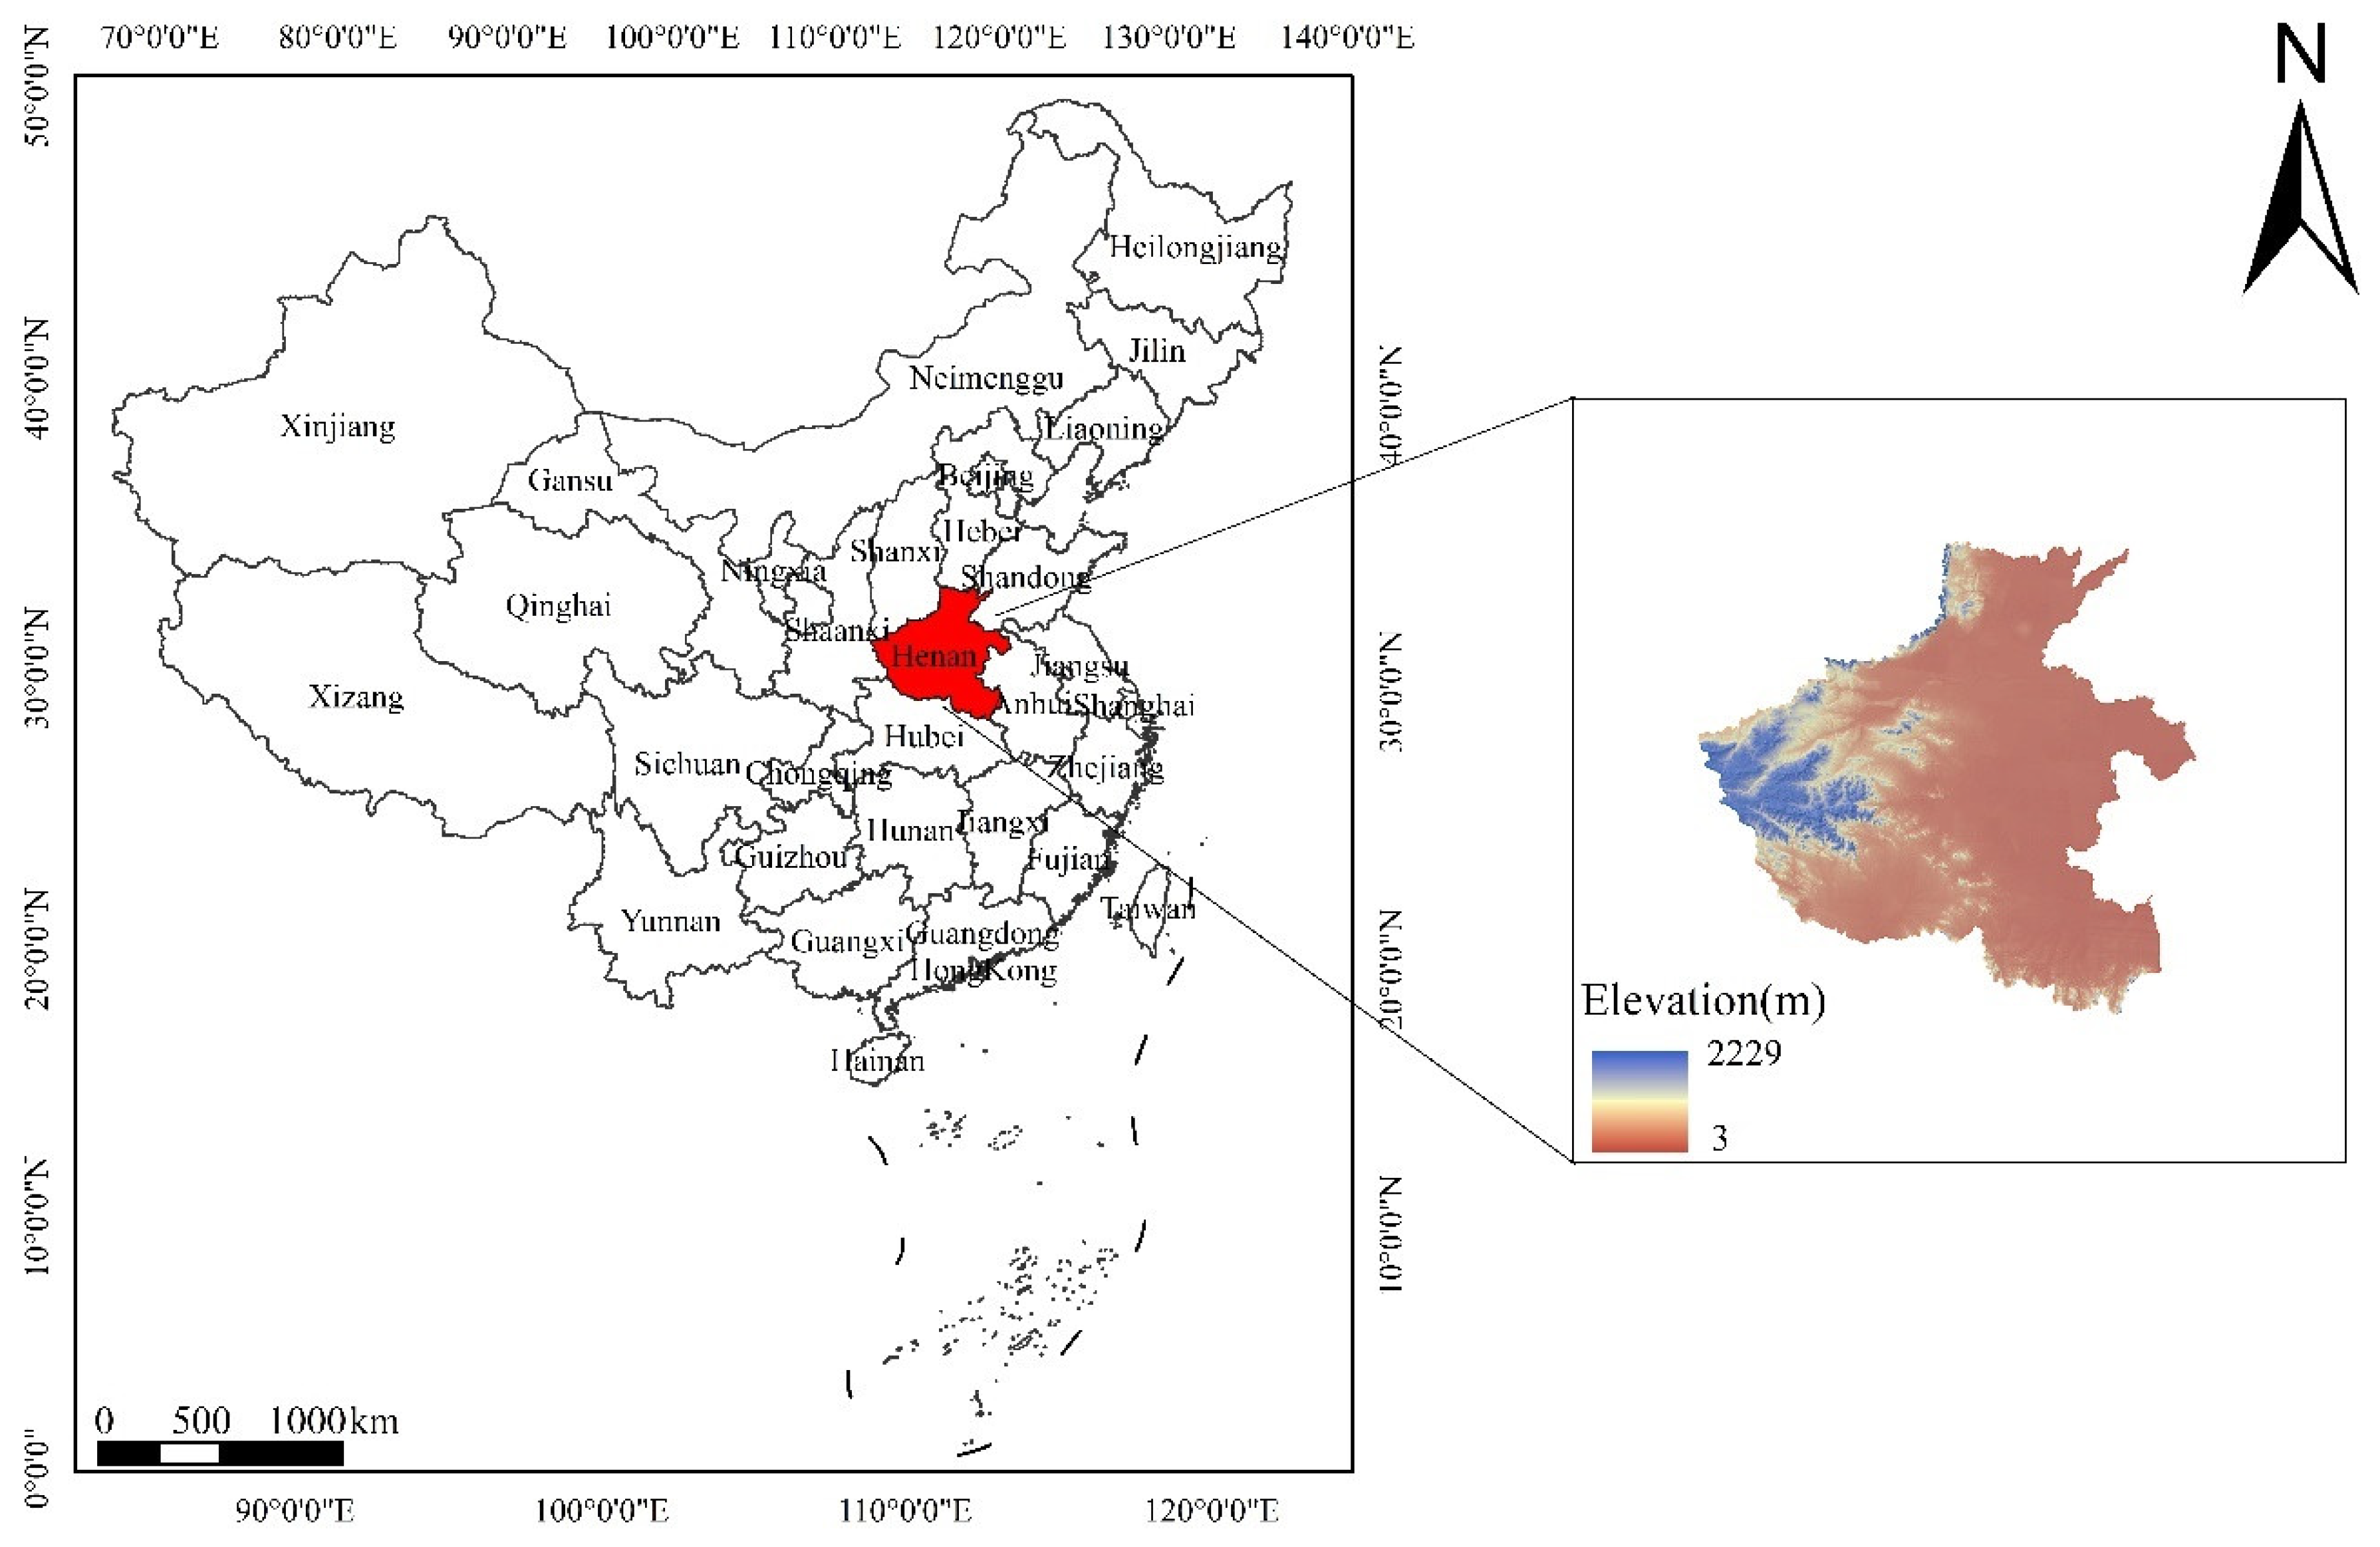
2.1. General Situation of Henan
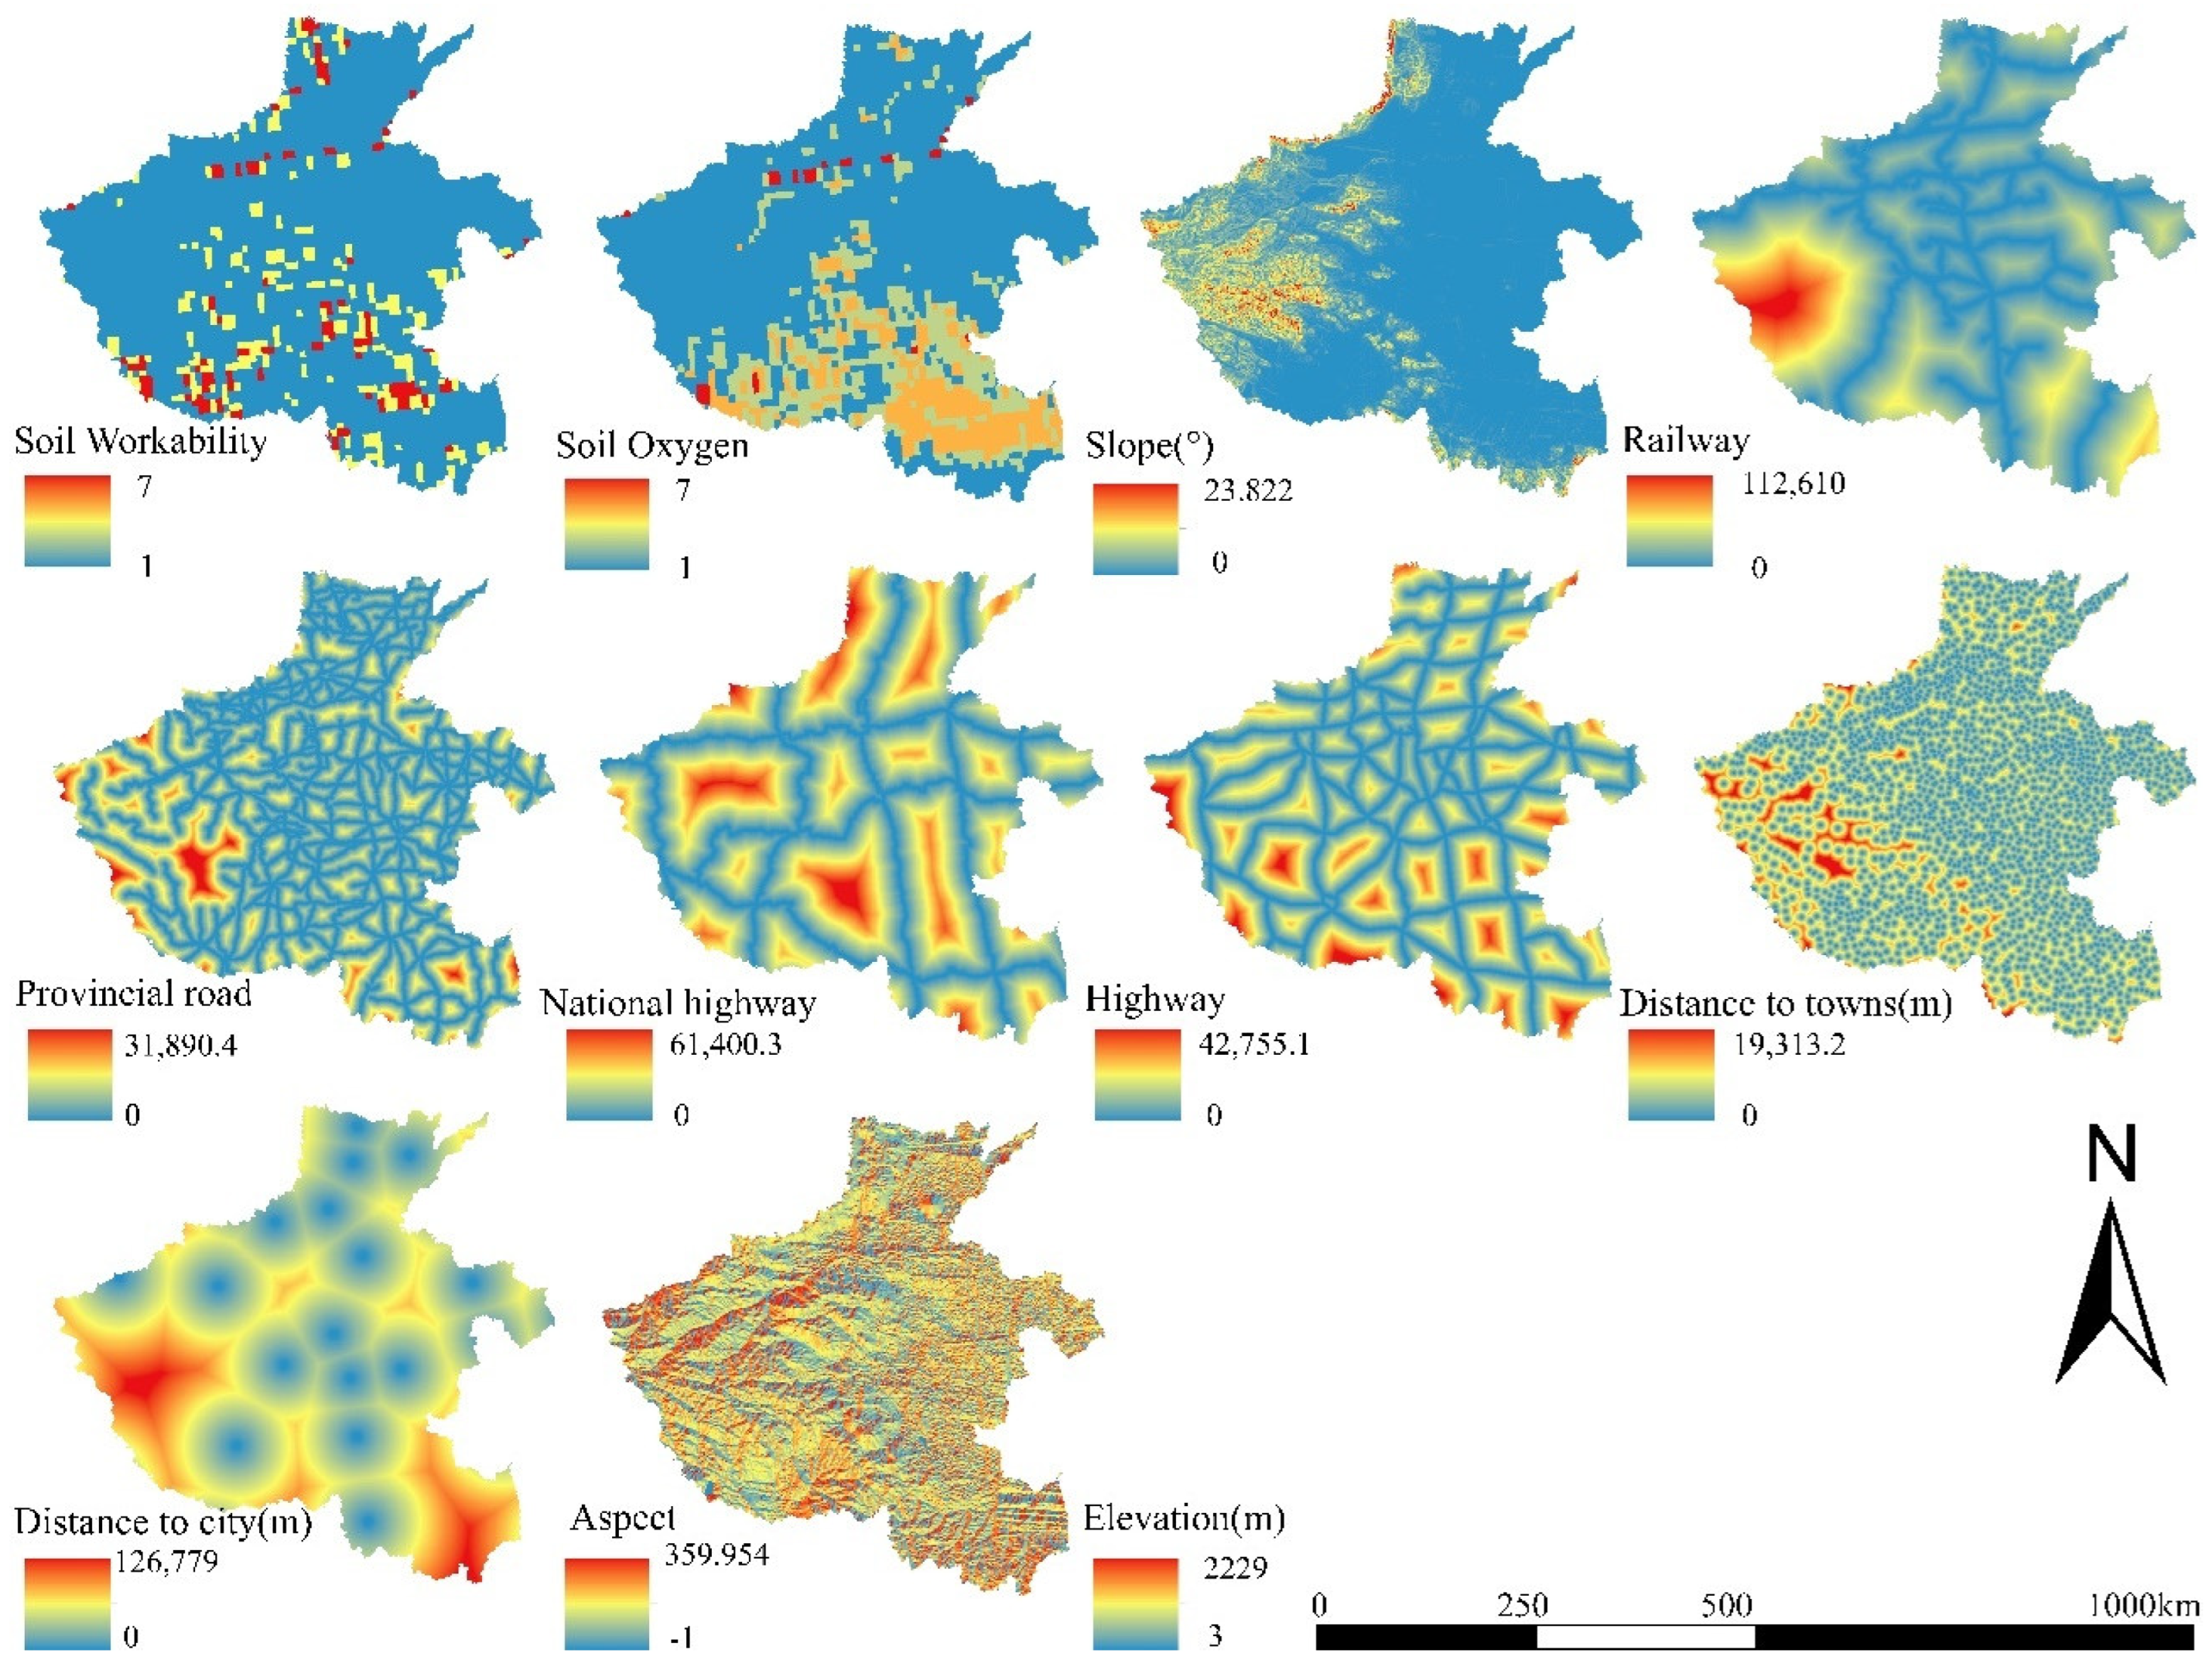
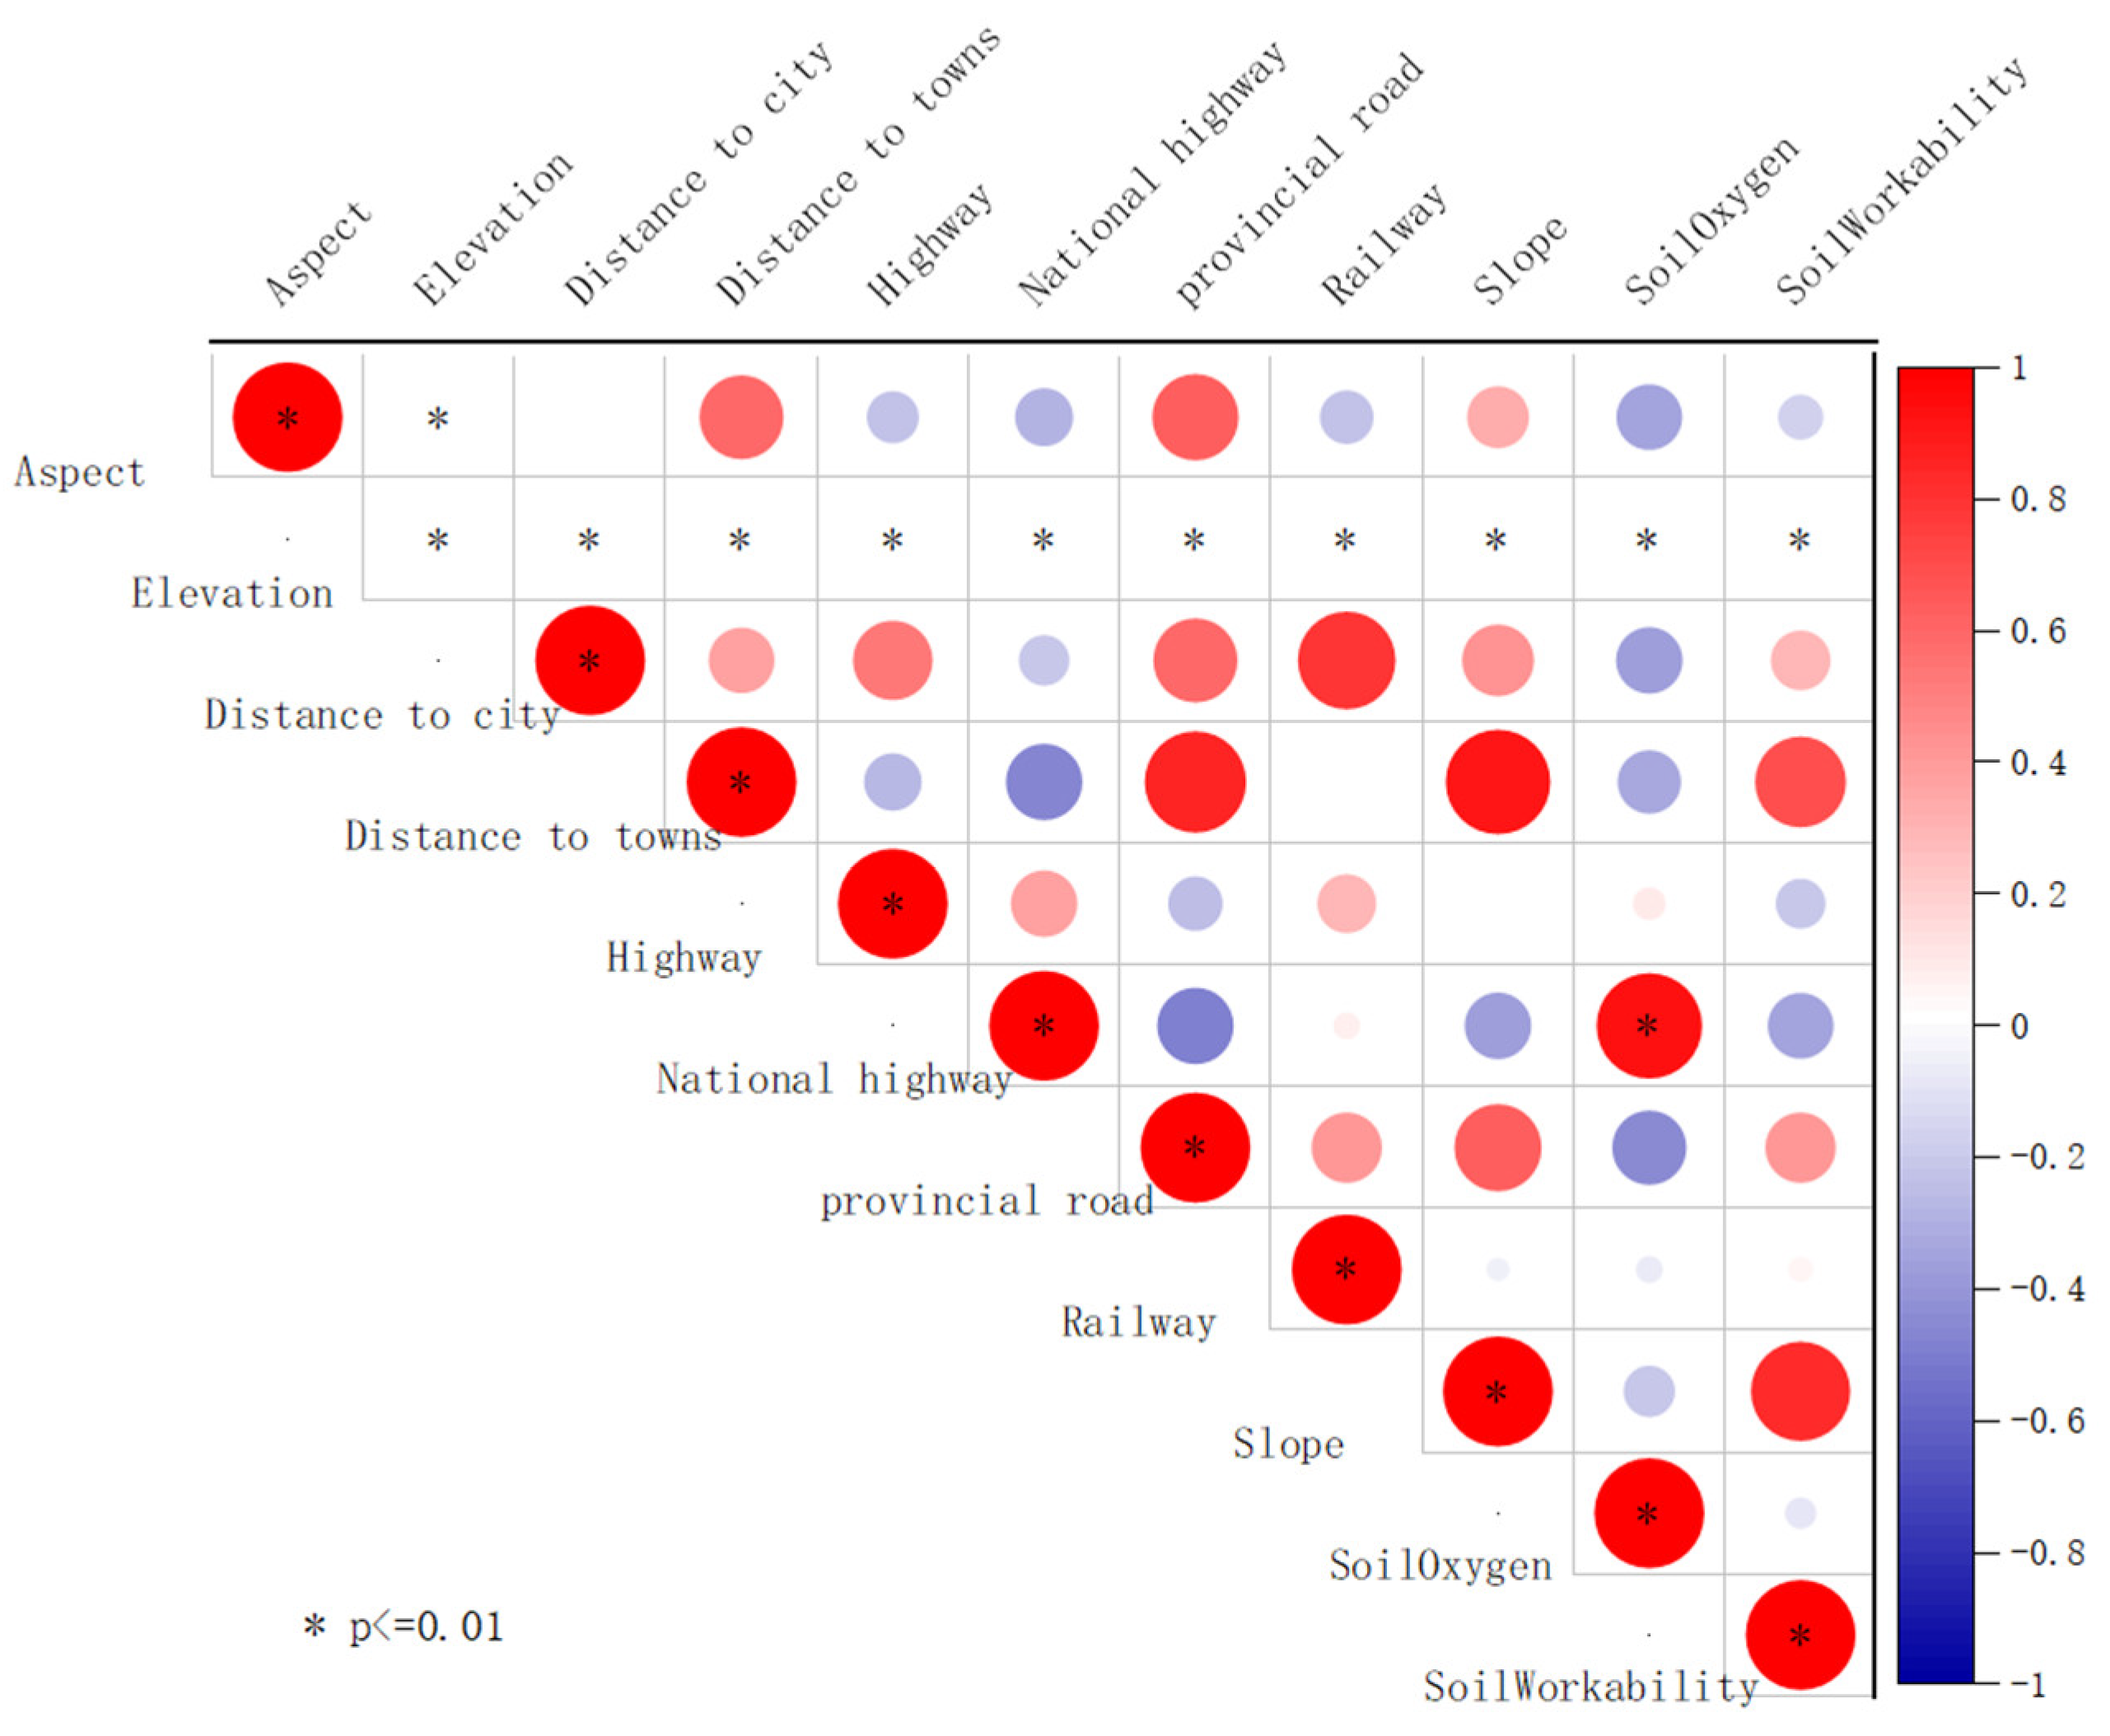
Henan Province is located in the middle and lower reaches of the Yellow River, with an area of 167,000 km2, and it is the only province spanning the four valleys of the Yangtze River, Huai River, Yellow River, and Hai He River in our country, where the terrain is high in the west and low in the east, between the latitude of 31°23′–36°22′ N and 110°21′–116°39′ E (as shown in Figure 1). Much of Henan Province is located in the warm temperate zone, the southern trans-subtropical zone, which is a continental monsoon climate transition from the northern subtropical zone to the warm temperate zone, with four distinct seasons (rain and heat occurring in the same period), and it is suitable for the growth of various crops. It can be seen from the data of three surveys (the third National Land resource Survey) that the land use in Henan is mainly farmland, woodland and construction land. The province has 7370 km2 of farmland, accounting for 45 percent of the province’s area, making it the province with the highest percentage of farmland in the country. With the rapid economic development in recent years, the type of land use in Henan has also changed significantly. In addition, Henan is an important part of China’s strategy for ecological protection and high-quality development, so it is of some practical importance to study the spatial distribution of carbon storage in this region.

2.2. Data Sources

In this study, DEM data are provided by a geospatial data cloud platform (http://www.gscloud.cn (accessed on 16 October 2023)). The slope and aspect data are computed from the DEM data. The 1 km × 1 km remote sensing data of land use in 2000, 2010 and 2020, as well as meteorological, road and other data used by the institute, are from the Data Center of Resources and Environmental Sciences, Chinese Academy of Sciences (http://www.resdc.cn accessed on 16 October 2023). The relevant data are mainly sourced from Landsat remote sensing images of different periods. According to the “Classification Standards for Land Use Status” (GB/T 21010-2017) [26,27], land use classification is divided into six categories: farmland, woodland, grassland, water area, construction land and unused land.

2.3. Research Method

2.3.1. PLUS Model

The PLUS (patch-generating land use simulation) model is a patch level land use simulation model developed by the China University of Geosciences, which includes two sections: the land expansion analysis strategy (LEAS) and a CA model based on random patch seed (CARS). It can accurately reflect the land use change in the reservoir area. Firstly, the expansion of land use and cover from the early stage to the late stage was extracted from the LEAS module, and then various driving factors were input. The random forest classification algorithm was used to calculate the impact of each driving factor on land use and cover type.
The Kappa coefficient can explain the accuracy of the model simulation. Generally speaking, when the Kappa coefficient is greater than 0.75, it indicates that the consistency is good and the model simulation results are reliable. The calculation formula is as follows:
Kappa = P o P c P p P c
where Kappa is the simulation accuracy index; P o is the actual simulation accuracy; P c is the expected simulation accuracy in a random state; P p is the ideal simulation accuracy (100%).
In this study, the land use data of Henan Province in 2000, 2010 and 2020 are selected, and the land use distribution in 2020 is simulated based on the land use status map of 2010. Based on Henan’s geographical location, economic development, road infrastructure and other factors, 11 driving factors such as soil workability, soil oxygen, slope, railway, provincial road, national highway, highway, distance to towns, distance to city, aspect and elevation were selected to simulate land use (as shown in Figure 2). According to Figure 3, there is some correlation between different driving factors.

2.3.2. InVEST Model

The InVEST (integrated valuation of ecosystem services and tradeoffs) model is a comprehensive assessment model of ecosystem services and tradeoffs, with three modules: freshwater ecosystem assessment, marine ecosystem assessment and terrestrial ecosystem assessment [28]. It was jointly developed by Stanford University, the Nature Conservancy (TNC) and the World-Wide Fund for Nature (WWF). The InVEST model is commonly used to study changes in carbon storage due to its simple operation and high accuracy. The carbon storage plate contains four basic carbon pools: the above-ground carbon pool, the below-ground carbon pool, the soil carbon pool, and the dead organic carbon pool. The ecosystem carbon storage is calculated as follows:
C i - total = C i - above + C i - below + C i - soil + C i - dead
where i is the land use and cover type, C i - total is the regional total carbon density corresponding to the i types of land use and cover type, C i - above is the above-ground carbon density corresponding to the i types of land use and cover type, and C i - below is the underground carbon density corresponding to the i types of land use and cover type. C i - soil is the soil carbon density corresponding to the i types of land use and cover, and C i - dead is the soil carbon density corresponding to the i types of land use and cover.
Concerning the correction methods for the carbon density in previous studies and the factors chosen for this study, the correction formula for the carbon density data in Henan Province is as follows:
C i - BT = 28 × MAT + 398
C i - BP = 6.789 × e 0.0054 × MAP
C i - SP = 3.3968 × MAP + 3996.1
K B = C 1 - BP C 2 - BP × C 1 - BT C 2 - BT
K S = C 1 - SP C 2 - SP
where C i - BP is the biomass carbon density obtained after a correction based on the annual mean precipitation. C i - BT is the biomass carbon density modified based on the annual mean temperature. C i - SP is the soil carbon density modified based on the annual mean precipitation. The mean annual precipitation (mm) is MAP and the mean annual temperature (°C) is MAT. C 1 - BP and C 2 - BP are the biomass carbon density of Henan Province and China based on the annual average precipitation. C 1 - BT and C 2 - BT are the biomass carbon density of Henan Province and the whole country after modification according to the annual mean temperature, respectively. K B and K S are the correction coefficients of biomass carbon density and soil carbon density, respectively. C 1 - SP and C 2 - SP are the soil carbon density in Henan Province and the whole country after modification according to the annual average precipitation [29,30,31,32].
All the above calculation results are summarized in Table 1 [33]:

2.3.3. Scenario Settings

The Shared Socioeconomic Pathway (SSP) describes the possible future development of society without the impact of climate change or climate policies. SSP1, SSP2, SSP3, SSP4 and SSP5 respectively represent five scenarios: sustainable development, moderate development, partial development, unbalanced development and conventional development [34].
In the Coupled Model Intercomparison Project 5 (CMIP5) climate model, the Representative Concentration Pathway (Representative Concentration Pathway, which is often abbreviated as RCP) is used to describe the impact of human activities in future scenarios, such as RCP2.6 (low emission), RCP4.5 (medium emission), and RCP8.5 (high emission) [35].
RCP8.5 is the baseline scenario without government intervention policies on climate change, characterized by increasing greenhouse gas emissions and concentrations. RCP6.0 is a government intervention climate scenario in which various policies and strategies have been developed to reduce GHG (greenhouse gas) emissions, but emission mitigation remains low compared to RCP2.6 and RCP4.5. RCP4.5 is another government intervention climate scenario in which the global population peaks at 9 billion and then declines. In this paper, SSP1-RCP2.6, SSP2-RCP4.5 and SSP5-RCP8.5 are used to represent the ecological protection scenario, normal development scenario and economic priority development scenario, respectively.

3. Result and Analysis

3.1. PLUS Model Verification

This study is based on the land use data of Henan Province in 2000, 2010 and 2020. Based on the land use status map of 2010, the PLUS model is used to simulate land use in 2020, and then the simulated land use distribution in 2020 is compared with the actual land use distribution in 2020 to obtain Figure 4. As can be seen from the comparative analysis of Figure 4, the real and simulated patterns are in good agreement. In order to verify the accuracy of the model simulation, the Kappa coefficient was calculated and it was found to be 0.95 on average and 0.91 for the coefficient. Generally, when Kappa > 0.75, the consistency between actual data and the simulation results is higher [36], indicating that the PLUS model has a good simulation effect and can provide high-precision future land use data for the InVEST model.

3.2. Land Use in Henan Province

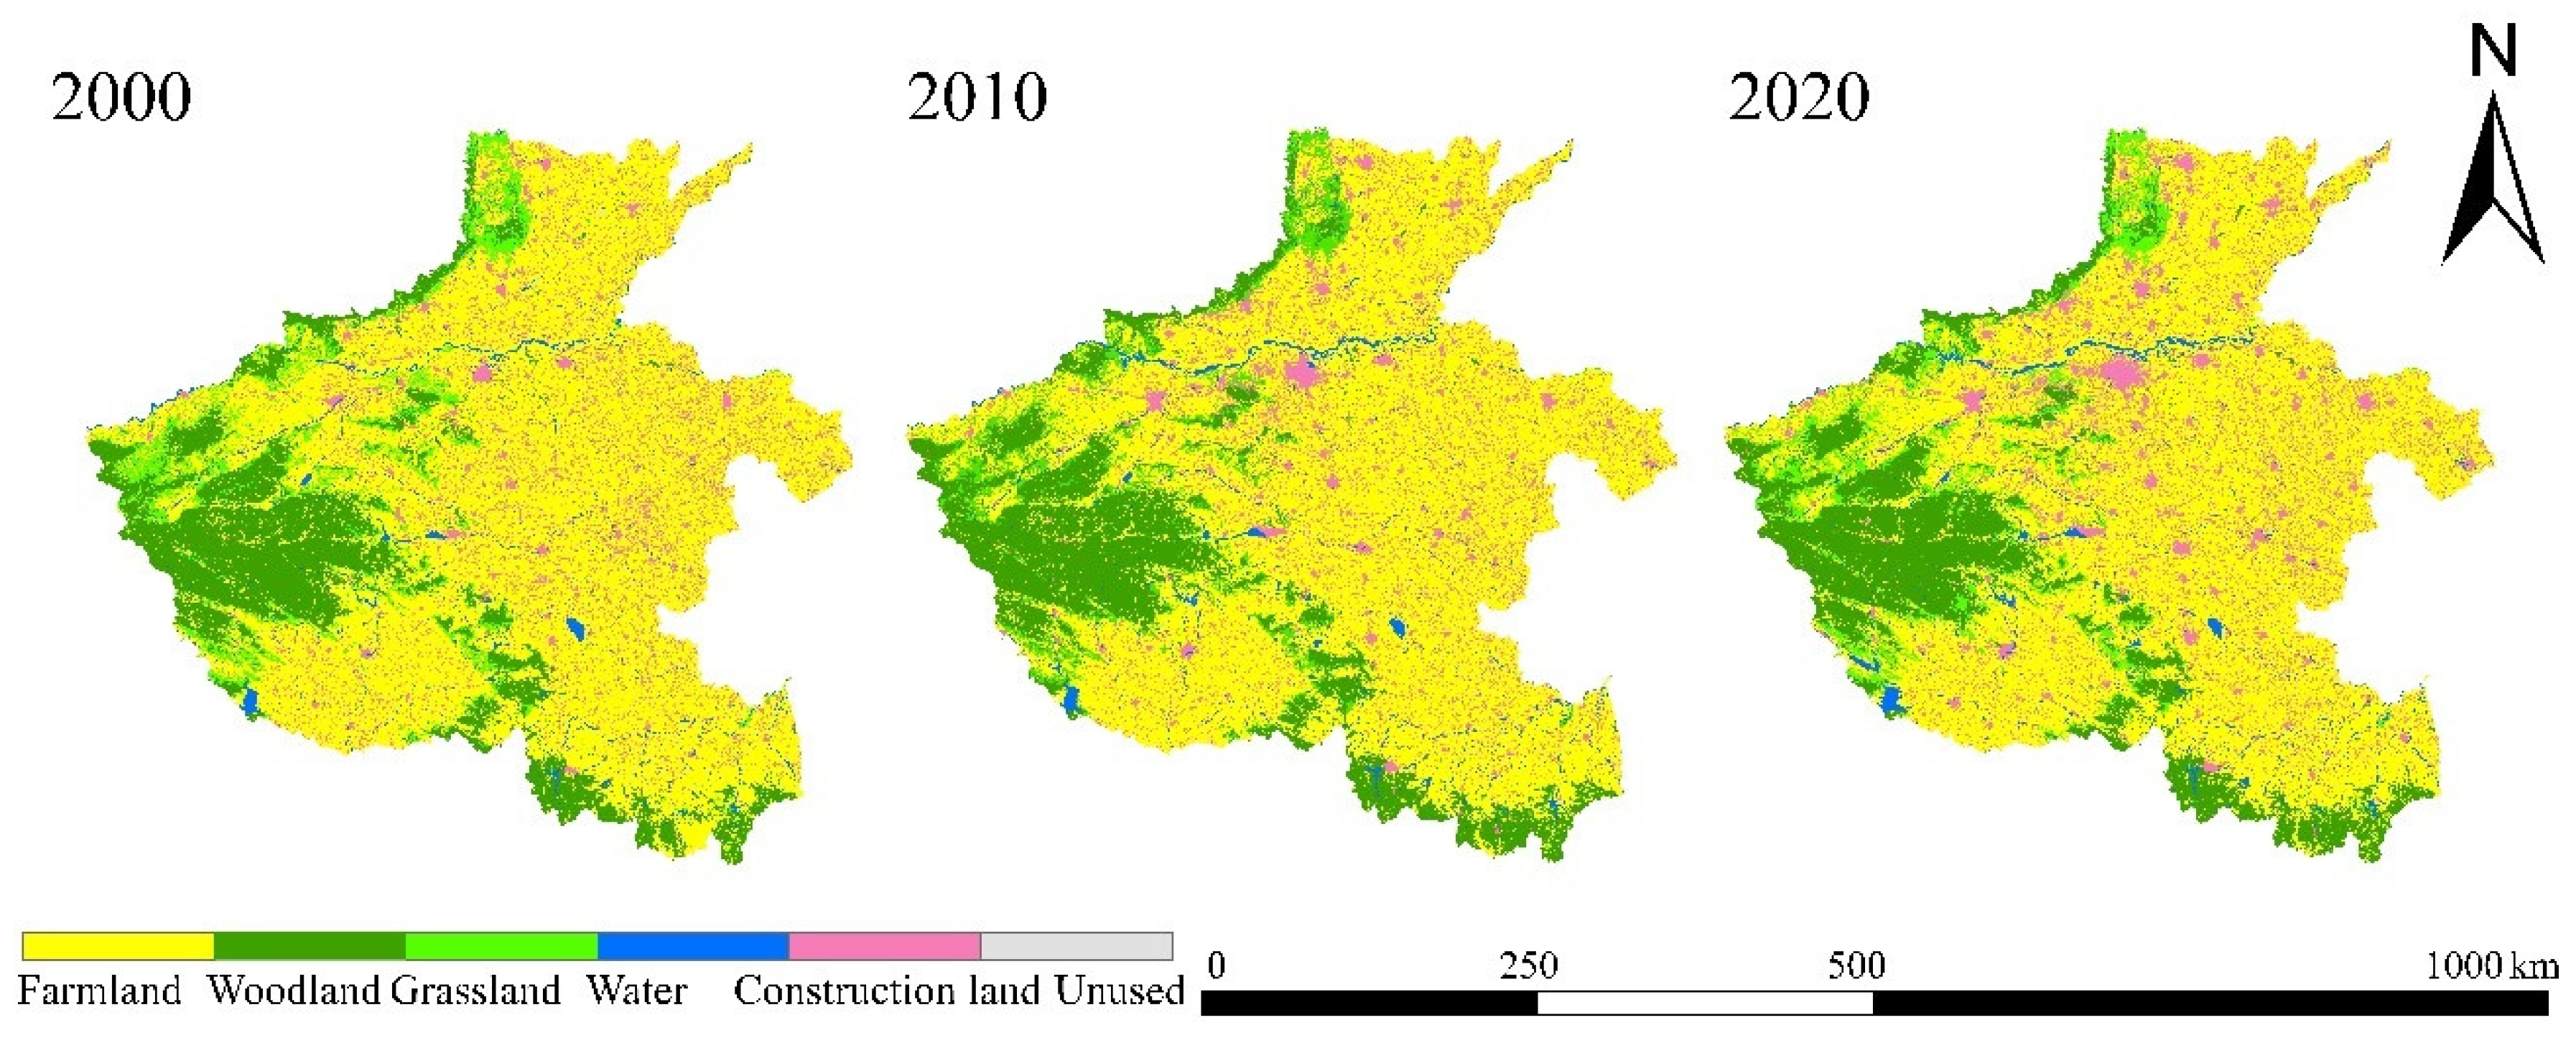
3.2.1. Current Situation of Land Use in Henan Province

Henan Province is a large agricultural province, and its farmland area ranks the third in China. The land use/cover data of Henan Province from 2000 to 2020 are mainly divided into six primary categories and 25 secondary categories. In this paper, we use ArcGIS to extract, crop, reclassify, and statistically analyze 2000, 2010, and 2020 land use and cover data to analyze the spatial–temporal change characteristics of land use and cover in Henan Province.
According to the land use and cover maps of the three phases (Figure 5), the land use transfer matrix of 2000–2010 (Table 2), the land use transfer matrix of 2010–2020 (Table 3) and the corresponding chord chart (Figure 6), the farmland showed a trend of gradual decrease during the 30 years from 2000 to 2010, and the woodland first increased and then decreased, showing an overall growth trend. Grassland and unused land first decreased, then increased and finally showed a decreasing trend, while water area and construction land showed an increasing trend during the 2000–2020 period.
As can be seen from the chord diagram of land use change, from 2000 to 2010, the decrease in farmland mostly went to construction land, the decrease in grassland mostly went to woodland, and the decrease in unused land mainly went to farmland. The increase in woodland, construction land and water area came mainly from a reduction in farmland. Over the ten-year period from 2010 to 2020, the decrease in farmland mostly went to construction land, the decrease in grassland mostly went to woodland, and the decrease in unused land mostly went to farmland. The increase in woodland, construction land and water area came mainly from a decrease in farmland and grassland. The changes in land use and cover in 2010–2020 are essentially the same as in 2000–2010. The proportion of farmland, grassland, water area, construction land and unused land has changed little over the past two decades, while woodland has increased significantly over the 2010–2020 period compared to the 2000–2010 period. This is also closely related to the policy of returning farmland to woodland over the 2010–2020 period.

3.2.2. Prediction of Land Use and Cover under Different Scenarios in Henan Province in the Future

In this paper, the PLUS model is used to model land use and cover changes in 2030, 2040 and 2050 under three scenarios: SSP1-RCP2.6, SSP2-RCP4.5 and SSP5-RCP8.5. Through a vertical comparison (as shown in Figure 7 and Table 4), it is obvious that under the SSP1-RCP2.6 scenario from 2030 to 2050, the woodland and construction land show a significant increasing trend, while the farmland and grassland show a decreasing trend, and the water area basically maintains a balance. Unused land declines between 2030 and 2040 and then remains in equilibrium between 2050 and 2040. Under the SSP2-RCP4.5 scenario, farmland and construction land show a trend of significant increase from 2030 to 2050, woodland and grassland show a trend of decrease, water area basically remains balanced, and unused land is basically flat from 2030 to 2040 and shows a trend of decline from 2040 to 2050. Under the SSP5-RCP8.5 scenario, farmland and construction land show a significant increasing trend from 2030 to 2040, woodland and grassland show a decreasing trend, water area remains balanced, and unused land decreases from 2030 to 2040 and then remains balanced from 2050.

3.3. Carbon Storage in Henan Province

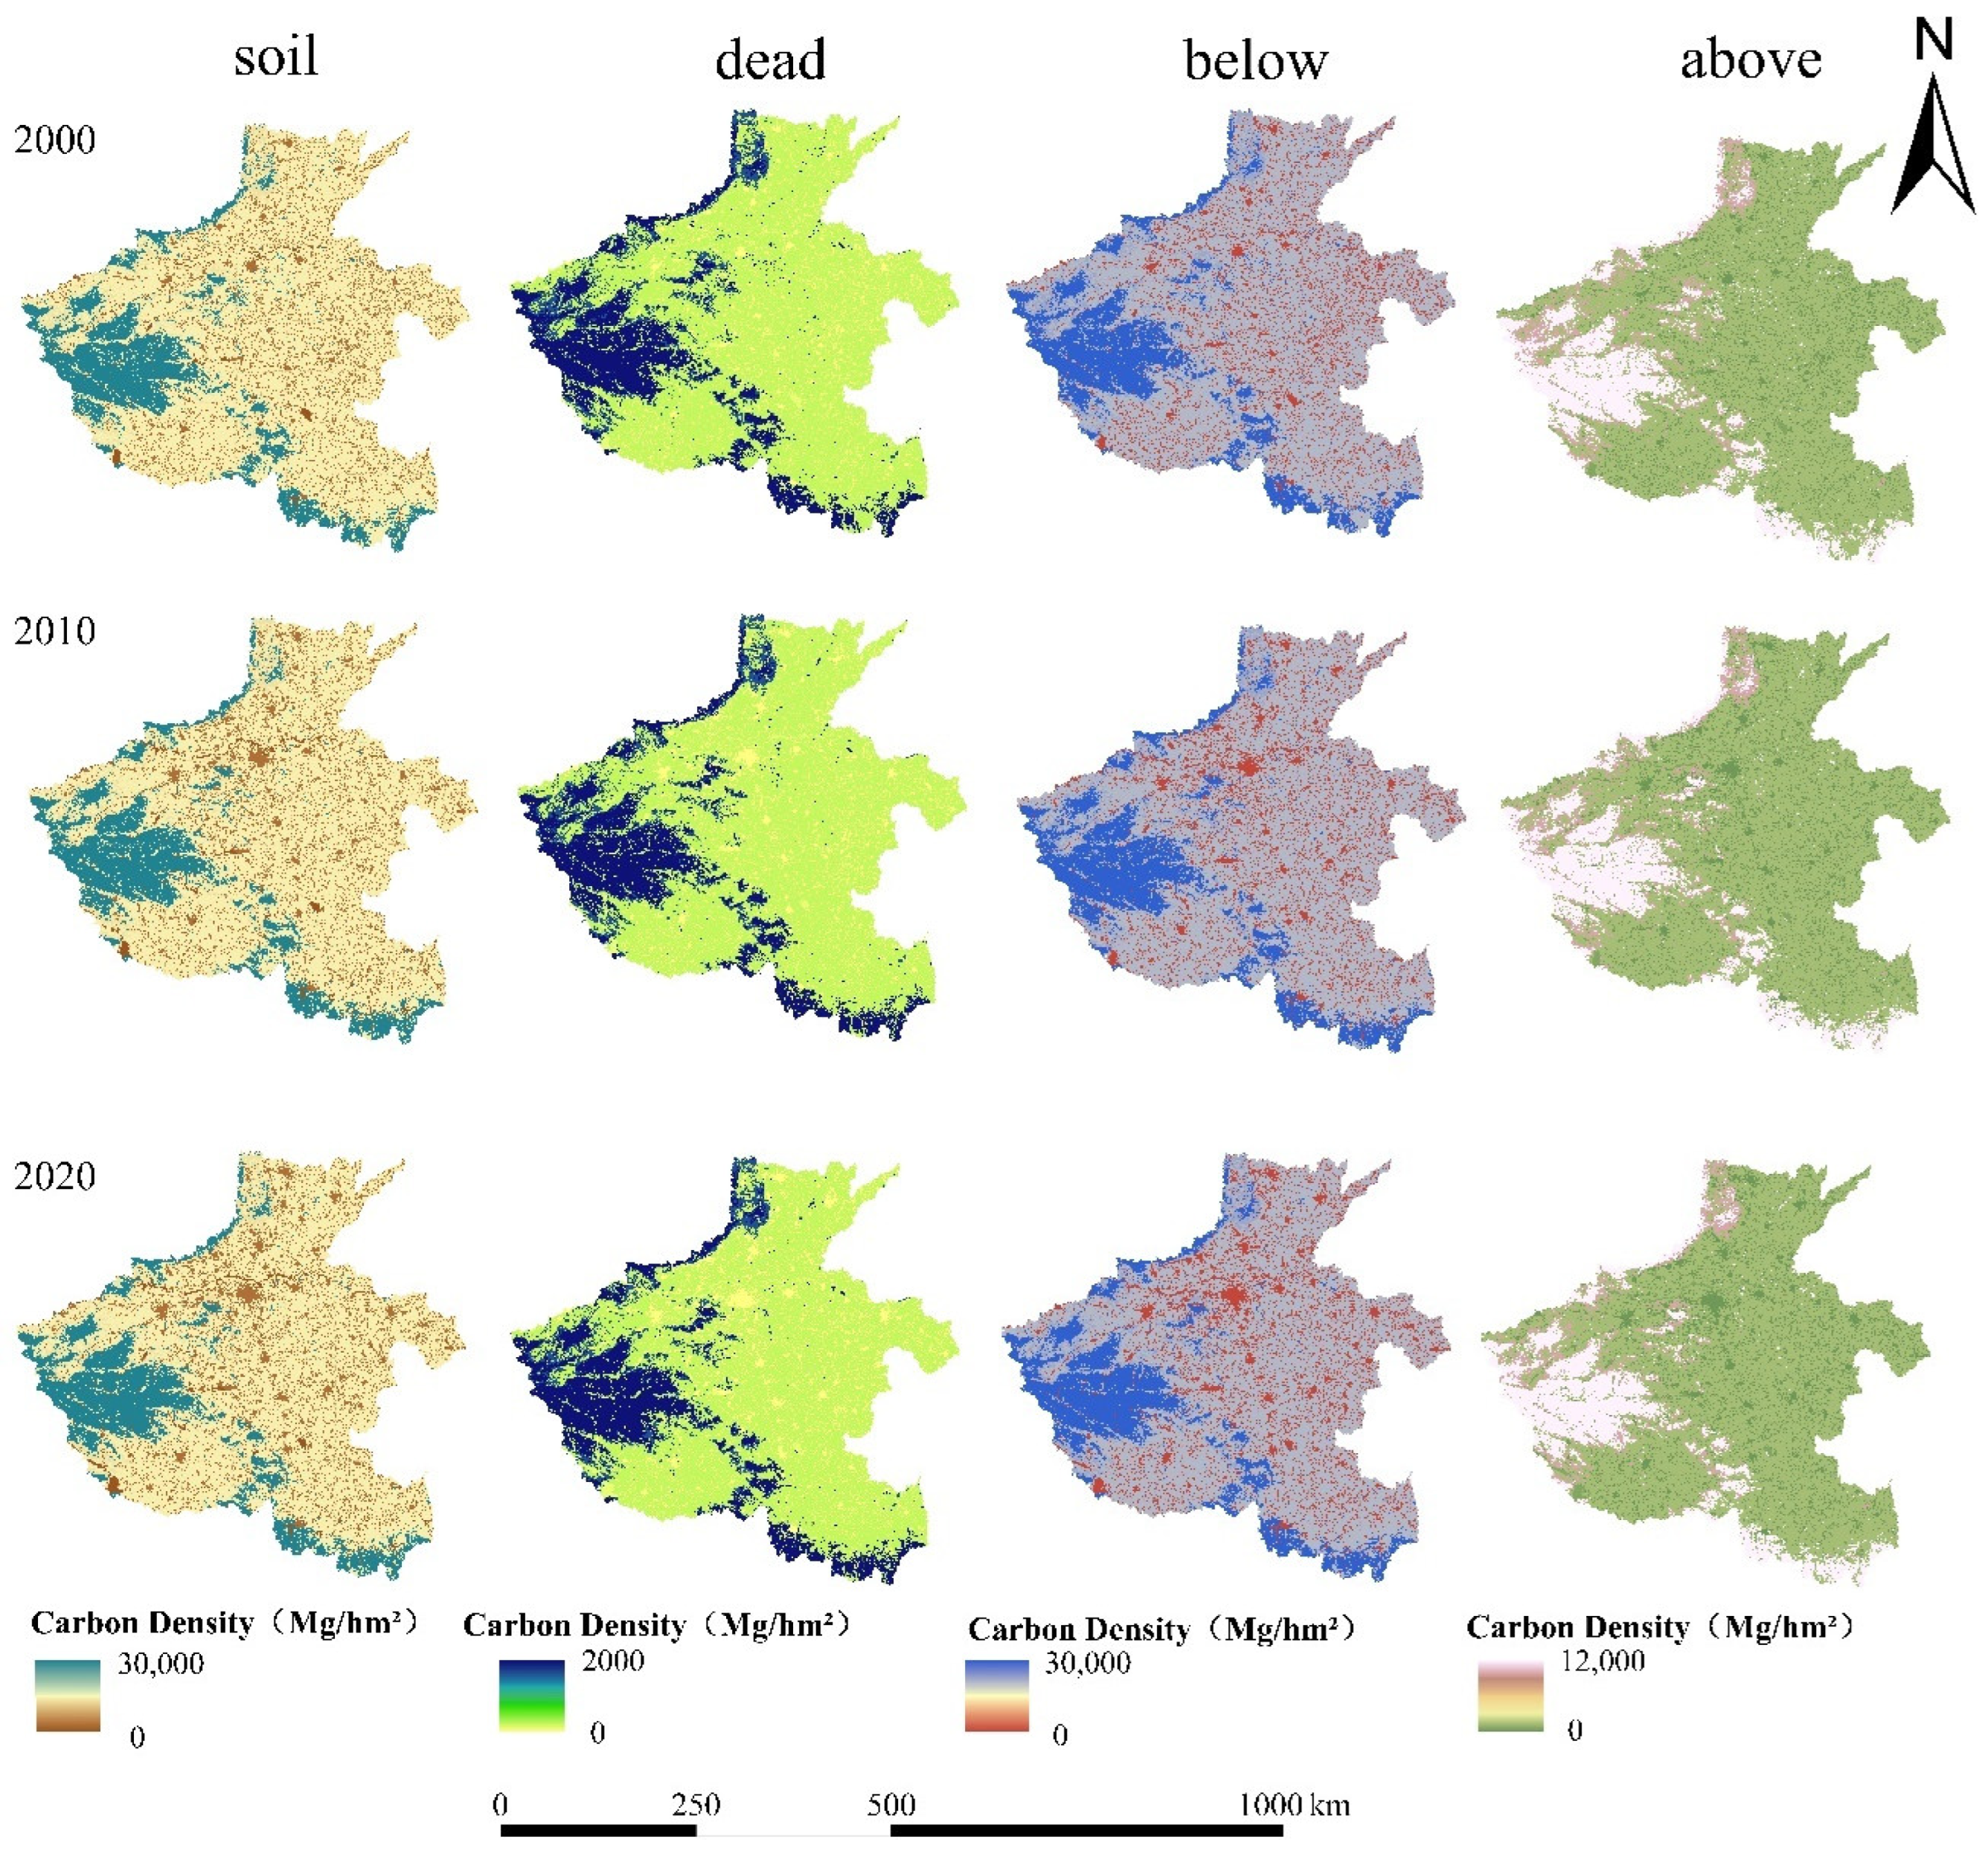
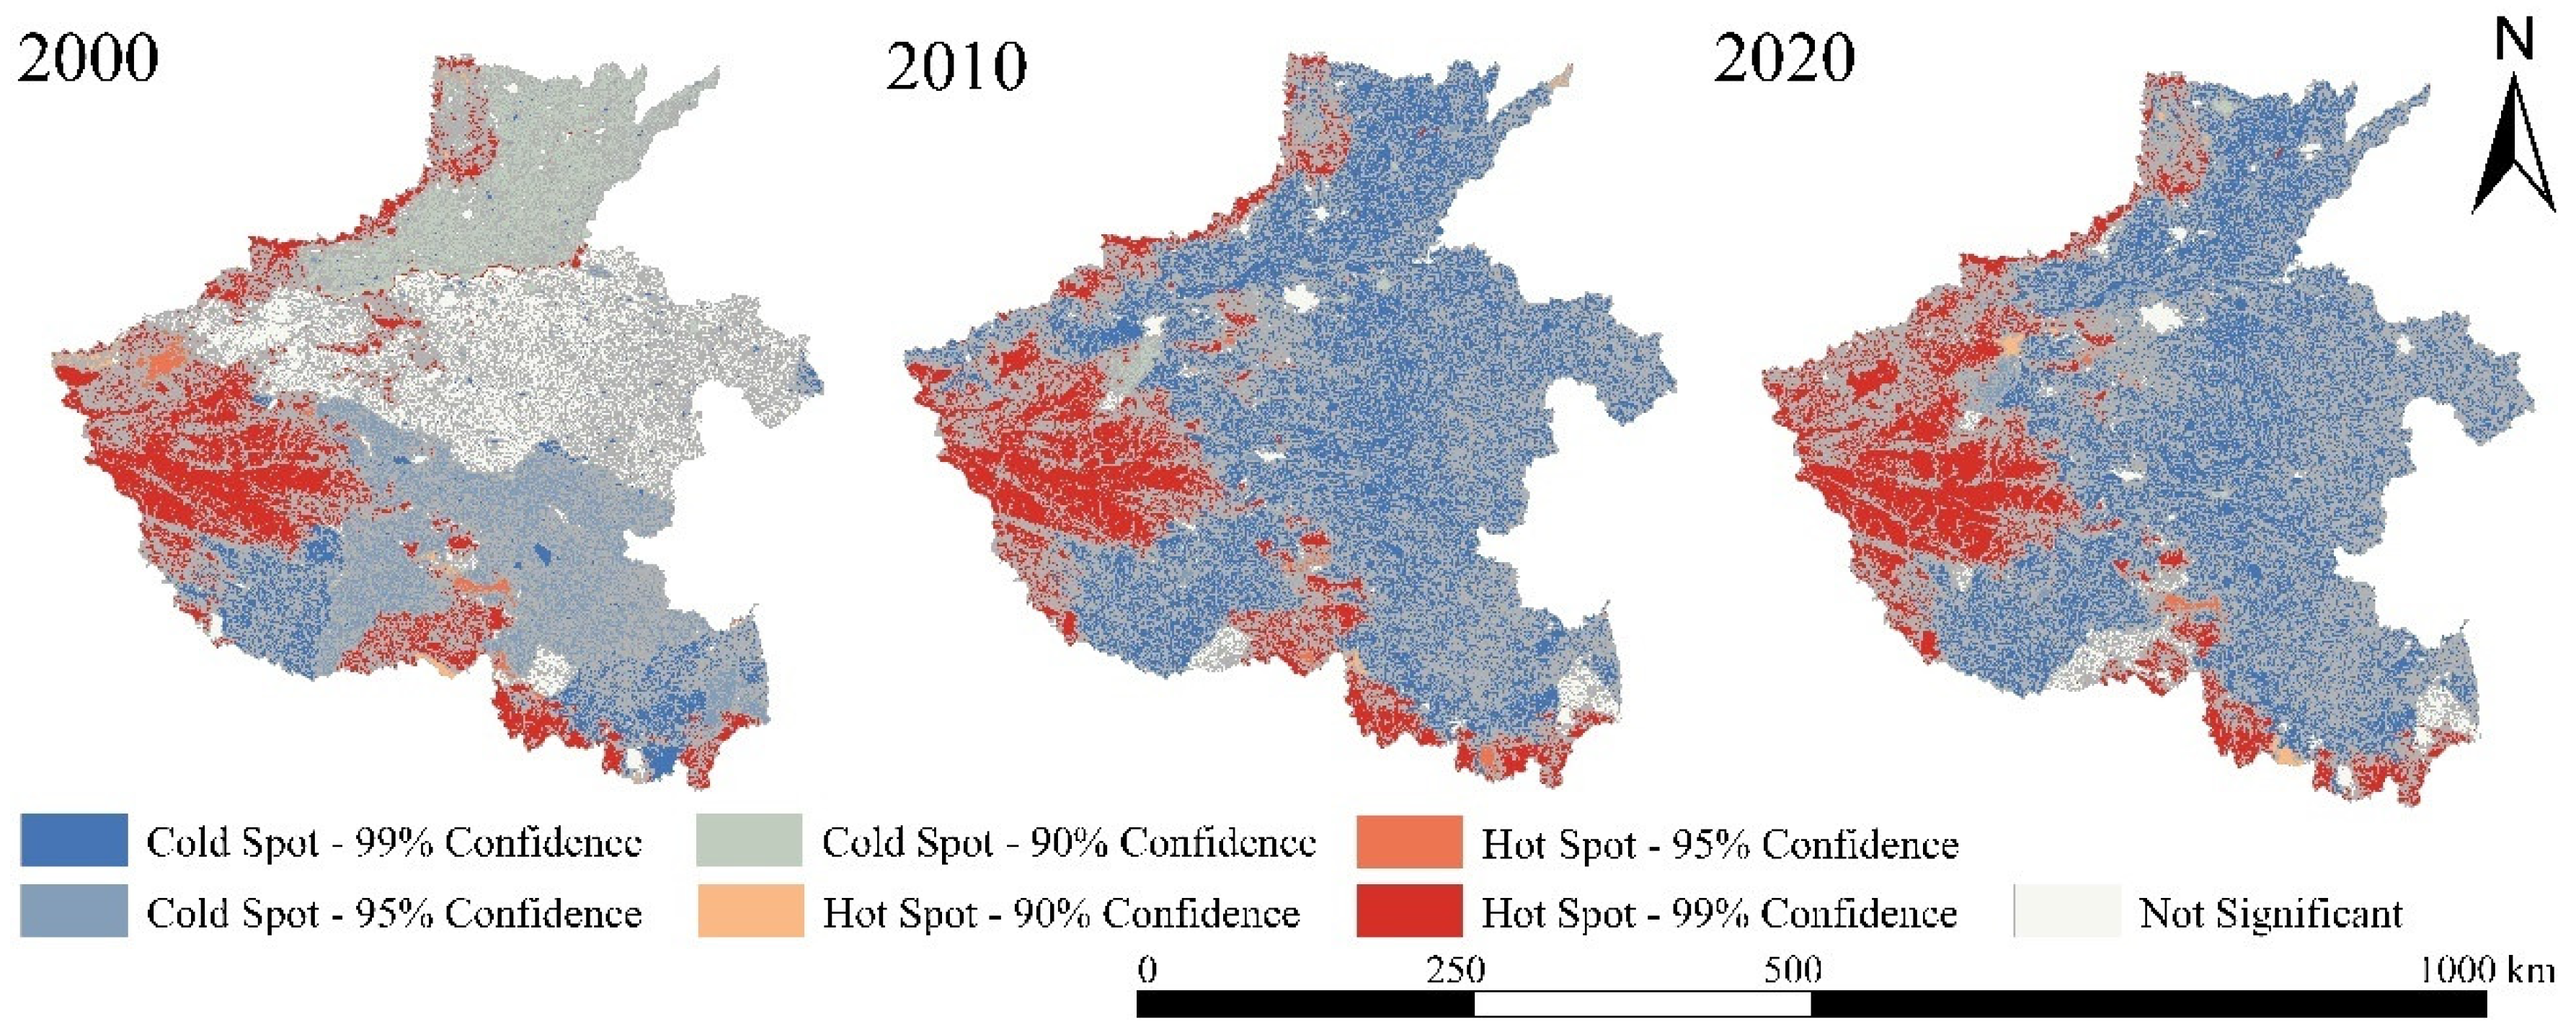
3.3.1. Variation Characteristics of Carbon Storage in Henan Region

The carbon storage plate of the InVEST model contains four basic carbon pools: the soil carbon pool, the dead organic carbon pool, the underground carbon pool (below), and the aboveground carbon pool. The total carbon storage in Henan in 2000, 2010 and 2020 is about 5928 Tg, 5851 Tg and 5755 Tg, respectively, and the carbon storage and carbon density continue to show a downward trend in the three decades from 2000 to 2020, as can be seen from the spatial distribution maps of four types of carbon storage in the three periods (Figure 8). The spatial distribution of carbon storage in Henan is higher in the west and lower in the east. Carbon storage is mainly located in the western and southern regions of Henan, while the central and eastern regions have lower carbon storage and carbon density.

3.3.2. Prediction of Carbon Storage in Henan under Different Scenarios in the Future

This paper uses the InVEST model to set different scenarios and forecast the total carbon storage of Henan in 2030, 2040 and 2050 (as shown in Table 5 and Figure 9). By comparing the total carbon storage of the adjacent ten years, it can be known that under two scenarios, SSP2-RCP4.5 and SSP5-RCP8.5, and three time periods, the total carbon storage in each stage decreases to different degrees. The decrease in carbon storage is relatively small for the SSP2-RCP4.5 scenario and relatively large for the SSP5-RCP8.5 scenario. Under the SSP1-RCP2.6 scenario, total carbon storage decreases significantly during 2020–2030, continues to decrease but with a smaller amplitude during 2030–2040, and recovers slightly during 2040–2050. From a spatial distribution point of view, the low values of carbon storage mainly appear in the central and northern parts of Henan province, with Zhengzhou as the center, indicating that energy consumption due to economic development also affects regional carbon storage.

3.4. The Relationship between Land Use Change and Carbon Storage

As can be seen from the land use and cover change map from 2000 to 2010 (as shown in Figure 10), the overall land types in Henan Province showed high values throughout the period from 2000 to 2010, indicating that most land types showed an increasing trend on the whole, and high values were concentrated in the central and northern parts of Henan Province. A comparative analysis of the 2000 and 2010 land use maps showed that the increase is mainly in construction land. Compared with the 2000 and 2010 land use maps, it can be seen that the increased land types in the high-value areas of southern Henan were mainly woodland. In the period from 2010 to 2020, the overall land class change in Henan was less than in the period from 2000 to 2010. Among them, the small amplitude of the high value was concentrated in the central and eastern parts of Henan Province. Based on the comparative analysis of the 2010 land use map and the 2020 land use map, it can be seen that the increase in land type is mainly due to the increase in construction land.
It can be seen from the carbon storage change chart from 2000 to 2010 that the carbon storage of Henan Province showed a trend of substantial reduction during the decade, among which the low value and relatively dense value in the central and northern parts of Henan Province indicated that the reduction of carbon storage was more concentrated in the central and northern parts of Henan Province. The dense distribution of high values in the northeast and eastern regions indicates that the carbon storage in the northeast and eastern regions of Henan has a small amplitude and a large area of increasing trend, and the small area of high values in the southern region indicates that the small area of carbon storage in the southern region of Henan has a small area of concentrated increasing trend. The overall change in carbon storage in Henan during the 2010–2020 period is smaller than that during the 2000–2010 period. In the west of Henan Province, there is an obvious scattered distribution of high values, indicating that the carbon storage in the west of Henan Province has a scattered increasing trend, while the low values are more distributed in the central and eastern regions, indicating that the carbon storage in the central and eastern regions of Henan Province has an overall decreasing trend.
According to studies by relevant scholars, woodland has the highest carbon density, followed by farmland and the lowest by construction land, which is inseparable from the principle of carbon storage in ecosystems and vegetation biomass. The vegetation coverage of non-construction land is much higher than that of construction land, which has the lowest carbon storage due to its low vegetation coverage and large carbon emissions. Through a comparative analysis of land use and cover change and temporal and spatial changes of carbon storage from 2000 to 2010 to 2020, it can be seen that with the decrease in farmland and the increase in construction land in central and eastern Henan Province, carbon storage in central and eastern Henan Province also presents a trend of gradual decrease. Through a comparative analysis of land use and cover change and temporal and spatial changes of carbon storage from 2000 to 2010 to 2020, it can be seen that with the decrease in farmland and the increase in construction land in central and eastern Henan Province, carbon storage in central and eastern Henan Province also presents a trend of gradual decrease. With the concentration of woodland in the southern region, the carbon storage in the southern region of Henan Province also showed a corresponding increasing trend. It can be found that spatial–temporal changes in land use and cover have a significant impact on spatial–temporal changes in carbon storage. Therefore, how to improve the carbon storage through land use layout adjustments and optimization is a matter of current concern.

4. Discussion

Ecosystem carbon storage is affected by a number of factors. This paper focuses on the impact of land use change on carbon storage. The analysis shows that the carbon storage loss is the most serious in Zhengzhou and Luoyang, indicating that the increase in non-ecological land such as construction land expansion caused by economic development will lead to the increase in carbon emissions and the decrease in carbon storage, which is consistent with the coupling of urban expansion and farmland protection, which is the main reason for the decrease in carbon storage, as proposed by Ke [37].
In terms of future scenario settings, Sun established the natural development scenario and the ecological protection scenario [38], and Wang added the farmland protection scenario and comprehensive protection scenario in terms of ecological protection in a more detailed way, but these still lacked a comparison of the over-pursuing development scenario [39]. The three scenarios selected in this paper can be intuitively found from the comparative analysis that the carbon storage function of Henan Province will be significantly improved under the ecological protection scenario.
Based on the model prediction analysis, it can be seen that land use changes affect the carbon storage of the ecosystem. The contribution of farmland and woodland to the carbon storage is positive, while the increase in construction land will have a negative impact on the carbon storage of the ecosystem, which is consistent with the research results of Wang [40]. At the same time, factors such as elevation, slope, direction, road, distance from the city, and distance from the county will also have a certain impact on the distribution of carbon storage [41], which is also confirmed by the analysis of this study. According to the research of relevant scholars, soil carbon storage accounts for 73% of the total carbon storage per unit area, of which deep carbon storage is the largest [42]. With the continuous development of the social economy, the increase in construction land and the decrease in non-ecological land such as farmland and woodland are also the main reasons for the decrease in carbon storage in economically developed areas annually [43].
Based on the PLUS model and the InVEST model, land use and carbon storage in 2030, 2040 and 2050 are simulated and predicted based on land use data from 2000 to 2030. The results of the study show that under the scenario of natural development and eco-nomic priority development, there is a significant increase in farmland and woodland compared to the scenario of ecological protection. From the point of view of carbon storage, the reduction in carbon storage under the scenario of natural development is the smallest and the carbon storage is the best.
At the same time, the study has some shortcomings. The change in land use involves a combination of many factors, and the carbon density is always in a state of dynamic change due to constant changes in climate and human activity. The carbon density data used in this paper are based on a literature survey and references to previous studies in the same field. There may be some differences in the carbon density data due to the different selection of the influence factors. Secondly, in terms of the selection of driving factors, Lin selected 14 driving factors to predict land use [44]. Due to the availability of data, only 11 data types were available for this paper, and the effect of other factors on carbon storage could not be determined. In future studies, the effects of local historical conditions, land use and economic policies can also be considered.

5. Conclusions

Based on land use changes in Henan Province, this study combines PLUS and In-VEST models to predict land use coverage and carbon storage in 2030, 2040 and 2050 under three different scenarios and discuss the relationship between the two. The main conclusions are as follows:
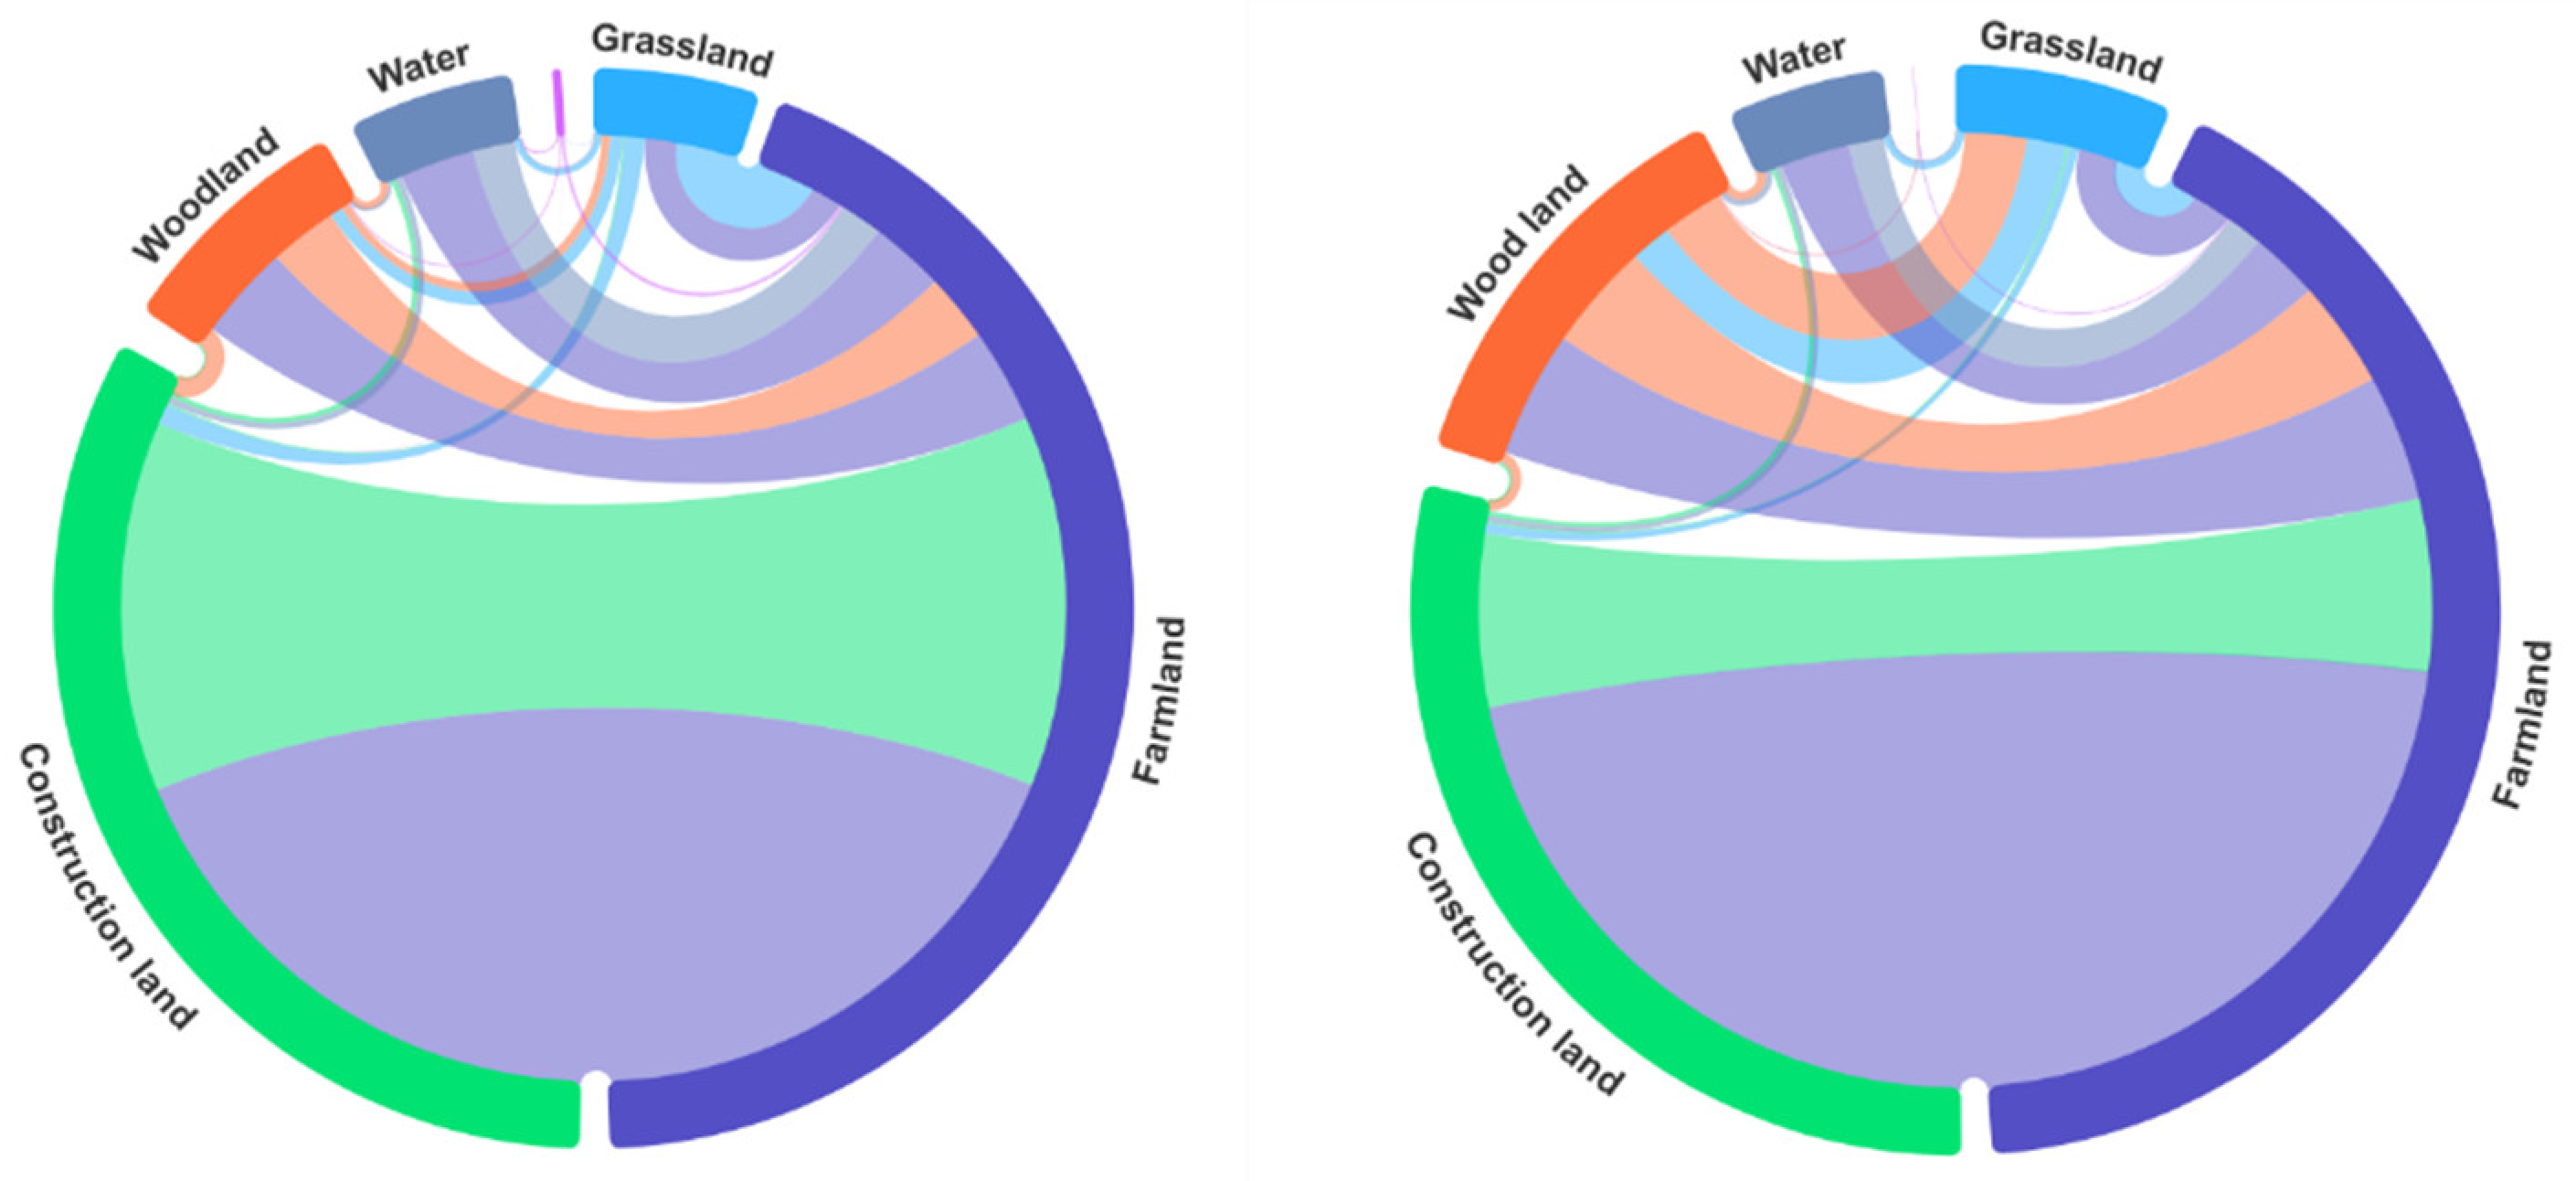
  • During the 2000 to 2020 period, farmland in Henan showed a decreasing trend, water area and construction land showed a steady growth trend, grasslands showed a decreasing trend, and woodland showed first an increasing and then a decreasing trend. Overall, the carbon storage in Henan has been on an annual downward trend. The central and northern regions of Henan, with Zhengzhou as the main center, have low carbon storage, which is closely related to rapid economic development, urban location and transportation.
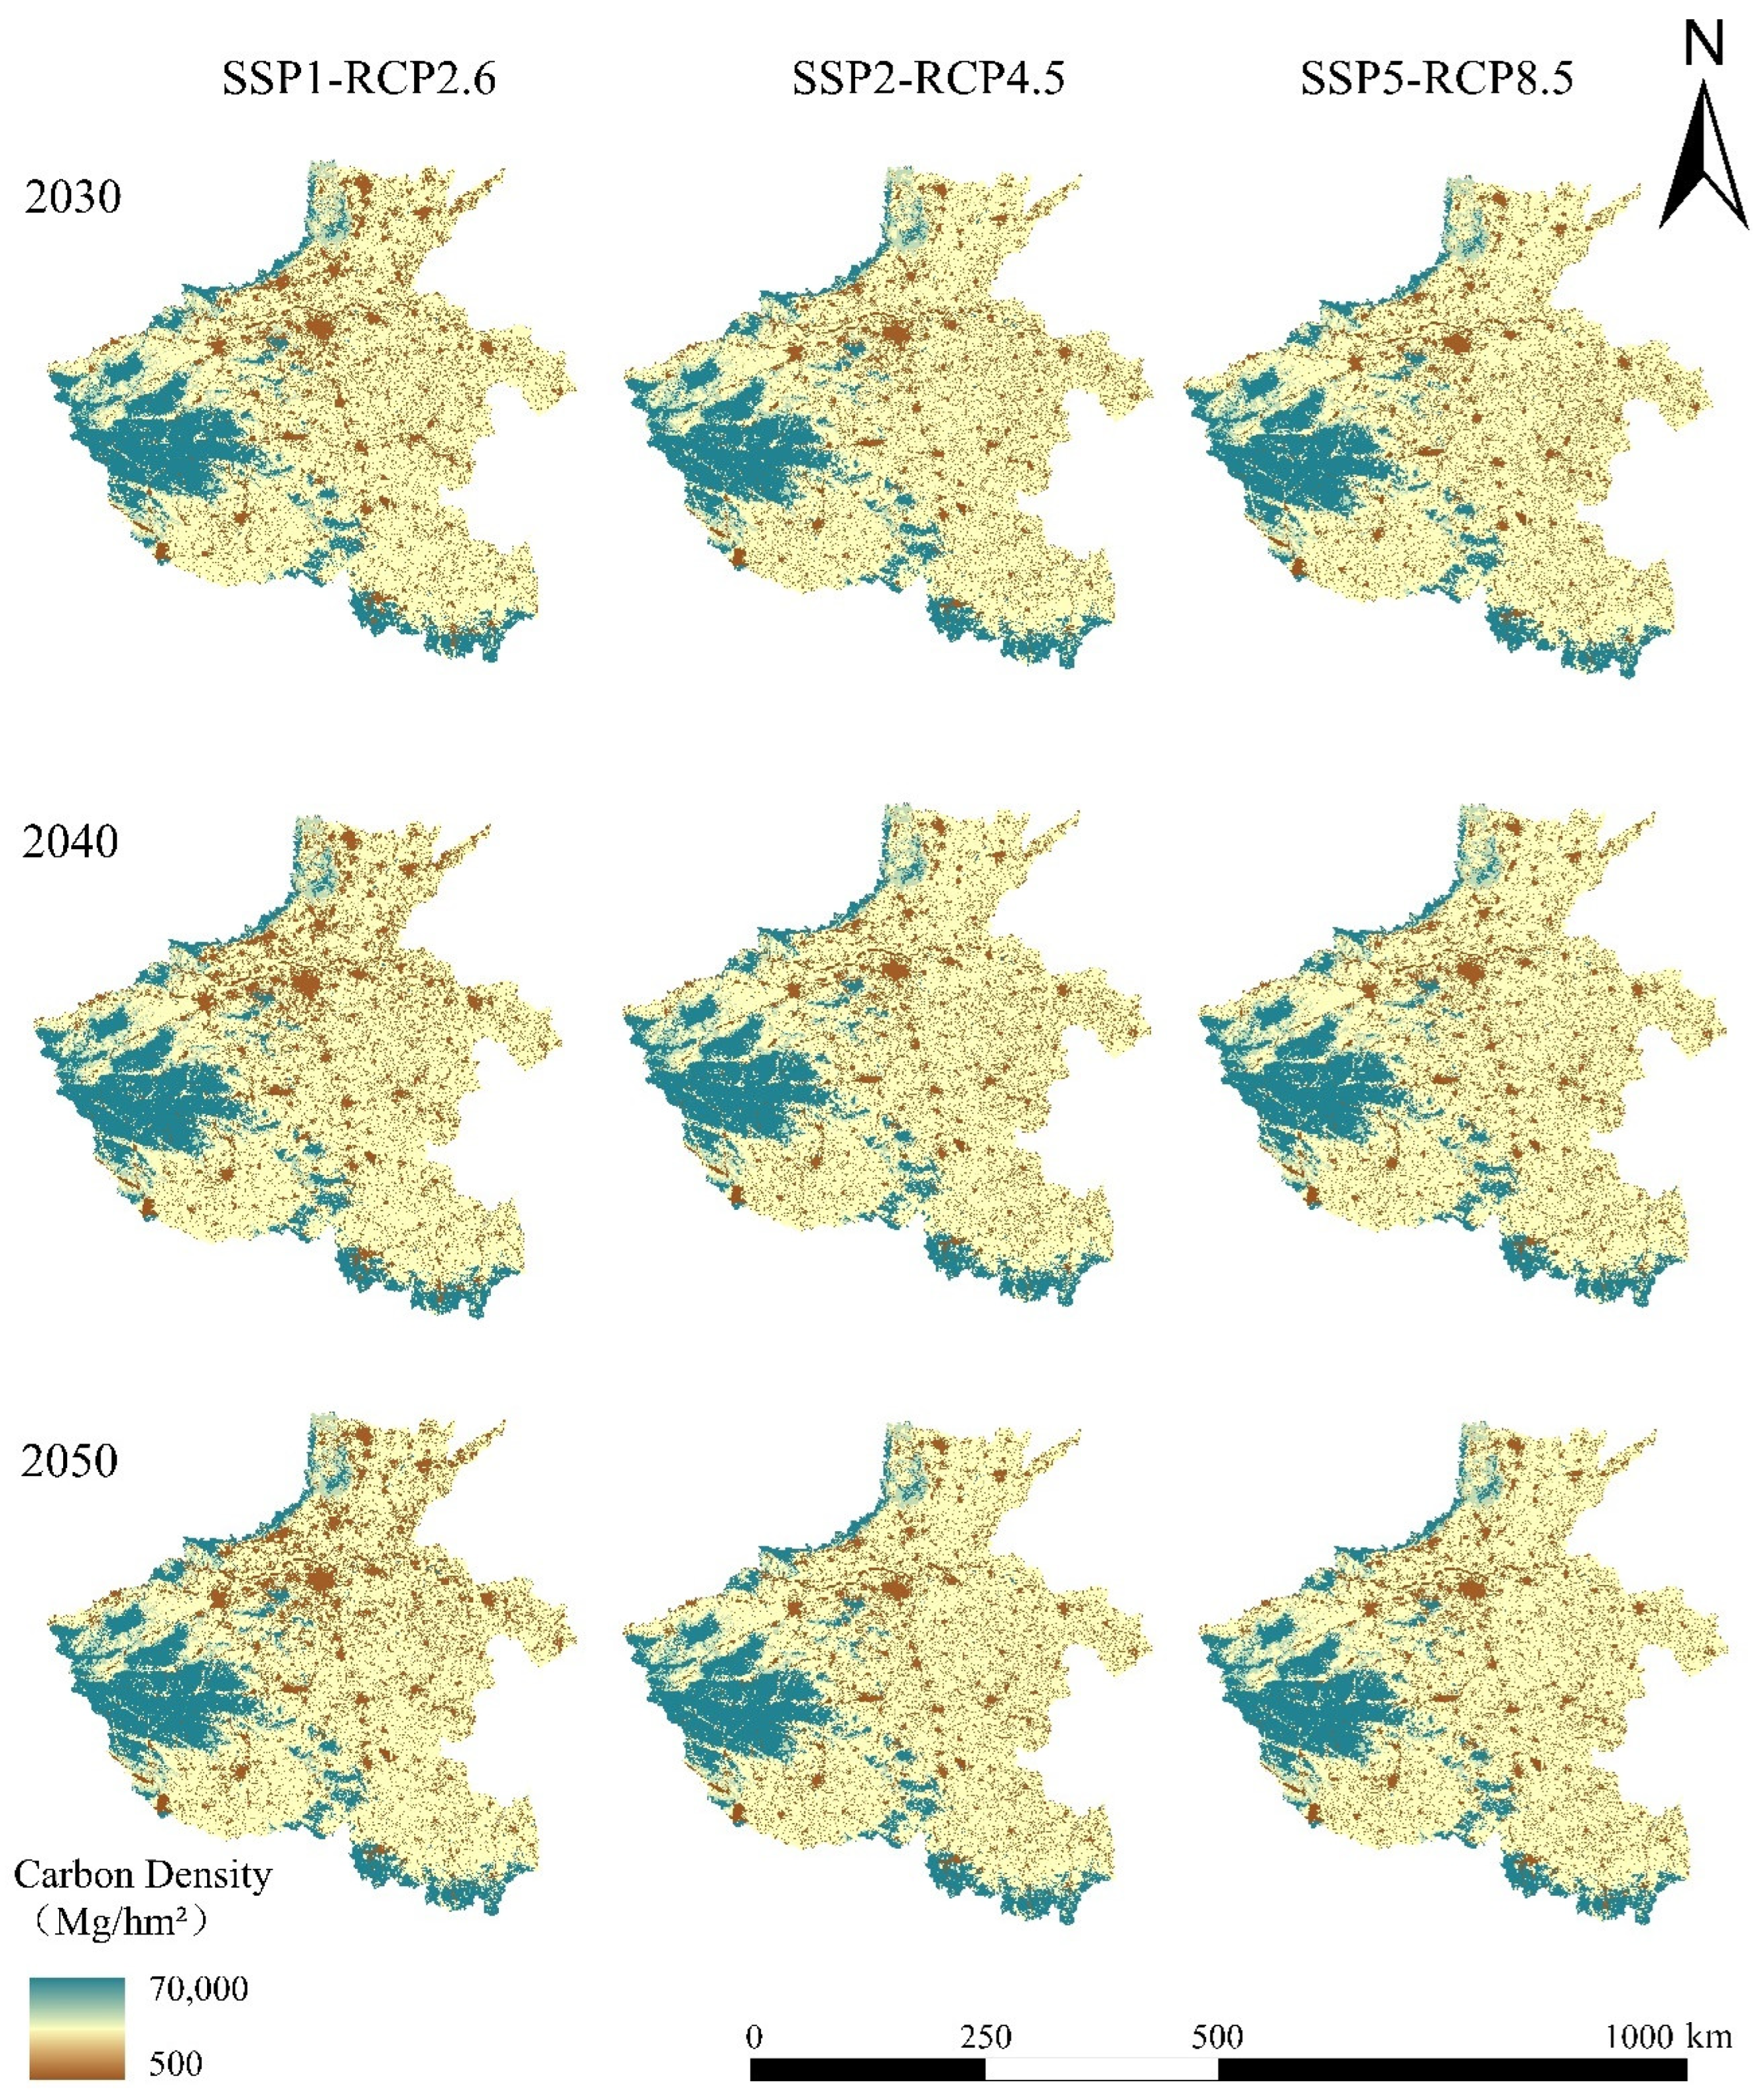
  • From 2030 to 2050, based on the predicted land use and cover in Henan, it can be seen that under the normal development scenario, the area of farmland and woodland basically shows a continuous downward trend, while the area of construction land shows an annual upward trend. Under SSP2-RCP4.5 and SSP5-RCP8.5, there is an increasing trend of farmland and construction land.
  • From 2030 to 2050, according to the predicted carbon storage in Henan Province, it can be seen that the decline trend of carbon storage in Henan Province is the smallest under the SSP2-RCP4.5 scenario, and the overall declining trend of carbon storage in the SSP1-RCP2.6 scenario is also the largest among the three scenarios. The downward trend of carbon storage in the SSP5-RCP8.5 scenario is in between.

Author Contributions

M.L.: data curation, writing—original draft. J.Z.: data curation, validation. H.G.: methodology. G.J.: writing—review and editing. G.L.: visualization. L.L.: software, resources. Q.L.: investigation. All authors have read and agreed to the published version of the manuscript.

Funding

This research was funded by the National Key R&D Program of China (2021YFD1700900), the Special Fund for Top Talents of Henan Agricultural University (30501031), the National Development and Reform Commission Energy Bureau project ([2017]20-24), the Henan Agricultural University graduate education reform project (NDYJSJG2021-15), and the Study on High Quality Development Path of Grain Production in Henan Province (SKL-2023-2727).

Data Availability Statement

Data is contained within the article.

Conflicts of Interest

The authors declare no conflict of interest.

References

  1. Han, C.Q.; Zheng, J.H.; Wang, Z.; Yu, W.J. Spatiotemporal variation and multi-scenario simulation of carbon storage in terrestrial ecosystems in Turpan-Hami Basin based on PLUS-InVEST model. Arid. Land Geogr. 2023. epub ahead of printing. [Google Scholar]
  2. Li, J.P. Research on Land Use Change and Ecosystem Carbon Storage Based on InVEST Model—Taking Xiong’an New Area as an Example. Master’s Thesis, Hebei Agriculture University, Baoding, China, 2021. [Google Scholar]
  3. Wang, X.K.; Feng, Z.W.; Ouyang, Z.Y. Vegetation carbon storage and density of forest ecosystems in China. Chin. J. Ecol. 2001, 13–16. [Google Scholar] [CrossRef]
  4. He, L.Q.; Liu, Q.; Wang, D.C.; Zhang, Z.H.; Xu, C.; Shi, M.Y. Estimation of soil organic carbon storage based on digital soil mapping technique. J. Appl. Ecol. 2021, 32, 591–600. [Google Scholar]
  5. Zhong, F.F.; Du, J.Q.; Zhu, X.Q.; Sun, B.Q.; Li, L.J.; Song, Z.B.; Wu, L.Y.; Chen, X.Y.; Zhai, G.Q. Carbon Storage Estimation and Spatial Pattern Analysis of Terrestrial Ecosystems in the Beijing-Tianjin-Hebei Region. Res. Environ. Sci. 2023, 36, 2065–2073. [Google Scholar]
  6. Wang, Z. Spatial and Temporal Dynamics of Forest Carbon Storage and Influencing Factors Based on CASA Model in Hangzhou. Master’s Thesis, Zhejiang A&F University, Hangzhou, China, 2022. [Google Scholar]
  7. Xu, Y.T. Temporal and Spatial Variation and Prediction of Carbon Storage in Zhongyuan Urban Agglomeration. Master’s Thesis, Zhengzhou University, Zhengzhou, China, 2022. [Google Scholar]
  8. Wu, Z.; Chen, X.; Liu, B.B.; Chu, J.; Peng, L. Research Progress and Application of InVEST model. Chin. J. Trop. Agric. 2013, 33, 58–62. [Google Scholar]
  9. Zaehle, S.; Bondeau, A.; Carter, T.R.; Cramer, W.; Erhard, M.; Prentice, I.C.; Reginster, I.; Rounsevell, M.D.; Sitch, S.; Smith, B.; et al. Projected changes in terrestrial carbon storage in Europe under climate and land-use change, 1990–2100. Ecosystems 2007, 10, 380–401. [Google Scholar] [CrossRef]
  10. Jing, Y.Q.; Zhang, F.; Zhang, Y. Change and prediction of the land use/cover in Ebinur Lake Wetland Nature Reserve based on CA-Markov model. Chin. J. Appl. Ecol. 2016, 27, 3649–3658. [Google Scholar]
  11. Zhang, F.; Tang, G.A.; Cao, M.; Yang, J.Y. Simulation of Positive and Negative Terrain Evolution in Small loess Watershed Based on ANN-CA Model. Geogr. Geo-Inf. Sci. 2013, 29, 28–31;+1. [Google Scholar]
  12. Jiang, W.; Deng, Y.; Tang, Z.; Lei, X.; Chen, Z. Modelling the potential impacts of urban ecosystem changes on carbon storage under different scenarios by linking the CLUE-S and the InVEST models. Ecol. Model. 2017, 345, 30–40. [Google Scholar] [CrossRef]
  13. Zhang, J.D.; Mei, Z.X.; Lv, J.H.; Chen, J.Z. Simulating Multiple Land Use Scenarios based on the FLUS Model Considering Spatial Autocorrelation. J. Geo-Inf. Sci. 2020, 22, 531–542. [Google Scholar] [CrossRef]
  14. Wang, X.; Ma, B.W.; Li, D.; Chen, K.; Yao, H. Multi-scenario simulation and prediction of ecological space in Hubei province based on FLUS model. J. Nat. Resour. 2020, 35, 230–242. [Google Scholar]
  15. Wang, X.; Wang, C.Y.; Lv, F.N.; Chen, S.L.; Yu, Z.R. Temporal and spatial carbon storage change and carbon sink improvement strategy of district and county level based on PLUS-InVEST model: Taking Yanqing District as an example. Chin. J. Applled Ecol. 2023, 34, 3373–3384. [Google Scholar]
  16. Wang, Z.H.; Wang, B.; Zhang, Y.F.; Zhang, Q.L. Dynamic simulation of multi-scenario land use change and carbon storage assessment in Hohhot city based on PLUS-InVEST model. J. Agric. Resour. Environ. 2023; Epub ahead of printing. [Google Scholar] [CrossRef]
  17. Liu, X.J.; Li, X.; Liang, X.; Shi, H.; Ou, J. Simulating the Change of Terrestrial Carbon Storage in China Based on the FLUS-InVEST Model. Trop. Geogr. 2019, 39, 397–409. [Google Scholar]
  18. Shi, J.; Shi, P.J.; Wang, Z.Y.; Cheng, F.Y. Spatial-Temporal Evolution and Prediction of Carbon Storage in Jiuquan City Ecosystem Based on PLUS-InVEST Model. J. Environ. Sci. 2024, 45, 300–313. [Google Scholar]
  19. Hu, J.X.; Le, X.W.; Wang, W.L.; Xiong, Y.; Tan, X.L. Temporal and Spatial Evolution and Prediction of Ecosystem Carbon Storage in Jiangxi Province Based on PLUS-InVEST Model. J. Environ. Sci. 2023; Epub ahead of printing. [Google Scholar] [CrossRef]
  20. Yu, Z.L.; Zhao, M.S.; Gao, Y.F.; Wang, T.; Zhao, Z.D.; Wang, S.H. Spatio-temporal Evolution and Prediction of Carbon Storage in Huaibei City Based on InVEST-PLUS Model. J. Environ. Sci. 2023; Epub ahead of printing. [Google Scholar] [CrossRef]
  21. Yue, S.; Ji, G.; Chen, W.; Huang, J.; Guo, Y.; Cheng, M. Spatial and Temporal Variability Characteristics of Future Carbon Stocks in Anhui Province under Different SSP Scenarios Based on PLUS and InVEST Models. Land 2023, 12, 1668. [Google Scholar] [CrossRef]
  22. Mao, Y.F.; Zhou, Q.G.; Wang, T.; Luo, H.R.; Wu, H.J. Spatial-temporal Variation of Carbon Storage and Its Quantitative Attribution in the Three Gorges Reservoir Area Couple with PLUS- InVEST -Geodector model. Resour. Environ. Yangtze Basin 2023, 32, 1042–1057. [Google Scholar]
  23. Li, X.; Wu, K.; Feng, Z.; Wang, Z.H. Carbon balance from the perspective of supply and demand of carbon sequestration services in Henan Province. Acta Ecol. Sin. 2022, 42, 9627–9635. [Google Scholar]
  24. Wang, Y.; Liu, L.; Shangguan, Z. Dynamics of forest biomass carbon stocks from 1949 to 2008 in Henan Province, east-central China. J. For. Res. 2018, 29, 439–448. [Google Scholar] [CrossRef]
  25. Xiao, D.; Niu, H.; Guo, J.; Zhao, S.; Fan, L. Carbon Storage Change Analysis and Emission Reduction Suggestions under Land Use Transition: A Case Study of Henan Province, China. Int. J. Environ. Res. Public Health 2021, 18, 1844. [Google Scholar] [CrossRef]
  26. Xu, X.; Liu, J.; Zhang, S.; Li, R.; Yan, C.; Wu, S.; China Multi-Period Land Use Remote Sensing Monitoring Dataset (CNLUCC). Resource and Environmental Science Data Registration and Publication System. 2018. Available online: https://www.resdc.cn/DOI/doi.aspx?DOIid=54 (accessed on 28 January 2024).
  27. Available online: https://openstd.samr.gov.cn/bzgk/gb/newGbInfo?hcno=224BF9DA69F053DA22AC758AAAADEEAA (accessed on accessed on 28 January 2024).
  28. Miao, Y.Y. Optimization and Simulation of County Land Use Change and Carbon Storage Based on FLUS and InVEST Models. Master’s Thesis, Shandong Agricultural University, Taian, China, 2023. [Google Scholar]
  29. Xu, L.; He, N.P.; Yu, G.R. A dataset of carbon density in Chinese terrestrial ecosystems (2010s). China Sci. Data 2019, 4, 90–96. [Google Scholar]
  30. Li, K.R.; Wang, S.Q.; Cao, M.K. Carbon storage of vegetation and soil in China. Sci. Sin. (Terrae) 2003, 33, 72–80. [Google Scholar] [CrossRef]
  31. Xie, X.L.; Sun, B.; Zhou, H.Z.; Li, Z.P. Organic carbon density and storage in soils of China and spatial analysis. Acta Pedol. Sin. 2004, 41, 35–43. [Google Scholar]
  32. Alam, S.A.; Starr, M. Biomass and soil carbon stocks of Sudanese Acacia savanna woodland. J. Arid. Environ. 2013, 89, 67–76. [Google Scholar] [CrossRef]
  33. Fan, L.; Cai, T.; Wen, Q.; Han, J.; Wang, S.; Wang, J.; Yin, C. Scenario simulation of land use change and carbon storage response in Henan Province, China: 1990–2050. Ecol. Indic. 2023, 154, 110660. [Google Scholar] [CrossRef]
  34. Zhang, L.X.; Chen, X.L.; Xin, X.G. Short commentary on CMIP6 Scenario Model Intercomparison Project (Scenario MIP). Clim. Chang. Res. 2019, 15, 519–525. [Google Scholar]
  35. Popp, A.; Calvin, K.; Fujimori, S.; Havlik, P.; Humpenöder, F.; Stehfest, E.; Bodirsky, B.L.; Dietrich, J.P.; Doelmann, J.C.; Gusti, M.; et al. Land-use futures in the shared socio-economic pathways. Glob. Environ. Chang. 2017, 42, 331–345. [Google Scholar] [CrossRef]
  36. Sun, Y.; Yang, J.; Song, S.; Zhu, J.; Dai, J. Modeling of multilevel vector cellular automata and its simulation of land use change. Acta Geogr. Sin. 2020, 75, 2164–2179. [Google Scholar]
  37. Ke, X.; Tang, L. lmpact of cascading processes of urban expansion and cropland reclamation on the ecosystem of a carbon storage service in Hubei Province, China. Acta Ecol. Sin. 2019, 39, 672–683. [Google Scholar]
  38. Sun, F.H.; Fang, F.M.; Hong, W.L.; Luo, H.; Yu, J.; Fang, L.; Miao, Y.Q. Evolution Analysis and Prediction of Carbon Storage in Anhui Province Based on PLUS and InVEST Mode. J. Soil Water Conserv. 2023, 37, 151–158. [Google Scholar] [CrossRef]
  39. Wang, Z.Y.; Wu, F.; Wan, D.; Zhang, K.; Li, L.; Huang, C.H. Multi-scenario simulation of the impact of regional land use change on carbon reserve. China Environ. Sci. 2023, 43, 6063–6078. [Google Scholar] [CrossRef]
  40. Wang, C.Y.; Guo, X.H.; Guo, L.; Bai, L.F.; Xia, L.L.; Wang, C.B.; Li, T.Z. Land use change and its impact on carbon storage in northwest China based on FLUS-Invest: A case study of Hu-Bao-Er-Yu urban agglomeration. Ecol. Environ. Sci. 2022, 31, 1667–1679. [Google Scholar]
  41. Liang, Y.; Hashimoto, S.; Liu, L. Integrated assessment of land-use/land-cover dynamics on carbon storage services in the Loess Plateau of China from 1995 to 2050. Ecol. Indic. 2021, 120, 106939. [Google Scholar] [CrossRef]
  42. Terra, M.C.; Nunes, M.H.; Souza, C.R.; Ferreira, G.W.; do Prado-Junior, J.A.; Rezende, V.L.; Maciel, R.; Mantovani, V.; Rodrigues, A.; Morais, V.A.; et al. The inverted forest: Aboveground and notably large belowground carbon stocks and their drivers in Brazilian savannas. Sci. Total Environ. 2023, 867, 161320. [Google Scholar] [CrossRef] [PubMed]
  43. Sun, B.; Du, J.; Chong, F.; Li, L.; Zhu, X.; Zhai, G.; Song, Z.; Mao, J. Spatio-Temporal Variation and Prediction of Carbon Storage in Terrestrial Ecosystems in the Yellow River Basin. Remote Sens. 2023, 15, 3866. [Google Scholar] [CrossRef]
  44. Lin, T.; Yang, M.Z.; Wu, D.F.; Liu, F.; Yang, J.H.; Wang, Y.J. Spatial correlation and preciction of land use carbon storage based on the InVEST-PLUS mode—A case study in Guangdong Province. China Environ. Sci. 2022, 42, 4827–4839. [Google Scholar] [CrossRef]
Figure 1. Schematic diagram of the research area.
Land 13 00185 g001
Figure 2. Factors affecting land use in Henan Province.
Land 13 00185 g002
Figure 3. Correlation degree diagram of driving forces of influencing factors.
Land 13 00185 g003
Figure 4. Comparison between real 2020 land use data and simulated 2020 data.
Land 13 00185 g004
Figure 5. Land use and cover change map from 2000 to 2020.
Land 13 00185 g005
Figure 6. Chord chart of land use change from 2000 to 2010 and from 2010 to 2020.
Land 13 00185 g006
Figure 7. Simulated land use under three different scenarios in Henan Province from 2030 to 2050.
Land 13 00185 g007
Figure 8. Carbon storage and distribution of cold and hot spots in four carbon reservoirs from 2000 to 2020.
Land 13 00185 g008aLand 13 00185 g008b
Figure 9. Predictions of the carbon storage situation in Henan Province from 2030 to 2050.
Land 13 00185 g009
Figure 10. Changes in land use (above) and carbon storage (below) between 2000 and 2010 and from 2010 to 2020.
Land 13 00185 g010
Table 1. Carbon density data of the research area (Mg/hm2).
Land TypeSoilDeadBelowAbove
Farmland115.91.46206.0314.55
Woodland253.2910.82295.9108.25
Grassland106.819.01220.8490.12
Water00.7707.66
Construction land23.090.3303.32
Unused land00.6406.38
Table 2. Land use transfer matrix of Henan Province from 2000 to 2010 (km2).
20002010
GrasslandFarmlandConstructionWoodlandWaterUnusedTotal
Grassland8540.15613.62209.26127.4762.294.009556.79
Farmland312.98101,066.615394.61958.10751.931.02108,485.25
Construction16.293733.6913,355.2420.1952.510.0017,177.92
Woodland85.24680.71196.2125,975.406.452.0027,016.00
Water13.26427.9162.4932.463027.642.003565.76
Unused1.0032.032.0013.9919.0015.9884.00
Total8968.92106,554.5719,219.8127,127.613989.8125.00165,885.72
Table 3. Land use transfer matrix of Henan Province from 2010 to 2020 (km2).
20102020
GrasslandFarmlandConstructionWoodlandWaterUnusedTotal
Grassland8471.97170.6855.45227.2141.790.048967.14
Farmland217.44101,578.853637.33711.64389.152.08106,536.49
Construction13.20970.6518,192.4517.0025.960.0019,219.25
Woodland346.36605.3057.6126,040.1552.146.0327,107.59
Water10.13200.3833.9735.243701.330.003981.06
Unused0.037.070.023.011.0313.8324.99
Total9059.14103,532.9221,976.8327,034.254211.4021.98165,836.53
Table 4. Simulated land use under three different scenarios in Henan Province from 2030 to 2050 (km2).
Land TypeSSP1-RCP2.6SSP2-RCP4.5SSP5-RCP8.5
203020402050203020402050203020402050
Farmland10,151.510,063.19995.110,43210,49210,543.810,50610,540.110,607.5
Woodland2656.52661.52704.32685.12656.42649.22598.22594.22516.6
Grassland835.9785.5779.1793.7740687811.9763.5756.9
Water428.9428.9428.9428.9428.9428.9428.9428.9428.9
Construction 2488.62622.52654.12221.72244.12252.62216.42234.82251.6
Unused 3.33.23.23.33.33.23.33.23.2
Table 5. Carbon storage and its changes simulated under three different scenarios (SSP1-RCP2.6, SSP2-RCP4.5, SSP5-RCP8.5) in Henan Province from 2030 to 2050 (Tg).
YearScenarioTotal Carbon StorageDecadal Difference
2030SSP1-RCP2.65632.76−122.92
SSP2-RCP4.55721.52−34.16
SSP5-RCP8.55696.08−59.60
2040SSP1-RCP2.65588.30−44.46
SSP2-RCP4.55700.30−21.22
SSP5-RCP8.55684.76−11.31
2050SSP1-RCP2.65592.033.74
SSP2-RCP4.55690.60−9.70
SSP5-RCP8.55653.32−31.45
Disclaimer/Publisher’s Note: The statements, opinions and data contained in all publications are solely those of the individual author(s) and contributor(s) and not of MDPI and/or the editor(s). MDPI and/or the editor(s) disclaim responsibility for any injury to people or property resulting from any ideas, methods, instructions or products referred to in the content.

