
Measuring Deprivation and Micro-Segregation in Greek Integrated Sustainable Urban Development Strategies: Time to Apply a Common Method?

1
The Bartlett School of Planning, UCL, London WC1H 0NN, UK
2
National Centre for Social Research, 105 52 Athens, Greece
*
Author to whom correspondence should be addressed.
Land 2024, 13(4), 552; https://doi.org/10.3390/land13040552
Submission received: 31 January 2024
/
Revised: 18 March 2024
/
Accepted: 13 April 2024
/
Published: 20 April 2024
(This article belongs to the Special Issue Urban Micro-Segregation)
Abstract
:During the Programming Period 2014–2020, dozens of Greek cities drafted Integrated Territorial Investment programmes, based on Integrated Sustainable Urban Development Strategies (ITI SUDs). The Strategies justified the selection of intervention and activity areas using socio-economic analysis. The parameters of that analysis, as specified by the National Coordination Authority, reflected the socio-economic and functional parameters highlighted in the relevant EU regulations. This paper uses a recently published methodology in order to estimate and map deprivation in Greek cities with over 100,000 inhabitants, and compares the results with the activity areas identified in the ITI SUDs of those cities. The paper also makes an estimation of the potential for micro-segregation in deprived areas, in an effort to uncover the links between deprivation, built form and social composition at the micro-scale. The analysis shows that deprivation is comparatively more pronounced in Athens and Thessaloniki, and that the use of a common methodology to measuring deprivation, but with customized measurement scales, could support a more targeted allocation of urban policy resources. On the other hand, micro-segregation seems to be a factor worth exploring only in Athens and Thessaloniki, and not in Patra, Larissa, Volos and Heraklion, where the building stock in areas of deprivation is mostly low-rise.
1. Introduction
This paper will discuss a hitherto unexplored aspect of place-based urban policy in Greece, namely the way that the intervention areas (areas covered by the Strategy) and the activity areas (areas targeted by projects) of the ITI SUD (i.e., areas where resources would be targeted) were identified in the six largest Greek cities (Athens, Thessaloniki, Heraklion, Larissa, Patra, Volos). The Sustainable Urban Development Strategies of those cities were implemented via the Integrated Territorial Investment (ITI) mechanism (Article 7, Regulation (EU) 1301/2013 [1]; Article 12, Regulation EU 1304/2013 [2]; and Article 36, Regulation (EU) 1303/2013) [3]. These regulations followed a long debate on the reform of EU Cohesion Policy and the pursuit of territorial cohesion, an EU policy goal since 2007 and the Lisbon Treaty. The Barca report [4] made a strong argument in favour of place-based approaches, best captured in the European Commission’s early assessment of integrated territorial and urban strategies [5] (p. 3):
“…integrated place-based approaches are concerned with the efficiency of policy, i.e., how policy interventions can achieve full capacity or endogenous growth potential of territories. The basic principle of a place-based approach is that exogenous interventions through conditional grants of integrated bundles of public services and goods can be achieved in many different ways (no one-size-fits-all). Selecting the appropriate way to instigate reforms is contingent on the local context, and hence local knowledge is necessary to determine the most appropriate solutions for a particular place”. Regulations (EU) 1301/2013 and 1303/2013 follow that spirit and offer tremendous flexibility to member-states and urban authorities when it comes to the implementation of Sustainable Urban Development. Having said that, the European Commission [5] also notes that poor data availability makes monitoring and evaluation of SUD strategies particularly challenging. We would add that the challenge extends to the drafting of the strategies too.
The Sustainable Urban Development Strategies, drafted during the Programming Period 2014–2020, mark a turning point in Greek urban policy. At the time, the place-based integrated approach was well-established historically in some EU countries and had been piloted at EU level during the mid-1990s and early 2000s with the URBAN and URBAN II initiatives, which funded projects in several Greek cities. Although Integrated Urban Intervention Plans (IUIP, in Greek: ΣOAΠ) were introduced in Greece by law in 1999, 8 years before the Leipzig Charter of 2007 and 10 years prior to the Barca report [4], there are no provisions for funding and implementation [6] and they have cumbersome approval procedures, which require several ministerial assents. The IUIP specifications (Ministerial Decision 18150, 24 April 2012, Government Gazette 1341B) list the various socio-economic parameters that need to be taken into account during the delineation of the intervention area but they do not stipulate the use of multiple deprivation as an analytical concept and leave the method of analysis up to the team which would draft the IUIP. Therefore, when the ITI mechanism was introduced, it was the first time in Greek urban policy that a strategic integrated approach to urban interventions, and the associated investment programme, had a streamlined approval process and was coupled with a clearly defined and ringfenced funding source (5% of ERDF funds, but often more), in the context of an implementation mechanism (the ITI). However, the methodology to be followed in order to identify intervention areas remained at the discretion of member-states and urban authorities. This was a reasonable approach, given that at the time many member states had an urban policy and had already developed a wealth of methodologies and indicators for the identification of deprivation areas, and to guide policy on cities, health, social welfare, etc. For example, according to Zelenina et al. [7]:
“In the UK…, all indices are developed at the regional level. Similarly, in Spain and Italy most of the indices are developed at the regional level. Denmark, France, the Czech Republic, Hungary, Slovenia…and Sweden developed only national deprivation indices”.
However, in the case of Greece, at the time and to this day there is no official methodology and indicator set to be used for the identification of urban policy intervention areas, largely because there is no explicit national urban policy other than what is ‘downloaded’ from the EU level. The methodological gap was plugged by the Greek administration dealing with the management of EU funds, in the process of implementing the relevant EU regulations.
According to the implementation circular issued by the National Coordination Authority (NCA) of the Ministry of the Economy [8], which is in charge of the design and implementation of territorial development mechanisms funded by EU funds, the ITI SUD for the Programming Period 2014–2020 should have covered urban areas with ‘special characteristics and challenges’. These would include “urban areas…facing intense economic, social, environmental, climate change, demographic, and functional organization challenges”, mirroring the challenges mentioned in Article 7, Regulation (EU) 1301/2013. In the same document [8], the ITI SUD intervention areas were further specified as (a) ‘deindustrialised areas’ facing poverty, social exclusion and unemployment, (b) areas where land uses are changing and there is informal development or (c) urban centres with functional areas over 70,000 inhabitants, where the focus would be on ‘degraded’ living and working conditions. In the case of the Region of Attica, the Managing Authority for the Regional Operational Programme invited Urban Authorities to submit strategies targeting areas with ‘special development dynamic’ or ‘highly degraded’ areas.
In practice, all the ITI SUDs we looked into for this paper took all three aspects (degradation/social issues, development dynamics, urban functions) into account in the justification of the selection of intervention areas and activity areas. Broadly speaking, the parameters used in order to identify ‘degradation enclaves’ in the nine ITI SUDs focused on density, income, demography and environmental problems but there was some leeway when it came to the requirements for spatial disaggregation of the data and to the methods that the Urban Authorities could use for that identification process. This allowed Urban Authorities to exercise discretion insofar as their preferred methods of socio-spatial analysis are concerned, which in turn resulted in diverse approaches towards the definition of ‘degraded’ areas, and their identification (see Section 2).
The paper will measure multiple deprivation and micro-segregation in the six largest Greek cities, using the methodologies published by Karadimitriou et al. [9] and Maloutas et al. [10], and will compare the findings with the results of the spatial analysis caried out in support of said strategies. The aim of that comparison is twofold. First, to discover to what extent the choice of method and the parameters of analysis affected the targeting of the ITIs, and therefore the effectiveness of place-based public investment. Second, to explore whether deprivation and micro-segregation are policy-relevant, and therefore whether they should also be included in the analysis of the socio-spatial characteristics of areas targeted by ITI SUDs.
Multiple deprivation, understood as the relative lack of resources across several domains, is a relatively understudied aspect of the social morphology of Greek cities. In fact, the only studies dealing with aspects of that topic are about Athens, and are few and far between. The work of Kandylis et al. [11] looked into the spatial typology of immigrant locations and the spatial hierarchy of Athens, while Panori et al. [12] investigated the spatial segregation of immigrants. Arapoglou and Maloutas [13] looked into the clustering of deprived immigrant populations in Athens. Chatzikonstantinou and Vatavali [14] have looked into the spatiality of energy deprivation in Athens, and Dimitrakou explored urban vacancy and access to housing [15]. However, the first study which analysed multiple deprivation in Athens came very recently, in 2021, by Karadimitriou et al. [9]. They demonstrated that the spatial patterns of multiple deprivation in Athens reveal nuanced centre–periphery divisions linked to the city’s urban development trajectory and the way housing is accessed by households.
Compared to the study of multiple deprivation, social segregation and micro-segregation in Greece is covered in greater depth in the bibliography, although the relevant research only deals with Athens in this case too. Greek scholars, starting with Leontidou’s seminal book on the Mediterranean city [16], have developed the concept of vertical segregation in order to explain the way that social stratification is spatially expressed in the densely built urban fabric of Athens. Since the 2000s [17], Maloutas has explored this spatial expression of social stratification at micro-level in greater depth. Lately, research in various parts of the world showed that micro-segregation and verticality are not a unique characteristic of Athens but could be effectively used as analytical concepts to describe the spatiality of social segregation in densely built-up urban areas across the globe (for recent examples see: [18,19,20]).
It has been argued (see Maloutas and Karadimitriou [21]) that micro-segregation (i.e., vertical segregation in the case of Athens), could help to explain the relatively less polarized social geography of Athens [9], at the macro scale. More broadly speaking, there is an argument taking shape in urban sociology that micro-segregation might be a phenomenon which attenuates the segregated socio-spatial expressions of highly polarized societies [21]. To the extent that micro-segregation plays such a role, a better understanding of the interaction between the dynamics of multiple deprivation and the dynamics of micro-segregation could help target resources more effectively in urban space, in cases where micro-segregation is ‘masking’ the spatial expression of deprivation.
For example, two areas with comparable average scores of multiple deprivation may either reflect a socially homogenous population or a rather polarized area where more deprived strata and more well-off strata live in very close proximity to one another. The polarized area is bound to have populations experiencing more extreme levels of deprivation. Therefore, place-based interventions targeting multiple deprivation would have to be qualitatively and quantitatively different between the two areas.
This paper seeks to show how micro-scale analysis could enable a better focus on deprivation issues with the aim to achieve a more targeted distribution of funding. Deprivation is an important component of the analysis backing SUD strategies, and therefore a more refined understanding of its spatial distribution according to micro-scale factors is bound to affect the effectiveness of public spending on policies to tackle it.
Following the introduction (Section 1) and the methodology (Section 2), the paper will estimate and map the patterns of multiple deprivation and social segregation at the micro-scale in all six cities. The paper will compare the deprivation and micro-segregation patterns between the six cities with the map of activity areas selected in the Strategies in order to identify differences between the two. Section 4 discusses the findings and offers key policy recommendations.
2. Materials and Methods
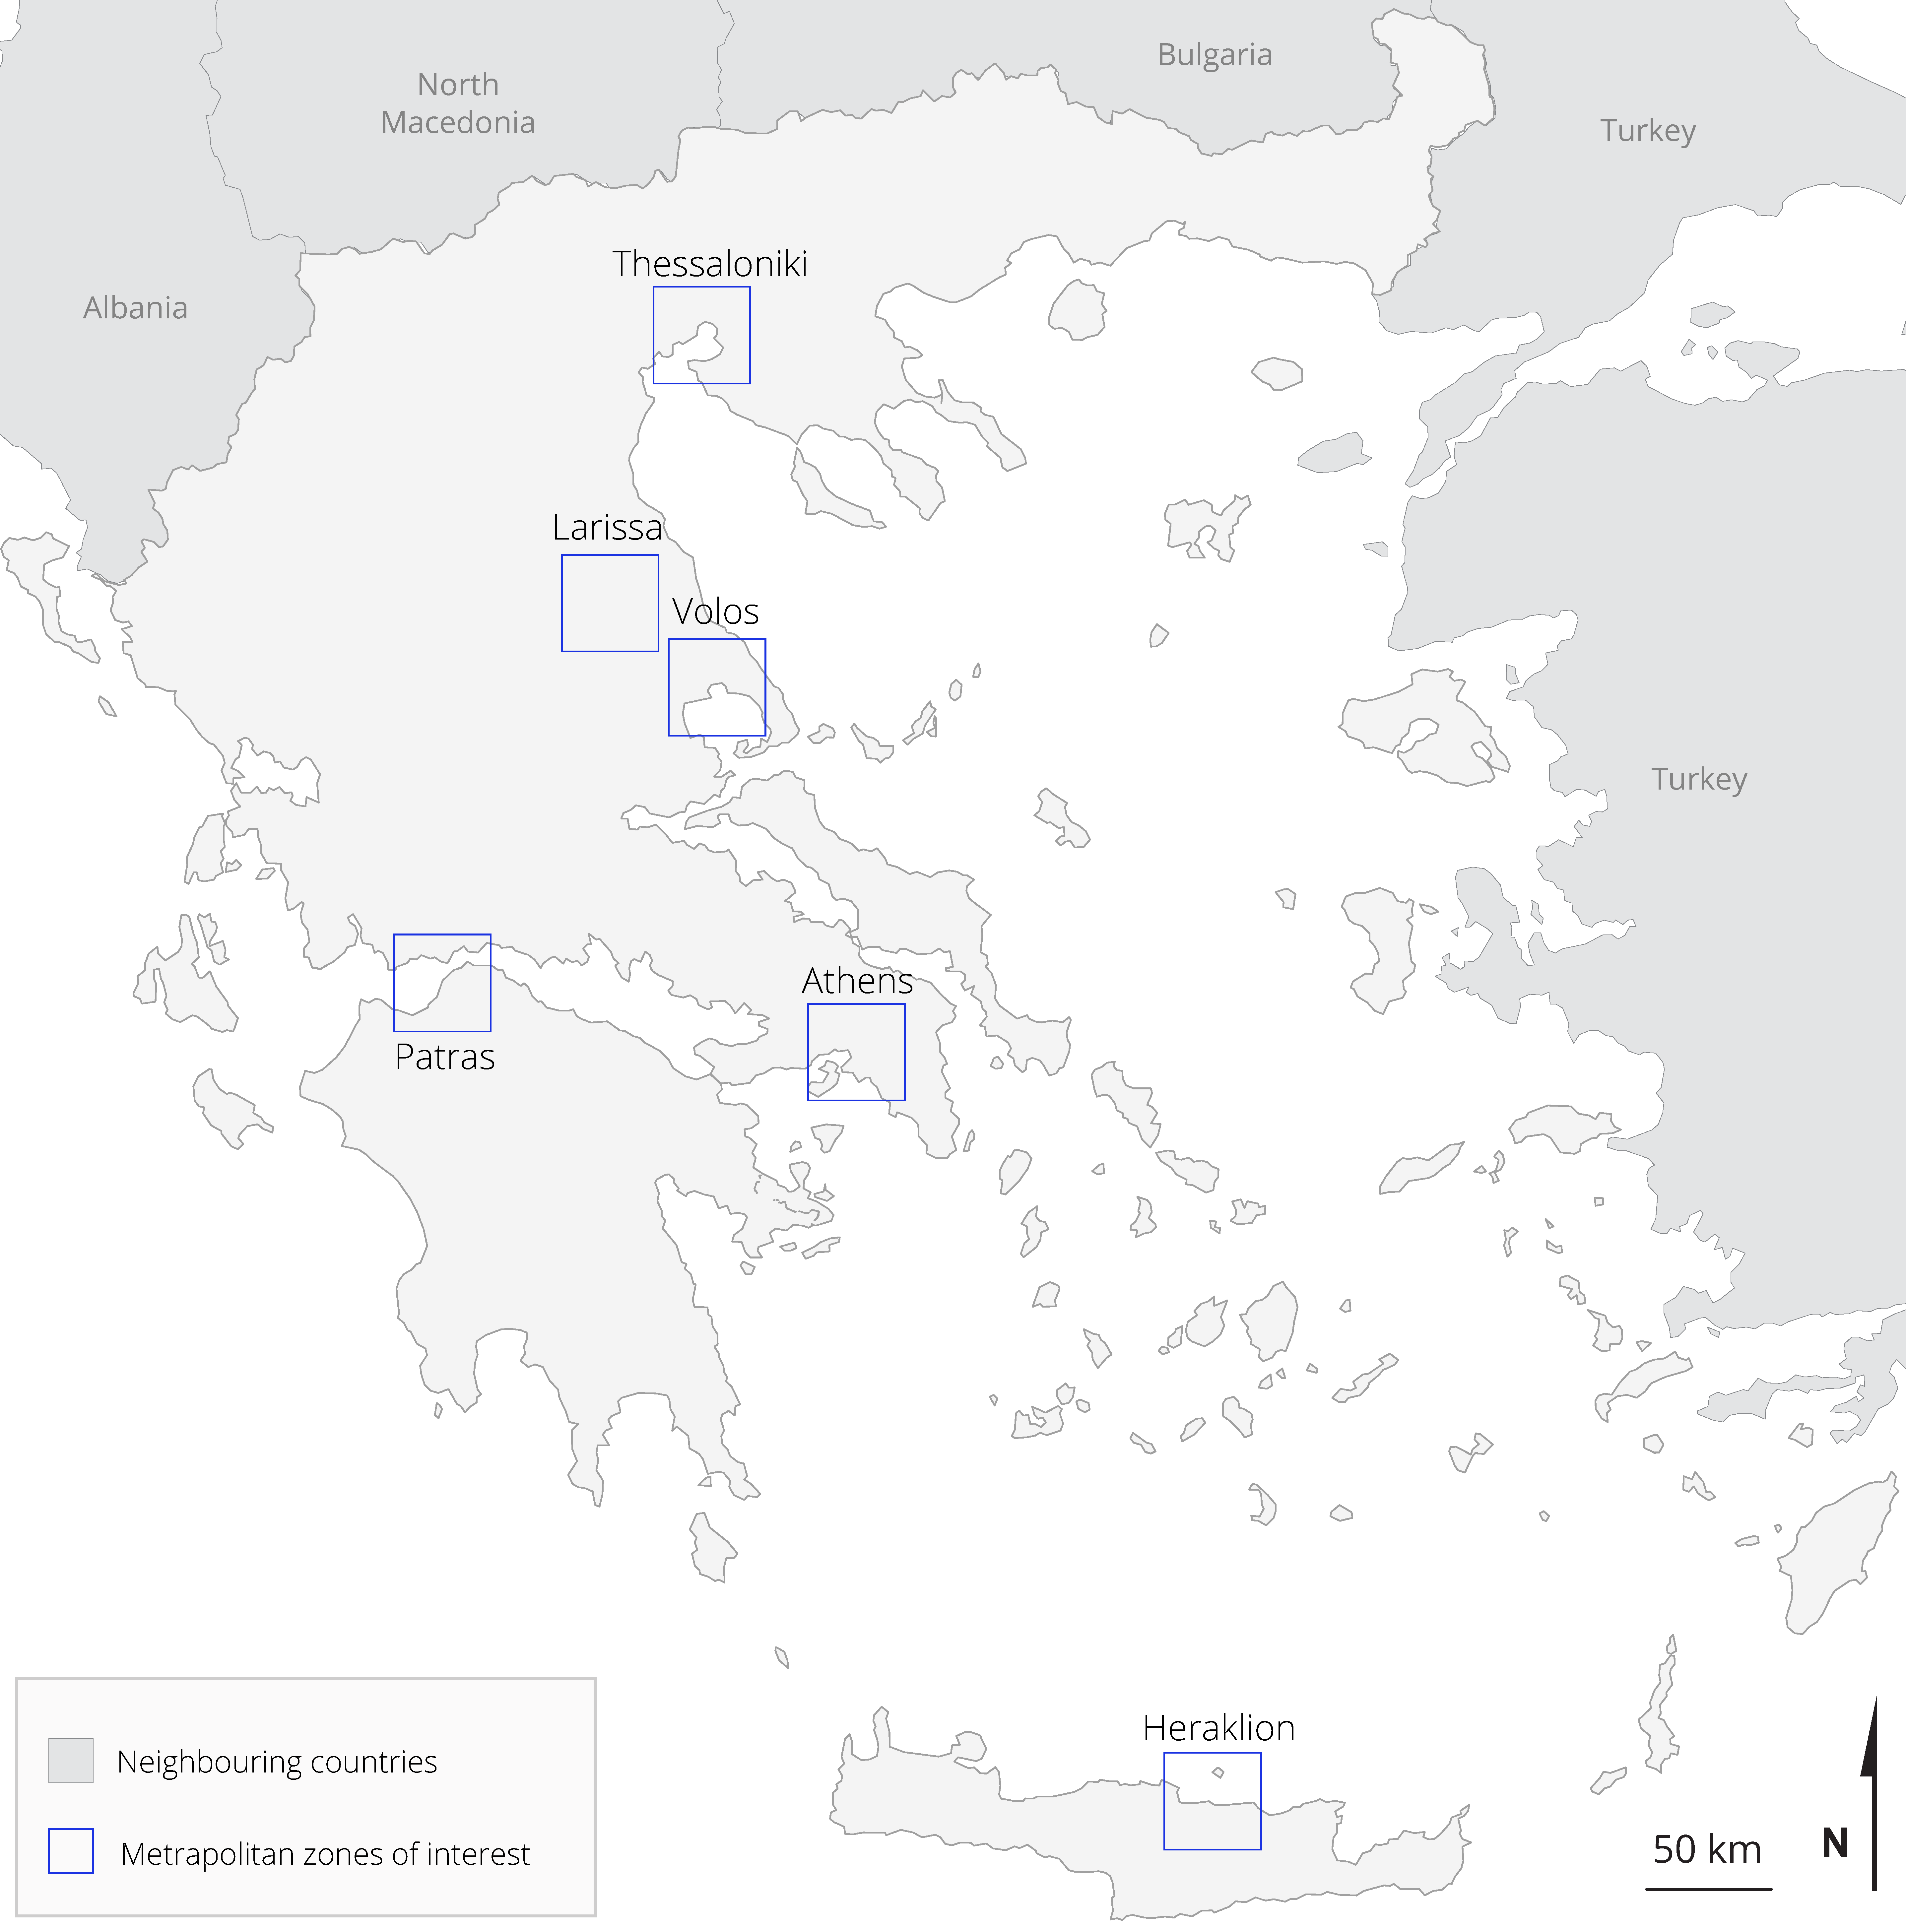
The paper looks into all the approved ITI SUDs drafted for cities with a population over 100,000 inhabitants, for the Programming Period 2014–2020. This includes the ITI SUDs for the Municipality of Athens, Piraeus, Athens Western Sector, Athens Southern Sector, Thessaloniki, Larissa, Volos, Heraklion and Patra. The Greek urban network is dominated by metropolitan Athens (a.k.a. Athens, the capital), and Thessaloniki. These two cities had 44% of the country’s population, or more than 4,760,000 inhabitants, in 2011. Larissa, Volos, Heraklion and Patra did not exceed 200,000 inhabitants (Table 1). Athens, Thessaloniki, Heraklion, Patra and Volos are cities with access to the sea and have significant port facilities, unlike Larissa (Figure 1). Altogether, half (50.1%) of the country’s population in 2011 lived in these six cities. Concerning the socio-economic profile of the six cities, the three variables presented in Table 1 concern the three main axes of employment, education and housing. All six cities are above the national level, especially Athens, with more or less pronounced differences. In detail, Athens and Thessaloniki show a strong over-representation of unemployed and highly educated individuals (20–64 years old). Volos, Larissa and Heraklion seem to be closer to the average national profile with Larissa scoring higher in the highly educated population and Heraklion showing an over-representation of tenants. The latter is also present in Athens. Patra seems to be in between those two groups, scoring relatively high in all three variables.
In metropolitan Athens there were four ITI SUDs approved: the Municipality of Athens’, the Municipality of Piraeus’, the Southern Sector’s, and the Western Sector’s. Athens, Piraeus and the Western Sector also had an IUIP, on which a great deal of the ITI SUD analysis was based. The call issued by the Managing Authority for the ROP of Attiki (the Region in which Athens is located) invited Urban Authorities to submit ITI SUDs focused on either “degraded areas” or “areas of special development dynamic”. The ITI SUDs for the Municipality of Athens, Piraeus and for the Southern Sector were focused on areas with “special development dynamic”, whereas the Strategy for the Western Sector was focused on “degraded areas”.
In the Western Sector ITI SUD, which explicitly focused on “degraded areas”, a multi-criteria approach was used in order to identify activity areas (called “focus enclaves” in the strategy). The criteria were social cohesion, poverty, weak economic basis, deindustrialization, land use pressures, bad quality of buildings, poor quality urban fabric, environmental problems, proximity to large or special uses and strategic position and potential. The intervention area of the ITI is identical to the IUIP’s, and the activity areas are mostly the same, with some minor differences in some cases. In Athens, the intervention area of the ITI SUD is identical to the IUIP “area of responsibility” but has two additional linear extensions towards the Municipality of Tavros and the Municipality of Nea Smyrni (the rationale for these extensions is functional). In Piraeus, the ITI SUD analysis and area delineation is also based on the IUIP. The intervention area is the administrative area of the Municipality of Piraeus, which is split into two ‘Major Intervention Zones’, further broken down into ‘Special Enclaves’. We were not able to find the map depicting the ITI SUD special enclaves but the IUIP outlines seven ‘Special Restoration Zones’ with 36 enclaves which require special actions. In the Southern Sector, the intervention area was identified by reference to functional criteria, and it covers the areas neighbouring major urban regeneration projects in Faliron and Ellinikon.
The ITI SUD of Thessaloniki also used multi-criteria decision-making in order to identify the activity areas (so-called “focus enclaves”). This analysis took into account population density, green space deficit, declared income, percentage of special social groups and marginalized communities as well as traffic and noise pollution, age of housing stock, population ageing and unemployment. In Patra, Heraklion, Volos and Larissa, the activity area was the same as the intervention area, and an analysis of demographic, socio-economic, urban fabric, environmental and climate change parameters was used to justify the area selection. Notably, Heraklion has an IUIP and, indeed, the ITI SUD intervention area is a segment of the IUIP’s intervention area.
It is worth pointing out that in the case of the Municipality of Athens, much of the area covered by the SUD Strategy (the intervention area) appears to be highly deprived in our analysis, whereas in Piraeus, the Southern Sector and in the Western Sector too, the deprived areas covered by the Strategies are much smaller (see Figure 2). To delineate the ITI activity areas, we used the boundary lines depicted in the Sustainable Urban Development Strategies that were submitted for approval to Managing Authorities. We laid those boundaries over the ELSTAT (Hellenic Statistical Authority) Urban Analysis Units (henceforth URANUs) basemap used for census purposes in 2011. This means that in some cases the ITI SUD boundaries cross over URANUs of the 2011 census. The base map was provided by the Panorama of Greek Census Data 1991–2011 [22] and covers the metropolitan areas of the cities in question using spatial units (URANUs) of an average population of 1250. The URANUs are a modified version, due to protection of personal data, of the 2011 Census Tracts. Their surface indicates the density of the population. Size differentiations are therefore observed between the cities, but also within cities. Smaller units are to be found in denser and high-rise areas while bigger units are to be found in peri-urban and scarcely built parts of the city. With that in mind, it needs to be pointed out that whenever the URANUs are used for mapping social phenomena in Greek cities, the results in some cases might be influenced by the Modifiable Area Unit Problem.
This paper uses data from the 2011 national Census to estimate deprivation and the likelihood of vertical segregation. Although the 2021 census was carried out successfully, detailed data have not been made available at URANU level yet. Following the methodology published by Karadimitriou et al. [9], the General Deprivation Index takes into account three domains (employment, education and housing) and 20 composite variables, providing a multidimensional estimation of multiple deprivation (see Table 2). The three domains were given equal importance.
The calculation of the lack of housing space and vulnerability variables is linked to a ‘20 square meters per capita’ threshold. As ‘population living under housing poverty’, we consider the part of the population to which corresponds a per capita surface smaller than 60% of the mean of the sq m per capita of the total population in each city. For Volos this threshold was 20.2 sq m per capita, for Athens and Larissa it was 20.0 sq m per capita, for Patra it was 19.7 and for Thessaloniki and Heraklion it was 19.3. As we consider these differentiations negligible, and in order to take into consideration the classification used by ELSTAT, we decided to use a common threshold of 20.0 square meters. The occupational categories are coded according to the ISCO-08 [23] (International Labour Office (ILO), 2012) model (International Standard Classification of Occupations) used by ELSTAT in more detail as routine occupations we refer to unskilled and manual workers. Karadimitriou et al. [9] use the population living in the basement or ground floor apartments as a composite variable of the housing domain. For the analysis of our paper, the ground floor population was not taken into account.
First, we organized a detailed dataset including the 4447 URANUs of the six Cities and the 20 variables organized in 10 groups. Subsequently, a step-by-step identification procedure of the most deprived areas was carried out. The variables were standardized, according to the distance from the mean, in standard deviation multiples, singling out the areas where values indicating higher deprivation are maximized. Eventually, a deprivation index was calculated for each domain and finally a General Deprivation Index (GDI). In more detail, for an initial value χ:
- a value of 1 was assigned for χ < mean;
- a value of 2 was assigned for mean < χ < mean + 0.5 stdev;
- a value of 3 was assigned for mean + 0.5 < χ < mean + 1 stdev;
- a value of 5 was assigned for mean + 1 stdev < χ < mean + 2 stdev; and
- a value of 7 was assigned for mean + 2 stdev < χ.
Subsequently, a deprivation index was calculated for each domain (e.g., Deprivation Employment Index = (Group 1 + Group 2 + Group 3 + Group 4)/4), and finally a General Deprivation Index (GDI) = Deprivation Employment Index + Deprivation Education Index + Deprivation Housing Index with a minimum value of 3 and a maximum of 21. This procedure was followed for all cities jointly (using as measurement a common scale for each variable for the whole dataset, the general standard deviation and the general mean), and for each city separately (using as measurement a scale specific to each city, the local standard deviation and the local mean). This approach can offer an enhanced analytical view of the spatial profile of deprivation in each city as well as a sense of the difference in deprivation between cities.
Insofar as the micro-segregation in deprived areas is concerned, we initially explored vertical segregation in high-rise areas and then the horizontal segregation trends in low-rise areas. With regard to vertical segregation, we followed the methodology published by Maloutas et al. [10]. We analysed where this phenomenon could potentially manifest itself by identifying high-rise URANUs where the population residing in apartment buildings exceeds 66% of the total population (the average in the six cities) and where the population residing in lower floors (ground floor and semi-basement) and upper floors (4th floor or higher) account for more than 30% of the total population. Then, we counted the number of URANUs with potential for vertical segregation where the population was also experiencing high levels of deprivation. High-rise areas with vertical segregation potential are a sub-set of the high-rise areas in Greek cities. For example, there is limited vertical segregation potential in areas where the population residing in lower floors and upper floors do not account for more than 30% of the total population. This situation is rather common in apartment blocks built after the mid-1980s, located mostly in the suburbs, where the blocks have pilotis instead of ground floor and semi-basement apartments.
The method used in this paper to locate low-rise areas, is novel. We analyse the URANUs where more than 40% of the population per URANU reside in detached or irregular dwellings, 40% being the average of the six cities. Furthermore, apartment buildings in those areas are often of smaller scale, often two floors with one apartment per floor, typical outputs of the south European family housing strategy [24]. Therefore, we identified as low-rise URANUs where population residing in apartment buildings exceeds 66% of the total but where more than 90% of the population resides in apartment buildings of up to two floors.
In order to compare the deviation of each city from the average profile, we used either simple percentages or we calculated a location quotient (LQ). The LQ is estimated by comparing the presence of a variable or an index—expressing the socioeconomic segregation, vertical or horizontal, or the level of deprivation—in a given spatial unit to its presence in the wider area of interest. A LQ score below 1 indicates that the selected variable is under-represented and a LQ score above 1 indicates that the selected variable is over-represented, compared to its presence in the rest of the residential space. A LQ of 1 indicates that the presence of the selected variable is proportional to its contribution in the rest of the residential space.
3. Results
The analysis is divided into two parts:
- The estimation and mapping of the General Deprivation Index with a common measurement scale for all cities, as well as with a scale specific to each city, based on [8,9], and the comparison of these patterns with the ITI activity areas identified in nine ITI SUDs (four in the Athens metropolitan area and five in the other Greek cities);
- The estimation of the URANUs with high vertical segregation potential, and a comparative analysis with URANUs where the population experiences high levels of multiple deprivation.
3.1. Measurements of the GDI in Greek Cities
3.1.1. Athens
As already analysed in the literature [9], the metropolitan area of Athens has a cluster of highly deprived areas in Athens’ city centre and along the old industrial core, as well as several deprived areas in the outer periphery of the city. It is worth noting here that, although there is a marked difference between East and West, this is not as pronounced as one would have expected. This means that the traditional working-class areas of Western Athens are not the most deprived in the city, and in fact the conditions there seem to be gradually improving between 1991, 2001 and 2011 [9]. Insofar as the ITI activity areas are concerned, Municipality of Athens’ activity area is predominantly a cluster of deprived urban quarters. In Piraeus, there are some deprived areas mainly in the north of the municipality, bordering Eleonas, the old industrial core of metropolitan Athens. The entire municipal area of Piraeus is covered by the ITI SUD and, although we were not able to locate the ITI SUD ‘enclaves’, the IUIP’s ‘Special Restoration Zones’ appear to be more focused on poor urban fabric conditions. In the Southern Sector the deprived areas are rather small and at the fringe of the activity area—also bordering Eleonas. In the Western Sector’s Strategy, the most deprived areas (as measured in this paper) are mostly outside the ITI activity areas.
3.1.2. Thessaloniki
Thessaloniki is the only city in Greece where deprivation, when measured on a scale common between cities, is somewhat comparable to Athens. There is a clear divide between the eastern and western parts of the city (Figure 3). The western part has clusters of deprived areas, whereas the eastern part has a couple of deprived outliers. The periphery of the city, and especially the rural communities to the east, appears to be comparatively more deprived when measured on the city-specific scale. The ITI activity areas are quite broad but they mostly overlap with the deprived areas identified in this paper (and not only with those, as they cover much of the dense urban area of the city).
3.1.3. Patra
Deprivation in Patra (Figure 4), when measured on the common scale, is not particularly pronounced, although the city appears to have a north–south divide and there are a handful of high deprivation enclaves to the south of the city. When measured at the city-specific scale, the differences between north and south really come to the fore. The three ITI activity areas located in the south of the city cover deprived areas but not the most deprived enclaves.
3.1.4. Heraklion
Heraklion (Figure 5) also appears to have a handful of high deprivation areas, mainly around the old town and at the edges of the city. As in the other cities, the differences become more pronounced when the city-specific scale is used. The ITI activity area overlaps with some deprived and highly deprived areas, as measured on the city measurement scale.
3.1.5. Larissa
Larissa (Figure 6), when measured on the common scale, appears to be a city without high concentrations of deprivation, except one area in the north which is an ITI activity area. However, when measured on the city-specific scale, deprivation also seems to be concentrated in two more areas in the north, which were not targeted.
3.1.6. Volos
In Volos (Figure 7), the ITI activity area leaves out most of the deprived URANUs in the western edge of the city, when measured at the common scale. The measurement at the city-specific scale reveals that a larger proportion of highly and very highly deprived areas has been included in the ITI SUD activity areas.
3.2. Deprivation and Micro-Segregation
In Table 3, the location quotient (LQ) is used in order to give a conclusive insight to the distribution of residents in each city, compared to the overall profile of the dataset. According to the GDI typology, 1/4 of the population reside in areas close to the average profile and more than half (56.9%) in areas of low or very low deprivation. A significant 17.8% live in areas of high or very high deprivation. Strong differentiations are observed between big and smaller cities. Athens greatly influences the average profile since the LQ analysis reveals limited differences in that city. In Thessaloniki, deprivation seems to be less acute, scoring lower on the ‘very high’ category but higher on the high. Patra and Heraklion are more deprived than the average profile, with Patra scoring very low (0.36) in the less deprived areas and Heraklion scoring very high (1.59) in the highly deprived areas. Larissa and Volos have a low score in the extremes, showing a profile closer to the average.
Following the analysis of deprivation, we investigated the effects that segregation, vertical or horizontal, might have in the social dynamics at the micro scale. This analysis, first, focuses on the main constituent of the high-rise areas in Greek cities, the apartment buildings (polikatoikies). These apartment buildings were built privately to tackle acute housing need, in the absence of social housing provision. The intensive provision of this type of housing in the 1950s–1980s led to the rapid expansion of urban areas in Greek cities. Today, 67.3% of the population in Thessaloniki reside in apartment buildings, 65.7% in Athens and between 40% and 46% for the remaining cities. The housing stock created via this process accommodated the inflow of migrants from Eastern Europe, from the early 1990s to the mid-2000s, but also subsequent migration flows. Increased homeownership, combined with lack of social housing, preserved spatial proximity independently of social and ethnic status.
The analysis of URANUs with vertical segregation potential (see Table 4) reveals that Athens and Larissa have the highest proportion of URANUs (more than 40%) where 2/3 of the population live in apartment blocks and at the same time around 1/3 of the population lives on or below the ground floor and on or above the fourth floor. This reflects the very densely built form of those two cities. However, in Larissa only one URANU with vertical segregation potential (5.6% of the highly deprived areas of the city) is also highly deprived. Thessaloniki and Patra have similar percentages of URANUs with vertical segregation potential (around 30%) but in Patra only two URANUs of this type are also highly deprived. This observation reveals an important differentiation; in Thessaloniki 15.3% of the deprived areas comprise high-rise housing stock with vertical segregation potential as opposed to 4.9% in Patra, even though the same proportion of the population resides in such high-rise areas.
Heraklion and Volos have the lowest percentages of URANUs with vertical segregation potential and, again, very low numbers of deprived URANUs in those categories. Having said that, the overall number of highly and very highly deprived URANUs is very low in all cities except Athens and Thessaloniki. In Athens, around 1/3 of the deprived areas also have vertical segregation potential.
This analysis shows that deprivation clusters in medium-size Greek cities are mostly to be found in low-rise areas at the urban fringe. To better understand this phenomenon at the micro-scale, we looked further into selected variables for the three domains of deprivation already used (see Table 5). For the employment domain, we chose the LQ of 30–64-year-old Managers and Professionals (MPs) and the LQ of Routine Occupations (ROs). For the education domain, we chose the LQ of 20–64-year-old individuals with a Higher Education (HE) degree and the LQ of people with Low Education Level (LE). Finally, for the housing domain, we chose the LQs for Lack of Heating (NH) and for the presence of Irregular Housing (IH).
The analysis for the employment and education domains did not reveal important differences between cities. More specifically, there are relatively minor differentiations at the micro-scale between cities for MP, RO, HE and—to a lesser extent—LE. The lower presence of MP and HE combined with higher presence of RO and LE hints at slightly higher deprivation in big metropolitan areas (Athens and Thessaloniki). Patra and Heraklion’s pattern hints at lower deprivation levels, while Larissa and Volos follow a common —and more balanced—pattern between them, and are located in-between the two other pairs of cities.
The housing domain, however, is what made a difference in the identification of deprived areas, although the differences between the cities are not pronounced. Overall, individuals living in dwellings without heating represent only 3.4% of the population and those residing in irregular housing are only 0.2%. The location of those dwellings, of very low quality, is highly linked to low-rise areas, since 73.9% of irregular housing and 28.8% of houses without heating are to be found there.
An important finding is that Thessaloniki scores lower than the other cities in the NH variable, maybe due to its colder climate. Athens scores very high in this variable, indicating that the housing stock without heating is over-represented in low-rise deprived areas of the capital. Larissa and Volos share a common profile, scoring high on both Housing domain variables. Patra and Heraklion have similar scores in the NH variable, even though a lower score for Heraklion would have been expected due to its warmer climate. However, Patra scored low in IH while Heraklion scored extremely high. This finding, of irregular housing concentrated in low-rise deprived areas of the urban network, should be linked to poor housing quality in the fringe of the cities, probably in Roma settlements located at the urban fringe. This is supported by evidence from Maloutas and Arapoglou and Maloutas et al. [13,25] but would require on-site visits in order to be verified.
4. Discussion and Conclusions
The analysis in this paper confirmed that the deprivation index manages to produce a refined mapping of urban socioeconomic space at the micro-level, especially when it is calculated at the city-specific measurement scale. Furthermore, by putting the deprived low-rise neighbourhoods under the spotlight, we were able to point at the potential influence of the conditions of Roma populations in very deprived areas, and therefore their relevance for place-based urban initiatives.
The comparative analysis between cities reveals that Athens is where multiple deprivation and the potential for vertical segregation are more pronounced, followed by Thessaloniki. This is connected to the scale and size of those cities, which allows a finer social stratification to emerge and to spatially express itself. Greek middle-sized cities have smaller and fewer areas of high deprivation, compared to Athens and Thessaloniki. There are patterns of spatial concentration of deprivation in all cities, which, however, become more visible if measured on a city-specific scale. However, if measured on a common scale with Athens, then all cities appear to have far fewer highly deprived areas, which are mostly concentrated at the urban fringe, or further out. In many cases, these are places where probably the Roma have settled. In light of these findings, research on the urban geography of Greek cities could expand its scope to look beyond the divisions between working-class areas and white-collar areas, which appear to be less pronounced in medium-sized Greek cities: the centre–periphery divisions also seem to be quite significant and, in addition, they are likely to reflect the clustering of severely deprived groups.
The ITI SUDs target large clusters of deprivation areas in some cases, like in the Municipality of Athens and in Thessaloniki. In other cases, they appear to be targeting areas without significant deprivation issues. This can be explained to an extent because the guidance provided by the NCA, reflecting relevant EU regulations, steered Urban Authorities to focus their ITI SUDs on a range of policy issues. Therefore, several strategies aspired to take advantage of the development dynamics of their intervention areas (for example three out of the four ITI SUDs in Metropolitan Athens) and all of them focused on built environment issues, as well as on economic development and innovation.
According to the NCA guidance [8], ITI SUDs could target areas “with distinct demographic characteristics”, where the Roma have settled. However, many of the ITI SUDs we analysed did not explicitly seek to remedy the acute needs of highly segregated areas (which are anyway rare in medium-sized Greek cities). Instead, in many cases, ITI SUDs address socio-economic needs of broader groups, as well as the Roma and other vulnerable groups, horizontally (i.e., actions to support such groups cover the entire intervention area, not only the activity areas).
In several ITI SUDs, the socio-economic analysis is used as a way to describe the profile of the activity areas. It is only in Thessaloniki’s and in the Municipality of Athens’ ITI SUDs where the activity areas cover clearly identified high deprivation clusters. The other ITI SUDs mostly target moderately deprived areas and some highly deprived areas, often partially. As mentioned, this could be attributed to the methods of socio-economic and spatial analysis used in the ITI SUDs (and the IUIPs, where these existed), which took into account parameters which are not necessarily relevant to the measurement of deprivation.
The focus of ITI SUDs on a reasonably wide range of policy issues, and therefore on the spatial expressions of those issues, is nothing unusual and it allows policy-makers to address key issues as seen from different angles. These issues reflect EU policy and the guidance provided to Urban Authorities rightly steered them in that direction. However, in light of the findings of this paper, we argue there would be scope to develop a nation-wide methodology for measuring multiple deprivation, so as to use it uniformly in all ITI SUD analyses in the future as one additional metric. The use of this metric would allow for a more refined mapping of key socio-economic characteristics that are of high policy concern and which tend to be spatially concentrated, in the Greek context. Taking deprivation explicitly into account when designing the ITI SUD investment programme would indeed help Urban Authorities to refine their place-based targeting of resources, so far as socio-economic issues are concerned. It would be worth bearing in mind that a common measurement scale with Athens would mask local variations in smaller cities, while the exclusive use of city-specific scales would exaggerate them. This would be a key aspect to be taken into account when considering the measurement scales and the intervention ‘cut-off’ points (i.e., the values above which an area would be deprived and highly deprived and therefore the focus of place-based interventions).
Finally, vertical segregation might be a factor worth exploring further when it comes to targeting place-based interventions. However, it is only in Athens and less so in Thessaloniki where there are significant numbers of URANUs with high vertical segregation potential which are highly and very highly deprived. In the other Greek cities, highly and very highly deprived areas are mostly low-rise, and we have substantive indications that a relevant micro-segregation parameter may be the presence of Roma people.
Author Contributions
Conceptualization: Ν.Κ. and S.S., data curation: Ν.Κ. and S.S., formal analysis: Ν.Κ. and S.S., methodology: Ν.Κ. and S.S., visualization: Ν.Κ. and S.S., writing—original draft: Ν.Κ. and S.S., writing—review and editing: Ν.Κ. and S.S., funding Acquisition: S.S., Project administration: S.S. All authors have read and agreed to the published version of the manuscript.
Funding
This research was funded by the Hellenic Foundation for Research & Innovation (HFRI) project number 11585. Project title: ‘Segregation patterns and deprivation areas in Athens 2011–2021’.
Data Availability Statement
The datasets concerning the 2011 census can be directly accessed at the Panorama of the Greek Census Data “(https://panorama.statistics.gr/en/, accessed on 28 January 2023)”.
Conflicts of Interest
The authors declare no conflicts of interest.
References
- Regulation (EU) No 1301/2013 of 17 December 2013 on the European Regional Development Fund and on Specific Provisions Concerning the Investment for Growth and Jobs Goal and Repealing Regulation (EC) No 1080/2006, 2013, OJ L347/289. Available online: https://eur-lex.europa.eu/legal-content/en/TXT/?uri=CELEX%3A32013R1301 (accessed on 30 January 2024).
- Regulation (EU) No 1304/2013 of 17 December 2013 on the European Social Fund and Repealing Council Regulation (EC) No 1081/2006, 2013, OJ L347/470. Available online: https://eur-lex.europa.eu/legal-content/en/ALL/?uri=CELEX%3A32013R1304 (accessed on 30 January 2024).
- Regulation (EU) No 1303/2013 of 17 December 2013 Laying Down Common Provisions on the European Regional Development Fund, the European Social Fund, the Cohesion Fund, the European Agricultural Fund for Rural Development and the European Maritime and Fisheries Fund and Laying down General Provisions on the European Regional Development Fund, the European Social Fund, the Cohesion Fund and the European Maritime and Fisheries Fund and Repealing Council Regulation (EC) No 1083/2006, 2013, OJ L347/320. Available online: https://eur-lex.europa.eu/legal-content/en/TXT/?uri=celex%3A32013R1303 (accessed on 30 January 2024).
- Barca, F. An Agenda for a Reformed Cohesion Policy. A Place-Based Approach to Meeting European Union Challenges and Expectations, Independent Report Prepared at the Request of Danuta Hübner. 2009. Available online: https://www.europarl.europa.eu/meetdocs/2009_2014/documents/regi/dv/barca_report_/barca_report_en.pdf (accessed on 30 January 2024).
- Directorate-General for Regional and Urban Policy (European Commission); European Policies Research Centre (EPRC); Zwet, A.; Bachtler, J.; Ferry, M.; Irene, M.; Stephen, M. Integrated Territorial and Urban Strategies—How Are ESIF Adding Value in 2014–2020?—Final Report; Publications Office of the European Union: Luxembourg, 2017. [CrossRef]
- Asprogerakas, E. Strategies of Integrated Interventions in Greece: Tools and Governance Schemes. Plan. Pract. Res. 2020, 35, 575–588. [Google Scholar] [CrossRef]
- Zelenina, A.; Shalnova, S.; Maksimov, S.; Drapkina, O. Classification of Deprivation Indices That Applied to Detect Health Inequality: A Scoping Review. Int. J. Environ. Res. Public Health 2022, 19, 10063. [Google Scholar] [CrossRef] [PubMed]
- National Coordination Authority for ESPA. Guidance on the Design, Implementation and Monitoring of Integrated Territorial Investments as Instruments of Integrated Territorial Development in the Operational Programmes of Programming Period 2014–2020; National Coordination Authority: Athens, Greece, 2015. [Google Scholar]
- Karadimitriou, N.; Maloutas, T.; Arapoglou, V.P. Multiple Deprivation and Urban Development in Athens, Greece: Spatial Trends and the Role of Access to Housing. Land 2021, 10, 290. [Google Scholar] [CrossRef]
- Maloutas, T.; Spyrellis, S.N.; Karadimitriou, N. Measuring and Mapping Vertical Segregation in Athens. In Vertical Cities. Micro-segregation, Social Mix and Urban Housing Markets; Maloutas, T., Karadimitriou, N., Eds.; Edward Elgar Publishing: Cheltenham, UK, 2022; pp. 88–99. [Google Scholar]
- Kandylis, G.; Maloutas, T.; Sayas, J. Immigration, Inequality and Diversity: Socio-Ethnic Hierarchy and Spatial Organization in Athens, Greece. Eur. Urban Reg. Stud. 2012, 19, 267–286. [Google Scholar] [CrossRef]
- Panori, A.; Psycharis, Y.; Ballas, D. Spatial Segregation and Migration in the City of Athens: Investigating the Evolution of Urban Socio-spatial Immigrant Structures. Popul. Space Place 2019, 25, e2209. [Google Scholar] [CrossRef]
- Arapoglou, V.; Maloutas, T. Segregation, Inequality and Marginality in Context: The Case of Athens. Greek Rev. Soc. Res. 2011, 136, 135–155. [Google Scholar] [CrossRef]
- Chatzikonstantinou, E.; Vatavali, F. Rethinking Energy Deprivation in Athens. In Energy Poverty and Vulnerability; Simcock, N., Thomson, H., Petrova, S., Bouzarovski, S., Eds.; Routledge: London, UK, 2017; pp. 96–118. [Google Scholar] [CrossRef]
- Dimitrakou, I. Vacancy, Access to Housing and Micro-segregation. Bull. De Corresp. Hellénique Mod. Contemp. 2022, 7, 43–66. [Google Scholar] [CrossRef]
- Leontidou, L. The Mediterranean City in Transition: Social Change and Urban Development; Cambridge University Press: Cambridge, UK, 1990. [Google Scholar]
- Maloutas, T. The Role of Vertical Segregation in Urban Social Processes. Nat. Cities 2024, 1, 185–193. [Google Scholar] [CrossRef]
- Marcińczak, S.; Hess, D.B. Vertical Segregation of Apartment Building Dwellers during Late State Socialism in Bucharest, Romania. Urban Geogr. 2020, 41, 823–848. [Google Scholar] [CrossRef]
- Meyer, A.; Pfirsch, T. Flat by Flat: Producing Micro-Scale Social Differentiation in an Arrival Neighbourhood in Marseille. In Vertical Cities; Micro-Segregation, Social Mix and Urban Housing Markets; Edward Elgar Publishing: Cheltenham, UK, 2022; pp. 39–56. [Google Scholar]
- Dines, N.; Mattiucci, C. Constantly Evoked but Under-Researched: The Conundrum of Vertical Stratification in Naples. In Vertical Cities; Micro-Segregation, Social Mix and Urban Housing Markets; Edward Elgar Publishing: Cheltenham, UK, 2022; pp. 23–38. [Google Scholar]
- Maloutas, T.; Karadimitriou, N. Introduction to Vertical Cities: Urban Micro-Segregation, Housing Markets and Social Reproduction. In Vertical Cities; Micro-Segregation, Social Mix and Urban Housing Markets; Maloutas, T., Karadimitriou, N., Eds.; Edward Elgar Publishing: Cheltenham, UK, 2022; pp. 1–21. [Google Scholar]
- EKKE (Centre National de Recherche Sociale); ELSTAT (Bureau Statistique Grec). Panorama du Recensement grec de 1991 à 2011; EKKE: Athens, Greece, 2011. [Google Scholar]
- ISCO-08; International Standard Classification of Occupations. Volume 1 Structure, Group Definitions and Correspondence Tables. International Labour Office (ILO): Geneva, Switzerland, 2012.
- Allen, J.; Barlow, J.; Leal, J.; Maloutas, T.; Padovani, L. Housing and Welfare in Southern Europe; Blackwell: Oxford, UK, 2004. [Google Scholar]
- Maloutas, T.; Pantelidou Maloutas, M.; Varka, E.; Doxiadis, K.; Kandylis, G. The Rejection of the ‘other’ as a Way to Deal with Otherness. Analysis of ESS Data for Europe and Greece. In Politics, Society, Citizens. Data Analysis from the European Social Survey (ESS); Kafetzis, P., Maloutas, T., Tsiganou, I., Eds.; EKKE: Athens, Greece, 2007; pp. 64–98. [Google Scholar]
Figure 1.
The location of the six cities.

Figure 2.
GDI for Athens (2011), common measurement scale (left) and city measurement scale (right).
Figure 2.
GDI for Athens (2011), common measurement scale (left) and city measurement scale (right).

Figure 3.
GDI for Thessaloniki (2011), common measurement scale (left) and city measurement scale (right).
Figure 3.
GDI for Thessaloniki (2011), common measurement scale (left) and city measurement scale (right).

Figure 4.
GDI for Patra (2011), common measurement scale (left) and city measurement scale (right).

Figure 5.
GDI for Heraklion (2011), common measurement scale (left) and city measurement scale (right).
Figure 5.
GDI for Heraklion (2011), common measurement scale (left) and city measurement scale (right).

Figure 6.
GDI for Larissa (2011), common measurement scale (left) and city measurement scale (right).
Figure 6.
GDI for Larissa (2011), common measurement scale (left) and city measurement scale (right).

Figure 7.
GDI for Volos (2011), common measurement scale (left) and city measurement scale (right).


Table 1.
Distribution of the population in the six main Greek cities (2011).
| City | Population | Cumulative Percentage | Unemployed | Higher Education (20–64 Years Old) | Population in Rented Dwellings |
|---|---|---|---|---|---|
| Athens | 3,722,450 | 34.4 | 13.9 | 31.1 | 24.4 |
| Thessaloniki | 1,040,325 | 44.0 | 9.8 | 21.2 | 21.7 |
| Patra | 196,051 | 45.8 | 8.9 | 18.5 | 23.4 |
| Heraklion | 168,235 | 47.8 | 8.9 | 18.4 | 27.8 |
| Larissa | 156,141 | 48.8 | 7.9 | 21.0 | 21.5 |
| Volos | 136,353 | 50.1 | 8.1 | 18.9 | 19.5 |
| Total Greece | 10,816,286 | 100.0 | 7.9 | 17.6 | 19.3 |
Table 2.
Variables taken into account to calculate the General Deprivation Index per city, URANU level 2011.
Table 2.
Variables taken into account to calculate the General Deprivation Index per city, URANU level 2011.
| Domain | Group | Variables (%) |
|---|---|---|
| Employment | Structural inactivity | Economically inactive Women homeworkers (20–54 years old) |
| Chances of access to employment | Unemployed Young unemployed (15–34 years old)) Mature unemployed (50–64 years old)) | |
| Lack of role models | Managers and professionals (30–64 years old) | |
| Quality of employment | Routine occupations | |
| Education | Lack of high Education level | Higher education (20–64 years old) |
| Low Education level | Up to 9 years of education (20–64 years old) | |
| Education dynamic | Not in education (15–18 years old) Not in education (19–27 years old) | |
| Housing | Extremely negative housing conditions | Population in irregular dwellings Population in dwellings without heating |
| Lack of housing space and vulnerability | Population in dwellings with <20 sq m/cap. Tenants in <20 sq m/cap. Routine occupations living in <20 sq m/cap. Unemployed in <20 sq m/ca. | |
| Tenure and vulnerability | Population in rented dwellings Routine occupations among tenants Unemployed among tenants |
Table 3.
Comparison of the GDI (city measurement scale) to the overall profile (LQ) 1.
| City | Very Low | Low | Average | High | Very High |
|---|---|---|---|---|---|
| Athens | 1.10 | 0.99 | 1.05 | 0.89 | 1.04 |
| Thessaloniki | 1.06 | 0.99 | 0.91 | 1.28 | 0.80 |
| Patra | 0.36 | 1.07 | 0.65 | 1.61 | 1.09 |
| Heraklion | 0.69 | 1.01 | 0.98 | 0.85 | 1.59 |
| Larissa | 0.14 | 1.13 | 0.92 | 0.95 | 0.92 |
| Volos | 0.00 | 1.10 | 0.97 | 1.08 | 0.75 |
| Average profile (total population) % | 4.3 | 52.6 | 25.3 | 12.7 | 5.1 |
1 The higher the score of LQs, above 1.00, the sharper positive the differentiation of a city from the whole dataset. The lower the score of LQs, below 1.00, the sharper the negative differentiation of a city from the whole dataset. A score of 1.00 indicates that the relation between vertical segregation and the level of deprivation in a city follows the average profile.
Table 4.
URANUs with vertical segregation (VS) potential, by city and by level of deprivation.
| Deprived URANUs with VS Potential | ||||
|---|---|---|---|---|
| City | VS Potential (%) | Number | Percentage (%) of All URANUs | Percentage (%) of All Deprived * URANUs |
| Athens | 47.3 | 168 | 5.6 | 34.3 |
| Thessaloniki | 32.5 | 27 | 3.1 | 15.3 |
| Patra | 31.6 | 2 | 1.2 | 4.9 |
| Heraklion | 22.0 | 2 | 1.5 | 8.3 |
| Larissa | 42.1 | 1 | 0.8 | 5.6 |
| Volos | 24.4 | 0 | 0.0 | 0.0 |
* As deprived URANUs, we consider those scoring high or very high on the deprivation index.
Table 5.
Profiles of low-rise deprived areas compared to the average city profile. Location quotient (LQ) (2011).
Table 5.
Profiles of low-rise deprived areas compared to the average city profile. Location quotient (LQ) (2011).
| City | Employment | Education | Housing | |||
|---|---|---|---|---|---|---|
| MP | RO | HE | LE | NH | IH | |
| Athens | 0.44 | 1.60 | 0.46 | 1.88 | 2.49 | 7.79 |
| Thessaloniki | 0.40 | 1.51 | 0.35 | 1.92 | 0.74 | 7.13 |
| Patras | 0.59 | 1.35 | 0.49 | 1.51 | 1.66 | 1.48 |
| Heraklion | 0.59 | 1.42 | 0.48 | 1.52 | 1.60 | 5.27 |
| Larissa | 0.51 | 1.57 | 0.46 | 1.73 | 2.53 | 2.83 |
| Volos | 0.53 | 1.49 | 0.48 | 1.61 | 2.25 | 6.25 |
| Deprived area population | 0.48 | 1.70 | 0.50 | 1.70 | 2.09 | 3.50 |
| Total population | 18.2% | 7.3% | 27.6% | 22.9% | 3.4% | 0.2% |
Disclaimer/Publisher’s Note: The statements, opinions and data contained in all publications are solely those of the individual author(s) and contributor(s) and not of MDPI and/or the editor(s). MDPI and/or the editor(s) disclaim responsibility for any injury to people or property resulting from any ideas, methods, instructions or products referred to in the content. |
© 2024 by the authors. Licensee MDPI, Basel, Switzerland. This article is an open access article distributed under the terms and conditions of the Creative Commons Attribution (CC BY) license (https://creativecommons.org/licenses/by/4.0/).
Share and Cite
MDPI and ACS Style
Karadimitriou, N.; Spyrellis, S. Measuring Deprivation and Micro-Segregation in Greek Integrated Sustainable Urban Development Strategies: Time to Apply a Common Method? Land 2024, 13, 552. https://doi.org/10.3390/land13040552
AMA Style
Karadimitriou N, Spyrellis S. Measuring Deprivation and Micro-Segregation in Greek Integrated Sustainable Urban Development Strategies: Time to Apply a Common Method? Land. 2024; 13(4):552. https://doi.org/10.3390/land13040552
Chicago/Turabian StyleKaradimitriou, Nikos, and Stavros Spyrellis. 2024. "Measuring Deprivation and Micro-Segregation in Greek Integrated Sustainable Urban Development Strategies: Time to Apply a Common Method?" Land 13, no. 4: 552. https://doi.org/10.3390/land13040552
Note that from the first issue of 2016, this journal uses article numbers instead of page numbers. See further details here.