
Factors Influencing Ephemeral Gullies at the Regional Scale: Formation and Density
by
 , , ,
, , ,
Lei Ma
1,2,†,
Chunmei Wang
1,2,†,
Yuan Zhong
1,2,
Guowei Pang
1,2,
Lei Wang
1,2,
Yongqing Long
1,2,
Qinke Yang
1,2 and
Bingzhe Tang
1,2,* 1
Shaanxi Key Laboratory of Earth Surface System and Environmental Carrying Capacity, College of Urban and Environmental Sciences, Northwest University, Xi’an 710127, China
2
Key Laboratory of Ecohydrology and Disaster Prevention in Arid Regions, National Forestry and Grassland Administration, Xi’an 710048, China
*
Author to whom correspondence should be addressed.
†
These authors contributed equally to this work.
Land 2024, 13(4), 553; https://doi.org/10.3390/land13040553
Submission received: 24 March 2024
/
Revised: 13 April 2024
/
Accepted: 17 April 2024
/
Published: 20 April 2024
Abstract
:Ephemeral gully (EG) erosion is an important type of water erosion. Understanding the spatial distribution of EGs and other influencing factors at a regional scale is crucial for developing effective soil and water management strategies. Unfortunately, this area has not been sufficiently studied. The present study visually interpreted the EGs based on Google Earth images in 137 small watersheds uniformly distributed in the Loess Plateau, compared them with measured results, and analyzed the factors influencing EG formation and density using GeoDetector. The results showed that visually interpreting EGs from Google Earth images was suitable for EG regional studies. Out of the 137 small watersheds, 33.6% had EG occurrence with an average density of 3.41 km/km2. Rainfall (R) and slope gradient (S) were the primary factors influencing the formation of EGs, while the area proportion of sloping farmland (APSF) and soil erodibility (K) were the main factors affecting EG density. The interaction of dual factors had a greater influence compared to single factors, with the interaction between S and Normalized Difference Vegetation Index (NDVI) having the greatest impact on EG formation and the interaction between K and NDVI on EG density. Although natural forces significantly influence whether EGs can form in a specific area, human activities greatly affect the density of the gullies that develop. This underscores the importance of proper land management in controlling gully erosion. These findings could provide theoretical support for EG prediction models and a scientific basis for soil and water loss control strategies at the regional scale.
1. Introduction
Soil erosion is a major threat to ecosystems and land sustainability worldwide [1]. Ephemeral gully (EG) erosion is an important type of soil erosion [2], accounting for 26.6–59.2% of the total erosion amount on the Loess Plateau [3]. This form of erosion is also common globally. For example, ephemeral gully erosion contributes more than 30% and 50% of the total erosion in areas with active water erosion in the United States and Western Europe, respectively [4,5]. In central Belgium, ephemeral gully erosion accounts for 44% of the total sediment yield [6], and the percentages are even higher in the Mediterranean coastal regions and southern Africa [7]. Ephemeral gully erosion leads to severe land degradation, particularly in loess regions [8]. At the regional scale, the primary need for control of EGs involves identifying areas where efforts should be concentrated and determining the most effective measures. This emphasizes the importance of understanding the spatial distribution and influencing factors, which are key scientific questions that this research addresses.
EGs, referring to erosion channels that can be crossed and filled by ordinary farming tools, will reappear in the same position during subsequent erosion events [9,10,11]. The width and depth of EGs fall between those of rill and permanent gullies [12], typically reaching down to the bottom of the plow layer (20 cm), with a width of approximately 30–50 cm [13]. A tile-backed landform may develop through repeated erosion and cultivation [13], which is more obvious on steep slopes. Because of the temporary nature of EGs, surveys are generally conducted at the base of these tile-backed landforms [14].
Understanding the spatial distribution and influencing factors of EGs is important for soil and water conservation planning. Current research on EGs focuses more on hillslopes and small watershed scales. For example, Xu et al. [15] quantified the spatial distribution of water flow dynamics on EGs by performing simulations under various rainfall and slope gradients in the laboratory. Geng et al. [16] analyzed the effects of a series of factors on EG erosion processes based on laboratory experiments. Ollobarren et al. [17] analyzed the soil characteristics that most reflect erodibility for EG erosion in small watersheds in Spain and Italy. Tang et al. [18] investigated the effects of rainfall and contour farming on the development of EGs in croplands at the small watershed scale. The lack of data sources is the most important reason for the limited knowledge of EG distribution and influencing factors at the regional scale. The rapid development of remote sensing technology has provided new possibilities for this research. High-resolution remote sensing images are becoming more commonly used in gully surveys and have become quite valuable data sources at the regional scale. Currently, research on gully surveys using remote sensing technology mainly focuses on permanent gullies (PGs), emphasizing gully extraction [19,20], spatial distribution, susceptibility area mapping [21,22], and erosion rates [23,24,25]. Using remote sensing images for EG studies is much more difficult at a regional scale since EGs normally have smaller features than PGs, are harder to identify, and are usually temporary; therefore, sub-meter or higher resolution images are usually needed. Reece et al. demonstrated the effectiveness of Google Earth imagery with sub-meter resolution in accurately extracting EGs in 72 fields [26]. Karydas and Panagos used Google Earth imagery to detect the national spatial distribution of EGs in Greece using a sampling strategy [27], marking a significant advancement in large-scale EG surveys.
Although Google Earth imagery could be a suitable data source for studying EGs at the regional scale, particularly concerning their spatial distribution and influencing factors, it remains uncertain whether it can be effectively used in the Loess Plateau. This region not only features some of the most complex terrains but also suffers from one of the severest rates of EG erosion globally. Furthermore, there is still a significant lack of deep understanding regarding the factors influencing EG spatial distribution at the regional scale. We hypothesized that Google Earth imagery with sub-meter or higher resolution would be suitable for a survey of EGs in the Loess Plateau and that the main factors influencing whether EGs could form in a specific area might differ from those dominating EG density. This is because natural forces would affect the former more, whereas human activities could primarily influence the latter.
In this study, we used Google Earth imagery combined with various datasets to investigate the spatial distribution of EGs and their influencing factors in the China Loess Plateau. Field measures employing the Global Navigation Satellite System Real-time Kinematic (GNSS RTK) were used for accuracy analysis. The specific objectives of this study are as follows: (1) to map the spatial distribution of EGs in the Loess Plateau using Google Earth imagery, thereby providing a viable method for EG investigations at a regional scale, and (2) to identify the main factors influencing both the potential formation of EGs in specific areas and their density. This research aims to provide theoretical support for EG erosion prediction models and a solid scientific basis for large-scale soil conservation practices.
2. Materials and Methods
2.1. Study Area
This research was conducted on the Loess Plateau of China, which is well known for its large amount of erosion, complex terrain, and long cropping history. In 1999, the Chinese government began to implement the “Green for Grain” project, which returned farmland to forests and grasslands. The Loess Plateau took the lead as a pilot project, implementing afforestation and turning sloping farmland into forest and grassland [28]. The boundary of the Loess Plateau was delineated by Chen Yongzong in 1988 [29], with a total area of approximately 380,000 km2. The multiyear average temperature ranges from 3.6 to 14.3 °C, and the annual rainfall varies from 300 to 700 mm, gradually decreasing from the southeast to the northwest. The main soil types on the Loess Plateau are cinnamon, dark loessial, loessial, grey desert, and so on. Among them, loessial soil is the most widely distributed soil, characterized by uniform soil texture that is loose and breathable but easily eroded.
Using a systematic sampling methodology, 137 sampling units were selected with an interval of 0.5° for both latitude and longitude (Figure 1a). It would be beneficial to utilize uniformly distributed small watersheds to comprehensively understand EG distribution across a large region. The average slope gradient in each sampling unit was calculated based on one arc-second resolution SRTM (Shuttle Radar Topography Mission) elevation data. If the slope gradient was greater than 2°, the sampling units were set to be shaped like small watersheds with an area of approximately 0.3 km2 (Figure 1b). Otherwise, the sampling units were rectangular in shape and 0.5 km × 0.5 km in size (Figure 1c). A typical small watershed in the middle reaches of the Wuding River, with an area of 0.44 km2 (Figure 1b), was selected as the field measurement sample area. In this area, 45 EGs were measured in the field to verify the accuracy of EG interpretation.
2.2. Base Data
Table 1 presents an introduction to the fundamental data of this study. Google Earth images from 2015 to 2020 with resolutions of 0.25 m and 0.49 m were used to interpret EGs. This approach was chosen because EGs exhibit significant variation across different seasons and years, often necessitating a review of past occurrences. In addition, 30 m SRTM data were used to extract was used for watershed boundaries, watershed elevation, slope gradient, and slope length extraction. Soil erodibility data were obtained from China National Soil and Water Conservation Census outcome datasets [30]. The land use data utilized in this study were obtained from the Data Center for Resources and Environmental Sciences, Chinese Academy of Sciences (RESDC) (http://www.resdc.cn (accessed on 20 October 2023)) [31], with a resolution of 30 m. This dataset primarily relies on satellite remote sensing data from the Landsat MSS, TM/ETM, and Landsat 8 satellites, which the United States operates. Select cultivated land with a slope greater than 5° from the year 2000 was analyzed to calculate the area within a 300 m by 300 m grid and determine the area proportion of sloped farmland. The average rainfall data from 1981 to 2019 were chosen based on precipitation data from the China Meteorological Administration. The normal difference vegetation index (NDVI) is the most commonly used indicator of vegetation cover and growth, and it can objectively and effectively reflect vegetation cover information at different spatial and temporal scales. The average NDVI from 1990 to 2019 was obtained based on the Google Earth Engine platform and calculated based on the normalized vegetation index calculated from synthetic annual mean NDVI datasets in near-infrared (B3) and red band (B4) from Landsat 5 and near-infrared (B5) and red band (B4) from Landsat 7 and Landsat 8.
2.3. EG Interpretation Method and Quality Control
The EG survey started in May 2020 and was completed by the end of September 2020; 6 interpreters were involved, and two-level quality controls were carried out. The visual interpretation process is as follows: (1) establishment of interpretation criteria based on the definition of ephemeral gullies and field survey experience; (2) visual interpretation conducted using Google Earth images for each sample unit; (3) the leader of the visual interpretation team performs a 100% check according to the interpretation criteria and makes careful corrections if any issues are identified; (4) experts in the EG research field are invited to perform a 20% check, and if the accuracy of correctly interpreted units is less than 90%, the results should be revised. The third step is then repeated for quality control.
EGs were interpreted using ArcGIS 10.5 software. The length of the EG, the length of the flow path to the EG head, and the number of EGs for each sampling unit were visually interpreted. The images were obtained mainly in spring and autumn to minimize the impact of vegetation, ice, and snow cover. Google Earth images in multiple time periods were used to avoid the loss of EGs because of possible unclear images. On images, EGs were approximately 30–50 cm wide and generally appeared as shallow depressions arranged according to a specific rule [13,32]. EGs were brighter or darker than the surrounding ground objects in the images. The cross-section expanded in an arc shape, showing a tile back landform without noticeable gully edges. Each EG was digitized from its watershed position to the end of the EG. The part above the head of the EG was the flow path of the EG head (Figure 2), and its length was considered to be the critical slope length for the EG development used in the following analysis.
2.4. Verification of Interpretation Accuracy
Global Navigation Satellite System Real-time Kinematic (GNSS RTK) was used to conduct field measurements of all EGs in a typical small watershed, and the three-dimensional coordinates of each point of the EGs were measured at an average interval of 0.5 m.
The interpreted EGs based on Google Earth images were compared with the field-measured data to determine whether the former was accurate. A Wilcoxon signed-rank test was conducted to evaluate whether there was a significant difference between the field-measured EG length and the interpreted EG length. The Wilcoxon signed-rank test is a non-parametric test used to analyze paired data or single-sample questions. A paired design is used to test the hypothesis that the probability distribution of the first sample is equal to that of the second sample. This hypothesis can be tested by statistical analysis of the differences calculated within pairs. The usual hypothesis tested is that these differences come from a distribution centered on zero [33]. The relative error of EG length was calculated (Equation (1)), as was the average value of the relative error of the EG length (Equation (2)).
where is the relative error of a single EG length, and is the average value of the relative error of the EG length. and are the length (m) of a single EG obtained based on Google Earth image interpretation and actual measurement, respectively.
2.5. Analysis of Influencing Factors
The GeoDetector is a statistical method that can detect the spatial differentiation of geographic elements and their influencing factors. It is immune to collinearity and can effectively identify the spatial differentiation of geographic spatial elements and reveal the driving factors [34]. It can detect the degree of interpretation of the impact factor X on the spatial differentiation of the dependent variable Y. The expression is as follows:
where i = 1,…, L is the stratification of variable Y or factor X, that is, partition or classification; Ni and N are the number of units in layer i and the whole area, respectively; and and are the variance of the Y value of layer i and the whole area, respectively [34]. The value range of q is [0, 1] and, the more it tends to 1, the stronger the explanatory power of the factor X on the variable Y and vice versa.
An interaction detector was used to detect whether the impact of the influencing factors X1 and X2 on the density of the EGs was enhanced or weakened or whether the influence on the density of the EGs was independent. First, the q values q(X1), q (X2), and q(X1∩X2) of the impact factors X1 and X2 on the EG density were calculated, and then the magnitudes of q(X1), q(X2), and q(X1∩X2) were compared. Five types of contrast relationships were formed, representing five types of effects, as shown in Table 2.
2.6. Analysis of Influencing Factors
This study utilizes Google Earth imagery and ground-measured data sources, considering that topography, rainfall, soil, vegetation, and human activities all affect EGs; the elevation, slope length (L), slope gradient (S), 1981–2019 average annual rainfall (Rainfall), the area proportion of sloping farmland (APSF), NDVI, and soil erodibility (K) were selected as impact factors. EGs were identified by visual interpretation, and the average values of the corresponding impact factors were calculated for each survey unit. The natural breakpoint method was used to classify the values of each impact factor of all survey units. The main factors influencing the formation and density of EGs in the Loess Plateau were analyzed using GeoDetector. The specific research process is shown in Figure 3.
3. Results
3.1. Accuracy of EG Interpretation
A Wilcoxon signed-rank test was performed to compare the lengths of 45 field-measured EGs with those obtained by visual interpretation of Google Earth images (Table 3). The results showed that the means (difference of 0.11) and standard deviations (difference of 0.661) were essentially the same, with a significance of 0.346 (α = 0.05) under the assumption that the median difference between the field measurements and the visual interpretation results is equal to 0. This indicates that the hypothesis is valid and there is no significant difference between the field measurements and the visual interpretation results. Further analysis revealed that the relative error for interpretation of EG length results based on the Google Earth image, , was ranged from 0.07% to 11.66% (Figure 4a). Approximately 58% of the EGs had values below 5%, and less than 7% of the EGs had an value greater than 10% (Figure 4b). The average was 4.99%. The results showed that reliable EG length results could be obtained using sub-meter resolution Google Earth images. By measuring the length, we were able to further calculate the density of the sampling units.
Among the 137 sampling units on the Loess Plateau, 46 sampling units had EGs, accounting for 33.6% of the total sampling units. The average density of EGs among these units was 3.41 km/km2. These units were primarily located in the central-northern part of the Loess Plateau (e.g., northern Shaanxi Province, central Shanxi Province) and the western Loess Plateau (e.g., central and eastern Gansu Province) (Figure 5). The distribution of units with EGs formed a strip from northeast to southwest. In northern Shaanxi, the density of EGs exceeded 7 km/km2, indicating severe erosion; in central Shanxi and the central and eastern parts of Gansu Province, densities ranged from 5 to 7 km/km2. The density of EGs varied in this region.
3.2. Analysis of Influencing Factors on EG Formation
The classification values Xn described in Section 2.5 and the EG density Y of all sampling units were used as operating data for the geographic detector. If the EG density was 0, Y was recorded as 0, and if the EG density was greater than 0, Y was recorded as 1. The result of the factor detector analysis using GeoDetector indicated that the order of the factor q statistic influencing the formation of EGs was Rainfall > S > APSF > NDVI > Elevation > K > L (Table 4). Rainfall played a crucial role in the formation of EGs, with S also having a significant influence. In contrast, the influence of L on the formation of EGs was comparatively small.
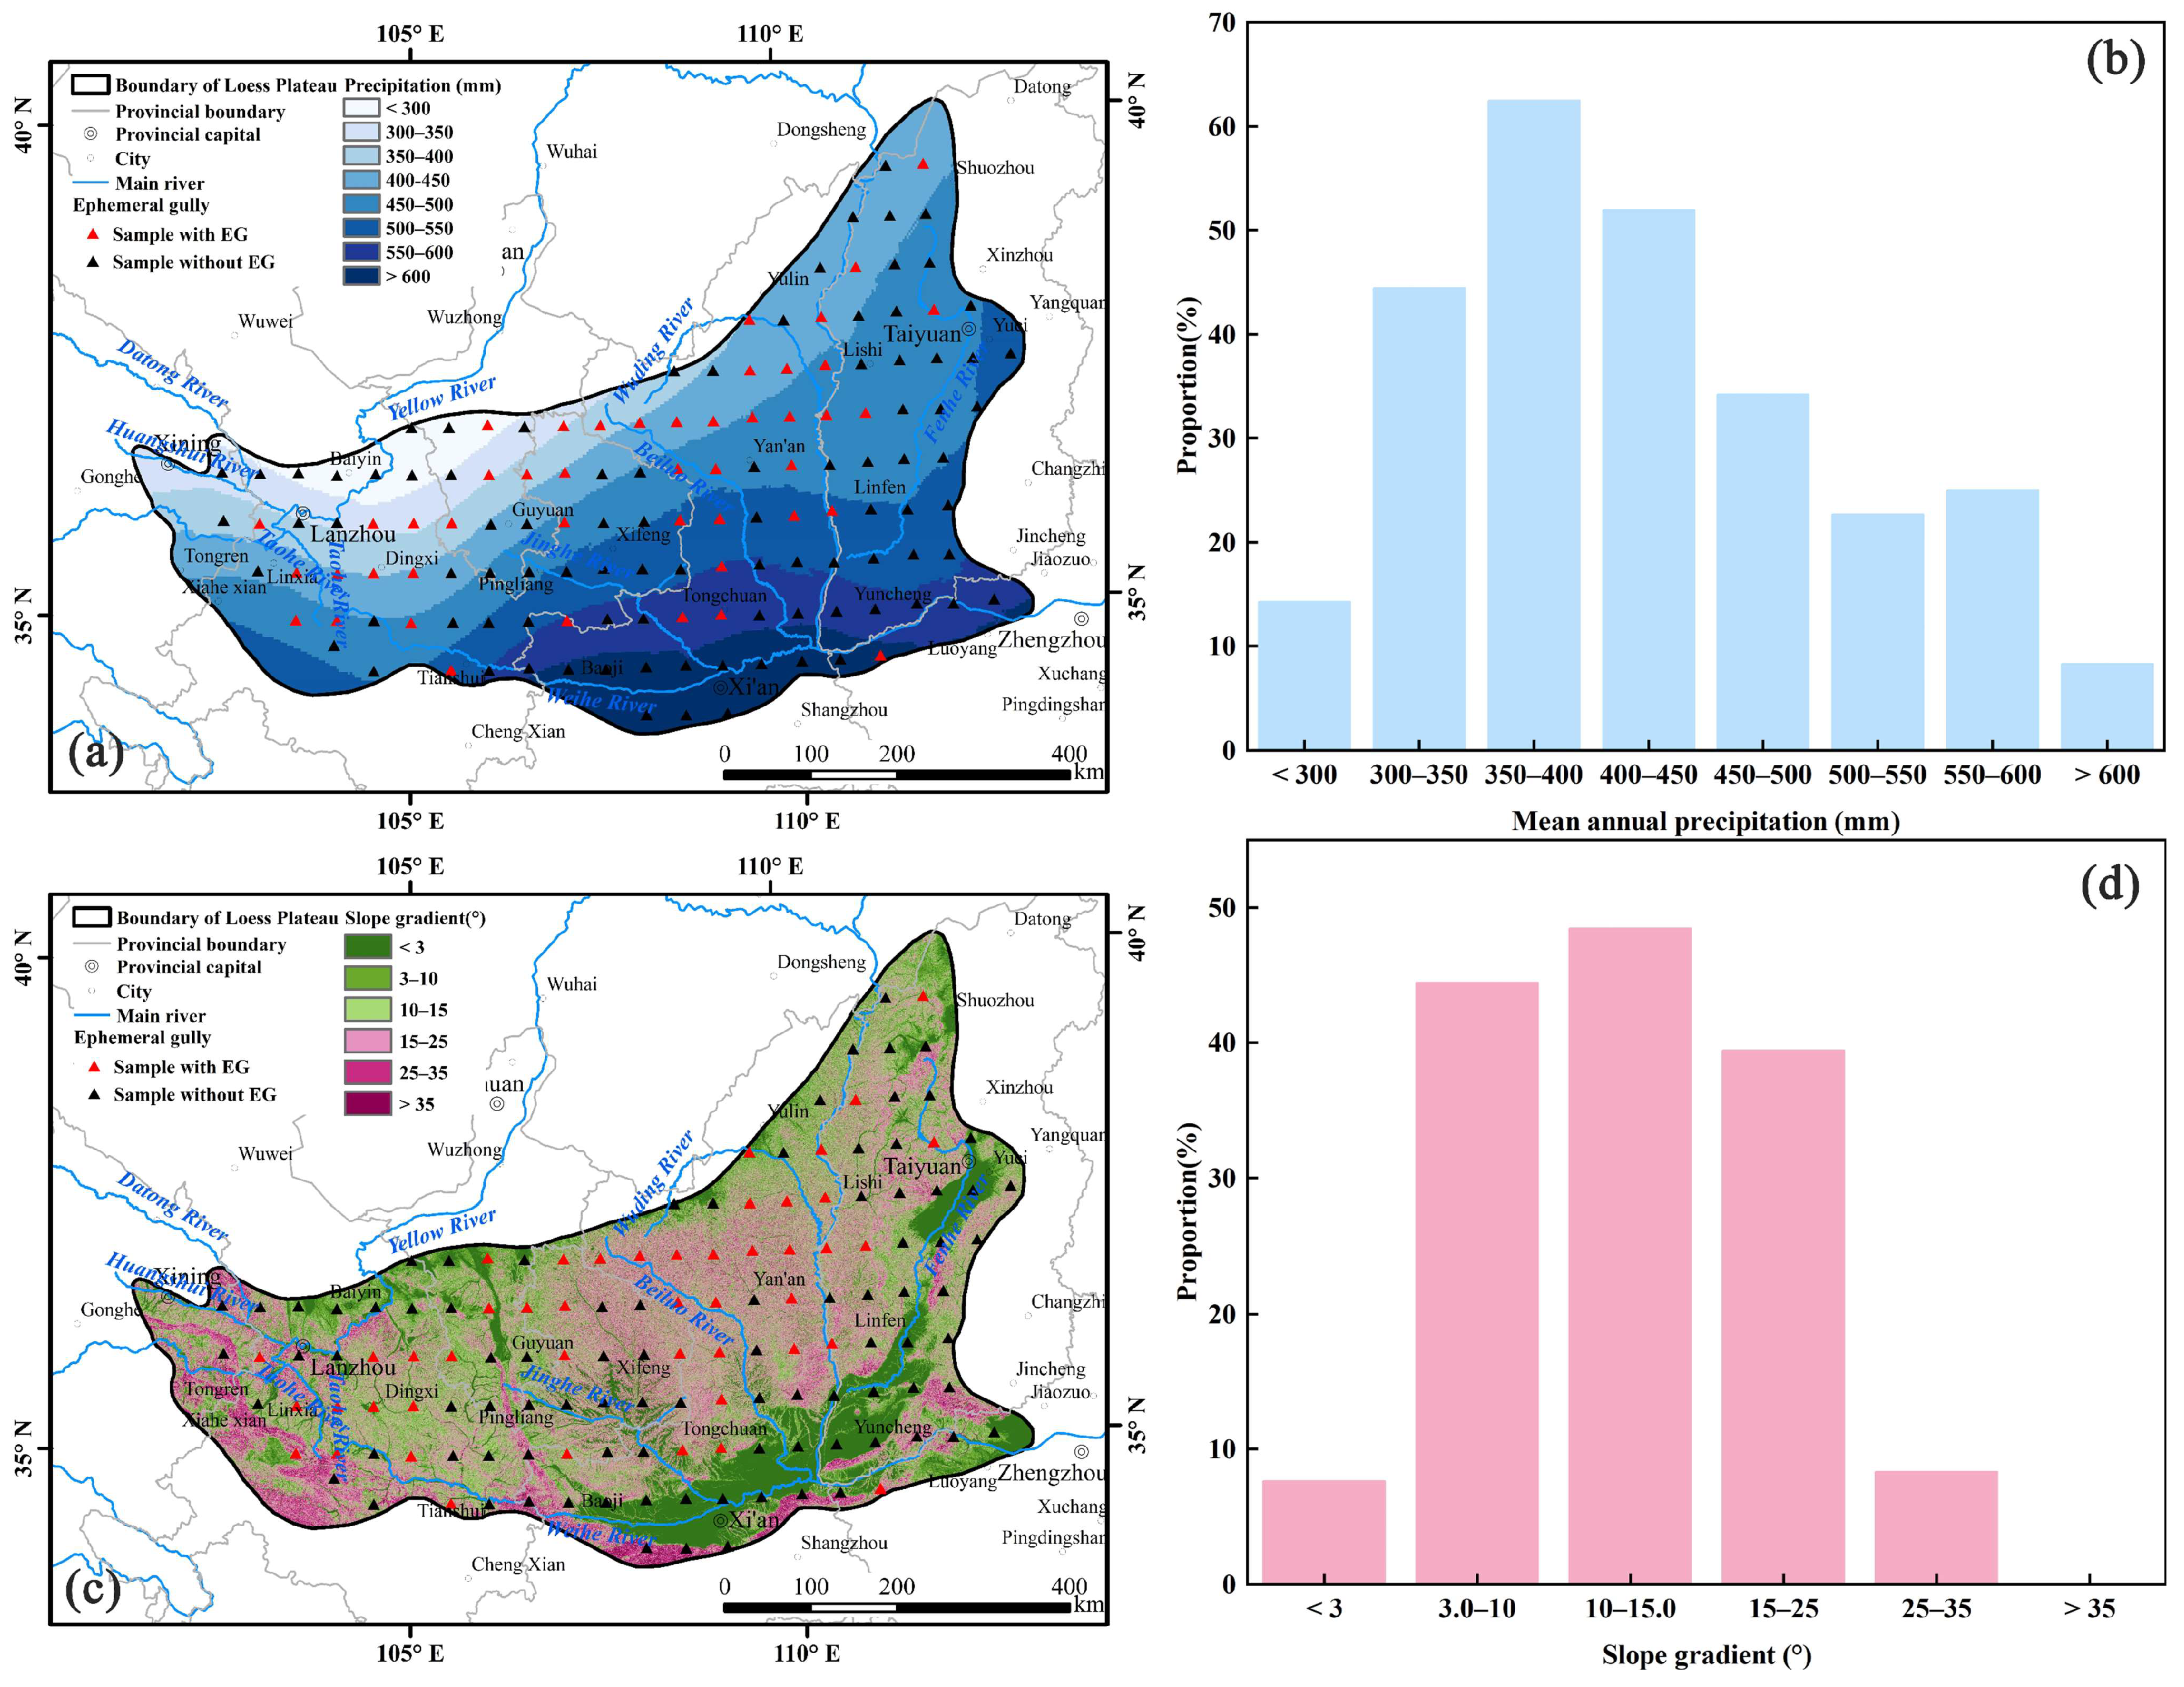
Analysis of the spatial distribution of annual rainfall (Figure 6a) and slope gradient (Figure 6c) on the Loess Plateau shows that the southern region receives more rainfall but has a smaller slope gradient. This high surface vegetation cover results in low surface runoff kinetic potential, thereby reducing the likelihood of EG formation. Conversely, despite receiving less rainfall. The northern region has a steeper slope gradient and concentrated rainfall in the summer, increasing the kinetic potential energy of surface runoff, thus facilitating EG formation. Figure 6b displays the probabilities of EGs occurring at various rainfall levels. The highest probability, 60%, appears in the 350–400 mm range. This is followed by the 400–450 mm range, where over 50% of the sampling units have EGs. Additionally, in the 300–350 mm range, the probability is also high, exceeding 40%. This suggests that EGs are more likely to form within the 300–500 mm rainfall range. In areas with rainfall between 300 mm and 600 mm, the probability of EG formation does not exceed 15%, suggesting that EGs are less likely to form in this range. Figure 6d shows the probabilities of EG occurrence across different slope grades. Nearly 50% of units in areas with slopes between 10° and 15° experience EGs, followed by the 3–10° range, with a proportion exceeding 40%, and the 15–25° range also having a high proportion, close to 40%. This suggests that EGs are likely to form within the 3–25° slope range. In areas with slopes less than 3° or greater than 25°, fewer than 10% of units experience EGs, particularly in areas with slopes exceeding 35°, where no EG formation is observed. Due to significant spatial variability in rainfall and the steep slope gradient on the Loess Plateau, we opted to calculate the proportion of units generating EGs within each grade level to all units within that level. This approach helps to negate issues arising from inconsistent quantities of sampling units within each grade. Further research reveals that the influence of rainfall and slope on the genesis of EGs follows a pattern of initial increase followed by a decrease. As rainfall and slope increase, soil moisture content gradually saturates, leading to surface runoff. The continual increase in slope adds kinetic potential, increasing the probability of breaking through the topsoil layer and forming shallow gullies. With further increases in rainfall and slope gradient, the likelihood of EG formation decreases once rainfall exceeds 400 mm and slope exceeds 15°. However, this does not imply that soil erosion does not occur; rather, it suggests that more severe forms of erosion, such as gully erosion, are prevalent.
The interaction detection results of the GeoDetector reflect whether the joint effect of factors X1 and X2 increases or decreases the explanatory power of the dependent variable Y, an important outcome. The analysis of the interaction detection (Figure 7) shows that the interaction between S and NDVI has the highest q statistic (q = 0.55), indicating that their combined effect has the greatest influence on the formation of EGs. Following this, the interaction between S and APSF (q statistic = 0.48) also significantly affects the formation of EGs when acting together. Additionally, the q statistics for the interaction detection between APSF and Rainfall, APSF and NDVI, S and Rainfall, Elevation and Rainfall, and K and Rainfall are all above 0.4, indicating significant influences on the formation of EGs. Further analysis revealed that the minor q statistic in the interaction detection is between L and K (q = 0.14), which is higher than the smallest single factor q statistic for L (q = 0.01). The q statistic significantly increases when L interacts with other factors. This indicates that the influence of dual factors on the formation of EGs is greater than that of a single factor. Moreover, the q statistic for the dual factors involving rainfall and S is higher than that for other dual factors, further demonstrating that these are the primary influencing factors for the formation of EGs. Overall, the explanatory power of the dual factor is significantly greater than that of the single factor, with Rainfall and S being the primary factors influencing the formation of EGs.
3.3. Analysis of Influencing Factors of EG Density
The natural breakpoint method was used to classify the influence factor values of the sampling units with EGs, and the classification values of each factor corresponded to the EG density of these units. The classification value Xn and the EG density Y of each influence factor were used as the operating data of the geographic detector, where Y represented the EG density value. The result of the factor detector analysis by the GeoDetector indicated (Table 5) that the ranking of factors influencing EG density was APSF > K > NDVI > L > S > Elevation > Rainfall. Among these, the area proportion of sloping farmland played the most significant role, while soil erodibility and the average annual NDVI also provided strong explanatory power. In contrast, mean annual rainfall had the least influence on the density of EGs.
In the analysis of the spatial distribution of the area proportion of sloping farmland (Figure 8a) and t soil erodibility (Figure 8c) on the Loess Plateau, it can be seen that areas with a higher proportion of sloping farmland are mainly concentrated in the northern and central-western regions, while areas with greater soil erodibility are primarily distributed in the northeastern and central parts. In these regions, the density of EGs is also relatively higher, further indicating that APSF and K are the main influencing factors for the density of EGs. Figure 8b shows the trend relationship between the APSF and the density of EGs. It can be observed that as APSF increases, the density of EGs also increases. The maximum density of EGs occurs near an APSF of about 60%, and the sampling units with higher EG density are near this proportion. Figure 8d illustrates the trend relationship between the K and the density of EGs. Similar to APSF, as K increases, the density of EGs also shows an upward trend. The maximum sampling unit of EG density appears near 0.015, and the sampling units with higher EG density are mainly concentrated between 0.01 and 0.015. However, starting from 0.009, there is also a trend of density increase with the increase in soil erodibility. Overall, as the proportion of sloping farmland and soil erodibility continue to rise, the density of EGs also shows an upward trend. It is worth noting that the trend lines for both sloping farmland and soil erodibility are relatively flat. This is because the trend is obtained by integrating all units. We believe that considering all sampling units as a whole can represent changes at the regional scale, and the results are more applicable to the regional scale rather than just obtaining the trend of changes in sampling units with EG density.
Under the interaction detection of the dual factors, the explanatory power of the spatial distribution of EG density om the Loess Plateau is significantly improved (Figure 9). The interaction detection between K and NDVI has the highest q statistic (q = 0.85), indicating that it has the greatest influence on EG density, followed by the interaction between K and APSF, which also has a relatively high q statistic (q = 0.81), suggesting it also significantly affects EG density as well. Additionally, the interaction detection between Rainfall and NDVI, as well as L and APSF, have relatively high q statistic of 0.80 and 0.77, respectively, indicating they also influence EG density to a certain extent. On the other hand, the interaction between Elevation and Rainfall has the lowest q statistic (q = 0.34), indicating that their interaction detection has a smaller influence on EG density. However, it is still greater than the smallest q statistic among single factors for Rainfall. The q statistic for the interaction detection of Rainfall with other factors are all greater than its own, suggesting that dual factors influence EGs significantly more than that of a single factor. Additionally, interaction detection shows that the q statistic for dual factors containing APSF or K is higher than that for other dual factors, further demonstrating that APSF and K are the main factors influencing the density of EGs. Overall, the explanatory power of the dual factor is significantly greater than that of the single factor, with APSF and K being the primary factors influencing the density of EGs.
4. Discussion
Our results supported the hypothesis that sub-meter resolution images provide a practical way to survey EGs at a regional scale. They also confirm that factors influencing the formation and density of EGs differ from each other. The EG density was high and spatially heterogeneous in the Loess Plateau area. Both natural and human-related factors influenced the distribution of EGs, but in different ways. Overall, human activities influence the density of EGs, while whether a specific area has the potential for EG formation is dominated by natural factors. The results reached the goals of this research and helped with the knowledge gap in large-scale understanding of EG distribution and influencing factors.
4.1. Value of Google Earth Images in the Regional Study of EGs
This research conducted a regional survey of EGs. The accuracy was high, and it showed that it was a reasonable way to survey EGs in large areas. Some other studies have also confirmed this result [26,27,35]. Extracting the spatial distribution and morphological characteristics of EGs based on remote sensing images obtained by aerials and UAVs is also an essential currently used method for obtaining erosion gully data [36]. However, due to the high cost of large-scale image acquisition, this approach to surveying EGs has been primarily focused on the watershed scale. It is difficult to survey and study the spatial distribution of EGs at the regional scale using UAVs, which limits our capacity to identify the influencing factors and developmental dynamics of EGs on a regional scale.
This paper utilizes a method that combines visual interpretation with field surveys to conduct EG surveys on a regional scale. Regions with a high density of EGs are located in the northern part of the Loess Plateau; this finding aligns with field surveys conducted in the 1980s, which revealed EG densities of 19.80 km/km2 in Zhidan County and 13.98 km/km2 in Ansai County, both in northern Shaanxi Province [37]. The northern part of the Loess Plateau serves as China’s agriculture-pastoral transition zone and is characterized by ecological fragility. Here, the combined effects of wind and water erosion, along with the conflicts between human activity and land use, have led to severe soil erosion in the region [38,39,40]. This study systematically sampled 137 units at intervals of 0.5°, uniformly distributed across the Loess Plateau, effectively reflecting the differences in EGs among various regions. This method is also applicable to selecting other large regional sample areas.
4.2. Factors Influencing the Spatial Distribution of EGs
The GeoDetector results indicate that the formation of EGs is primarily controlled by natural factors, with Rainfall and S being the most important factors. The continuous impact of raindrops on the surface disperses soil aggregates, reducing soil porosity and diminishes infiltration capacity, leading to concentrated runoff [41]. As rainfall and slope gradient increase, the hydrodynamic force of surface runoff intensifies, further degrading the surface to form EGs [42], aligning with current research findings [32,43]. The results show that the probability of EG formation decreases once rainfall and slope reach a certain threshold. This is attributed to the impact of rainfall on ground cover [44] and vegetation, which reduces the kinetic energy of raindrops through canopy and litter components, thereby mitigating erosion [45]. However, this does not imply the absence of soil erosion. Exceeding the threshold in slope gradient or rainfall increases the splashing capacity of raindrops and the erosive power of surface runoff, resulting in higher levels of erosion gullies [42]. The density of EGs, which represents the length and number of gullies within a watershed, indicates further development. Once an EG is formed, surface runoff continues to converge at this location, and the gully head develops upwards along the flow path [46,47]. The development of EGs depends on soil resistance to erosion. However, soil erodibility is influenced by natural factors, such as the soil’s physical and chemical properties, slope gradient, and human activities [48]. The results suggest that these factors influence the density of EGs and exhibit a continuously increasing trend. In areas with high EG density, there is a greater risk of progression to higher levels of erosion gullies. Therefore, in regions with a higher probability and density of EGs, it is necessary to construct engineering measures for soil and water conservation, increase vegetation cover, and implement appropriate cultivation practices to prevent the development of EGs into more severe forms of erosion gullies.
The formation and density of EGs is a complex process influenced by several factors, including rainfall, topography, soil type, and vegetation cover [49,50,51]. The GeoDetector results strongly support this view, indicating that the explanatory power of dual factors working together is significantly greater than that of a single factor. The canopy of surface vegetation can weaken the kinetic energy of raindrops, reducing their impact on the soil surface [52]. However, with increasing slopes under the same rainfall conditions, runoff generation occurs sooner and becomes more intense, and the total splash erosion increases [53]. Therefore, planting drought-tolerant vegetation in areas with less precipitation and increasing vegetation cover on steeper slopes can both effectively prevent the formation of EGs. To address the conflict between population growth and food supply, some areas of the Loess Plateau have cultivated farmland on slopes, which not only destroys the topsoil but also causes the soil to become loose. Consequently, the Chinese government has implemented the “Green for Grain” policy, which reduces the area of sloping farmland while increasing the coverage of surface vegetation, effectively reducing soil erosion in the Loess Plateau [23,54].
It is worth noting that this study determined the area proportion of sloping farmland based on land use data from the year 2000. This choice is justified as long-term cultivation on the Loess Plateau has historically caused severe soil and water loss. However, with the implementation of the ‘Green for Grain’ by the Chinese government in 1999, the intensity of soil erosion has decreased [55,56]. Therefore, we believe that the land use situation around the year 2000 best reflects the impact of soil and water loss. At the same time, the biggest obstacle to studying soil erosion at a regional scale is data collection. In our study, we made significant efforts to unify the temporal and spatial resolution of the factors. Although many types of factor data are now publicly available, unifying them for larger-scale studies, such as national or global, remains a challenge. An important aspect of future research will be to minimize the impact of different temporal or spatial resolutions on the results.
4.3. Implications and Limitations
In terms of regional analysis, two main inquiries stand out in soil conservation planning. First, it is essential to pinpoint which areas need conservation. Second, we must decide on the most effective strategies for this purpose. Our research has effectively charted the presence of EGs across a wide area. It has yielded precise data for the Loess Plateau. Such information is vital for planning where to focus soil conservation actions. The influencing factors analyzed in this study are critical in choosing successful interventions. Additionally, our findings extend to the domain of erosion modeling. A prevalent issue in many erosion models is the precise identification of EGs. This precision is necessary to distinguish different erosion types, such as rill, interrill, and gully erosion. The insights gained from our investigation can facilitate pinpointing the origins of erosion channels. They can also aid in the selection of fitting modeling approaches.
Field measurements could provide a solid accuracy assessment, but they are rather time- and labor-consuming. Drone imagery could be an alternative since the accuracy would reach up to a centimeter level [36], especially when reconstructing three-dimensional features with LiDAR data to obtain erosion gully parameters [57]. A method of combining drone data and limited field measurement should be explored in the future.
In this research, our primary method was visual interpretation. We used it to survey EGs on a regional scale. Our goal was to achieve highly accurate results. In future studies, employing artificial intelligence to automatically extract EGs could prove beneficial. For instance, techniques such as object-oriented algorithms and random forest classification have been utilized. These techniques were specifically applied in the study of permanent gully systems, as referenced in sources [58,59]. However, EGs tend to be smaller in size. This makes it challenging to attain high accuracy in their automatic extraction. Consequently, additional efforts are necessary to address this challenge.
5. Conclusions
In this study, we describe the regional spatial distribution and influencing factors of EGs on the Loess Plateau, known for its highly complex landscape in the world, from a regional scale perspective. Our research has demonstrated that utilizing sub-meter resolution Google Earth imagery for surveying EGs at a regional scale is a suitable methodology. We have also identified natural forces as the primary influencing factors determining the formation of EGs in a specific area, while human activities significantly impact the density of the gullies.
- (1)
- Using sub-meter resolution Google Earth imagery and visual interpretation method, the gully length error remained under 11.66%, averaging 4.99%. The results were not significantly different from the GNSS RTK field measurements.
- (2)
- EGs were widespread across the Loess Plateau region, and the average density reached 3.41 km/km2, with relatively high spatial variability across the region.
- (3)
- The formation of EGs is mainly influenced by natural factors, with Rainfall and S having the greatest influence; the density of EGs is mainly influenced by the combined action of natural and anthropogenic factors, with the area proportion of sloping farmland and soil erodibility having the greatest influence. The influence of two factors on variables is significantly greater than that of a single factor.
Since this research was completed in the Loess Plateau, the results would primarily be applicable to areas characterized by highly complex terrain, severe EG erosion, ecosystems dominated by agriculture and grassland, and a temperate continental monsoon climate. The results of our study can provide an important scientific basis for soil and water loss control and conservation measures. These findings can also provide insights for developing predictive models for EG occurrence and development.
Author Contributions
Conceptualization, C.W. and B.T.; methodology, L.M., Y.Z., C.W. and B.T.; validation, C.W. and B.T.; Visualization, L.M., C.W. and B.T.; formal analysis, L.M., C.W. and Y.Z.; investigation, G.P., L.W. and Y.L.; data curation, L.M., Y.Z. and C.W.; writing—original draft preparation, L.M., Y.Z. and C.W; writing—review and editing, G.P., L.W., Y.L., Q.Y. and B.T.; supervision, C.W. and B.T.; project administration, C.W. and B.T.; funding acquisition, C.W. All authors have read and agreed to the published version of the manuscript.
Funding
This research was funded by National Natural Science Foundation of China, grant number 41977062, and National Natural Science Foundation of China, grant number 42207384.
Data Availability Statement
The raw data supporting the conclusions of this article will be made available by the authors upon request. E-mail: [email protected] (L.M.); [email protected] (C.W.); [email protected] (B.T.).
Acknowledgments
The author gratefully acknowledges David Jupp from CSIRO Land and Water for offering valuable suggestions regarding this work. Special thanks are due to the Google Company for providing freely available images for research purpose.
Conflicts of Interest
The authors declare no conflicts of interest.
References
- Pimentel, D. Soil erosion: A food and environmental threat. Environ. Dev. Sustain. 2006, 8, 119–137. [Google Scholar] [CrossRef]
- Liu, B.Y.; Zhu, X.M.; Zhou, P.H.; Tang, K.L. The Laws of Hillslope Channel Erosion Occurrence and Development on Loess Plateau. Res. Soil Water Conserv. 1988, 9–18. [Google Scholar]
- Zheng, F.; Wu, M.; Zhang, Y.; Ding, J. Ephemeral Gully Development Process at Loess Steep Hillslope. Sci. Geogr. Sin. 2006, 26, 438–442. [Google Scholar] [CrossRef]
- Bennett, S.J.; Alonso, C.V.; Prasad, S.N.; Römkens, M.J.M. Experiments on headcut growth and migration in concentrated flows typical of upland areas. Water Resour. Res. 2000, 36, 1911–1922. [Google Scholar] [CrossRef]
- Capra, A.; La Spada, C. Medium-term evolution of some ephemeral gullies in Sicily (Italy). Soil Tillage Res. 2015, 154, 34–43. [Google Scholar] [CrossRef]
- Poesen, J.; Vandaele, K.; Wesemael, B. Gully Erosion: Importance and Model Implications. In Modelling Soil Erosion by Water; Springer: Berlin/Heidelberg, Germany, 1998; pp. 285–311. [Google Scholar]
- Poesen, J.; Nachtergaele, J.; Verstraeten, G.; Valentin, C. Gully erosion and environmental change: Importance and research needs. Catena 2003, 50, 91–133. [Google Scholar] [CrossRef]
- Dumbrovsky, M.; Drbal, K.; Sobotková, V.; Uhrová, J. An approach to identifying and evaluating the potential formation of ephemeral gullies in the conditions of the Czech Republic. Soil Water Res. 2019, 15, 38–46. [Google Scholar] [CrossRef]
- Foster, G.R. Understanding ephemeral gully erosion. In Assessing the National Resources Inventory, Board on Agriculture, National Research Council; Committee on Conservation Needs, Opportunities, Soil Conservation, Ed.; National Academy Press: Washington, DC, USA, 1986. [Google Scholar]
- Woodward, D.E. Method to predict cropland ephemeral gully erosion. Catena 1999, 37, 393–399. [Google Scholar] [CrossRef]
- Poesen, J.; Govers, G. Gully Erosion in the Loam Belt of Belgium—Typology and Control Measures. Soil Eros. Agric. Land 1990, 513–530, 687. [Google Scholar]
- Levi, N.N. Modelling of Gully Erosion Site Data in Southeastern Nigeria, Using Poisson and Negative Binomial Regression Models. J. Civ. Constr. Environ. Eng. 2018, 3, 111–117. [Google Scholar] [CrossRef]
- Liu, B.; Yang, Y.; Lu, S. Discriminations on common soil erosion terms and their implications for soil and water conservation. Sci. Soil Water Conserv. 2018, 16, 9–16. [Google Scholar] [CrossRef]
- Zhang, Y.; Fan, C.H.; Gong, Y.H.; Zhang, J.H. Investigation on Ephemeral Gully Erosion Rate Based on QuickBird Images in Loess Hilly Region. Trans. Chin. Soc. Agric. Mach. 2017, 48, 239–244. [Google Scholar] [CrossRef]
- Xu, X.; Zheng, F.; Wilson, G.V. Flow hydraulics in an ephemeral gully system under different slope gradients, rainfall intensities and inflow conditions. Catena 2021, 203, 105359. [Google Scholar] [CrossRef]
- Geng, H.; Zheng, F.; Zhao, L.; Wang, L.; Zhao, T.; Qin, Q.; An, X. An Experimental Study on Effects of Rainfall, Inflow and Slope Gradient on Ephemeral Gully Slope Erosion in Chinese Mollisol Region. J. Soil Water Conserv. 2024, 1–12, accepted. [Google Scholar] [CrossRef]
- Ollobarren Del Barrio, P.; Campo-Bescós, M.A.; Giménez, R.; Casalí, J. Assessment of soil factors controlling ephemeral gully erosion on agricultural fields. Earth Surf. Process. Landf. 2018, 43, 1993–2008. [Google Scholar] [CrossRef]
- Tang, J.; Xie, Y.; Liu, C.; Dong, H.; Liu, G. Effects of rainfall characteristics and contour tillage on ephemeral gully development in a field in Northeastern China. Soil Tillage Res. 2022, 218, 105312. [Google Scholar] [CrossRef]
- Wang, B.; Zhang, Z.; Wang, X.; Zhao, X.; Yi, L.; Hu, S. The Suitability of Remote Sensing Images at Different Resolutions for Mapping of Gullies in the Black Soil Region, Northeast China. Remote Sens. 2021, 13, 2367. [Google Scholar] [CrossRef]
- Mohamadi, P.; Ahmadi, A.; Fezizadeh, B.; Jafarzadeh, A.; Rahmati, M. A Semi-automated Fuzzy-Object-Based Image Analysis Approach Applied for Gully Erosion Detection and Mapping. J. Indian Soc. Remote Sens. 2021, 49, 1153–1169. [Google Scholar] [CrossRef]
- Gholami, H.; Mohammadifar, A.; Golzari, S.; Song, Y.; Pradhan, B. Interpretability of simple RNN and GRU deep learning models used to map land susceptibility to gully erosion. Sci. Total Environ. 2023, 904, 166960. [Google Scholar] [CrossRef]
- Arabameri, A.; Chen, W.; Loche, M.; Zhao, X.; Li, Y.; Lombardo, L.; Cerda, A.; Pradhan, B.; Bui, D.T. Comparison of machine learning models for gully erosion susceptibility mapping. Geosci. Front. 2020, 11, 1609–1620. [Google Scholar] [CrossRef]
- Liu, B.; Zhang, B.; Yin, Z.; Hao, B.; Wu, S.; Feng, H.; Siddique, K.H.M. Ephemeral gully development in the hilly and gully region of China’s loess plateau. Land Degrad. Dev. 2024, 35, 128–141. [Google Scholar] [CrossRef]
- Zhang, G.; Zhao, W.; Yan, T.; Qin, W.; Miao, X. Estimation of Gully Growth Rate and Erosion Amount Using UAV and Worldview-3 Images in Yimeng Mountain Area, China. Remote Sens. 2023, 15, 233. [Google Scholar] [CrossRef]
- Raj, R.; Yunus, A.P.; Pani, P.; Avtar, R. Towards evaluating gully erosion volume and erosion rates in the Chambal badlands, Central India. Land Degrad. Dev. 2022, 33, 1495–1510. [Google Scholar] [CrossRef]
- Reece, D.; Lory, J.; Haithcoat, T.; Gelder, B.; Cruse, R. Using Google Earth Imagery to Target Assessments of Ephemeral Gully Erosion. J. ASABE 2023, 66, 155–166. [Google Scholar] [CrossRef]
- Karydas, C.; Panagos, P. Towards an Assessment of the Ephemeral Gully Erosion Potential in Greece Using Google Earth. Water 2020, 12, 603. [Google Scholar] [CrossRef]
- Huang, L.; Cao, W.; Zhu, P. The regional variation characters of ecological effects of the Grain for Green Project. Acta Ecol. Sin. 2020, 40, 4041–4052. [Google Scholar] [CrossRef]
- Chen, Y. Modern Erosion and Control of the Loess Plateau; Science Press: Beijing, China, 1988. [Google Scholar]
- Liang, Y.; Liu, X.; Cao, L.; Zheng, F.; Zhang, P.; Shi, M.; Cao, Q.; Yuan, J. K Value Calculation of Soil Erodibility of China Water Erosion Areas and Its Macro-Distribution. Soil Water Conserv. China 2013, 10, 35–40+79. [Google Scholar] [CrossRef]
- Xu, X.L.; Liu, J.Y.; Zhang, S.W.; Li, R.D.; Yan, C.Z.; Wu, S.X. China’s Multi-Period Land Use Land Cover Remote Sensing Monitoring Dataset (CNLUCC); Resource and Environment Science Data Platform: Beijing, China, 2018. [Google Scholar] [CrossRef]
- Zhang, K.L.; Tang, K.L.; Wang, B.K. A study on characteristic value of shallow gully erosion genesis on slope farmland in the loess plateau. J. Soil Water Conserv. 1991, 5, 8–13. [Google Scholar] [CrossRef]
- Woolson, R.F. Wilcoxon Signed-Rank Test. In Wiley Encyclopedia of Clinical Trials; John Wiley and Sons: Hoboken, NJ, USA, 2008; pp. 1–3. [Google Scholar]
- Wang, J.; Li, X.; Christakos, G.; Liao, Y.; Zhang, T.; Gu, X.; Zheng, X. Geographical Detectors-Based Health Risk Assessment and its Application in the Neural Tube Defects Study of the Heshun Region, China. Int. J. Geogr. Inf. Sci. 2010, 24, 107–127. [Google Scholar] [CrossRef]
- McInnes, J.; Vigiak, O.; Roberts, A.M. Using Google Earth to map gully extent in the West Gippsland region (Victoria, Australia). In Proceedings of the 19th International Congress on Modelling and Simulation (MODSIM), Perth, Australia, 12–16 December 2011; pp. 3370–3376. [Google Scholar]
- Vanmaercke, M.; Poesen, J.; Van Mele, B.; Demuzere, M.; Bruynseels, A.; Golosov, V.; Bezerra, J.F.R.; Bolysov, S.; Dvinskih, A.; Frankl, A.; et al. How fast do gully headcuts retreat? Earth-Sci. Rev. 2016, 154, 336–355. [Google Scholar] [CrossRef]
- Liu, B.Y. The Harm of Slope Gully Erosion on the Loess Plateau and the Law of Its Occurrence and Development; Chinese Academy of Sciences: Xianyang, China, 1984. [Google Scholar]
- Tuo, D.; Xu, M.; Gao, G. Relative contributions of wind and water erosion to total soil loss and its effect on soil properties in sloping croplands of the Chinese Loess Plateau. Sci. Total Environ. 2018, 633, 1032–1040. [Google Scholar] [CrossRef]
- Wang, X.; Zhang, X.; Zhou, Q.; Xu, J.; Zhang, P.; Peng, B. Variation in Soil Erosion and Environment-human Interaction at the Center of Loess Plateau during “The Riots of Hui” at the Late Qing Dynasty. Sci. Geogr. Sin. 2022, 42, 303–313. [Google Scholar] [CrossRef]
- Zhu, Q.; Wang, N.; Liu, J.; Qi, X.; Cheng, X.; Du, F.; Cui, Q. Soil Water Erosion Changes and Driving Factors in Ecologically Fragile Areas in Northern Shaanxi Province. Res. Soil Water Conserv. 2023, 30, 41–51+60. [Google Scholar] [CrossRef]
- Ma, G.; Li, G.; Mu, X.; Hou, W.; Ren, Y.; Yang, M. Effect of raindrop splashes on topsoil structure and infiltration characteristics. Catena 2022, 212, 106040. [Google Scholar] [CrossRef]
- Xu, X.M.; Zheng, F.L.; Wu, M. Quantification study of rainfall intensity and slope gradient impacts on ephemeral gully morphological characteristic on steep loessial hillslope. Trans. Chin. Soc. Agric. Eng. 2017, 33, 124–132. [Google Scholar] [CrossRef]
- Li, Z.; Zhang, G.; Geng, R.; Wang, H. Spatial heterogeneity of soil detachment capacity by overland flow at a hillslope with ephemeral gullies on the Loess Plateau. Geomorphology 2015, 248, 264–272. [Google Scholar] [CrossRef]
- Sun, W.; Shao, Q.; Liu, J. Soil erosion and its response to the changes of precipitation and vegetation cover on the Loess Plateau. J. Geogr. Sci. 2013, 23, 1091–1106. [Google Scholar] [CrossRef]
- Gyssels, G.; Poesen, J.; Bochet, E.; Li, Y. Impact of plant roots on the resistance of soils to erosion by water: A review. Prog. Phys. Geogr. Earth Environ. 2005, 29, 189–217. [Google Scholar] [CrossRef]
- Wang, R.; Li, P.; Li, Z.; Yu, K.; Han, J.; Zhu, Y.; Su, Y. Effects of gully head height and soil texture on gully headcut erosion in the Loess Plateau of China. Catena 2021, 207, 105674. [Google Scholar] [CrossRef]
- Kariminejad, N.; Rossi, M.; Hosseinalizadeh, M.; Pourghasemi, H.R.; Santosh, M. Gully head modelling in Iranian Loess Plateau under different scenarios. Catena 2020, 194, 104769. [Google Scholar] [CrossRef]
- Li, C.C.; Zeng, Q.C.; Jia, P.L.; An, S.S. Characteristics of soil aggregate stability and corrosion resistance longitude change in the Loess Plateau. Acta Ecol. Sin. 2020, 40, 2039–2048. [Google Scholar] [CrossRef]
- Guo, M.M.; Wang, W.L.; Li, J.M.; Zhu, B.C.; Shi, Q.H.; Kang, H.L.; Li, Y.F.; Li, Y.L. Effect of tillage on runoff and sediment yields and morphology development characteristic of ephemeral gully in loessial region. Trans. Chin. Soc. Agric. Eng. 2015, 31, 114–123. [Google Scholar] [CrossRef]
- Torri, D.; Poesen, J. A review of topographic threshold conditions for gully head development in different environments. Earth-Sci. Rev. 2014, 130, 73–85. [Google Scholar] [CrossRef]
- Gong, J.G.; Jia, Y.W.; Zhou, Z.H.; Wang, Y.; Wang, W.L.; Peng, H. An experimental study on dynamic processes of ephemeral gully erosion in loess landscapes. Geomorphology 2011, 125, 203–213. [Google Scholar] [CrossRef]
- Tian, p.; Mao, M.; Pan, C. Research progress and prospect of vegetation control mechanism of soil and water loss. Sci. Soil Water Conserv. 2024, 22, 131–140. [Google Scholar] [CrossRef]
- Zhang, K.L.; Hosoyamada, K. Splash erosion process and its relation to slope gradient. Sci. Geogr. Sin. 1998, 18, 561–566. [Google Scholar] [CrossRef]
- Deng, L.; Liu, S.; Kim, D.G.; Peng, C.; Sweeney, S.; Shangguan, Z. Past and future carbon sequestration benefits of China’s grain for green program. Glob. Environ. Change 2017, 47, 13–20. [Google Scholar] [CrossRef]
- Xi, J.; Zhao, X.; Wang, X.; Zhang, Z. Assessing the impact of land use change on soil erosion on the Loess Plateau of China from the end of the 1980s to 2010. J. Soil Water Conserv. 2017, 72, 452–462. [Google Scholar] [CrossRef]
- Lan, X.; Liu, Z.; Yang, T.; Cheng, L.; Wang, X.; Wei, W.; Ge, Y.; Chen, X.; Lin, K.; Zhao, T.; et al. Land-Use Intensity Reversed the Role of Cropland in Ecological Restoration Over the World’s Most Severe Soil Erosion Region. Earth’s Future 2023, 11, e2022EF003388. [Google Scholar] [CrossRef]
- Pengfei, L.; Dou, L.; Jinfei, H.; Wanqiang, Y.; Yuzhe, Z. Assessing the ability of airborne LiDAR to monitor soil erosion on the Chinese Loess Plateau. Acta Geod. Cartogr. Sin. 2023, 52, 1342–1354. [Google Scholar] [CrossRef]
- Shruthi, R.B.V.; Kerle, N.; Jetten, V.; Stein, A. Object-based gully system prediction from medium resolution imagery using Random Forests. Geomorphology 2014, 216, 283–294. [Google Scholar] [CrossRef]
- Oleire-Oltmanns, S.; Marzolff, I.; Tiede, D.; Blaschke, T. Detection of Gully-Affected Areas by Applying Object-Based Image Analysis (OBIA) in the Region of Taroudannt, Morocco. Remote Sens. 2014, 6, 8287–8309. [Google Scholar] [CrossRef]
Figure 1.
Schematic diagram of the study area. (a) study area; (b) small watershed unit; (c) rectangular unit.
Figure 1.
Schematic diagram of the study area. (a) study area; (b) small watershed unit; (c) rectangular unit.

Figure 2.
Example of ephemeral gully interpretation.

Figure 3.
Overall methodology flowchart.

Figure 4.
The frequency of the relative error of ephemeral gully length. (a) Relative error of single EG. (b) Pareto Chart of the Relative Error in EGs Length.
Figure 4.
The frequency of the relative error of ephemeral gully length. (a) Relative error of single EG. (b) Pareto Chart of the Relative Error in EGs Length.

Figure 5.
Spatial distribution of ephemeral gully density.

Figure 6.
The formation of EGs is influenced by several main factors. (a) Spatial distribution of EGs with different rainfall. (b) The proportion of EG sample units within the sample units with different rainfall. (c) Spatial distribution of EGs with different slope gradient. (d) The proportion of EG sample units within the sample units with different slope gradient.

Figure 7.
Results of interaction detection of EGs formation driving factor.

Figure 8.
The density of EGs is influenced by several main factors. (a) Spatial distribution of EG density with different proportions of sloping farmland. (b) Relationship between the area proportion of slopping farmland and density of EGs. (c) Spatial distribution of EG density with different soil erodibility. (d) Relationship between soil erodibility and density of EGs.

Figure 9.
Results of interaction detection of EG density driving factor.


Table 1.
Introduction to base data.
| Data Name | Cell Size | Time | Source |
|---|---|---|---|
| Google Earth image | 0.25–0.49 m | 2015–2020 | https://google.cn/earth/ (accessed on 10 February 2020) |
| Shuttle Radar Topography Mission (STRM) | 30 m | 2014 | https://earthexplorer.usgs.gov/ (accessed on 6 June 2020) |
| Field Measured data | 2 cm | 2021 | GNSS RTK Field measured |
| Land use | 30 m | 2000 | http://www.resdc.cn (accessed on 20 October 2023) |
| Soil erodibility (K) | 30 m | 2011 | China National Soil and Water Conservation Census outcome datasets |
| Average multi-year rainfall (Rainfall) | 3 km | 1981–2019 | China Meteorological Administration |
| Normal Difference Vegetation Index (NDVI) | 30 m | 1990–2019 | Google earth engine |
Table 2.
Types of interaction between two covariates.
| Criterion | Interaction |
|---|---|
| q(X1∩X2) < min(q(X1), q(X2)) | Non-linear reduction |
| min(q(X1), q(X2)) < q(X1∩X2) < max(q(X1), q(X2)) | Single-factor non-linear reduction |
| q(X1∩X2) > max(q(X1), q(X2)) | Two-factor enhancement |
| q(X1∩X2) = q(X1) + q(X2) | Independence |
| q(X1∩X2) > q(X1) + q(X2) | Non-linear enhancement |
Table 3.
Wilcoxon signed-rank test comparison of visually interpreted lengths and actual measurements.
Table 3.
Wilcoxon signed-rank test comparison of visually interpreted lengths and actual measurements.
| Mean | Standard Deviation | Wilcoxon Signed-Rank Test | ||
|---|---|---|---|---|
| Standardized Test Statistic | Statistical Significance | |||
| MR | 23.730 | 16.514 | −0.943 | 0.346 |
| VIR | 23.420 | 15.583 | ||
α = 0.05; MR is measured results; VIR is visual interpretation results.
Table 4.
Analysis results of the formation of EGs factor detector.
| Rainfall | S | APSF | NDVI | Elevation | K | L | |
|---|---|---|---|---|---|---|---|
| q statistic | 0.173 | 0.168 | 0.115 | 0.078 | 0.063 | 0.057 | 0.005 |
Table 5.
Analysis results of the density of EGs factor detector.
| APSF | K | NDVI | L | S | Elevation | Rainfall | |
|---|---|---|---|---|---|---|---|
| q statistic | 0.363 | 0.362 | 0.115 | 0.078 | 0.063 | 0.057 | 0.005 |
Disclaimer/Publisher’s Note: The statements, opinions and data contained in all publications are solely those of the individual author(s) and contributor(s) and not of MDPI and/or the editor(s). MDPI and/or the editor(s) disclaim responsibility for any injury to people or property resulting from any ideas, methods, instructions or products referred to in the content. |
© 2024 by the authors. Licensee MDPI, Basel, Switzerland. This article is an open access article distributed under the terms and conditions of the Creative Commons Attribution (CC BY) license (https://creativecommons.org/licenses/by/4.0/).
Share and Cite
MDPI and ACS Style
Ma, L.; Wang, C.; Zhong, Y.; Pang, G.; Wang, L.; Long, Y.; Yang, Q.; Tang, B. Factors Influencing Ephemeral Gullies at the Regional Scale: Formation and Density. Land 2024, 13, 553. https://doi.org/10.3390/land13040553
AMA Style
Ma L, Wang C, Zhong Y, Pang G, Wang L, Long Y, Yang Q, Tang B. Factors Influencing Ephemeral Gullies at the Regional Scale: Formation and Density. Land. 2024; 13(4):553. https://doi.org/10.3390/land13040553
Chicago/Turabian StyleMa, Lei, Chunmei Wang, Yuan Zhong, Guowei Pang, Lei Wang, Yongqing Long, Qinke Yang, and Bingzhe Tang. 2024. "Factors Influencing Ephemeral Gullies at the Regional Scale: Formation and Density" Land 13, no. 4: 553. https://doi.org/10.3390/land13040553
Note that from the first issue of 2016, this journal uses article numbers instead of page numbers. See further details here.