
Spatiotemporal Pattern and Drivers of Ecological Quality in Inner Mongolia
by
Shouwei Li
1,2,3,
Shufeng Qu
1,2,4,
Guoming Zhang
1,2,5,*,
Yuantao Zhou
1,2,
Xuran Sun
1,2,4,
Jiaxue Li
1,2,3 and
Shanshan Zhang
1,2 1
Joint International Research Laboratory of Catastrophe Simulation and Systemic Risk Governance, Beijing Normal University, Zhuhai 519087, China
2
School of National Safety and Emergency Management, Beijing Normal University, Beijing 100875, China
3
School of Systems Science, Beijing Normal University, Beijing 100875, China
4
Faculty of Geographical Sciences, Beijing Normal University, Beijing 100875, China
5
Key Laboratory of Environmental Change and Natural Hazards, Ministry of Education, Beijing Normal University, Beijing 100875, China
*
Author to whom correspondence should be addressed.
Land 2024, 13(5), 568; https://doi.org/10.3390/land13050568
Submission received: 2 April 2024
/
Revised: 17 April 2024
/
Accepted: 22 April 2024
/
Published: 24 April 2024
Abstract
:With the escalating global climate change and frequent human activities, Inner Mongolia, as a crucial ecological barrier in the Beijing-Tianjin-Hebei region, Bohai Economic Rim, and even the whole country, confronts many ecosystem issues. To reveal the intricate interplay between natural processes, human activities, and policy interventions shaping the region’s ecological landscape, we provide a comprehensive analysis of ecological quality in Inner Mongolia from 2002 to 2021. Key findings include: (1) The research uncovers an overall improvement in ecological quality across Inner Mongolia, albeit with certain regions exhibiting a pattern of deterioration followed by improvement, particularly notable in the central part of the province. (2) Cropland, shrub, grassland, barren, wetland, and water are decreasing, while impervious, and forestland are increasing. (3) Precipitation, temperature, and elevation are significant drivers affecting the quality of the ecological environment. Interestingly, while human production and activities have altered ecological conditions, factors like GDP, population density, and night lighting index do not directly impact environmental quality significantly. This underscores the intricate interplay among various factors within the socioeconomic system, highlighting its complexity. (4) Based on these findings, our policy recommendations include strengthening ecological monitoring and management, promoting sustainable urban development, conducting public education and awareness campaigns, and fostering stakeholder collaboration for data sharing and collective understanding. Adopting sustainable management strategies is essential for promoting ecological resilience and mitigating environmental degradation in Inner Mongolia, not only benefiting the local ecosystem but also contributing to national and global environmental well-being.
1. Introduction
Currently, rapid urbanization, industrial expansion, and intensified agriculture have significantly contributed to various ecological issues, such as grassland degradation, soil erosion, and loss of biodiversity [1,2,3]. This pressure has exacerbated the ecological security challenges of natural processes and ecosystem cycles [4,5,6]. These formidable challenges present substantial impediments to achieving sustainable development [7,8].
Inner Mongolia, located in the “Three-North” region (northwest, north and northeast of China) and bordering Russia and Mongolia, plays a vital role as an ecological functional area [9], which serves as a crucial ecological barrier in the Beijing-Tianjin-Hebei region, Bohai Economic Rim, and even the whole country [10]. Additionally, it is recognized as a significant carbon sink and sand barrier for north China and the entire nation [11]. The quality of its ecological environment not only affects the survival and development of various ethnic groups in the region but also impacts the ecological security of north China, northeast China, northwest China, and the entire country [12]. However, with the escalating global climate change and frequent human activities, a range of ecosystem issues, including grassland desertification, soil erosion, and water and soil loss, have become increasingly prominent in certain areas [13,14,15]. The government has recognized these ecological challenges and has prompted the gradual implementation of protective measures since 1978. These initiatives include the Three-North Shelter Forest Program [16], and Ecological Red Lines et al. Among the measures, the Grain for Green Program (GGP), initiated in 1999, is the largest ecological restoration project in central and western China [17].
Research on the ecological environment of Inner Mongolia encompasses various aspects and employs diverse methodologies. These include monitoring and analyzing land use and land cover changes using remote sensing techniques such as satellite imagery [18]; studying vegetation cover changes through remote sensing data and ground surveys [19]; researching water resources and the water environment by monitoring rivers, lakes, and hydrological systems [20]; analyzing grassland ecosystems to assess biodiversity, vegetation cover, and degradation [11]; investigating desertification and desertification expansion using remote sensing and ground observations [21]; examining the impacts of climate change on the ecological environment [22]; assessing biodiversity conservation by surveying flora and fauna species [23]; and evaluating ecosystem services such as water conservation [24], soil retention [25], and climate regulation [26]. Although extensive research has been conducted, continuous long-term monitoring of ecological environment quality and research into driving factors remain imperative.
Traditional ecological quality monitoring approaches often focus on single ecological indicators, such as the Normalized Difference Vegetation Index (NDVI) [27,28], Enhanced Vegetation Index (EVI) [29], and Land Use/Land Cover Change (LUCC) [30]; these may not offer a comprehensive assessment of overall ecological conditions. Recognizing this limitation, the Remote Sensing Ecologic Index (RSEI) comprises four indicators: greenness (representing vegetation), moisture (representing soil moisture), heat (representing temperature), and dryness (representing built area) [31]. This index enables thorough monitoring of spatial and temporal changes in ecological quality, standing out as a vital conceptual model and weighting mechanism in the field of ecological vulnerability assessment. Its advantages lie in scalability, visualizability, and comparability across various spatial and temporal scales. Utilizing the RSEI for remote sensing-based ecological assessment and monitoring is instrumental in promptly understanding ecological conditions and analyzing ecological trends, thereby playing a significant role in advancing the goals of peak carbon emissions and carbon neutrality.
Inner Mongolia, as an ecological barrier in northern China, is of great significance to China’s ecological security, and research on ecological changes is conducive to the protection and management of the ecological environment in the region and the country. We used the ecological quality calculation by the RSEI, land use transition matrix, spatial auto-correlation and Geodetector to analyze the ecological quality of the study area. This study aims to dynamically monitor ecological quality in Inner Mongolia from 2002 to 2021. Four primary goals guide the study: (1) Analyze the ecological quality spatiotemporal patterns in Inner Mongolia from 2002 to 2021. (2) Identify the ecological quality spatiotemporal trends. (3) Reveal the underlying driving factors of ecosystem change in Inner Mongolia and elucidate the complex interplay between ecosystems and human activities. (4) By assessing ecosystem conditions, inform ecological management, environmental protection, and sustainable development policy decisions. The results are expected to provide valuable data for mitigating ecological degradation and enhancing resilience to environmental changes in Inner Mongolia.
2. Study Area and Data Sources
2.1. Study Area
Inner Mongolia, spanning from 97°12′ E to 126°04′ E longitude and 37°24′ N to 53°23′ N latitude, holds the distinction of being China’s province with the widest longitudinal span. Situated in northern China, it shares borders with Heilongjiang, Jilin, Liaoning, and Hebei to the northeast, Shanxi, Shaanxi, and Ningxia to the south, and Gansu to the southwest, with Russia and Mongolia to the north. Administratively, it comprises 12 prefecture-level administrative regions with a total area of 1.183 million square kilometers, including Alxa League, BayanNur, Wuhai, Ordos, Baotou, Hohhot, Ulanqab, Xilingol League, Chifeng, Tongliao, Hinggan League, and Hulunbuir (Figure 1). As of the end of 2022, the resident population was 24,011,700. The terrain of Inner Mongolia extends obliquely from northeast to southwest in a long and narrow shape, characterized by a predominantly temperate continental climate with distinct arid and semi-arid features. Land use types in the area are dominated by forest, grassland, and barren areas, with the vegetation landscape transitioning from east to west, exhibiting characteristics of forests, meadow grasslands, grasslands, desert grasslands, and desert regions. Inner Mongolia’s economy is primarily driven by agriculture, mining, and energy resources. The region is renowned for its extensive grasslands, which support large-scale animal husbandry. Additionally, Inner Mongolia possesses abundant deposits of coal, rare earth minerals, and other resources, contributing significantly to its status as a major energy and mining hub.
2.2. Data Sources and Pre-Processing
In this study, RSEI was constructed using MODIS data. Specifically, we utilized three data products: MOD09A1 (500 m), MOD11A2 (500 m), and MOD13A1 (500 m), which were released by the United States Geological Survey (USGS) covering the period from 2002 to 2021. These MODIS data products were accessed from the public data archive of the Google Earth Engine (GEE) platform (https://developers.google.com/earth-engine/datasets, accessed on 1 June 2023).
We selected natural and socioeconomic factors to explore their impacts on ecological quality [32,33,34]. The natural and socioeconomic data were obtained from the National Tibetan Plateau Data Center (http://data.tpdc.ac.cn/, accessed on 15 February 2024) and the Resource and Environment Science and Data Center (https://www.resdc.cn/, accessed on 15 February 2024) (Table 1).
The data underwent pre-processing steps including cloud removal, and water body masking. Inner Mongolia was selected as the invariant target area for performing mutual correction, saturation correction, and continuity correction on the original images.
3. Methods
We selected four methods, based on the specific characteristics and the research needs of Inner Mongolia. We used the ecological quality calculation by the RSEI, land use transition matrix, spatial auto-correlation and Geodetector to analyze the ecological quality of the study area. (1) The ecological quality calculation by the RSEI provides a systematic approach to assess the ecological quality and a quantitative framework to evaluate and monitor changes over time, considering factors such as NDVI (the Normalized Difference Vegetation Index), WET (the Wetness Index), LST (the Heat Index), and NDBSI (the Normalized Difference Built-up Index). (2) The land use transition matrix analyzes and visualizes the patterns and trends of land use changes over time. By examining transitions between different land use categories, we can identify areas of ecological concern and inform land management accordingly. (3) Spatial auto-correlation is employed to explore spatial patterns and dependencies within ecological data, understanding spatial autocorrelation can help identify spatial clusters or hotspots of ecological degradation or resilience. (4) Geodetector is used to identify the key determinants behind spatial patterns or changes in ecological conditions. Ecological dynamics are influenced by a complex interplay of natural processes, human activities, and socioeconomic factors.
3.1. Ecological Quality Calculation by the RSEI
RSEI (Table 2) is a comprehensive assessment method that integrates information closely related to ecological quality and can be directly perceived by human beings [41,42]. The four elements of RSEI (NDVI, WET, LST, and NDBSI) are the main factors influencing human perception of the ecological system status [43,44], which can intuitively reflect the degree of improvement or degradation of the ecological formulas [33].
The indicators listed above were coupled by principal component analysis (PCA), and by using the Google Earth engine platform; the first principal component (PC1) was used to build the RSEI0 (Formula (1)). Selecting PC1 aids in avoiding subjective weighting bias during the calculation process. The weights for each indicator were determined by their contributions to each principal component, and to eliminate the influence of dimensions, a min-max normalization method was employed to standardize the four component indicators into the range [0,1] (Formula (2)).
Typically, PC1 accounts for over 70% of the total variance in the dataset [39,40]. The contributions of eigenvalues for PC1 all exceeded 88%, which is significantly higher than the other three principal components (Table 3).
RSEI values closer to 1 represent good ecological quality, allowing the RSEI to be divided into five levels, each with a 0.2 increment: Poor (0~0.2), Fair (0.2~0.4), Moderate (0.4~0.6), Good (0.6~0.8), and Excellent (0.8~1). The final RSEI level represents the ecological status of the study area [31,45].
3.2. Land Use Transition Matrix
The land use transition matrix reflects the direction and quantity of changes in various land use types in the study area over a specific period [46].
where S is the area, n is the number of land use types, i represents the land use type in 2002, j represents the land use type in 2021.
3.3. Spatial Auto-Correlation
The first law of geography is that geographical phenomena or attributes are mutually correlated in spatial distribution [47]. Spatial auto-correlation analysis examines the degree of correlation between a feature and its neighboring spatial features. It is also capable of analyzing the spatial heterogeneity distribution of ecological environment quality. Global spatial auto-correlation reflects the correlation of attribute values for all spatial phenomena within the entire study area, while local spatial auto-correlation reflects the correlation between attribute values for each spatial unit within the study area.
In Formulas (4) and (5), I represents the global Moran’s I index, where I [−1,1]. When I > 0, it indicates a positive correlation, and the closer I is to 1, the stronger the clustering effect of a certain attribute of the research object in space. When I < 0, it indicates a negative correlation, and the closer I is to −1, the stronger the dispersion effect of a certain attribute of the research object in space. I’ represents the local Moran’s I index, which categorizes spatial features into five types of local spatial clusters: high-high, low-low, low-high, high-low, and no significant difference [48].
3.4. Geodetector
The second law of geography asserts that geographical phenomena exhibit spatial heterogeneity, and Geodetector can detect spatial variations and analyze driving mechanisms [49].
In Formula (6), q represents the influence of Inner Mongolia’s ecological environment quality, where q is [0, 1]. The value of the q positively correlates with the extent of impact the factor exerts on ecological quality. N is the total number of samples, Nh is the number of classified samples, is the total sample variance, is the classified sample variance, and L is the number of the impact factors.
4. Results
4.1. Ecological Quality Visualization by RSEI
Figure 2a,b displays the temporal evolution of several key indicators, spanning the years 2002 to 2020. LST registered its lowest value in 2009 at −0.66 and reached its peak in 2011 at −0.45, showcasing a relatively stable fluctuation pattern. NDBSI experienced its lowest point in 2005 at −0.46, followed by a peak in 2010 at −0.12, suggesting a fluctuating yet predominantly upward trajectory. NDVI hit minimum in 2009 at 0.59 and reached its peak in 2010 at 0.78, while WET attained its lowest point in 2009 at 0.25 and peaked in 2003 at 0.37. RSEI exhibited a discernible upward trend over this period (Figure 2c), indicating an overall improvement in the ecological condition. The average RSEI value reached its pinnacle in 2005 at 0.421 and descended to its lowest point in 2007 at 0.229. A linear regression analysis yielded the equation y = 0.0048x + 0.2989, with an R-squared value of 0.2201.
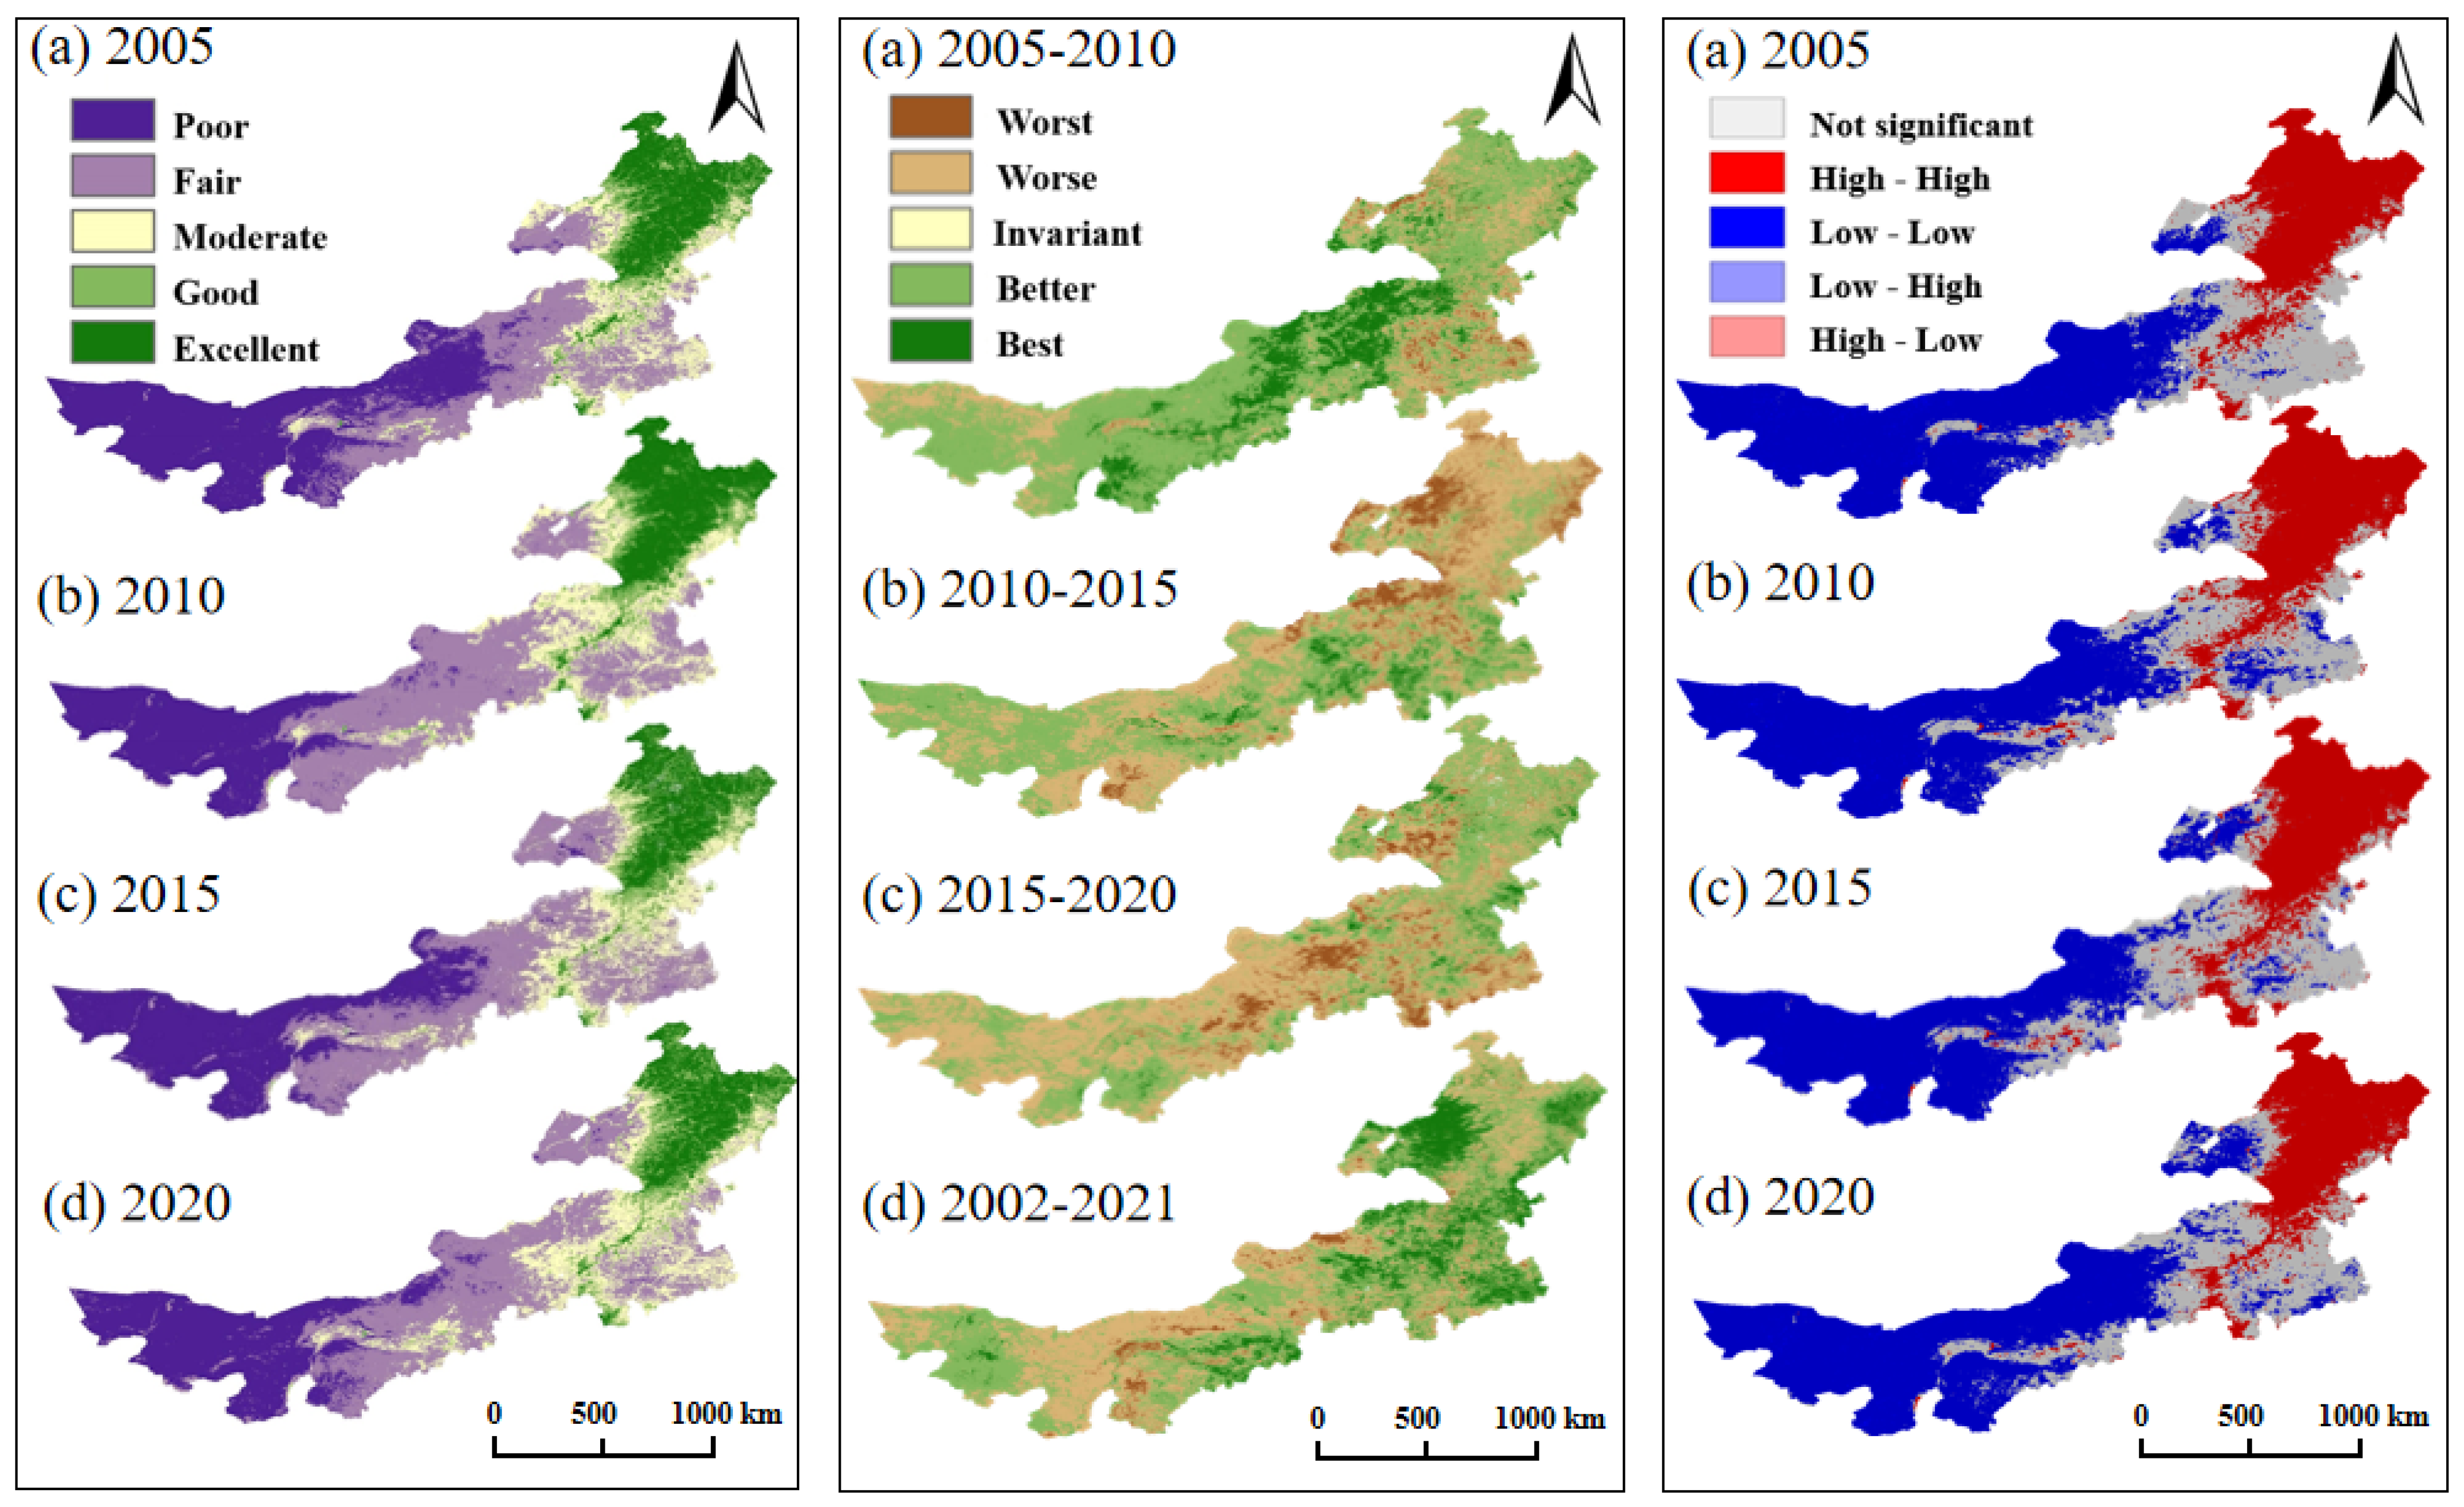
Figure 3 (Left) shows the spatial distribution of RSEI in Inner Mongolia, reflecting the changes in ecological quality from 2002 to 2021. Overall, the eastern part of Inner Mongolia showed Excellent, Good, and Medium levels of ecological quality, the central region exhibited relatively Fair and Poor levels of ecological quality, and the western region showed Poor levels of ecological quality. The findings indicate that the RSEI varied between 0 and 1 during the period from 2002 to 2021. This extreme diversity is primarily attributed to the diverse terrain of the Inner Mongolia Autonomous Region. The RSEI generally tended to be higher than 0.63 in forested or densely vegetated areas, around 0.24 in desert regions and dropped as low as 0.18 in areas with severe soil erosion [31]. These results align with the actual ecological quality situation in Inner Mongolia. Of particular concern is the trend observed in the central part of Inner Mongolia, including Baotou, Ulanqab, and most areas of Xilingol League, where the ecological quality level was rated as Poor in 2005, improved to Fair in 2010, but regressed to Poor again in 2015, and improved to Fair in 2020. This suggests a pattern of deterioration followed by improvement in the ecological quality of these regions. The areas serve as a transitional zone for Inner Mongolia’s ecological environment and as a corridor between the Mongolian dust and the North China Plain. The changes in ecological quality in this region have a crucial impact on the ecological quality of Inner Mongolia and the Beijing-Tianjin-Hebei region.
The analysis of the temporal and spatial changes in the RSEI provides a more intuitive comparison of the variations in ecological quality. Figure 3 (Middle) shows the dynamic changes in ecological quality in Inner Mongolia by calculating the transformation of RSEI for different years. Between 2005 and 2010, the overall ecological quality in Inner Mongolia showed a significant improvement trend. Xilingol League demonstrated the most notable improvement, reaching the Best level of ecological quality. Most areas of Ulanqab, Baotou, Ordos, and Hohhot showed Better and Best levels, indicating a positive trend in ecological quality. However, some areas of Tongliao exhibited a Worse level. From 2010 to 2015, the ecological quality in Alxa League improved to a Better level, while the western part of Hulunbuir experienced deterioration, reaching Worse and Worst levels, particularly near Hulun Lake and the Hailar River in parts of Hinggan League and the western regions of Xilingol League. Between 2015 and 2020, most areas of Hulunbuir saw an improvement in ecological quality, while areas in Baotou, Ulanqab, Xilingol, and Tongliao experienced deterioration. Compared to 2002, the overall ecological quality in Inner Mongolia exhibited an improving trend by 2021.
4.2. Spatial Autocorrelation Analysis of Ecological Quality
To investigate the spatial correlation and distribution characteristics of ecological quality in Inner Mongolia, global spatial autocorrelation and local spatial autocorrelation analyses were conducted on the RSEI. The global Moran’s I indices for each year, supported by significance tests (p-value ≤ 0.01 and Z-value ≥ 2.58), indicate the statistical significance of this spatial autocorrelation. Results indicate that Moran’s I value for 2005, 2010, 2015, and 2020 showed minimal interannual variation, hovering around 0.98 (Table 4). The global Moran’s I indices, hovering close to 1 each year, signify a high level of positive spatial correlation, suggesting a distinct clustering pattern in the spatial distribution of ecological quality, and the neighboring regions demonstrate a high degree of similarity in their ecological quality values.
Figure 3 (Right) reveals that the local spatial autocorrelation in Inner Mongolia is primarily characterized by two types: High-High Cluster and Low-Low Cluster. The High-High Cluster type is mainly concentrated in the northeast, covering areas such as Hulunbuir and Hinggan League, indicating significantly good ecological quality. On the other hand, the Low-Low Cluster type is predominantly distributed in the southwest, including regions like Alxa League, BayanNur, Ordos, Hohhot, Ulanqab, and Xilingol League. The local spatial autocorrelation analysis in the transitional zone between the High-High and Low-Low Cluster types does not show significant results. Comparing the local spatial autocorrelation in Xilingol League to that of 2005, the area of Low-Low Cluster types in 2020 has decreased, indicating an overall improvement in ecological quality in this region.
4.3. Ecological Quality Visualization by Land Use Transformation
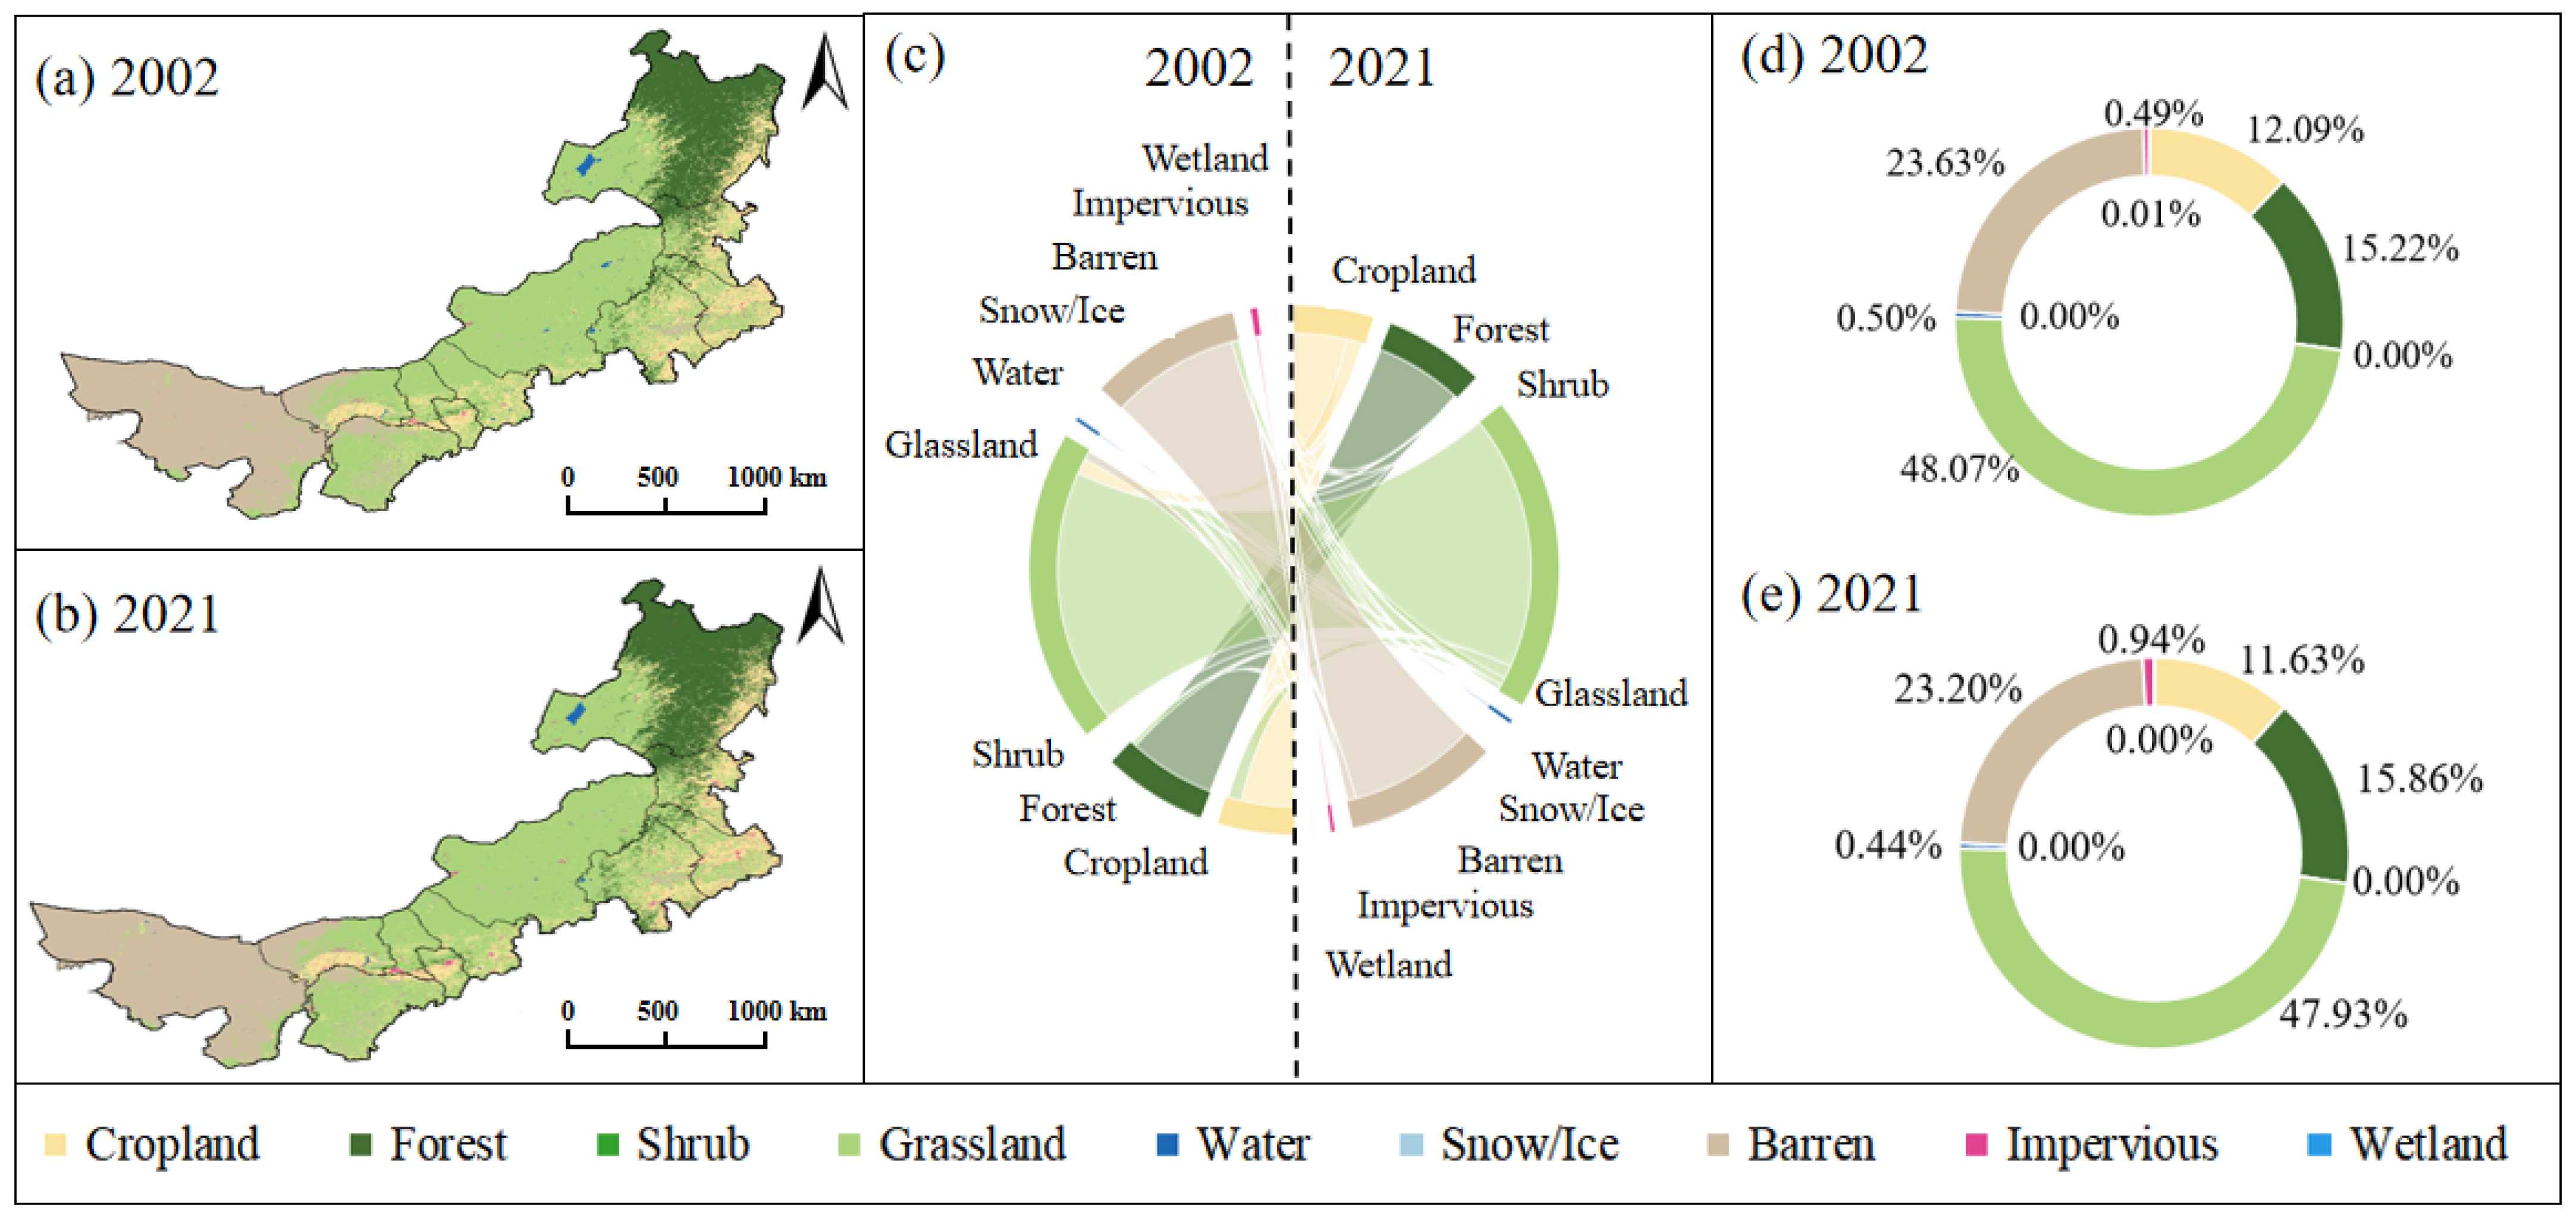
The main types of land use in Inner Mongolia include forest, grassland, barren, and cropland et al. (Figure 4). Land use changes are presented over the period from 2002 to 2021 (Figure 4c). From 2002 to 2021, the undergoing changes area of land use types amounted to 11,917,278 ha, accounting for 10.07% of the total area. The remaining 89.93% (106,382,719.2 ha) did not experience changes in land use types, indicating a substantial shift in land use. Inner Mongolia experienced a decrease in land areas for cropland, shrub, grassland, barren, wetland, and water, with reductions of 561,937.46 ha (0.47%), 2043.40 ha (0.00%), 209,559.43 ha (0.14%), 526,156.56 ha (0.43%), 4062.51 ha (0.00%), and 62,496.87 ha (0.05%), respectively. Conversely, there were increases in land areas for impervious, forest, and snow/ice, with increments of 528,098.94 ha (0.45%), 741,713.75 ha (0.64%), and 193.94 ha (0.00%), respectively.
4.4. Natural and Socioeconomic Impact Factors of Ecological Quality
According to the geographical exploration of data in different years, it is obvious that the factors X1, X2, and X3 show significant influence (Table 5), their influence has been consistent for many years, and their p value shows statistical significance (p < 0.05). By contrast, factors X4, X5, and X6 did not show statistical significance in the years analyzed. Therefore, they probably did not play a statistically significant role in the observed results. These findings emphasize the importance of natural factors in the ecological environment of Inner Mongolia.
Figure 5 illustrates the interaction among six factors. In this figure, X1 indicates altitude, X2 precipitation, X3 temperature, X4 GDP, X5 population density, and X6 nighttime light intensity. The interaction between factors is enriched, displaying nonlinearity or bimodality. Notably, the interactions X1∩X2, X1∩X3, and X2∩X3 are particularly significant. This suggests that, for Inner Mongolia as a whole, the interaction among natural factors is particularly strong. The reason why this socioeconomic factor is not obvious is probably that Inner Mongolia has a vast geographical area. The population is sparse, and the human activity area is relatively small.
5. Discussion
From 2002 to 2021, the average values of RSEI in Inner Mongolia showed an overall increasing trend. In general, ecological quality has been gradually improving over the past two decades, and this is in line with findings reported by Zhang et al. [50]. However, we found a trend of deterioration followed by improvement in the central part of Inner Mongolia, including Baotou, Ulanqab, and most areas of the Xilingol League, warranting significant attention. In Ji et al.‘s study “Spatiotemporal Monitoring of a Grassland Ecosystem and Its Net Primary Production Using Google Earth Engine: A Case Study of Inner Mongolia from 2000 to 2020,” the authors also found that, for the period 2000–2010, 43.91% of the grassland showed an insignificant decreasing trend for NPP, which primarily occurred in Baotou, Ulanqab, southwest Xilingol, and along both sides of the Greater Khingan Range [51]. These areas serve as a transitional zone for Inner Mongolia’s ecological environment and as a corridor between the Mongolian dust and the North China Plain. The changes in ecological quality in this region have a crucial impact on Inner Mongolia and the Beijing-Tianjin-Hebei region.
Inner Mongolia has experienced a transition from accelerating to slowing expansion of artificial construction land, and the forest area continues to increase, leading to an overall improvement in ecological quality, which is consistent with the findings of Wang et al. [52]. These changes can be attributed to natural and human factors, and many published studies have confirmed this. Firstly, rapid urbanization and industrialization have likely contributed to the increase in impervious surfaces, such as roads, buildings, and other infrastructure, leading to a decrease in cropland and grassland areas [44]. Human activities such as land conversion for agriculture, mining, and infrastructure development have also played a significant role in shaping land use patterns [53]. The decrease in grassland and barren areas may be attributed to overgrazing, land degradation, and desertification processes, exacerbated by unsustainable land management practices [54]. Additionally, government policies promoting afforestation and reforestation efforts may have resulted in the expansion of forested areas, as seen in the significant increase in forested land [9]. Climatic factors such as changes in precipitation patterns and temperature variations may also have influenced the distribution of land cover types. For this reason, we detected the driving factors in Inner Mongolia.
The geographical detector analysis identified that natural factors exert a significant influence on the overall ecological environment in Inner Mongolia. Variables such as precipitation, temperature, and elevation were found to be key drivers. This is consistent with the research results of Wang et al. [55]. However, the direct correlation between ecological quality and socioeconomic factors is not statistically significant. GDP, population density and nighttime light did not show a directly spatial correlation in the analyses. They are all simply indicators of socioeconomic activity or location of human activity. These are either very concentrated in settlements or statistical values covering administrative units. This phenomenon can be attributed to the vastness of Inner Mongolia, its sparse population, and the presence of many uninhabited areas. On the other hand, elevation, precipitation and temperature indirectly feed components of the RSEI index. Consequently, natural factors take precedence and play a dominant role in shaping the ecological landscape. Overall, the complex interplay of socioeconomic, environmental, and climatic factors has driven the ecological changes in Inner Mongolia.
The land management and restoration activities implemented in Inner Mongolia, including the Three-North Shelter Forest Program, GGP, and Ecological Red Lines, among others, have had significant impacts on the drivers of ecological change over the last 20 years. These programs have directly influenced land cover and land use patterns in Inner Mongolia. Three-North Shelter Forest Program and GGP have led to an expansion of forested areas. These large-scale afforestation efforts have contributed to the overall improvement in ecological quality by increasing vegetation cover and enhancing ecosystem aspects such as soil conservation and carbon sequestration. Additionally, the improvement of Inner Mongolia’s ecological quality is closely related to the implementation of relevant environmental policies over the past 20 years, such as the delineation of ecological protection red lines, among others. This improvement is also reflected in various aspects of soil and water conservation, as well as dust storm control measures.
The innovation of this study lies in the historical dynamic monitoring and spatiotemporal change analysis of the ecological quality in Inner Mongolia based on the GEE cloud platform, through economic quality calculation by the RSEI and spatial auto-correlation; the main driving factors of the ecological quality in Inner Mongolia have been explored through the land use transition matrix and Geodetector. In research on ecological quality, many studies have utilized RSEI [45] and Geodetector [33,56] for their analyses. However, relying solely on one method may not provide a comprehensive understanding. Therefore, we employed four different methods to complement each other in our analysis. The advantage of this analysis is that economic quality calculation by the RSEI and spatial auto-correlation can mutually confirm the research results of ecological quality in Inner Mongolia, and then obtain a more comprehensive understanding of the ecological environment situation in Inner Mongolia. Similarly, the two methods of the land use transition matrix and Geodetector can mutually confirm the main driving factors of ecological quality in Inner Mongolia. However, the drawback of using these four methods is that the ecosystem is a complex and diverse system, and its influencing factors involve many aspects, including not only the six factors of natural and socioeconomic development and LUCC that we chose, but also the organization and management ability of the government. Therefore, our future research will use more diverse spatial data, such as GPP and NPP, to further analyze the impact of the interaction between human activities and natural factors on the ecological environment.
6. Conclusions and Recommendations
6.1. Conclusions
We analyzed and identified the ecological quality spatiotemporal patterns and trends in Inner Mongolia from 2002 to 2021. Our findings reveal an overall improvement in ecological quality, although certain regions exhibit a pattern of deterioration followed by improvement, which is particularly notable in the central part of the province. Furthermore, the changes in land use types, driven by both natural forces and human activities, are evident. There has been a decrease in areas such as cropland, shrub, grassland, barren, wetland, and water, while areas such as impervious, forestland, and snow/ice have increased. The dynamic changes observed in ecological quality over the years reveal distinct clustering patterns in ecological quality distribution. Areas of significantly good and poor ecological quality are concentrated in different regions, reflecting the spatial heterogeneity inherent in Inner Mongolia’s landscape. The results indicate that natural factors, including precipitation, temperature, and elevation, play a dominant role in shaping Inner Mongolia’s ecological environment. Their consistent and statistically significant influence over time emphasizes the importance of a comprehensive understanding and management of these natural processes.
Our findings underscore the importance of both natural direct driving factors and socioeconomic indirect driving factors in shaping ecosystem change in Inner Mongolia, highlighting the necessity for adaptive management strategies. Among these, sustainable management and organization of human activities emerge as crucial factors for promoting ecological resilience and mitigating environmental degradation in the region. Specifically, while human activities act as indirect influencing factors, their impact on the ecosystem still requires organized and managed interventions to ensure long-term sustainability and the preservation of ecosystem health.
6.2. Recommendations
Continued research into the multifaceted interactions between natural processes, human activities, and policy interventions, monitoring, and adaptive management is crucial for guiding informed decision-making and fostering sustainable development in the region. Based on the above research, we put forward the following policy suggestions.
First, ecological monitoring and management should be strengthened. Positive explorations have been made with regard to the monitoring and value accounting mechanism for ecological products, the market trading system, and the mechanism for guaranteeing the realization of value. Pilot mechanisms for realizing the value of ecological products have been carried out in Alxa League, Xilingol League, Hinggan League, Ordos, and Hulunbuir.
Secondly, publicity campaigns and education programs have been carried out to actively promote education on ecological civilization. Most of Inner Mongolia is in arid and semi-arid zones, with fragile and unstable ecosystems, and the threat of soil erosion and land sanding still exists. There is a need to enhance people’s awareness of conservation, environmental protection and ecology, and to advocate for the common protection of the environment.
Finally, we recommend promoting cooperative research among government agencies, research institutions and environmental protection organizations. Data sharing, resource integration, and intelligent supervision should be strengthened, and we should strive to improve the refinement and precision of land space governance and control, and make every effort to build an all-area ecological security pattern that encompasses grasslands, forests, rivers, lakes, wetlands, deserts, and sandy areas.
This comprehensive strategy is not only critical to the preservation of Inner Mongolia’s ecological balance, but also has wide-ranging implications for the environmental well-being of the nation and the world.
Author Contributions
Conceptualization, S.L.; methodology, S.L.; software, S.Q.; validation, X.S. and J.L.; writing—original draft preparation, S.L.; writing—review and editing, S.L., Y.Z. and S.Z.; visualization, S.L. and S.Q.; funding acquisition, G.Z. All authors have read and agreed to the published version of the manuscript.
Funding
This research was funded by the National Natural Science Foundation of China, grant number 41971120.
Data Availability Statement
Data is contained within the article.
Conflicts of Interest
The authors declare no conflicts of interest.
References
- Gauquelin, T.; Michon, G.; Joffre, R.; Duponnois, R.; Génin, D.; Fady, B.; Bou Dagher-Kharrat, M.; Derridj, A.; Slimani, S.; Badri, W.; et al. Mediterranean Forests, Land Use and Climate Change: A Social-Ecological Perspective. Reg. Environ. Chang. 2018, 18, 623–636. [Google Scholar] [CrossRef]
- Wang, C.; Wang, Q.; Liu, N.; Sun, Y.; Guo, H.; Song, X. The Impact of LUCC on the Spatial Pattern of Ecological Network during Urbanization: A Case Study of Jinan City. Ecol. Indic. 2023, 155, 111004. [Google Scholar] [CrossRef]
- Zhang, R.; Tian, D.; Wang, J.; Niu, S. Critical Role of Multidimensional Biodiversity in Contributing to Ecosystem Sustainability under Global Change. Geogr. Sustain. 2023, 4, 232–243. [Google Scholar] [CrossRef]
- Madin, E.M.P.; Dill, L.M.; Ridlon, A.D.; Heithaus, M.R.; Warner, R.R. Human Activities Change Marine Ecosystems by Altering Predation Risk. Glob. Chang. Biol. 2016, 22, 44–60. [Google Scholar] [CrossRef] [PubMed]
- Cramer, W.; Bondeau, A.; Woodward, F.I.; Prentice, I.C.; Betts, R.A.; Brovkin, V.; Cox, P.M.; Fisher, V.; Foley, J.A.; Friend, A.D.; et al. Global Response of Terrestrial Ecosystem Structure and Function to CO2 and Climate Change: Results from Six Dynamic Global Vegetation Models. Glob. Chang. Biol. 2001, 7, 357–373. [Google Scholar] [CrossRef]
- Nguyen, K.A.; Liou, Y.A. Mapping Global Eco-Environment Vulnerability Due to Human and Nature Disturbances. MethodsX 2019, 6, 862–875. [Google Scholar] [CrossRef] [PubMed]
- Montgomery, D.R. Soil Erosion and Agricultural Sustainability. Proc. Natl. Acad. Sci. USA 2007, 104, 13268–13272. [Google Scholar] [CrossRef] [PubMed]
- Balvanera, P.; Siddique, I.; Dee, L.; Paquette, A.; Isbell, F.; Gonzalez, A.; Byrnes, J.; O’Connor, M.I.; Hungate, B.A.; Griffin, J.N. Linking Biodiversity and Ecosystem Services: Current Uncertainties and the Necessary next Steps. Bioscience 2014, 64, 49–57. [Google Scholar] [CrossRef]
- Qiu, J.; Huang, T.; Yu, D. Evaluation and Optimization of Ecosystem Services under Different Land Use Scenarios in a Semiarid Landscape Mosaic. Ecol. Indic. 2022, 135, 108516. [Google Scholar] [CrossRef]
- Fang, Y.; Meng, F.; Luo, M.; Sa, C.; Lei, J.; Bao, Y.; Chao, L. Disentangling the Natural and Anthropogenic Contributions to the Balance of Ecosystem Services in the Beijing-Tianjin-Hebei-Inner Mongolia Region. Ecol. Indic. 2024, 158, 111372. [Google Scholar] [CrossRef]
- Li, T.; Zhang, Q.; Wang, G.; Singh, V.P.; Zhao, J.; Sun, S.; Wang, D.; Liu, T.; Duan, L. Ecological Degradation in the Inner Mongolia Reach of the Yellow River Basin, China: Spatiotemporal Patterns and Driving Factors. Ecol. Indic. 2023, 154, 110498. [Google Scholar] [CrossRef]
- Tian, Y. Issues and Systematic Governance Strategies Facing the Construction of China’s Important Ecological Security Barrier in the North. Inn. Mong. Soc. Sci. 2023, 44, 43–49+213. [Google Scholar] [CrossRef]
- Sun, G.; Wang, M. Study on Relation and Distribution Between Vegetative Coverage and Land Degradation in Inner Mongolia. J. Arid Land Resour. Environ. 2008, 22, 5. [Google Scholar]
- Jia, Z.; Zhang, Z.; Cheng, Y.; Buhebaoyin; Borjigin, S.; Quan, Z. Grassland Biomass Spatiotemporal Patterns and Response to Climate Change in Eastern Inner Mongolia Based on XGBoost Model Estimates. Ecol. Indic. 2024, 158, 111554. [Google Scholar] [CrossRef]
- Zhao, Y.; Yang, S.; Liu, L.; Jia, X.; Han, L.; Yuan, X.; Zhao, M.; Zhang, P. Variations and Driving Mechanisms of Desertification in the Southeast Section of the China-Mongolia-Russia Economic Zone. Sci. Total Environ. 2023, 887, 164004. [Google Scholar] [CrossRef] [PubMed]
- Qiu, B.; Chen, G.; Tang, Z.; Lu, D.; Wang, Z.; Chen, C. Assessing the Three-North Shelter Forest Program in China by a Novel Framework for Characterizing Vegetation Changes. ISPRS J. Photogramm. Remote Sens. 2017, 133, 75–88. [Google Scholar] [CrossRef]
- Song, X.; Peng, C.; Zhou, G.; Jiang, H.; Wang, W. Chinese Grain for Green Program Led to Highly Increased Soil Organic Carbon Levels: A Meta-Analysis. Sci. Rep. 2014, 4, 4460. [Google Scholar] [CrossRef] [PubMed]
- Yin, H.; Pflugmacher, D.; Li, A.; Li, Z.; Hostert, P. Land Use and Land Cover Change in Inner Mongolia—Understanding the Effects of China’s Re-Vegetation Programs. Remote Sens. Environ. 2018, 204, 918–930. [Google Scholar] [CrossRef]
- Li, Z.; Bagan, H.; Yamagata, Y. Analysis of Spatiotemporal Land Cover Changes in Inner Mongolia Using Self-Organizing Map Neural Network and Grid Cells Method. Sci. Total Environ. 2018, 636, 1180–1191. [Google Scholar] [CrossRef]
- Xu, Y.; Gun, Z.; Zhao, J.; Cheng, X. Variations in Lake Water Storage over Inner Mongolia during Recent Three Decades Based on Multi-Mission Satellites. J. Hydrol. 2022, 609, 127719. [Google Scholar] [CrossRef]
- Zhang, Z.; Huisingh, D. Combating Desertification in China: Monitoring, Control, Management and Revegetation. J. Clean. Prod. 2018, 182, 765–775. [Google Scholar] [CrossRef]
- Su, R.; Yu, T.; Dayananda, B.; Bu, R.; Su, J.; Fan, Q. Impact of Climate Change on Primary Production of Inner Mongolian Grasslands. Glob. Ecol. Conserv. 2020, 22, e00928. [Google Scholar] [CrossRef]
- Suuri, B.; Baatargal, O.; Badamdorj, B.; Reading, R.P. Assessing Wildlife Biodiversity Using Camera Trap Data on the Mongolian Marmot (Marmota Sibirica) Colonies. J. Arid Environ. 2021, 188, 104409. [Google Scholar] [CrossRef]
- Liu, Y.; Du, J.; Ding, B.; Liu, Y.; Liu, W.; Xia, A.; Huo, R.; Ran, Q.; Hao, Y.; Cui, X.; et al. Water Resource Conservation Promotes Synergy between Economy and Environment in China’s Northern Drylands. Front. Environ. Sci. Eng. 2022, 16, 28. [Google Scholar] [CrossRef]
- Gao, Z.; Hu, X.; Li, X.Y. Changes in Soil Water Retention and Content during Shrub Encroachment Process in Inner Mongolia, Northern China. Catena 2021, 206, 105528. [Google Scholar] [CrossRef]
- Bai, X.; Zhao, W.; Wang, J.; Ferreira, C.S.S. Precipitation Drives the Floristic Composition and Diversity of Temperate Grasslands in China. Glob. Ecol. Conserv. 2021, 32, e01933. [Google Scholar] [CrossRef]
- Yuan, B.; Fu, L.; Zou, Y.; Zhang, S.; Chen, X.; Li, F.; Deng, Z.; Xie, Y. Spatiotemporal Change Detection of Ecological Quality and the Associated Affecting Factors in Dongting Lake Basin, Based on RSEI. J. Clean. Prod. 2021, 302, 126995. [Google Scholar] [CrossRef]
- Xu, B.; Qi, B.; Ji, K.; Liu, Z.; Deng, L.; Jiang, L. Emerging Hot Spot Analysis and the Spatial–Temporal Trends of NDVI in the Jing River Basin of China. Environ. Earth Sci. 2022, 81, 55. [Google Scholar] [CrossRef]
- Zhang, J.; Feng, L.; Yao, F. Improved Maize Cultivated Area Estimation over a Large Scale Combining MODIS-EVI Time Series Data and Crop Phenological Information. ISPRS J. Photogramm. Remote Sens. 2014, 94, 102–113. [Google Scholar] [CrossRef]
- Chen, X.; Yu, L.; Du, Z.; Xu, Y.; Zhao, J.; Zhao, H.; Zhang, G.; Peng, D.; Gong, P. Distribution of Ecological Restoration Projects Associated with Land Use and Land Cover Change in China and Their Ecological Impacts. Sci. Total Environ. 2022, 825, 153938. [Google Scholar] [CrossRef]
- Xu, H.; Wang, Y.; Guan, H.; Shi, T.; Hu, X. Detecting Ecological Changes with a Remote Sensing Based Ecological Index (RSEI) Produced Time Series and Change Vector Analysis. Remote Sens. 2019, 11, 2345. [Google Scholar] [CrossRef]
- An, M.; Xie, P.; He, W.; Wang, B.; Huang, J.; Khanal, R. Spatiotemporal Change of Ecologic Environment Quality and Human Interaction Factors in Three Gorges Ecologic Economic Corridor, Based on RSEI. Ecol. Indic. 2022, 141, 109090. [Google Scholar] [CrossRef]
- Gong, C.; Lyu, F.; Wang, Y. Spatiotemporal Change and Drivers of Ecosystem Quality in the Loess Plateau Based on RSEI: A Case Study of Shanxi, China. Ecol. Indic. 2023, 155, 111060. [Google Scholar] [CrossRef]
- Huang, H.; Chen, W.; Zhang, Y.; Qiao, L.; Du, Y. Analysis of Ecological Quality in Lhasa Metropolitan Area during 1990–2017 Based on Remote Sensing and Google Earth Engine Platform. J. Geogr. Sci. 2021, 31, 265–280. [Google Scholar] [CrossRef]
- Peng, S. 1-km Monthly Mean Temperature Dataset for China (1901–2022); National Tibetan Plateau/Third Pole Environment Data Center: Golmud City, China, 2019. [Google Scholar] [CrossRef]
- Peng, S. 1-km Monthly Precipitation Dataset for China (1901–2022); National Tibetan Plateau/Third Pole Environment Data Center: Golmud City, China, 2020. [Google Scholar] [CrossRef]
- Tang, G. Digital Elevation Model of China (1KM); National Tibetan Plateau/Third Pole Environment Data Center: Golmud City, China, 2019. [Google Scholar]
- Xu, X. China GDP Spatial Distribution Kilometer Grid Data Set. Resources and Environmental Science Data Registration and Publishing System; The National Tibetan Plateau Data Center (TPDC): Beijing, China, 2017. [Google Scholar] [CrossRef]
- Xu, X. China Population Spatial Distribution Kilometer Grid Data Set. Resources and Environmental Science Data Registration and Publishing System; The National Tibetan Plateau Data Center (TPDC): Beijing, China, 2017. [Google Scholar] [CrossRef]
- Xu, X. Annual Data Set of Night Lighting in China. Data Registration and Publication System of Resources and Environmental Science; The National Tibetan Plateau Data Center (TPDC): Beijing, China, 2022. [Google Scholar] [CrossRef]
- Xu, H. A Remote Sensing Urban Ecological Index and Its Application. Acta Ecol. Sin. 2013, 33, 7853–7862. [Google Scholar]
- Hu, X.; Xu, H. A New Remote Sensing Index for Assessing the Spatial Heterogeneity in Urban Ecological Quality: A Case from Fuzhou City, China. Ecol. Indic. 2018, 89, 11–21. [Google Scholar] [CrossRef]
- Wei, X.; Yang, J.; Luo, P.; Lin, L.; Lin, K.; Guan, J. Assessment of the Variation and Influencing Factors of Vegetation NPP and Carbon Sink Capacity under Different Natural Conditions. Ecol. Indic. 2022, 138, 108834. [Google Scholar] [CrossRef]
- Gupta, K.; Kumar, P.; Pathan, S.K.; Sharma, K.P. Urban Neighborhood Green Index—A Measure of Green Spaces in Urban Areas. Landsc. Urban Plan. 2012, 105, 325–335. [Google Scholar] [CrossRef]
- Xiong, Y.; Xu, W.; Lu, N.; Huang, S.; Wu, C.; Wang, L.; Dai, F.; Kou, W. Assessment of Spatial–Temporal Changes of Ecological Environment Quality Based on RSEI and GEE: A Case Study in Erhai Lake Basin, Yunnan Province, China. Ecol. Indic. 2021, 125, 107518. [Google Scholar] [CrossRef]
- Liu, D.; Zhu, R. Methods for Detecting Land Use Changes Based on the Land Use Transition Matrix. Resour. Sci. 2010, 32, 1544–1550. [Google Scholar]
- Tobler, W.R. A Computer Movie Simulating Urban Growth in the Detroit Region. Econ. Geogr. 1970, 46, 234–240. [Google Scholar] [CrossRef]
- Jing, Y.; Zhang, F.; He, Y.; Kung, H.; Johnson, V.C.; Arikena, M. Assessment of Spatial and Temporal Variation of Ecological Environment Quality in Ebinur Lake Wetland National Nature Reserve, Xinjiang, China. Ecol. Indic. 2020, 110, 105874. [Google Scholar] [CrossRef]
- Wang, J.; Xu, C. Geodetector: Principle and Prospective. Acta Geogr. Sin. 2017, 72, 116–134. [Google Scholar] [CrossRef]
- Zhang, Y.; Bao, Y.; He, Z. Analysis of changes and trends in remote sensing ecological environment quality in Inner Mongolia from 1990 to 2021: A case study of Chen Barhu Banner, Hulunbuir City. Arid Zone Res. 2023, 40, 326–336. [Google Scholar]
- Ji, R.; Tan, K.; Wang, X.; Xin, L. Spatiotemporal Monitoring of a Grassland Ecosystem and Its Net Primary Production Using Google Earth Engine: A Case Study of Inner Mongolia from 2000 to 2020. Remote Sens. 2021, 13, 4480. [Google Scholar] [CrossRef]
- Wang, J.; Dou, Y.; Xue, Z.; Guo, C.; Chi, W. Remote sensing monitoring and analysis of land spatial evolution in Inner Mongolia Autonomous Region based on the functional zoning of the main body. Bull. Surv. Mapp. 2023, 4, 54–58. [Google Scholar]
- Wu, J.; Zhang, Q.; Li, A.; Liang, C. Historical Landscape Dynamics of Inner Mongolia: Patterns, Drivers, and Impacts. Landsc. Ecol. 2015, 30, 1579–1598. [Google Scholar] [CrossRef]
- Zhao, L.; Jia, K.; Liu, X.; Li, J.; Xia, M. Assessment of land degradation in Inner Mongolia between 2000 and 2020 based on remote sensing data. Geogr. Sustain. 2023, 4, 100–111. [Google Scholar] [CrossRef]
- Wang, Z.; Xu, D.; Peng, D.; Zhang, Y. Quantifying the Influences of Natural and Human Factors on the Water Footprint of Afforestation in Desert Regions of Northern China. Sci. Total Environ. 2021, 780, 146577. [Google Scholar] [CrossRef]
- Geng, J.; Yu, K.; Xie, Z.; Zhao, G.; Ai, J.; Yang, L.; Yang, H.; Liu, J. Analysis of Spatiotemporal Variation and Drivers of Ecological Quality in Fuzhou Based on RSEI. Remote Sens. 2022, 14, 4900. [Google Scholar] [CrossRef]
Figure 1.
Study area. (a) Location of the study area. (b) Administrative divisions of the study area.
Figure 1.
Study area. (a) Location of the study area. (b) Administrative divisions of the study area.

Figure 2.
Time series changes of indicators. (a) variations of LST and NDBSI. (b) variations in NDVI and WET. (c) year-to-year fluctuations in Inner Mongolia’s RSEI.
Figure 2.
Time series changes of indicators. (a) variations of LST and NDBSI. (b) variations in NDVI and WET. (c) year-to-year fluctuations in Inner Mongolia’s RSEI.

Figure 3.
(Left): Spatial distribution of RSEI in Inner Mongolia. (a–d) represent RSEI for the years 2005, 2010, 2015, and 2020. The legends represent the level of ecological quality: Poor (0~0.2), Fair (0.2~0.4), Moderate (0.4~0.6), Good (0.6~0.8), and Excellent (0.8~1). (Middle): Transformation of RSEI in Inner Mongolia. (a–d) represent transformation of 2005–2010, 2010–2015, 2015–2020, and 2002–2021. The legends represent the transformation level of ecological quality: Worst (<−0.2), Worse (−0.2~0), Invariant (0), Better (0~0.2), and Best (>0.2). (Right): RSEI cluster analysis in Inner Mongolia. (a–d) represent RSEI cluster analysis of the years of 2005, 2010, 2015, and 2020.

Figure 4.
Transformation of land use in Inner Mongolia. (a,b) represent the spatial distribution of land use types. (c) Changes of land use types from 2002 (left) to 2021 (right). (d,e) represent percentages of land use types in the total area of Inner Mongolia.
Figure 4.
Transformation of land use in Inner Mongolia. (a,b) represent the spatial distribution of land use types. (c) Changes of land use types from 2002 (left) to 2021 (right). (d,e) represent percentages of land use types in the total area of Inner Mongolia.

Figure 5.
Interaction detection map of impact factors. (a–d) represent the interaction detector of different years. X1 indicates altitude, X2 precipitation, X3 temperature, X4 GDP, X5 population density, and X6 nighttime light intensity.
Figure 5.
Interaction detection map of impact factors. (a–d) represent the interaction detector of different years. X1 indicates altitude, X2 precipitation, X3 temperature, X4 GDP, X5 population density, and X6 nighttime light intensity.


Table 1.
The natural and socioeconomic factors (Data format: tif).
| Type | Variable | Description | Resolution | Data Resource |
|---|---|---|---|---|
| Natural factors | X1 | Elevation | 1 km (0.008°) | National Tibetan Plateau/Third Pole Environment Data Center [35,36,37]. |
| X2 | Precipitation | 1 km (0.008°) | ||
| X3 | Temperature | 1 km (0.008°) | ||
| Socioeconomic factors | X4 | GDP | 1 km (0.008°) | Resource and Environmental Science Data Registration and Publishing System [38,39,40]. |
| X5 | Population density | 1 km (0.008°) | ||
| X6 | Nighttime light | 1 km (0.008°) |
Table 2.
Calculation of RSEI.
| Index | Formula | Explanation |
|---|---|---|
| NDVI | Calculated by MOD13A1. | |
| WET | b1, b2, …, b7 is the wave band of MOD09A1. | |
| LST | 2 | DN is the grayscale value of MOD11A2. |
| NDBSI | Calculated by MOD09A1. | |
Table 3.
Principal component analysis results of RSEI in 2005, 2010, 2015, and 2020 respectively.
| Years | 2005 | 2010 | ||||||
| PC1 | PC2 | PC3 | PC4 | PC1 | PC2 | PC3 | PC4 | |
| LST | −0.511 | 0.743 | 0.399 | −0.164 | −0.506 | −0.696 | 0.508 | 0.034 |
| NDBSI | −0.463 | −0.379 | −0.205 | −0.775 | −0.122 | 0.051 | 0.015 | −0.991 |
| NDVI | 0.661 | 0.065 | 0.497 | −0.558 | 0.785 | −0.141 | 0.596 | −0.095 |
| WET | 0.296 | 0.547 | −0.743 | −0.248 | 0.336 | −0.702 | −0.622 | −0.087 |
| Eigenvalues | 0.129 | 0.006 | 0.003 | 0.002 | 0.088 | 0.005 | 0.003 | 0.000 |
| Percentage variance | 92.16% | 4.44% | 2.02% | 1.38% | 91.09% | 5.64% | 3.14% | 0.13% |
| Years | 2015 | 2020 | ||||||
| PC1 | PC2 | PC3 | PC4 | PC1 | PC2 | PC3 | PC4 | |
| LST | −0.513 | −0.792 | 0.331 | 0.015 | −0.605 | 0.684 | 0.406 | −0.029 |
| NDBSI | −0.341 | 0.192 | −0.025 | −0.920 | −0.305 | −0.261 | −0.081 | −0.912 |
| NDVI | 0.710 | −0.223 | 0.583 | −0.326 | 0.661 | 0.189 | 0.645 | −0.333 |
| WET | 0.341 | −0.535 | −0.742 | −0.218 | 0.320 | 0.654 | −0.643 | −0.237 |
| Eigenvalues | 0.098 | 0.007 | 0.004 | 0.001 | 0.105 | 0.005 | 0.004 | 0.001 |
| Percentage variance | 88.77% | 6.77% | 3.41% | 1.05% | 91.15% | 4.74% | 3.32% | 0.79% |
Table 4.
Global Moran’s I Index.
| Years | Global Moran’s I | Mean Square | Z Value | p Value |
|---|---|---|---|---|
| 2005 | 0.9818 | 0.0004 | 2402.23 | 0.01 |
| 2010 | 0.9829 | 0.0004 | 2531.15 | 0.01 |
| 2015 | 0.9780 | 0.0004 | 2679.20 | 0.01 |
| 2020 | 0.9814 | 0.0004 | 2721.81 | 0.01 |
Table 5.
The results of factor detector.
| 2005 | 2010 | 2015 | 2020 | |||||
|---|---|---|---|---|---|---|---|---|
| q | p | q | p | q | p | q | p | |
| X1 | 0.365 | 0.000 | 0.318 | 0.000 | 0.330 | 0.000 | 0.753 | 0.174 |
| X2 | 0.706 | 0.000 | 0.570 | 0.000 | 0.536 | 0.000 | 0.805 | 0.000 |
| X3 | 0.705 | 0.000 | 0.747 | 0.000 | 0.559 | 0.000 | 0.724 | 0.000 |
| X4 | 0.001 | 0.994 | 0.001 | 0.994 | 0.003 | 0.497 | 0.054 | 1.000 |
| X5 | 0.002 | 0.891 | 0.000 | 0.990 | 0.009 | 0.993 | 0.098 | 1.000 |
| X6 | 0.005 | 0.906 | 0.004 | 0.996 | 0.003 | 0.497 | 0.001 | 0.710 |
Disclaimer/Publisher’s Note: The statements, opinions and data contained in all publications are solely those of the individual author(s) and contributor(s) and not of MDPI and/or the editor(s). MDPI and/or the editor(s) disclaim responsibility for any injury to people or property resulting from any ideas, methods, instructions or products referred to in the content. |
© 2024 by the authors. Licensee MDPI, Basel, Switzerland. This article is an open access article distributed under the terms and conditions of the Creative Commons Attribution (CC BY) license (https://creativecommons.org/licenses/by/4.0/).
Share and Cite
MDPI and ACS Style
Li, S.; Qu, S.; Zhang, G.; Zhou, Y.; Sun, X.; Li, J.; Zhang, S. Spatiotemporal Pattern and Drivers of Ecological Quality in Inner Mongolia. Land 2024, 13, 568. https://doi.org/10.3390/land13050568
AMA Style
Li S, Qu S, Zhang G, Zhou Y, Sun X, Li J, Zhang S. Spatiotemporal Pattern and Drivers of Ecological Quality in Inner Mongolia. Land. 2024; 13(5):568. https://doi.org/10.3390/land13050568
Chicago/Turabian StyleLi, Shouwei, Shufeng Qu, Guoming Zhang, Yuantao Zhou, Xuran Sun, Jiaxue Li, and Shanshan Zhang. 2024. "Spatiotemporal Pattern and Drivers of Ecological Quality in Inner Mongolia" Land 13, no. 5: 568. https://doi.org/10.3390/land13050568
Note that from the first issue of 2016, this journal uses article numbers instead of page numbers. See further details here.