Analysis of the Transmission of Project Duration and Cost Impacts Based on the GERT Network Technique

1
School of Water Conservancy, North China University of Water Resources and Electric Power, Zhengzhou 450046, China
2
Collaborative Innovation Center of Water Resources Efficient Utilization and Support Engineering, Zhengzhou 450046, China
*
Author to whom correspondence should be addressed.
Symmetry 2019, 11(3), 337; https://doi.org/10.3390/sym11030337
Submission received: 14 January 2019
/
Revised: 21 February 2019
/
Accepted: 25 February 2019
/
Published: 6 March 2019
(This article belongs to the Special Issue New Trends in Dynamics)
Abstract
:In engineering projects, project duration and a cost increase occur in every phase and will propagate their impacts downstream. Associated with the compensation of project duration, the duration and cost impacts are transferred among phases. In this paper, after illustrating the transmission of project duration and cost impacts, we will use the risk transmission theory and GERT (Graphic Evaluation and Review Technique) network technique to build a transmission model. We have designed equivalent parameters of project duration and cost impacts in the GERT model for serial, parallel, and hybrid structures. The algorithm of the GERT network for project cost and duration transmission is analyzed. The effectiveness of this model and algorithm is proved by numerical examples. This paper provides a new analytical method for cost and duration control of engineering projects.
1. Introduction
Hydraulic engineering projects often involve numerous risk factors, which propagate between different phases during a project and may affect the implementation of each phase. There are three dynamic changes in the project risk transmission, which have incremental impacts: (1) project nodes affecting the internal risk system under external risk impact; (2) the change of internal risk system of project nodes; (3) transmission of risk from project nodes’ internal system. On the one hand, each risk element is transferred between operational processes. Instead of an incremental transmission, this is a superimposed transmission that follows the moment generating function. On the other hand, multiple risk factors may affect one implementation process, and the effects of cross-risk transmission should also be considered. During one project, risks will be attached to various carriers and transmitted through all phases of the project along the direction of operational processes, in its original form or a coupling-mutated new form. When being forced to accept risks transferred from upstream nodes, downstream nodes can only reduce their losses by improving their own risk handling capabilities. However, such an approach will not change the total amount of transferred risks. Due to multiple interactions of risk factors, the downstream nodes may also conversely transmit risks upstream, forming dynamic and continuous risk feedbacks in the project implementation system. Specifically, upstream costs and duration impacts caused by internal and external interfering factors may pass downstream. Meanwhile, downstream may also compensate for the project duration to upstream. This is the transmission of duration and cost impacts between project phases.
Research on project risk transmission has made progress in academia: Haynes defined the risk as the possibility of loss. Li Cunbin et al. [1,2,3,4,5,6,7,8,9] built risk element transmission models with the GERT, data mining technology, rough set theory, chaos theory, genetic algorithm and dynamics theory, etc. They studied the equilibrium relationship of risk-duration-cost in engineering projects with different goals, including those of energy-saving construction enterprises and power supply enterprises. Liu Xiaoju et al. [10] put forward algorithms for risk transmission, thus providing a basis for risk control of total duration. By constructing a cognitive-constraint model for analyzing the cause and evolution of complex systematic incidents, Wang Ying et al. [11] analyzed the risk transmission and control of complex systems from a systematic perspective. Zhao Daozhi et al. [12] studied the risk transmission mechanism of project duration at single and full periods based on PERT (Program/Project Evaluation and Review Technique), and they came up with a solution to the problem based on the law of risk transmission. Wang Yuanming et al. [13] proposed a two-phase controllable quality risk transmission model, and an effective risk control method for supply chains of construction projects. Yuan et al. [14] studied the risk transmission mechanism of supply chains. Ren et al. [15] studied the human resources sharing-equilibrium based on risk transmission theory.
As a network analysis technique that allows probabilistic treatment, GERT is based on the CPM/PERT (Critical Path Method) and has been widely studied and used in risk management, project management, time/cost analysis, activity duration control, cost control, and system simulation. Kurihara et al. [16] studied the efficiency of Monte Carlo simulation of a GERT-type network for project management. Zhou Hougui [17] established a GERT network model of a concrete longitudinal cofferdam construction in the Three Gorges Project, and successfully solved the stochastic problems in the construction. The GERT model was used to study the meta-transmission impact of project duration impacts. He et al. [18] provided an analytical solution of a cost-time-linear-dependent GERT model for project activities. Based on the suppliers’ quality management on complex products, Liu Yuan et al. [19] built the GERT network model of suppliers’ quality-loss transmission and designed an effective algorithm to the solution. Wang [20,21] designed a GERT network model of the quality impact transmission in concrete construction based on the quality gain-loss function theory. In this way, the critical quality sources in the dam’s concrete construction network could be identified. Wu [22], Zhou [23], and Nelson [24] et al. respectively studied the application of the GERT technique in logistics support, waste remanufacturing, and concurrent product manufacturing.
After the literature review, it should be noted that fruitful results have been obtained in project duration control, risk transmission, and the GERT network technique. However, the impact of duration compensation has rarely been considered in the studies of duration risk transmission, and little work has been reported on the interactive influence of duration and cost transmission. This paper has analyzed the transmission of duration and cost in the project, as well as their impacts. It is based on the risk transmission theory and GERT network technique. A GERT model on the transmission of project duration and cost impacts is built to analyze their transmission in the project.
2. Design of the GERT Network for Cost Loss Transmission and Duration Gain-Loss Transmission
2.1. Analysis of the GERT Network
The GERT network for cost and duration gain-loss transmission is composed of three elements: arrow lines, nodes, and flows. The arrow line is a directional line starting at one node and going to another, representing the transmission of duration and cost between different tasks in a network. Nodes are points at which arrows start and finish, indicating a task or each completed phase. The flow quantifies the transmission between different tasks in the network, such as the gain or loss of duration, cost, and the probability of transmission.
If the task z is the final task, it still has duration gains and costs and compensates for the duration of its immediate predecessor. To clarify the transmission of a project’s duration gain, and final task’s duration gain and compensation, it is assumed that a virtual task z + 1 is added after the task z, which does not exist in the actual process of a project.
In the GERT network, the cost and duration transmission are always directional, and each transmission contains two parameters, namely, the additive factor parameter (duration and cost) and the multiply factor parameter (probability). In other words, the duration and cost are the incremental parameters in the transmission, while probability is the multiplicative quantity. In the GERT network calculation, the multiply parameter can directly use the signal flow graph to determine the implementation value of any target node with Mason’ gain formula, but the additive factor parameter needs to be converted from an additive operation to a multiply operation with a moment generating function to obtain the expected parameter.
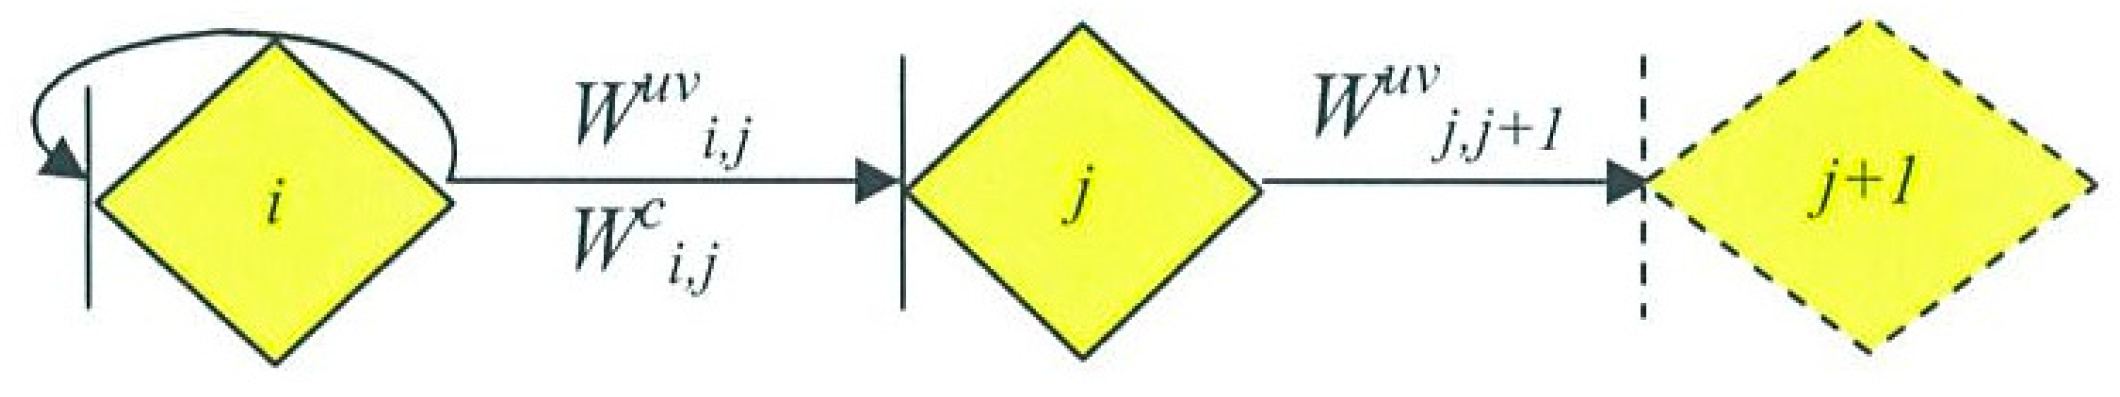
The basic components of the GERT network for cost and duration gain-loss transmission are shown in Figure 1.
As shown in Figure 1, Ui,j stands for the duration gain-loss flowing from task i to its immediate successor j; Vi,j denotes the cost flowing from the task i to j; pi,j denotes the probability of duration gain-loss flow and cost loss flow; Mi,j denotes the conditional probability function of duration transmission, and Hi,j denotes the conditional probability function of cost transmission. Cj,i indicates the duration compensation from the task j to i; qj,i denotes the probability of duration compensation, and Nj,i denotes the conditional probability function of the transmission of duration compensation. It is assumed that i is the initial operation; thus, the duration compensation amount for its immediate predecessor is zero, i.e., Ci,0 =0.
The duration compensation for each task is conducted during the project implementation. In other words, the duration compensation of the task j for its immediate predecessor i is transferred to the successor task after completion of task j, without changing the actual project duration of the completed task i. Therefore, as shown in Figure 1, the duration compensation of task j for its immediate predecessor i is marked under the arrow line, only representing the duration compensation of task j for its immediate predecessor i, without indicating the transmission process from i to j. Moreover, during project implementation, the cost of each task is relatively independent, and there is no cost compensation between operations. The transmission of duration gain-loss and cost loss is shown in Figure 2.
Based on the logical relationship between tasks, the GERT network of cost and duration transmission could be divided into serial, parallel, and self-loop structures. The network is shown in Figure 3.
As shown in Figure 3, for the duration gain-loss transmission flow Ui,j and the cost loss transmission flow Vi,j, i j, it indicates that the task i is implemented according to the plan, and its successor task j can continue on its basis; if i = j, a loop will be formed at task i, indicating that the duration (or cost) of task i has changed, which can be regarded as the adjustment of task i′ s duration or cost.
2.2. Design of Moment Generating Function
For the random variable X and real numbers, let MX (s) represent the moment generating function of the random variable X. In the GERT network for duration gain-loss and cost loss transmission, if the duration loss transferred from task i to the successor task j follows a particular probability distribution , the moment generating function of duration loss transmission Ui,j is:
For any cost loss transferred from the task i to the successor task j that follows a particular probability distribution , we have:
For any duration compensation Cj,i(x) produced by the task j for its predecessor i that follows a particular probability distribution , we have:
2.3. Design of Transfer Function
In the GERT network for duration gain-loss and cost loss transmission, if the duration loss transferred from the task i to the successor task j follows a particular probability distribution , and the probability of duration loss transmission (i, j) to be performed is , the characteristic transfer function of the duration loss transmission will be:
If the cost loss transferred from the task i to the successor task j follows a particular probability distribution , and the probability of cost loss transmission (i, j) to be performed is , the characteristic transfer function of the cost loss transmission is:
If the duration compensation Cj,i(x) produced by the task j for its immediate predecessor i follows a particular probability distribution , and the probability of duration compensation transmission (i, j) to be performed is , the characteristic transfer function of the duration compensation transmission Cj,i is:
3. Calculation of Equivalent Parameters of the GERT Network Model for Duration Gain-Loss and Cost Loss Transmission
For most networks, there are three logical structures: serial structure, parallel structure, and hybrid structure. They also exist in the GERT network of transmission for duration gain-loss and cost loss. As the characteristics of the GERT networks in which the basic serial structure, parallel structure, and hybrid structure satisfy the signal flow rule, the GERT networks with special or shaped nodes can be transformed into signal flow graphs. Thus, all the principles of signal flow graphs apply similarly to the GERT models. The Mason’s gain formula-based analysis on the network equivalent parameters of the three structures is as follows.
3.1. Calculation of Equivalent Parameters of the GERT Network for Duration Gain-Loss and Cost Loss Transmission with a Serial Structure
The structure that consists of multiple tasks in a series is called a serial structure. Due to their linear characteristics, many serial structures can be transformed into the equivalent network with a single vector. In other words, a single arrow equivalent network connecting the first and last operations can replace the serial structure, as shown in Figure 4.
The equivalent parameter of the GERT network for duration gain-loss and cost loss transmission with serial structure is the sum of the product of equivalent transfer functions of cost loss and duration loss and duration compensation of each adjacent task:
3.2. Calculation of Equivalent Parameters of the GERT Network for Duration Gain-Loss and Cost Loss Transmission with a Parallel Structure
Similar to the parallel circuit structure, the GERT network with a parallel structure starts from task 1 and has m parallel transmission paths to reach task n. The corresponding duration gain-loss and cost loss transfer function of the k-th path is , where the cost loss and duration loss transfer function is and the duration compensation transfer function is . A GERT network with a parallel structure is shown in Figure 5.
The equivalent parameter of the GERT network for duration gain-loss and cost loss transmission with parallel structure is the sum of equivalent transfer functions of duration gains-losses of each transmission path, which is given by:
3.3. Calculation of Equivalent Parameters of the GERT Network for Duration Gain-Loss and Cost Loss Transmission with a Hybrid Structure
The network structure with a loop is called a hybrid structure. The basic GERT network with a hybrid structure is shown in Figure 6.
The equivalent parameter of the GERT network for duration gain-loss and cost loss transmission with a hybrid structure is the sum of the duration compensation transfer function and the reciprocal of multiplying the cost loss and duration loss transfer function by one and then subtracting the self-loop transfer function; therefore:
4. Construction and Solution of the GERT Network Model for Project Duration Gain-Loss and Cost Loss Transmission
4.1. GERT Network Model of Multi-Risk Factor Transmission
Let us assume that in the GERT network there are n kinds of risk factors between task i and task j, including R1, R2, … and Rn, and that the realization probability of the activity (i, j) is Pij, as shown in Figure 7.
Let the risk factors including R1, R2, … and Rn be linearly correlated and satisfy a linear combination; hence:
where and are constants, and for the moment generating function of Y, there is
Thus, the transfer function of the activity (ij) is:
When there are n kinds of risk factors, they only change the transfer function between activities (i, j). There is no need to change the network structure. Thus, the equivalent transmission probability of the activity (i, j) is:
The moment generating function of the activity (i, j) is:
The mean and variance of activity (i, j) risk can be obtained from the equivalent moment generating function:
In this way, the expected values and variances of multi-risk factors of activity (i, j) can be solved. Based on the obtained expected values and variances, the absolute measure and risk degree of the risk factor can be derived. After defining the W function of each activity, the signal flow graph can be used to solve the equivalent transfer function of the whole network. All the network parameters can be worked out through the inversion of the moment generating function.
In the GERT network for duration gain-loss and cost loss transmission, firstly, the moment generating function of risk factors on each branch line is obtained by their probability density functions. Secondly, the formula is used to calculate the characteristic transfer function of each branch line, and the characteristic transfer function of the general route from one task to another task is solved through the combination of the principle of signal flow and the logical relationship between operations. Thirdly, the realization probability of the general route from one task to another task in the GERT network is obtained with the characteristics of the moment generating function. In this way, the signal flow graph and momentum generating function are combined in the GERT network, and the solution of the GERT network model for the duration gain-loss and cost loss is obtained.
4.2. Construction of GERT Network for Project Duration Gain-Loss and Cost Loss Transmission
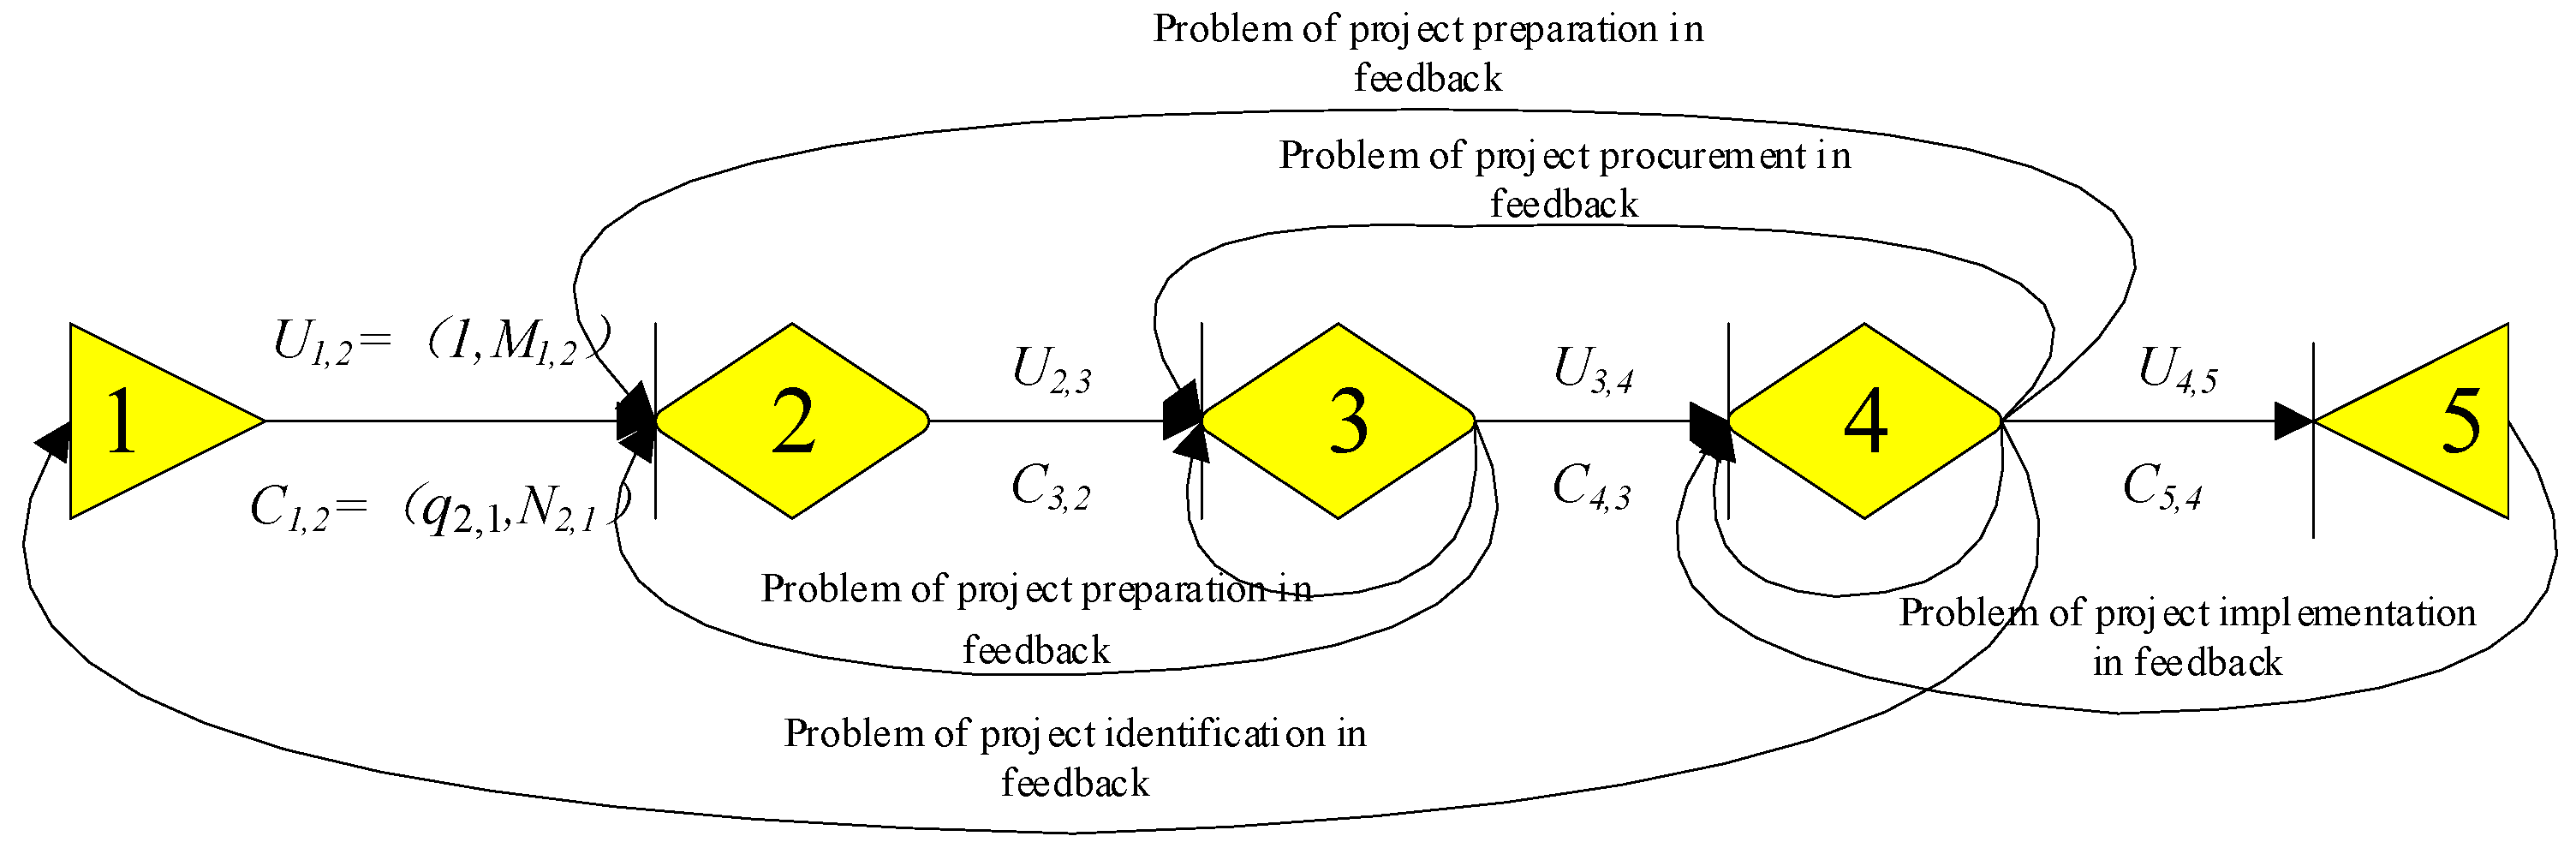
The construction process of an engineering project is divided into five phases: (1) project identification, (2) project preparation, (3) project procurement, (4) project implementation, and (5) project operation and transmission. Based on the GERT random network, a node denotes a systematic phase and the arrow line stands for the transmission between phases. The GERT network model for project duration gain-loss and cost loss transmission is shown in Figure 8.
As shown in Figure 8, the state transition between five nodes is rather complex. Nodes 3 and 4 show the self-loops, indicating the feedback of problems in the procurement and implementation phases. Meanwhile, long problem feedback also exists in the identification, preparation, procurement, and implementation phases. This study only considers the duration gain-loss and cost loss transmission between different phases of a project, without considering the feedback effect between projects.
4.3. Solution of the GERT Network for Project Duration Gain-Loss and Cost Loss Transmission
There are seven first-order loops in the GERT network for project duration gain-loss and cost loss transmission, respectively as . Let be the transmission coefficient of the first-order loop, and we have:
There are four second-order loops, respectively as . Let be the transmission coefficient of the second-order loop; hence:
Based on Mason’s gain formula in a signal flow graph, the transfer function from node 1 to node 5 can be obtained:
Thus, the equivalent probability between node 1 and node 5 is:
The equivalent moment generating function between node 1 and node 5 is:
The first-order partial derivatives and of and for are obtained respectively. The mean values of duration gain-loss and cost loss are obtained, respectively:
The respective variances of duration gain-loss and cost loss are:
The duration gain-loss and cost loss transmission from source node 1 to terminal node 5 are solved through the GERT network. In other words, the duration gain-loss and cost loss are respectively transferred between node 1 and node 5 with mean values of and , variances of and , and probability .
Based on the calculation of equivalent parameters in the GERT network for duration gain-loss and cost loss transmission with serial, parallel, and hybrid structures in Section 3, we have:
The formulas (22), (23), (31), (32), (33), and (34) are introduced into the formulas (4)–(10), thus obtaining the duration gain-loss and cost loss transmission from project identification (node 1) to project transmission (node 5). Based on the formulas (25), (26), (28), (29), and (30), the probability, expected value, and variance of duration gain-loss and cost loss transmission are respectively obtained. The final step is to show the process of project duration gain-loss and cost loss transmission.
5. Case Analysis
The implementation of a water supply project in a city is divided into five phases: project identification, preparation, procurement, implementation, and transfer. The GERT network of project implementation is shown in Figure 8, and the activity parameters of the GERT network for duration gain-loss and cost loss transmission in project implementation is shown in Table 1.
Taking the dimensionless coefficients and as 0.025 and 0.150, respectively, the linear correlation between cost loss risk factor C and duration gain-loss risk factor T can be expressed as Y = 0.025C + 0.15T. Based on the definitions of the parameter, moment generating function, and transfer function of each activity, the moment generating function and transfer function of the activities of the GERT network for duration gain-loss and cost loss transmission can be obtained, as shown in Table 2.
The transfer function of the GERT network for duration gain-loss and cost loss transmission is shown in Table 3.
The transfer function from node 1 to node 5 can be obtained from the formulas (22), (23), and (24). The equivalent probability from node 1 to node 5 can be obtained from the formulas (26)–(30) and is 0.8560, while the expected value and the variance of duration gain-loss transmission are 78.23 and 62.57, respectively. The expected value and the variance of cost loss transmission is equal to 132.52 and 103.28, respectively.
6. Conclusions
In hydraulic engineering projects, risk factors occur frequently and their impacts are often transferred between different phases in the implementation of a project. During the implementation, the cost and duration impacts from upstream operations are transmitted downstream, whether in the original risk form or in new risk forms after coupling mutations. Duration compensation from the downstream to the upstream may also occur. This is the transmission of project duration gain-loss and cost loss. Based on the linear relationship between cost loss and duration gain-loss transmission, this paper illustrates the transmission and its impacts. It has combined project risk transmission theory with the GERT network technique and built a GERT model of project duration gain-loss and cost loss transmission. It has designed an effective solution, analyzed the transmission, and verified the validity and practicability of the model and its algorithm with numerical examples. To conclude, the paper has provided a new analytical method and research thinking for better control of project expenditure and schedule.
Author Contributions
Conceptualization, Z.L. and X.N.; methodology, Z.L. and B.W.; formal analysis, Z.L.; data curation, T.F.; writing—original draft preparation, Z.L.; writing—review and editing, Z.L. and X.N.; project administration, X.N.
Funding
This research was funded by the National Natural Science Foundation of China (No.51709116) and the Key Scientific Research Projects of Henan Province Universities and Colleges (No.17B570003).
Conflicts of Interest
The authors declare no-conflict of interest.
References
- Li, C.; Wang, K. Research on the risk element transmission analytic model of construction network planning project. Chin. J. Manag. Sci. 2007, 15, 108–113. [Google Scholar]
- Li, C.; Dong, W.; Lin, S. Research on analytic model of project chain risk elements transmission based on risk ranking method and data mining. Int. J. Multimed. Ubiquitous Eng. 2016, 11, 353–364. [Google Scholar] [CrossRef]
- Li, X.; Li, C. Risk element transmission analysis of power supply enterprises based on rough set. J. Comput. Inf. Syst. 2010, 6, 205–210. [Google Scholar] [CrossRef]
- Li, C.; Li, P.; Lu, G. Enterprise projects set risk element transmission chaotic genetic model. Res. J. Appl. Sci. Eng. Technol. 2012, 4, 3162–3167. [Google Scholar]
- Li, C.; Lu, G. System dynamics model of construction project risk element transmission. Syst. Eng. Theory Pract. 2012, 32, 2731–2739. [Google Scholar] [CrossRef]
- Li, C.; Wang, K. The risk element transmission theory research of multi-objective risk-time-cost trade-off. Comput. Math. Appl. 2009, 57, 1792–1799. [Google Scholar] [CrossRef] [Green Version]
- Li, C.; Chen, H.; Shi, L.; Li, Z.; Du, Z. Risk element transfer: A new method to measure the risk of energy saving type construction company. Energy Educ. Sci. Technol. Part A Energy Sci. Res. 2013, 31, 367–372. [Google Scholar]
- Li, X.; Li, C.; Lu, G. Analysis of risk transmission from generation right trading to generation company profit. Adv. Mater. Res. 2012, 403–408, 2856–2860. [Google Scholar] [CrossRef]
- Li, C.; Xu, L. Research on project term risk transmission based on critical chain. Proj. Manag. Technol. 2013, 11, 33–38. [Google Scholar]
- Liu, X.; Wang, Y. Time-limit Risk Transmission Algorithms and Evaluation Control for Systems Integration Project. Oper. Res. Manag. Sci. 2004, 13, 38–43. [Google Scholar]
- Wang, Y.; Wang, S.; Guan, M. Risk Transmission and Control of Complex Systems; National Defense Industry Press: Beijing, China, 2015. [Google Scholar]
- Zhao, D.; Wang, Y. The Risk Transmission Mechanism of Project Duration Based on PERT. Ind. Eng. 2008, 11, 14–18. [Google Scholar]
- Wang, Y.; Zhao, D. Quality Risk Transmission Model and Control of Construction Projects. Bus. Econ. Adm. 2008, 6, 15–20. [Google Scholar]
- Yuan, Y. Risk transmission mechanism of social responsibility on supply Chain. Adv. Intell. Soft Comput. 2012, 136, 95–102. [Google Scholar]
- Ren, X.; Li, M. Multi-project sharing human resource leveling based on the theory of risk element transmission. Int. J. Hybrid Inf. Technol. 2015, 8, 469–478. [Google Scholar] [CrossRef]
- Kurihara, K.; Nishiuchi, N. Efficient Monte Carlo simulation Method of GERT-type network for project management. Comput. Ind. Eng. 2002, 42, 521–531. [Google Scholar] [CrossRef]
- Zhou, H. Stochastic Model Study of Concrete Longitudinal Cofferdam Construction in Three Gorges Project. J. Hydraul. Eng. 1997, 8, 57–60. [Google Scholar]
- He, Z.; Zhu, S.; Xu, Y. An Analytic Solution of a Cost-Time-Dependent GERT Model. J. Ind. Eng. Eng. Manag. 2004, 18, 95–97. [Google Scholar]
- Liu, Y.; Fang, Z.; Liu, S.; Yang, B.; Yuan, W. Diagnosis and Detection of Key Quality Sources of Complex Products Based on Supplier Graphic Review Network. J. Ind. Eng. Eng. Manag. 2011, 25, 212–219. [Google Scholar]
- Wang, B. Research and Engineering Application of Quality Control Technique for Dam Concrete Construction; Hohai University: Nanjing, China, 2015. [Google Scholar]
- Wang, B.; Li, Z.; Gao, J.; Vaso, H. Critical quality source diagnosis for dam concrete construction based on quality gain-loss function. J. Eng. Sci. Tech. Rev. 2014, 7, 143–151. [Google Scholar] [CrossRef]
- Wu, Y.; Pan, X.; Kang, R. Multi-parameters uncertainty analysis of logistic support process based on GERT. J. Syst. Eng. Electron. 2014, 25, 1011–1019. [Google Scholar] [CrossRef]
- Li, Z.; Xie, J.; Gu, X.; Lin, Y. Forecasting return of used products for remanufacturing using Graphical Evaluation and Review Technique (GERT). Int. J. Prod. Econ. 2016, 181, 315–324. [Google Scholar] [Green Version]
- Nelson, R.G.; Azaron, A.; Aref, S. The use of a GERT based method to model concurrent product development processes. Eur. J. Oper. Res. 2016, 250, 566–578. [Google Scholar] [CrossRef]
Figure 1.
Basic components of the GERT network for duration and cost transmission.

Figure 2.
Schematic diagram of duration and cost transmission.

Figure 3.
The schematic diagram of the GERT network for duration and cost transmission.

Figure 4.
Calculation of equivalent parameters of the GERT network for duration gain-loss and cost loss transmission with a serial structure.
Figure 4.
Calculation of equivalent parameters of the GERT network for duration gain-loss and cost loss transmission with a serial structure.

Figure 5.
Calculation of equivalent parameters of the GERT network for duration gain-loss and cost loss transmission with a parallel structure. (a) Network structure; (b) Equivalent parameter.
Figure 5.
Calculation of equivalent parameters of the GERT network for duration gain-loss and cost loss transmission with a parallel structure. (a) Network structure; (b) Equivalent parameter.


Figure 6.
Calculation of equivalent parameters of the GERT network for duration gain-loss and cost loss transmission with a hybrid structure.
Figure 6.
Calculation of equivalent parameters of the GERT network for duration gain-loss and cost loss transmission with a hybrid structure.

Figure 7.
Transmission structure of n independent risks.

Figure 8.
The GERT network for project duration gain-loss and cost loss transmission.


Table 1.
Activity parameters of GERT network for duration gain-loss and cost loss transmission in the implementation of water supply project in a city.
Table 1.
Activity parameters of GERT network for duration gain-loss and cost loss transmission in the implementation of water supply project in a city.
| Activity | Duration Loss Transmission Ui,j | Cost Loss Transmission Vi,j | Duration Compensation Transmission Cj,i | |||||||||
|---|---|---|---|---|---|---|---|---|---|---|---|---|
| Transmission Probability pi,j | Distribution Type | Distribution Parameter | Transmission Probability pi,j | Distribution Type | Distribution Parameter | Transmission Probability qj,i | Distribution Type | Distribution Parameter | ||||
| Mean Value (Day) | Variance | Mean Value (Ten Thousand Yuan) | Variance | Mean Value (Day) | Variance | |||||||
| 1→2 | 1.00 | Normal distribution | 30 | 5 | 1.00 | Normal distribution | 600 | 20 | 1.00 | Normal distribution | 5 | 2 |
| 2→3 | 1.00 | Normal distribution | 80 | 6 | 1.00 | Normal distribution | 3000 | 50 | 1.00 | Normal distribution | 12 | 2 |
| 3→4 | 0.80 | Normal distribution | 50 | 4 | 0.85 | Normal distribution | 2000 | 30 | 0.70 | Normal distribution | 8 | 1 |
| 3→3 | 0.15 | Constant distribution | 20 | 0 | 0.10 | Normal distribution | 200 | 15 | 0.20 | Constant distribution | 6 | 0 |
| 3→2 | 0.05 | Normal distribution | 10 | 2 | 0.05 | Constant distribution | 200 | 0 | 0.10 | Constant distribution | 5 | 0 |
| 4→5 | 0.85 | Normal distribution | 720 | 10 | 0.90 | Normal distribution | 26,000 | 160 | 0.75 | Normal distribution | 30 | 4 |
| 4→4 | 0.05 | Normal distribution | 30 | 6 | 0.05 | Normal distribution | 300 | 40 | 0.10 | Normal distribution | 6 | 3 |
| 4→3 | 0.05 | Constant distribution | 30 | 0 | 0.02 | Normal distribution | 200 | 30 | 0.05 | Constant distribution | 8 | 0 |
| 4→2 | 0.03 | Constant distribution | 25 | 0 | 0.02 | Constant distribution | 300 | 0 | 0.05 | Normal distribution | 10 | 4 |
| 4→1 | 0.02 | Normal distribution | 30 | 5 | 0.01 | Constant distribution | 150 | 0 | 0.05 | Constant distribution | 6 | 0 |
| 5→4 | 1.00 | Normal distribution | 20 | 6 | 1.00 | Normal distribution | 2000 | 40 | 1.00 | Normal distribution | 10 | 4 |
Table 2.
Moment generating function and transfer function of activities of the GERT network for duration gain-loss and cost loss transmission.
Table 2.
Moment generating function and transfer function of activities of the GERT network for duration gain-loss and cost loss transmission.
| Activity | Cost Loss Transmission Vi,j | Duration Loss Transmission Ui,j | Duration Compensation Transmission Cj,i | |||||||||
|---|---|---|---|---|---|---|---|---|---|---|---|---|
| Transmission Probability | Transfer Function Code | Moment Generating Function | Transfer Function | Transmission Probability | Transfer Function Code | Moment Generating Function | Transfer Function | Transmission Probability qj,i | Transfer Function Code | Moment Generating Function | Transfer Function | |
| 1.00 | 1.00 | 1.00 | ||||||||||
| 1.00 | 1.00 | 1.00 | ||||||||||
| 0.80 | 0.8 | 0.80 | 0.8 | 0.70 | 0.7 | |||||||
| 0.15 | 0.15 | 0.15 | 0.15 | 0.20 | 0.2 | |||||||
| 0.05 | 0.05 | 0.05 | 0.05 | 0.10 | 0.1 | |||||||
| 0.85 | 0.85 | 0.85 | 0.85 | 0.75 | 0.75 | |||||||
| 0.05 | 0.05 | 0.05 | 0.05 | 0.10 | 0.1 | |||||||
| 0.05 | 0.05 | 0.05 | 0.05 | 0.05 | 0.05 | |||||||
| 0.03 | 0.03 | 0.03 | 0.03 | 0.05 | 0.05 | |||||||
| 0.02 | 0.02 | 0.02 | 0.02 | 0.05 | 0.05 | |||||||
| 1.00 | 1.00 | 1.00 | ||||||||||
Table 3.
Transfer function of the GERT network for duration gain-loss and cost loss transmission.
| Serial Number | Transfer Function Code | Transfer Function |
|---|---|---|
| 1 | ||
| 2 | ||
| 3 | = + 0.7 | |
| 4 | ||
| 5 | ||
| 6 | ||
| 7 | ||
| 8 | ||
| 9 | ||
| 10 | ||
| 11 |
© 2019 by the authors. Licensee MDPI, Basel, Switzerland. This article is an open access article distributed under the terms and conditions of the Creative Commons Attribution (CC BY) license (http://creativecommons.org/licenses/by/4.0/).
Share and Cite
MDPI and ACS Style
Li, Z.; Nie, X.; Wang, B.; Fan, T. Analysis of the Transmission of Project Duration and Cost Impacts Based on the GERT Network Technique. Symmetry 2019, 11, 337. https://doi.org/10.3390/sym11030337
AMA Style
Li Z, Nie X, Wang B, Fan T. Analysis of the Transmission of Project Duration and Cost Impacts Based on the GERT Network Technique. Symmetry. 2019; 11(3):337. https://doi.org/10.3390/sym11030337
Chicago/Turabian StyleLi, Zhiyong, Xiangtian Nie, Bo Wang, and Tianyu Fan. 2019. "Analysis of the Transmission of Project Duration and Cost Impacts Based on the GERT Network Technique" Symmetry 11, no. 3: 337. https://doi.org/10.3390/sym11030337
Note that from the first issue of 2016, this journal uses article numbers instead of page numbers. See further details here.