Edge Detection Algorithm of a Symmetric Difference Kernel SAR Image Based on the GAN Network Model


1
School of Information Engineering, Guangdong University of Technology, Guangzhou 510006, China
2
Xinjiang Institute of Ecology and Geography, Chinese Academy of Sciences, Urumqi 830011, China
3
Graduate School of Integrated Basic Science, Nihon University, Tokyo 156-8550, Japan
*
Author to whom correspondence should be addressed.
Symmetry 2019, 11(4), 557; https://doi.org/10.3390/sym11040557
Submission received: 15 March 2019
/
Revised: 2 April 2019
/
Accepted: 3 April 2019
/
Published: 17 April 2019
(This article belongs to the Special Issue New Trends in Dynamics)
Abstract
:The symmetrical difference kernel SAR image edge detection algorithm based on the Canny operator can usually achieve effective edge detection of a single view image. When detecting a multi-view SAR image edge, it has the disadvantage of a low detection accuracy. An edge detection algorithm for a symmetric difference nuclear SAR image based on the GAN network model is proposed. Multi-view data of a symmetric difference nuclear SAR image are generated by the GAN network model. According to the results of multi-view data generation, an edge detection model for an arbitrary direction symmetric difference nuclear SAR image is constructed. A non-edge is eliminated by edge post-processing. The Hough transform is used to calculate the edge direction to realize the accurate detection of the edge of the SAR image. The experimental results show that the average classification accuracy of the proposed algorithm is 93.8%, 96.85% of the detection edges coincide with the correct edges, and 97.08% of the detection edges fall into the buffer of three pixel widths, whichshows that the proposed algorithm has a high accuracy of edge detection for kernel SAR images.
1. Introduction
The generative adversarial network (GAN) is a generative model proposed by Goodfellow in 2014. GAN is structurally inspired by the two-person zero-sum game in game theory (that is, the sum of the interests of two people is zero, and the gain of one party is the loss of the other party). The system consists of a generator and a discriminator. The generator captures the potential distribution of real data samples and generates new data samples; the discriminator is a binary classifier used to determine whether the input is real data or generated samples [1,2]. Both the generator and the discriminator can use the currently heated deep neural network. The GAN network model is a minimax game problem in the optimization process of edge detection for symmetric difference nuclear SAR images. The objective of optimization is to achieve Nash equilibrium so that the generator can estimate the distribution of data samples [3].
In the current boom of artificial intelligence, the proposed GAN network model meets the research and application needs in many fields, and injects new impetus into these fields. The GAN network model has become a hot research direction in the field of artificial intelligence. Le Cun, a famous scholar, even calls it “the most exciting idea in the field of machine learning in the past decade” [4]. At present, SAR imagery and vision is one of the most widely used areas in the research and application of the GAN network model. It has been able to generate digital, face, and other objects, from various realistic indoor and outdoor scenes; use edge detection, segmentation, and restoration of original images to render black and white images; restore object images from object contours; and generate high-resolution images from low-resolution images [5]. In addition, the GAN network model has been applied to speech and language processing, computer virus monitoring, a chess game program, and other issues.
SAR is a high-resolution coherent imaging radar, which uses an antenna to transmit energy to the target and receive the energy returned from the target, and uses digital equipment to record the image [6]. Compared with traditional visible light and infrared remote sensing, SAR has the imaging characteristics of all-weather, all-time, and penetrating some ground objects. Because of the above characteristics of SAR, the edge detection of SAR images has attracted more and more attention. Due to the fact that the noise of SAR images is multiplicative, the difference operator of the traditional edge detection method is not effective. Therefore, combined with the GAN network model, the edge of an SAR image is detected. In recent years, domestic and foreign scholars have done a lot of research on edge detection of SAR images. Among them, there are several operators commonly used in SAR image edge detection: Ratio of Averages (ROA) proposed by Bovik et al., which is based on the ROA operator; Tupin et al. proposed a detection operator that combines the multiplicative Duda operator and ratio detection operator with the cross-correlation detection operator; based on the multi-edge model, an exponentially weighted average ratio (ROEWA) detection operator is proposed. The above operators all have a constant false alarm rate, and overcome the shortcomings of classical gradient edge detection operators, which are sensitive to multiplicative noise to a certain extent, and achieve good detection results. Commonly used SAR image edge detection operators are carried out in a single window. However, due to the serious interference of speckle noise and other objects in the imaging process of symmetrical difference nuclear SAR images, the detection results under a single window cannot meet the actual needs of a high integrity and low false detection rate at the same time [7,8,9]. Therefore, in order to improve the integrity of edge detection and the effect of noise suppression, it is necessary to detect and fuse the detection results of a symmetrical difference SAR image. In low- and medium-resolution symmetric difference nuclear SAR images, objects are mainly characterized by lines with a certain direction and length. Compared with other adjacent objects, the image gray value of objects is lower [10]. In high-resolution symmetric difference nuclear SAR images, objects show long dark areas surrounded by bright double edges. According to the low amplitude and homogeneity of the object in an SAR image, the lower the gray value of the image, the gentler the change of the gray value of the local area, and the more likely it is to be the object; otherwise, the less likely it is. The local entropy of an image based on statistics has a good anti-noise ability, and can effectively evaluate the degree of gray change of a local image, so it can also evaluate the probability that the region is an object [11].
To sum up, most of the existing edge detection methods are sensitive to image noise and have a limited direction of edge detection. Under the influence of speckle noise, it is difficult for symmetrical differential nuclear SAR images to effectively detect interregional edges with an arbitrary direction and similar intensity. In order to overcome the sensitivity and limited directionality of noise in symmetrical differential nuclear synthetic aperture radar images, an edge detection algorithm based on the GAN network model is proposed in this paper. The experimental results show that the algorithm is not sensitive to strong speckle noise, and can get a better edge location with low detection error. Therefore, this method has a certain contribution to the accurate understanding of SAR images. The step diagram of this research method is given as shown in Figure 1.
The remainder of this paper is organized as follows.
The implementation steps of the symmetrical differential SAR image edge detection algorithm based on the GAN network model are described in Section 2. The GAN network model appears in Section 2.1, the multi-view data generation of a symmetrical differential nuclear SAR image appears in Section 2.2, and the edge detection of a symmetrical differential nuclear SAR image appears in Section 2.3. The analysis of experimental results is described in Section 3. Through the comparison of various algorithms, the effectiveness and feasibility of the algorithm are verified by simulation experiments. The discussion is described in Section 4, which verifies the innovation of the algorithm. The summary and prospect of this research method are described in Section 5.
2. Edge Detection Algorithm of a Symmetric Difference Kernel Sar Image Based on the Gan Network Model
2.1. GAN Network Model
Inspired by a two-person zero-sum game, Goodfellow et al. proposed a generative antagonism network GAN, which consists of a generator G and a discriminator D. A zero-sum game is based on the idea that the sum of two people’s interests in the game is zero; that is, one party’s income is the other party’s loss [12]. Generator G captures the distribution model of real data samples first, and then generates new data samples using the captured distribution model. The discriminator D is a two valued classifier that determines whether the input is real or G generated. G and D optimize their parameters iteratively by competing and restricting each other to improve their generating and discriminating abilities [13]. In fact, this learning optimization process is a minimax game problem; that is, to find a balance point between the two. If the balance point is reached, D cannot judge whether the data comes from G or real samples, and then G reaches the optimal state. A large number of practices have proved that the GAN network model can be used to solve the problem of too few samples in a training set, such as Gurumurthy and other improved GAN network models employed to enhance small data sets and improve the classification accuracy of the trainer [14]. Domestic scholars have proposed several GAN derivative models to enhance data sets [15].
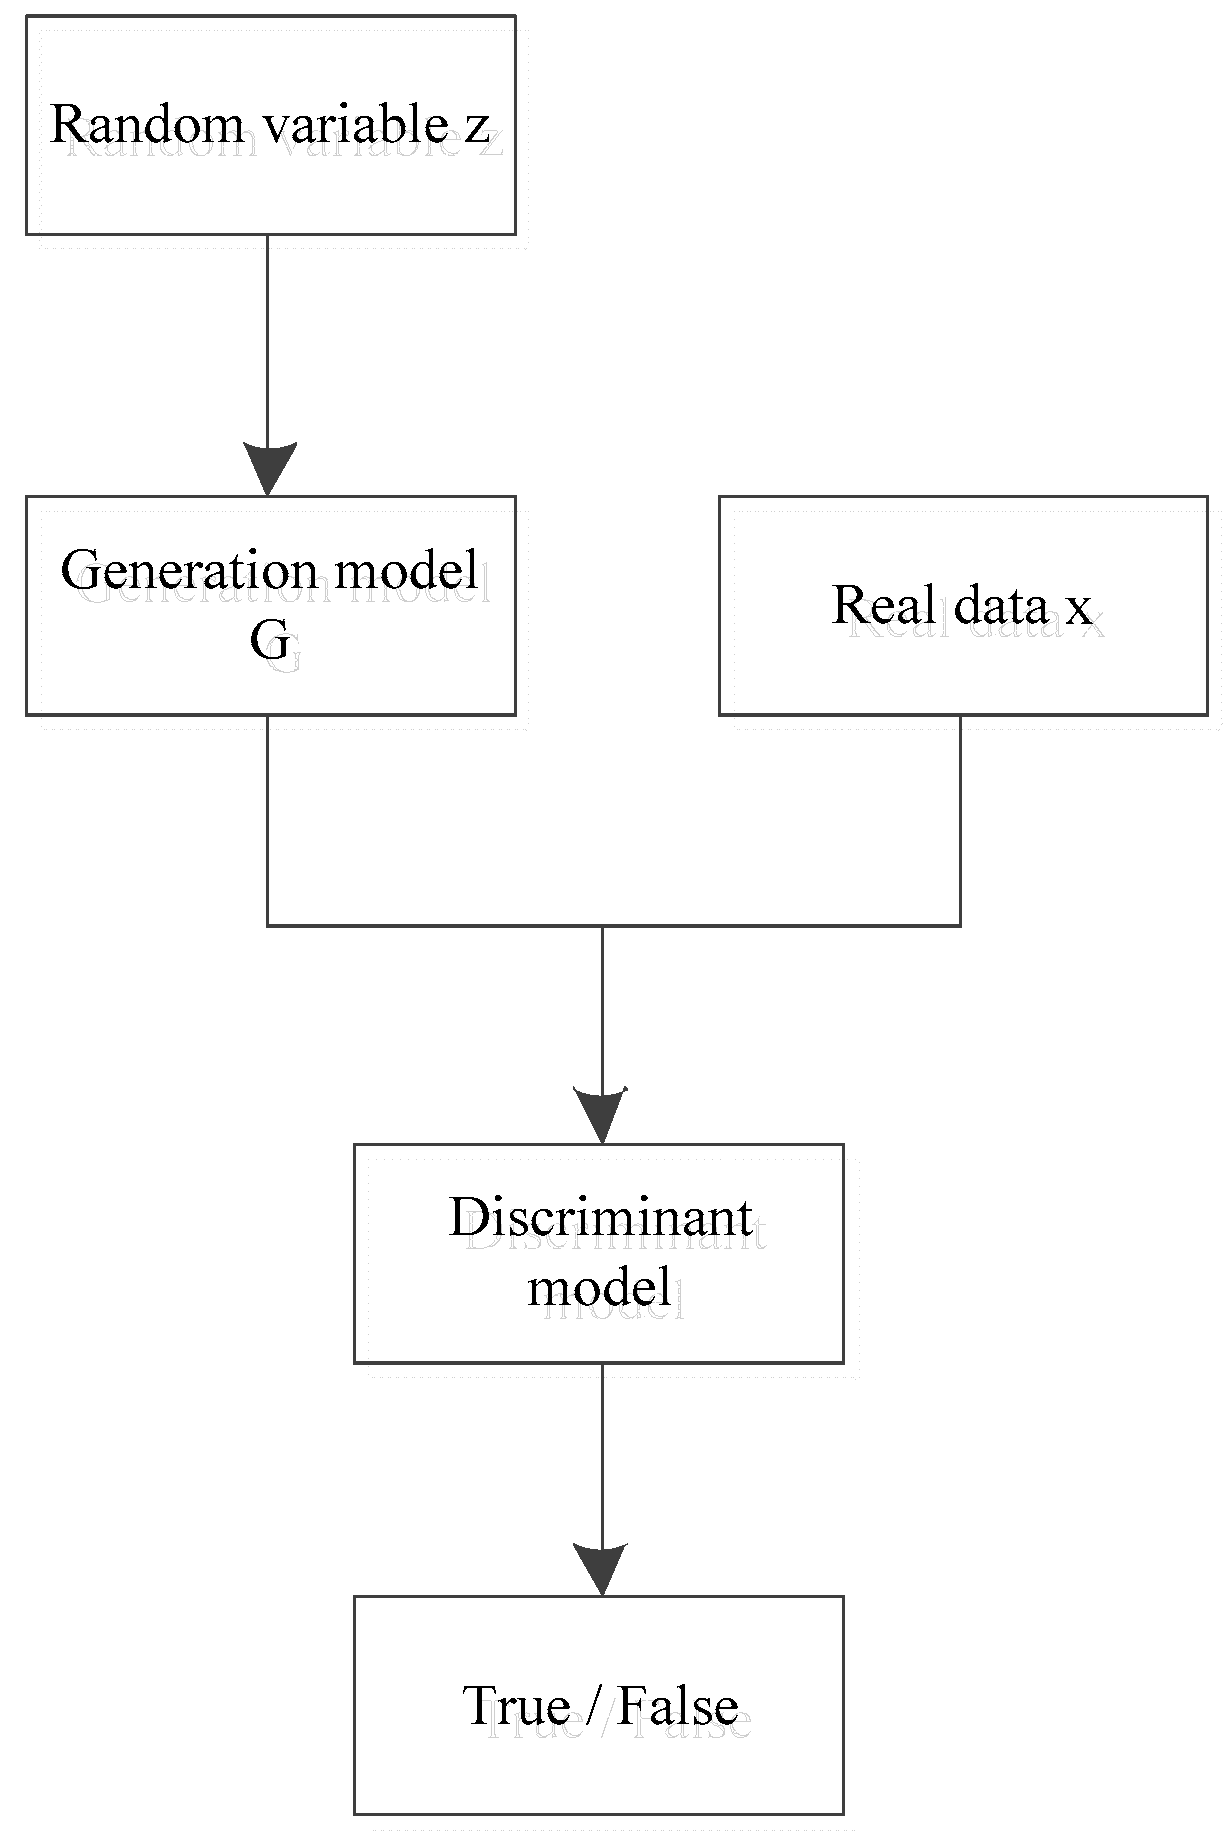
The structure of the GAN network model is shown in Figure 2. D and G represent discriminators and generators, respectively. Their structures are CNN. The input of D is real data x and the output is 1 or 0; the input of G is one-dimensional random noise vector Z and the output is G(z). The goal of training is to make the distribution of G(z) as close as possible to the distribution of real data. The goal of D is to achieve the binary classification of input data [16]. If the input comes from real samples, the output of D is 1; if the input is G(z), the output of D is 0. The goal of G is to make the performance of the data G(z) generated by D(z) on D(G(z)) nearly identical to that of the real data x on D(x). represents the variation of random noise. The loss function of G is calculated according to Formula (1):
Formula (1) describes that the data G(z) generated by G in the process of continuous antagonistic learning is getting closer to the real sample, and the discrimination of G(z) by D is becoming more and more blurred. The loss function of D is calculated by Formula (2):
Among them, represents the degree of variation of data x.
In summary, the overall loss function of G and D can be described in Formula (3):
Figure 2 shows that the generated model G can be obtained by inputting a one-dimensional random noise variable z. The generated model G can be closer to the actual data distribution. At this time, inputting real data x, together with the generated model G, results in discrimination of the discriminant model. Finally, the discriminant model will give out whether the data comes from the actual data x or the generated model G. If the actual data x is judged, the output result is true; on the contrary, the output result is false.
2.2. Multi View Data Generation of Symmetric Difference Kernel SAR Images Based on the GAN Network Model
Symmetrical difference kernel SAR image edge detection is based on multi-view data generation. Based on the GAN network model proposed in the previous section, for any source view of testing symmetrical difference kernel SAR image instance, we can obtain a general representation vector [17] for the example. The next task is to reconstruct other views through the representation vector. The GAN network originates from Nash equilibrium in game theory. It uses CNN to construct a generation model (G) and discriminant model (D), respectively. It predicts the potential distribution of real data and generates new samples through the iterative antagonism between the generation model and discriminant model. The objective of network optimization is defined as the game between the generating model and discriminant model [18], and the objective function is shown in the above Formula (3).
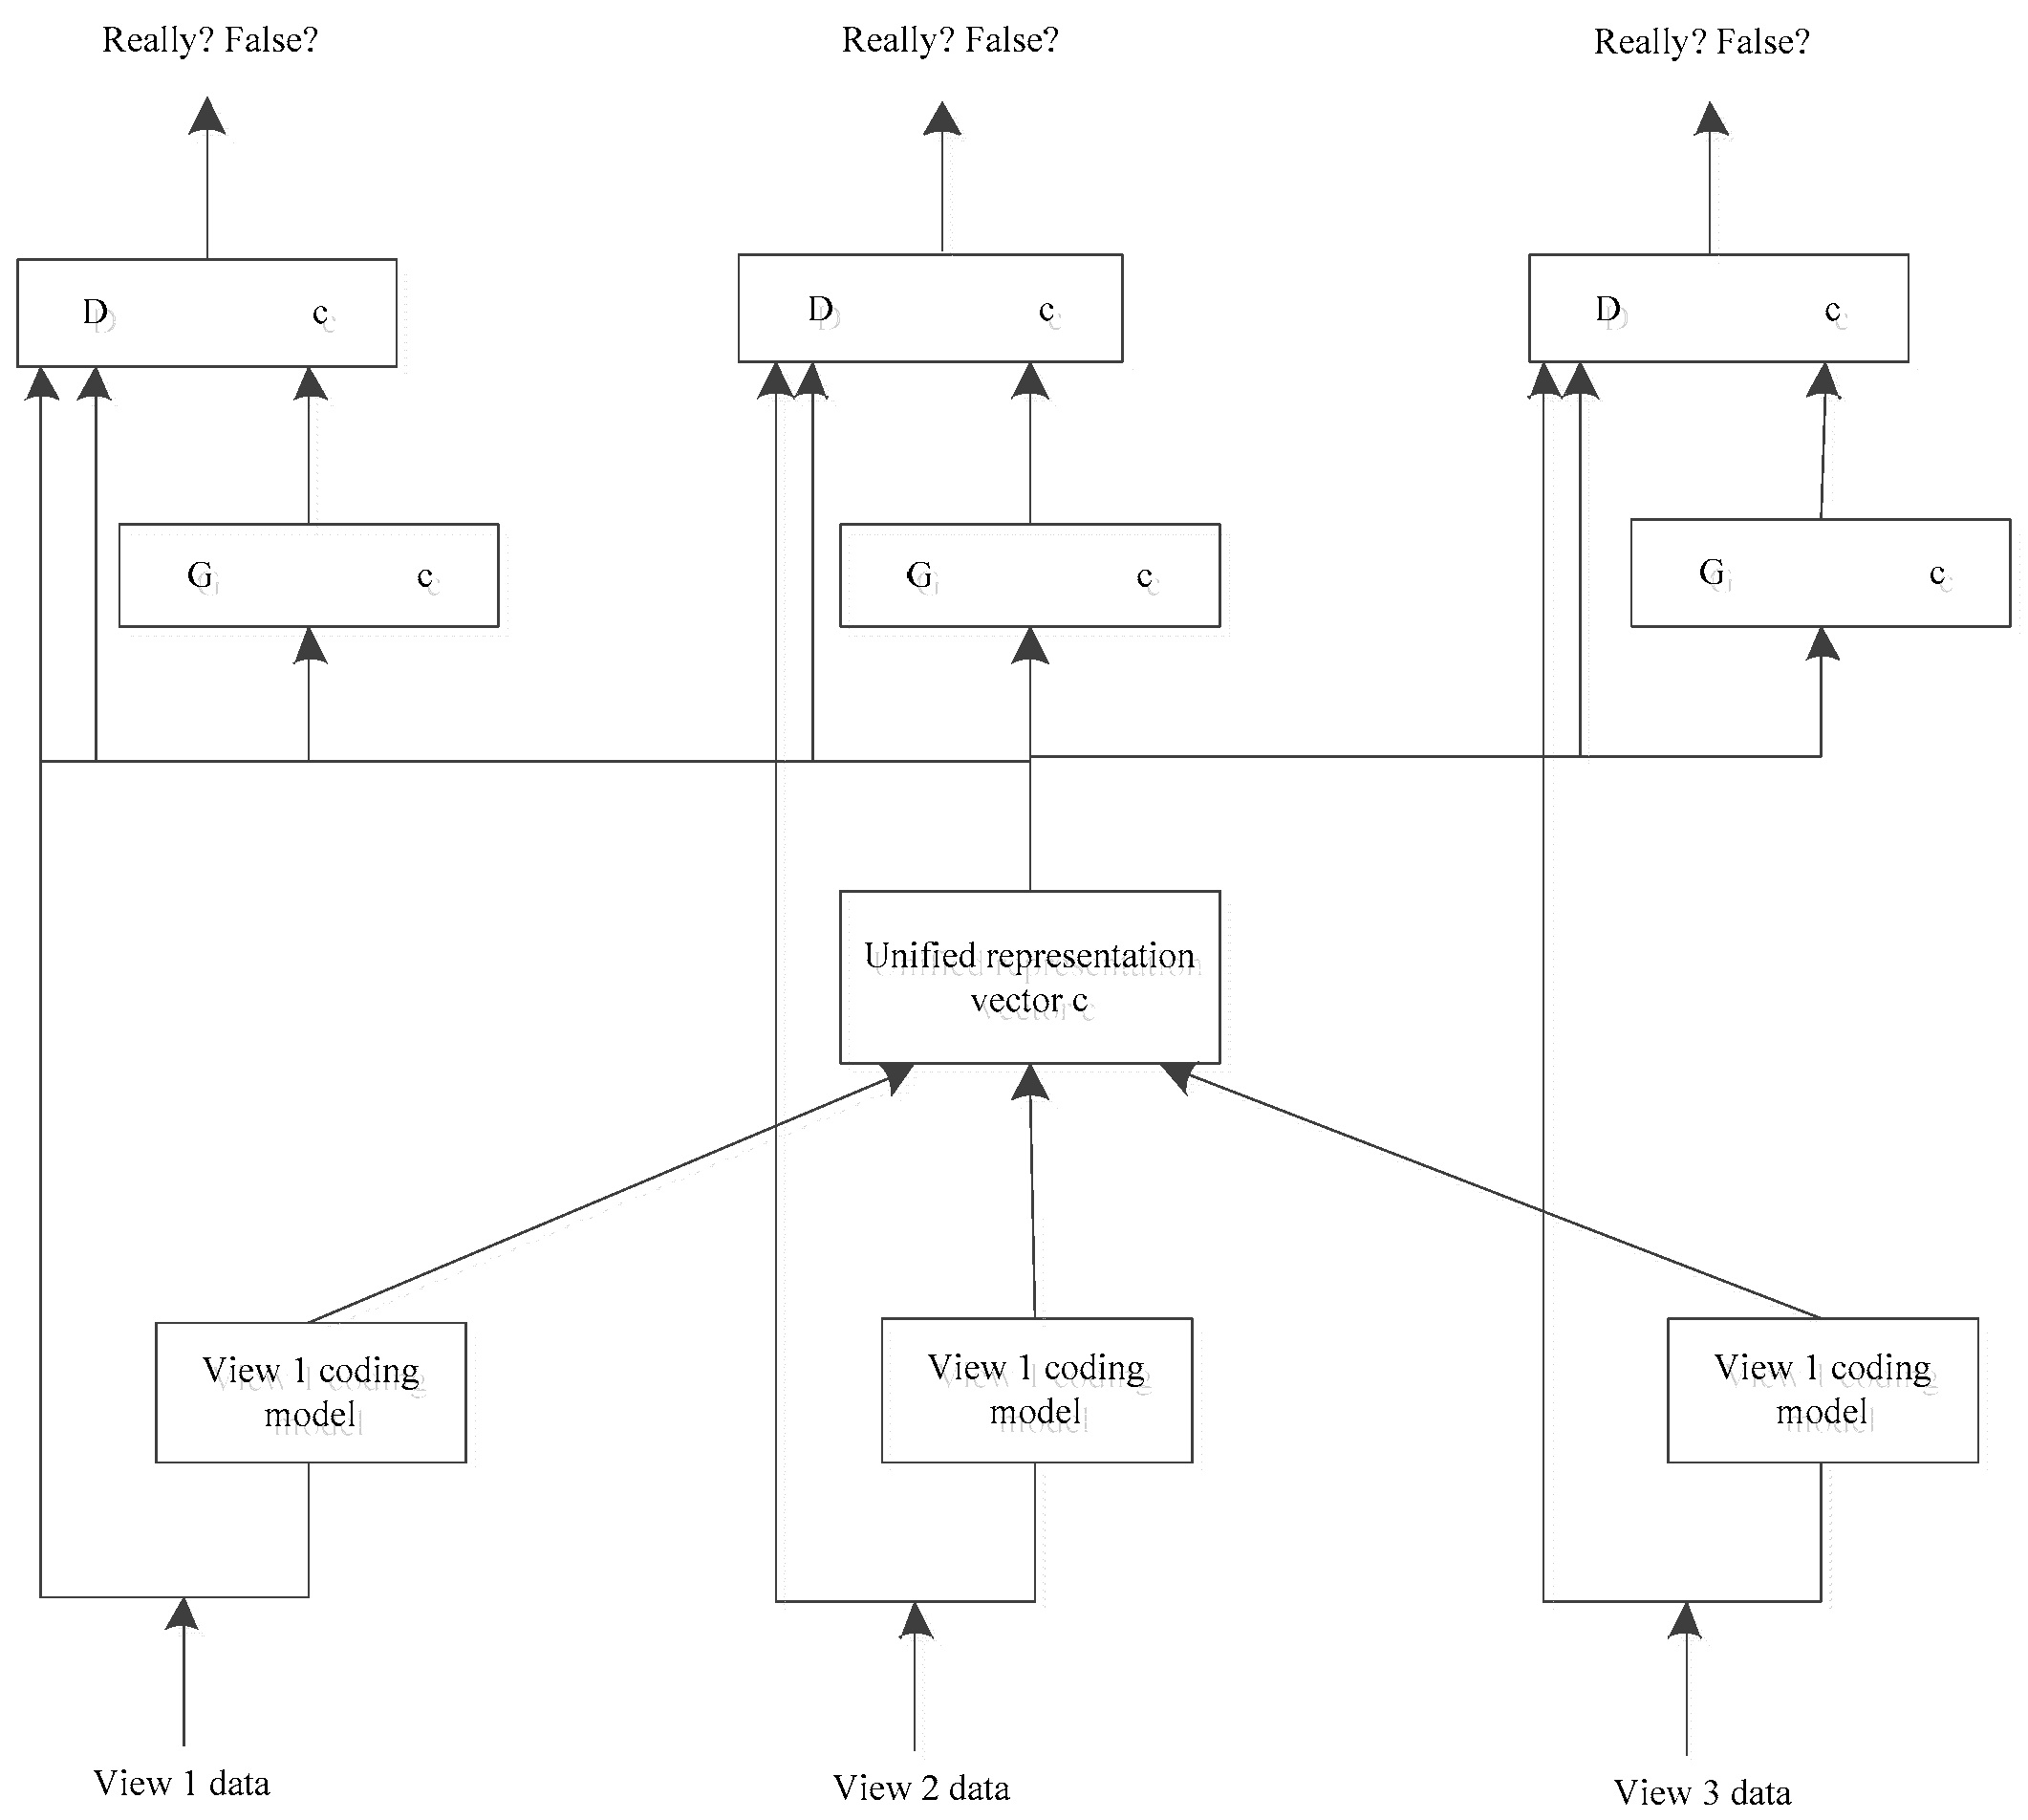
In order to generate multi-view data of symmetrical difference nuclear SAR images, GAN networks can be constructed for all views respectively, and the data of corresponding views can be generated [19,20,21]. However, because the standard GAN generation model takes the random variable z as the input, it can not specify the view data corresponding to the representation vector. In order to solve this problem, an effective method is to build a conditional generation confrontation network. Its basic idea is to introduce conditional variables into the generation model and discriminant model, and use conditional variables to guide data generation [22]. Therefore, a multi view data generation algorithm based on the GAN network model for symmetric differential kernel SAR images is proposed. In the generation model and the discriminant model, the representation vector c is added as the constraint condition and as part of the input layer, so that the representation vector can be used to guide the generation of new view data. Based on the GAN network model, the frame of multi view data generation for symmetric difference kernel SAR images is shown in Figure 3. The objective of each GAN network optimization is redefined as a game between the generated model and the discriminant model with the constraint of the representation vector.
As can be seen from Figure 3, the GAN network of each SAR view generates the representation vector c [23,24] from the coding model before the training begins. In the training process, the model G is generated with the random variable z sampled from the normal distribution as the input and the representation vector c as the constraint condition. Discriminant model D takes the real training data or the data generated by the model as the input, and takes the representation vector c as the constraint condition. The generation model and discriminant model in the GAN network model approximate the potential distribution of real data under constraint c through confrontation training, and generate new samples. In the process of testing, the representation vector c is generated from the symmetrical difference core SAR source image by an encoding model. Due to the limitation of optimizing the target conditions, the vector c contains the complete reconstruction information of SAR image instances, and can be transferred as a constraint condition to any other view generation model. The corresponding view generation model takes random variable z as the input and representation vector c as the constraint to generate data matching with the source view, which provides conditions for the edge extraction of symmetric difference nuclear SAR images.
2.3. Edge Detection of Symmetric Difference Kernel SAR Images
2.3.1. Initial Edge
Based on the results of multi-view data generation of symmetrical difference nuclear SAR images obtained in the previous section, an edge detection model of an arbitrary direction symmetrical difference nuclear SAR image is constructed with (x, y) as the detection center.
Formula (4) denotes the weighted average of the sample points in the front window of (x, y); Formula (5) denotes the weighted average of the sample points in the back window of (x, y); and Formula (6) denotes the absolute difference of the weighted average values in the two windows. and denote the abscissal and longitudinal coordinates of the current pixel u, respectively; M is the core of the symmetric difference; is the detection direction; z is the pixel gray value; K is the two-element kernel function; and p is the window. Compared with a given scale window, for pixels far from the edge, two symmetrical windows in any direction of detection are always located in the same homogeneous region, so their M value is smaller; for pixels near the edge, there is a window that spans different homogeneous regions, making the M value larger; and for edge pixels, there is always a detection, the two symmetric windows in the direction are located in different homogeneous regions, and the M is of the maximum value [25]. Thus, the maximum M value in all detection directions can be used to judge whether a given pixel is an edge pixel or not.
Formula (7) represents the direction of the maximum M value in all detection directions at (x, y), and the maximum M value is
After traversing the image domain D, we get and use it to get the pixel edge strength set of 0 to 255.
In the formula, EI is a threshold in the range of 0 to 255, and binary processing (edge pixel value is 1) is performed to obtain the initial binary edge H (x, y) of the symmetric difference kernel SAR image.
2.3.2. Edge Post Processing
The initial edge is eliminated by non-edge processing.
In the formula, denotes neighborhood centered on the pixel of in H or ( is taken here); s denotes that the number of values in is 1; and denotes that the values in are all 0.
The in Formula (11) is obtained by traversing the in Formula (10) through the image domain D, and the new is obtained by processing the in Formula (10) so that the iteration is repeated until the does not change. When passes through the edge trunk of the SAR image, more than half of the pixels are the detected initial edges, so it needs to be preserved at this time. On the contrary, when passes through the edge trunk of the SAR image, less than half of the initial edge pixels will be deleted at the edge of the main edge or at the noise point, and finally, the edge trunk will be left to filter out the noise point [26].
Figure 4 is a schematic diagram of initial edge removal of non-edge and noise points in symmetrical difference SAR images. The arched black area in Figure 4a represents the thicker initial edge, and the scattered black spots represent the noise points; Figure 4b is a partial enlargement of the area where the blue box is located in Figure 4a; and Figure 4c shows the use of a neighborhood to preserve edges. In the backbone, which removes non-edge processing, the box numbered 1 represents the scattered noise points that can be eliminated in edge detection, the box numbered 2 represents the inaccurate edge and error detection edge in edge detection, and the box numbered 3 represents the preservation of the symmetrical difference core SAR image edge trunk; Figure 4d represents the edge trunk. For the final result of the whole processing of Figure 4a, the edge trunk of the symmetrical difference nuclear SAR image is retained and the error edge is removed. After removing the noise points from the initial results, the coarse initial edges are refined by morphology, and then the edge detection is completed.
2.3.3. Calculation of Edge Direction by Hough Transform
The commonly used edge detection methods for symmetric difference nuclear SAR images can only detect the edge intensity of the image, but cannot calculate the edge direction. The Hough transform is often used to detect linear features of images, which is less affected by noise and line spacing. The basic idea is the duality of points and lines, i.e., the collinear points in the image space correspond to the intersecting lines in the parameter space [27,28,29,30]. Conversely, all lines intersecting at the same point in the parameter space correspond to collinear points in the image space. Considering the high resolution of symmetrical difference SAR images and the vast image scene, by using the excellent direction selectivity of the Hough transform and the idea of integration, the edge direction is obtained according to the local linear feature orientation, and the symmetrical difference SAR is completed by judging the accumulative degree of intersection points [31].
Assuming that the linear characteristics of the local edge region on the symmetric difference kernel SAR image space (x, y) satisfy the equation: , the polar coordinate equation () is used in practical calculation, so that x, y will be taken as a known parameter, represents the distance from the straight line to the origin, and is the angle between the straight line normal and the x axis as an independent variable in the (x, y) plane. Any point corresponds to a sine curve on the space . Because of the serious edge waveform of the high-resolution SAR image, in order to get more accurate detection results, a downscaling factor with a value of 0–1 is introduced in the Hough transform of pixels. The improved polar coordinates equation is
Therefore, the introduction of reduces the dynamic range of changes and improves the accuracy of edge direction detection. If a given set of points (x, y) intersects at one point on the plane, then all points in the set of points (x, y) are on the same line, and the edge directions of all points in the set of points can be obtained.
The specific process is as follows: set the accumulator array , for SAR image edge feature point , let take all possible values on the axis, and calculate the corresponding according to Formula (12). By adding 1 to the accumulator corresponding to its points, the number of collinear points can be obtained from the number of . The maximum value in the array corresponds to the collinear lines of multiple points in the SAR image. According to the obtained lines, the edge directions of all points on the line can be obtained. The complexity of the Hough transform is the same as that of common edge detection methods, and the operation principle is very simple. The parameter dependence is relatively small, and the Hough transform pays attention to the correlation between a single pixel and local edge direction when calculating edge direction. Therefore, the robustness and accuracy of direction calculation are relatively improved. The flow chart of the algorithm is shown in Figure 5.
According to Figure 5, the SAR image is detected and the image edge intensity graph R1 is obtained. The detection steps are repeated to get the edge intensity image R2. The edge intensity maps R1 and R2 are thinned separately. After thinning, the image to be calculated is obtained by non-extreme suppression processing. According to the principle steps of the above Hough transform employed to calculate the edge direction, the Hough transform is used to calculate the edge direction of the image. Finally, the image output of the edge is calculated.
3. Experimental Analysis
3.1. Classification Effect Analysis of Multi View Data for Symmetric Difference Kernel SAR Images
In order to verify the superiority of the proposed edge detection algorithm, an experiment was carried out. The configuration of the experimental environment is as follows: the CPU is Intel Core i7 9280, the memory is 16 GB DDR4, and the GPU is NVIDIA GTX1080. Software aspect: The operating system is Windows 64 bit version, and the platform is based on python’s Tensorflow framework, which includes the support of CUDA9.1 and CUDNN7 acceleration package.
An SAR image from the National Laboratory website was selected as the experimental object. Its resolution is 1 m. It is an airborne SAR image slice of a racetrack. The original SAR image is given as shown in Figure 6. The channel with ROI location information of 4 × 8 bits and low-frequency approximate subb and mean of 2 × 16 bits is selected to transmit the SAR image and complete the process of input and generation.
The original SAR image shown in Figure 6 is processed by the GAN network model constructed by the algorithm. Three sets of data sets are obtained, which are the fog weather condition map data set, clear sky weather map data set, and thunderstorm weather condition map data set. According to the three data sets, the following experiments are carried out.
In order to compare the enhancement effect of the proposed algorithm with that of the traditional data generation algorithm, three comparative experiments are designed. The original SAR image is generated by the proposed algorithm and the traditional algorithm respectively. One is the blank control group, which does not use the data generation algorithm. The other two data generation algorithms are the present algorithm and the affine transformation algorithm. The contrast diagrams of enhancement effects of two different data generation algorithms are given, as shown in Figure 7.
According to Figure 7, the blank control group does not use the data generation algorithm, so its data enhancement effect remains unchanged. The data enhancement effect of the affine transformation algorithm for the SAR image is far less than that of the algorithm in this paper, which fully verifies that the data generation effect of the algorithm in this paper is better.
The data generation algorithm is used to generate SAR images. Three data sets are generated, which are the heavy fog weather situation map data set, clear weather situation map data set, and thunderstorm weather situation map data set. The experiment will be carried out on three different sets of symmetrical differential nuclear SAR image data. In the three different data sets, the number of samples in the training set, test set, and other control variables is the same, except for the different data generation algorithms used in each experiment. Table 1 records the average classification accuracy and over-fitting ratio of three comparative experiments on three data sets, and nine experiments in total. Figure 8 shows the trend of the average classification accuracy with the number of iterations on the data set.
From Table 1 and Figure 8, it can be seen that the distribution curve of the experimental group without the data enhancement algorithm is the lowest for each data set, and the average classification accuracy is the lowest, with values of 22.3%, 35.6%, and 12.1% respectively. The experimental group with this algorithm has the highest distribution curve for each data set, and the average classification accuracy is the highest, with values of 89.1%, 93.8%, and 79.5%, respectively, and the highest is 93.8%. This shows that the algorithm in this paper has a high classification accuracy. The distribution curves of the experimental group using the affine transformation algorithm on each data set are in the middle, and the average classification accuracy is low, with values of 75.4%, 77.2%, and 65.2%, respectively. The over-fitting ratio is an index reflecting the degree of over-fitting data. The lower the over-fitting ratio, the better the generalization of the model, the higher the diversity, and the worse the generalization. Table 1 shows the over-fitting ratios of nine experiments. Because of the high similarity of training samples in the experimental group without the data enhancement algorithm, the over-fitting ratios are the highest, with values of 4.48, 2.17, and 3.47, respectively. The over-fitting ratios of the experimental group using this algorithm are the lowest, with values of 1.08, 0.94, and 1.25, respectively, and the lowest is 0.94. The method of generating symmetric difference kernel SAR images has the highest diversity of edge data. In summary, this algorithm has the characteristics of fast convergence and a high average accuracy after the same iteration stability. Experiments using real data prove that this algorithm is an accurate and reliable image classification method.
3.2. Edge Detection Based on Symmetric Difference Kernel SAR Simulation
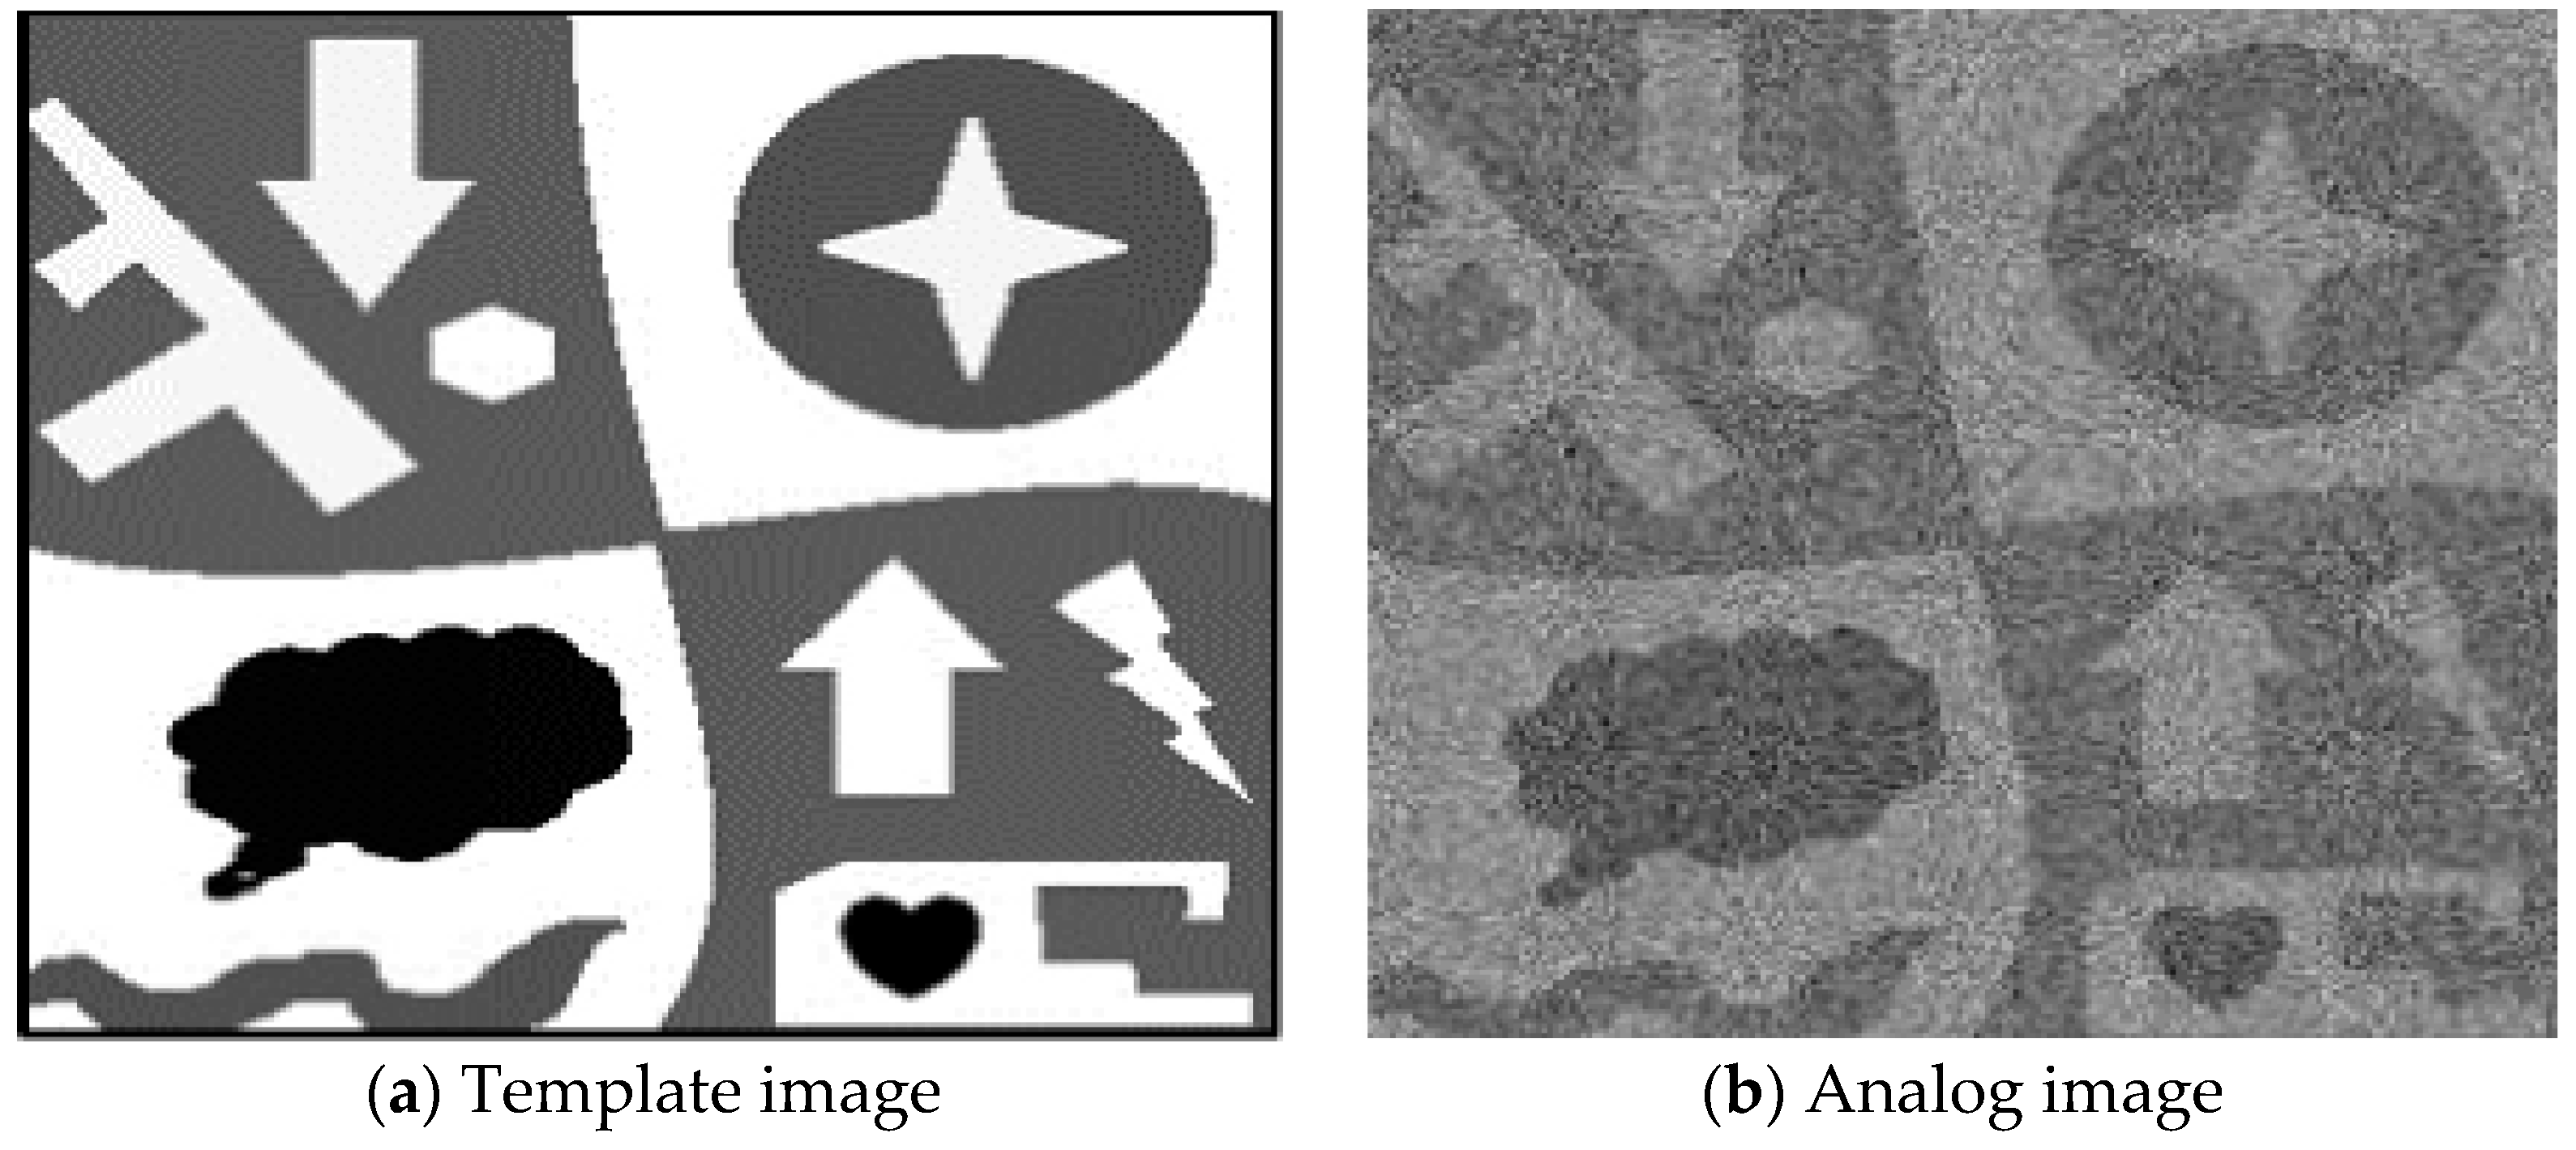
In order to detect the edges of symmetrical difference nuclear SAR images in all directions, 16 symmetrical windows corresponding to different angles are generated by a 5 × 5 window to detect edges. The SAR template image shown in Figure 9a is added with independent and identically distributed Gauss noise to form a 256 × 256 pixel analog image shown in Figure 9b.
Analysis of Figure 9 shows that the symmetrical differential SAR image edge detection algorithm based on the GAN network model can accurately detect the sample image with Gauss noise, considering different directions, and finally get a clear simulation image. The validity of the proposed detection algorithm is verified.
Five contrast algorithms are used to detect the edges of symmetrical difference SAR images. The contrast algorithms include the Canny operator, ROA detector (5 × 5 window), affine transform algorithm (5 × 5 window), ROEWA detector, and wavelet transform. All algorithm results are processed by morphological refinement. Figure 10 is the detection of edge intensity generated by symmetric difference kernel SAR simulated images by using the ROA detector, affine transform algorithm, ROEWA detector, wavelet transform, and algorithm presented in this paper.
From Figure 10, it can be seen that the ROA detector, affine transform algorithm, and wavelet transform are all disturbed by noise, so the contrast between real edge and noise background is not obvious. Although the contrast between real edge and noise background of the ROEWA detector is obvious, the lack of direction edge calculation limits its detection performance. In contrast, the window of the proposed algorithm is uniform and contains relatively more sample points. Through the detection of many directions, the interference caused by noise is reduced as much as possible, and the comparison between the real edge and the noise background is obvious.
Figure 11 is the edge result of each contrast algorithm for analog image detection. Figure 11a–e is the edge result extracted by the Canny operator, ROA detector, affine transform algorithm, ROEWA detector, and wavelet transform, and all of them are the best threshold results selected by a human. Figure 12a–c are the initial edges detected by the proposed algorithm, the edges of noise points removed by post-processing, and the final edges refined, respectively.
From Figure 11, we can see that the Canny operator can overcome the noise image well, but there will still be false edge detection. The difference between the real edge and noise of the ROA detector is very insignificant due to the limitation of the window and direction, and it has a better anti-noise performance for shallow color areas in analog images, but worse performance for deeper areas. Because the change rate in the window of the affine transform algorithm is not significant, the difference between edge and noise detected by the difference of change rate is not obvious, and there will still be many non-edge and noise points. The ROEWA detector has a limited anti-noise ability due to the lack of a multi-direction calculation, resulting in some noise points; the noise immunity of the wave transform is not ideal. In Figure 12, the edge detection results of the proposed algorithm are clearer and more complete than those of other methods, which verifies the superiority of the proposed algorithm in image edge detection.
In order to judge the accuracy of the algorithm, quantitative evaluation is adopted. Quantitative evaluation is based on the buffer analysis method, which takes the correct edge of template image as the center and the radius of three pixels as the buffer. The percentage () and the cumulative percentage () of the extracted edges falling into the buffer of different radii are calculated.Because the results of the ROA detector, affine transform algorithm, and wavelet transform have a poor visual effect, they are no longer evaluated quantitatively. They are only evaluated quantitatively by comparing the Canny operator and ROEWA detector with the algorithm presented in this paper. Table 2 is the result of quantitative evaluation.
From Table 2, 96.85% of the detection edges coincide with the correct edges, 84.29% of the detection edges fall into the buffer of a one-pixel width, 94.35% of the detection edges fall into the buffer of a two-pixels width, and 97.08% of the detection edges fall into the buffer of a three-pixels width. In the Canny operator method, 40% of the detected edges coincide with the correct edges, 79.88% of the detected edges fall into the buffer of a one-pixel width, 85.71% of the detected edges fall into the buffer of a two-pixels width, and 90.40% of the detected edges fall into the buffer of a three-pixels width. In the ROEWA detector method, 38.79% of the detection edges coincide with the correct edges, 80.89% of the detection edges fall into the buffer of a one-pixel width, 88.03% of the detection edges fall into the buffer of a two-pixels width, and 93.06% of the detection edges fall into the buffer of a three-pixels width. Based on the above quantitative evaluation results, the edge detection accuracy of the symmetrical difference kernel SAR image by using this algorithm is better than that of the Canny operator method and ROEWA detector method.
4. Discussion
In this paper, a symmetric difference kernel SAR image edge detection algorithm based on the GAN network model is proposed. By using the excellent anti-noise and direction selectivity of the Hough transform, the defect that the ROEWA detector cannot calculate the edge direction is solved. Compared with the Canny operator detection algorithm, this algorithm has simple parameter setting, less computation, and improves the robustness and accuracy of edge direction calculation. At the same time, based on the traditional edge detection algorithm, the refinement and the edge location performance are improved. This algorithm provides an effective way to detect large combined targets, such as airport runways and road networks, in SAR images. This algorithm overcomes the characteristics of the fixed shape of a traditional window and relatively few sampling points. The edge intensity image is obtained by repeated detection of the SAR image, the edge of thinned image is processed by non-extreme suppression, and the edge direction of the image is calculated by the Hough transform, so that the gray jump amplitude and gradient direction on both sides of the edge can be fully estimated in any direction detection window, and the edges in all directions can be detected under the same intensity. This is because the sampling points are more evenly distributed in the window. After the post-processing algorithm in this paper, the effect of noise can be eliminated to the greatest extent and the real edge information can be reflected; judging the edge by the absolute value of the difference weighted by the kernel function will make the comparison between the edge and non-edge more obvious, and the results will be more accurate, especially for those affected by noise. However, because the window containing more pixels will smooth the edges with sharp edges, thus losing the details of the fine edges, the problem will be further studied in the future.
5. Conclusions
In order to overcome the drawbacks of the traditional Canny operator image edge detection method, this paper proposes a symmetrical difference kernel SAR image edge detection algorithm based on the GAN network model. The GAN network model is used to generate multi-view data of a symmetrical difference kernel SAR image. According to the results of multi-view data generation, the symmetrical difference kernel SAR image edge in any direction is constructed. The model is used to detect the edges of symmetric difference kernel SAR images. The experimental results show that the distribution curve of the experimental group using this algorithm is at the top of each data set, and the average classification accuracy is the highest, which is 89.1%, 93.8%, and 79.5% respectively, and the highest is 93.8%. This algorithm has a high classification accuracy; the experimental group using this algorithm has the lowest over-fitting ratio, which is 1.08, 0.94, and 1.25, respectively. The lowest is 0.94, which shows that the diversity of edge data generated by this algorithm is the highest. In this algorithm, 96.85% of the detected edges coincide with the correct edges, 84.29% of the detected edges fall into the buffer of a one-pixel width, 94.35% of the detected edges fall into the buffer of a two-pixels width, and 97.08% of the detected edges fall into the buffer of a three-pixels width, which shows that the algorithm has a higher accuracy of image edge detection.
Author Contributions
Z.Z. carried out the Edge Detection Algorithm studies of Symmetric Difference Kernel SAR Image, and participated in the sequence alignment and drafted the manuscript. Y.L. (Yijun Liu) participated in the sequence alignment, and conceived of the study and participated in its design and coordination. Y.L. (Yang Li) and T.L. carried out the Data test. W.Y. participated in the design of the study and performed the statistical analysis. All authors read and approved the final manuscript.
Acknowledgments
This research was funded by retrieval of groundwater-ground subsidence model parameters based on high-resolution SAR satellites and gravity satellites, Liaoning Provincial Department of Education Key Laboratory Basic Research Project, No.: LJZS001. Atmospheric delay of distributed SAR satellite geometry calibration, Satellite Surveying and Mapping Technology and Applications Funding Project of the National Key Laboratory of Surveying and Mapping Geographic Information, No.: KLSMTA-201707. High-resolution radar satellite monitoring of UHV towers and wire deformation key technologies, National Natural Science Foundation, No.: 41274048. Beidou navigation baseband RF integrated SIP chip R&D and industrialization, Major projects in Guangdong Province, No. 2016B090904001. Development of surveillance video augmentation system under smog environment, No. 201604010051. Automotive Electronics Surge Protection Semiconductor TVS Product Development and Industrialization, No. 2016B090903001. Development and industrialization of professional chips for HD network cameras, No. 2016B090918126. Tianshan Innovation Team Project (No. Y744261).
Conflicts of Interest
The authors declare no conflict of interest.
References
- Li, F.; Fang, F.; Zhang, G. Unsupervised change detection in SAR images using curvelet and L1-norm based soft segmentation. Int. J. Remote Sens. 2016, 37, 3232–3254. [Google Scholar] [CrossRef]
- Yan, W.; Shi, S.; Pan, L. Unsupervised change detection in SAR images based on frequency difference and a modified fuzzy c-means clustering. Int. J. Remote Sens. 2018, 39, 3055–3075. [Google Scholar] [CrossRef]
- Wang, X.; Jia, Z.; Yang, J. Change detection in SAR images based on the logarithmic transformation and total variation denoising method. Remote Sens. Lett. 2017, 8, 214–223. [Google Scholar] [CrossRef]
- Quan, S.; Xiong, B.; Yang, L. Evaluation of different SAR change detectors based on vehicle recognition with MSTAR data set. Remote Sens. Lett. 2015, 6, 539–547. [Google Scholar] [CrossRef]
- Furse, C.M.; Chen, J.Y.; Gandhi, O.P. The use of the frequency-dependent finite-difference time-domain method for induced current and SAR calculations for a heterogeneous model of the human body. IEEE Trans. Electromagn. Compat. 2015, 36, 128–133. [Google Scholar] [CrossRef]
- Zhuang, H.; Deng, K.; Fan, H. A novel approach based on structural information for change detection in SAR images. Int. J. Remote Sens. 2018, 39, 2341–2365. [Google Scholar] [CrossRef]
- Hoekman, D.H.; Reiche, J. Multi-model radiometric slope correction of SAR images of complex terrain using a two-stage semi-empirical approach. Remote Sens. Environ. 2015, 156, 1–10. [Google Scholar] [CrossRef]
- Jia, M.; Wang, L. Novel class-relativity non-local means with principal component analysis for multitemporal SAR image change detection. Int. J. Remote Sens. 2018, 39, 1068–1091. [Google Scholar] [CrossRef]
- Verma, O.P.; Parihar, A.S. An optimal fuzzy system for edge detection in color images using bacterial foraging algorithm. IEEE Trans. Fuzzy Syst. 2017, 25, 114–127. [Google Scholar] [CrossRef]
- Saheba, S.M.; Upadhyaya, T.K.; Sharma R, K. Lunar surface crater topology generation using adaptive edge detection algorithm. IET Image Process. 2016, 10, 657–661. [Google Scholar] [CrossRef]
- Leng, X.; Ji, K.; Xing, X.; Zou, H.; Zhou, S. Hybrid bilateral filtering algorithm based on edge detection. IET Image Process. 2017, 10, 809–816. [Google Scholar] [CrossRef]
- González-Hidalgo, M.; Massanet, S.; Mir, A. On the choice of the pair conjunction–implication into the fuzzy morphological edge detector. IEEE Trans. Fuzzy Syst. 2015, 23, 872–884. [Google Scholar] [CrossRef]
- Alshayeji, M.; Alroomi, S.A.; Abed, S. Optic disc detection in retinal fundus images using gravitational law-based edge detection. Med. Boil. Eng. Comput. 2016, 55, 1–14. [Google Scholar] [CrossRef] [PubMed]
- Cai, J.; Huang, P.; Chen, L. An efficient circle detector not relying on edge detection. Adv. Space Res. 2016, 57, 2359–2375. [Google Scholar] [CrossRef]
- Zheng, Y.; Zhou, Y.; Zhou, H. Ultrasound image edge detection based on a novel multiplicative gradient and Canny operator. Ultrason. Imaging 2015, 37, 238–250. [Google Scholar] [CrossRef] [PubMed]
- Salehi, M.; Namdari, F. Fault classification and faulted phase selection for transmission line using morphological edge detection filter. IET Gener. Transm. Distrib. 2018, 12, 1595–1605. [Google Scholar] [CrossRef]
- Veni, S.H.K.; Suresh, L.P. An analysis of various edge detection techniques on illuminant variant images. Anaesthesia 2015, 61, 617. [Google Scholar]
- Sun, Q.; Liang, F.; Wang, F. Investigation on the geometrical characteristics of secondary arc by image edge detection. IEEE Trans. Plasma Sci. 2018, 46, 2016–2025. [Google Scholar] [CrossRef]
- Gao, W.; Wang, W.F. The fifth geometric-arithmetic index of bridge graph and carbon nanocones. J. Differ. Equ. Appl. 2017, 23, 100–109. [Google Scholar] [CrossRef]
- Dayal, A. Improving adaptive frameless rendering. Int. J. Comput. Appl. 2018, 40, 110–120. [Google Scholar] [CrossRef]
- Huang, A.D.; Zhong, Z.; Wu, W. An artificial neural network-based electrothermal model for gan hemts with dynamic trapping effects consideration. IEEE Trans. Microw. Theory Tech. 2016, 64, 2519–2528. [Google Scholar] [CrossRef]
- Zhang, Y.Q.; Tang, J.L. Clustering sorting algorithm based on digital channelized receiver. J. China Acad. Electron. Inf. Technol. 2017, 12, 143–148. [Google Scholar]
- Hirano, M.; Tsuzuki, N.; Ikeda, S.; Kobayashi, R. Logdrive: A proactive data collection and analysis framework for time-traveling forensic investigation in IaaS cloud environments. J. Cloud Comput. 2018, 7, 18. [Google Scholar] [CrossRef]
- Wu, J.; Zhang, C.H.; Wang, R. Harmonic detection algorithm based on third-order generalized-integrator. J. Power Supply 2018, 16, 131–136. [Google Scholar]
- Zhang, J.; Gao, A.T.; Han, Y.S. A health prognostic algorithm for Li-ion battery based on particle filter. Chin. J. Power Sources 2015, 39, 1377–1380. [Google Scholar]
- Liu, E.; Jing, X.J. PD algorithm based on two self-balancing vehicle upright control. Autom. Instrum. 2015, 1, 203–206. [Google Scholar]
- Han, Y.; Byun, Y. Automatic and accurate registration of VHR optical and SAR images using a quadtree structure. Int. J. Remote Sens. 2015, 36, 2277–2295. [Google Scholar] [CrossRef]
- Yang, A.; Li, Y.; Kong, F.; Wang, G.; Chen, E. Security control redundancy allocation technology and security keys based on Internet of Things. IEEE Access 2018, 6, 50187–50196. [Google Scholar] [CrossRef]
- Mnak, G.; Altun, I.; Olgun, M. Fixed points of f-contractive type fuzzy mappings. J. Intell. Fuzzy Syst. 2017, 33, 1435–1439. [Google Scholar] [CrossRef]
- Esteban, M.; Núñez, E.P.; Torres, F. Bifurcation analysis of hysteretic systems with saddle dynamics. Appl. Math. Nonlinear Sci. 2017, 2, 449–464. [Google Scholar] [CrossRef]
- Simone, A.; Navara, M.; Pták, P. States on systems of sets that are closed under symmetric difference. Math. Nachr. 2016, 288, 1995–2000. [Google Scholar] [CrossRef]
Figure 1.
Overall method step diagram.

Figure 2.
GAN network model structure diagram.

Figure 3.
Multi view data generation framework for symmetric difference kernel SAR images based on the GAN network model.
Figure 3.
Multi view data generation framework for symmetric difference kernel SAR images based on the GAN network model.

Figure 4.
Initial edges remove non-edge and noise points.

Figure 5.
The algorithm flow.

Figure 6.
The original SAR image.

Figure 7.
Comparison of Enhancement Effects of Different Data Generation Algorithms.

Figure 8.
Average correct classification rate and iteration curve.


Figure 9.
Template image and Analog image.

Figure 10.
Contrast algorithm and edge strength of the algorithm.


Figure 11.
Edge results of each comparison algorithm.

Figure 12.
Edge results of the algorithm in this paper.


Table 1.
Average classification accuracy and over fitting ratio of experimental data.
| Number | Data Set | Data Generation Algorithm | Average Classification Accuracy/% | Overfitting Ratio |
|---|---|---|---|---|
| 1 | Heavy fog weather situation map | None | 22.3 | 4.48 |
| 2 | Heavy fog weather situation map | Affine transformation algorithm | 75.4 | 1.33 |
| 3 | Heavy fog weather situation map | Algorithm in this paper | 89.1 | 1.08 |
| 4 | Clear weather situation map | None | 35.6 | 2.17 |
| 5 | Clear weather situation map | Affine transformation algorithm | 77.2 | 1.21 |
| 6 | Clear weather situation map | Algorithm in this paper | 93.8 | 0.94 |
| 7 | Thunderstorm weather situation map | None | 12.1 | 3.47 |
| 8 | Thunderstorm weather situation map | Affine transformation algorithm | 65.2 | 1.31 |
| 9 | Thunderstorm weather situation map | Algorithm in this paper | 79.5 | 1.25 |
Table 2.
Results of quantitative comparison of the comparison algorithm and the algorithm in this paper.
Table 2.
Results of quantitative comparison of the comparison algorithm and the algorithm in this paper.
| This Paper’s Algorithm | Canny Operator | ROA Detector | |
|---|---|---|---|
| B0 | 96.85 | 40.00 | 38.79 |
| S0 | 54.97 | 40.00 | 38.79 |
| B1 | 44.29 | 24.91 | 42.10 |
| S1 | 84.29 | 79.88 | 80.89 |
| B2 | 10.06 | 5.83 | 7.14 |
| S2 | 94.35 | 85.71 | 88.03 |
| B3 | 2.73 | 4.69 | 5.03 |
| S3 | 97.08 | 90.40 | 93.06 |
© 2019 by the authors. Licensee MDPI, Basel, Switzerland. This article is an open access article distributed under the terms and conditions of the Creative Commons Attribution (CC BY) license (http://creativecommons.org/licenses/by/4.0/).
Share and Cite
MDPI and ACS Style
Zhang, Z.; Liu, Y.; Liu, T.; Li, Y.; Ye, W. Edge Detection Algorithm of a Symmetric Difference Kernel SAR Image Based on the GAN Network Model. Symmetry 2019, 11, 557. https://doi.org/10.3390/sym11040557
AMA Style
Zhang Z, Liu Y, Liu T, Li Y, Ye W. Edge Detection Algorithm of a Symmetric Difference Kernel SAR Image Based on the GAN Network Model. Symmetry. 2019; 11(4):557. https://doi.org/10.3390/sym11040557
Chicago/Turabian StyleZhang, Ziwen, Yijun Liu, Tie Liu, Yang Li, and Wujian Ye. 2019. "Edge Detection Algorithm of a Symmetric Difference Kernel SAR Image Based on the GAN Network Model" Symmetry 11, no. 4: 557. https://doi.org/10.3390/sym11040557
Note that from the first issue of 2016, this journal uses article numbers instead of page numbers. See further details here.