
Reduction in Apparent Permeability Owing to Surface Precipitation of Solutes by Drying Process and Its Effect on Geological Disposal
Department of Quantum Science and Energy Engineering, Graduate School of Engineering, Tohoku University, Aoba 6-6-01-2, Aramaki, Aoba, Sendai 980-8579, Japan
*
Authors to whom correspondence should be addressed.
Minerals 2024, 14(4), 428; https://doi.org/10.3390/min14040428
Submission received: 15 February 2024
/
Revised: 31 March 2024
/
Accepted: 18 April 2024
/
Published: 20 April 2024
(This article belongs to the Section Environmental Mineralogy and Biogeochemistry)
Abstract
:Disposal tunnels in geological repositories are ventilated continuously for over 50 years until their closure. Under these conditions, an unsaturated zone of mixed liquid and gas phases forms around the tunnels. Moreover, drying is assumed to progress from the host rock to the tunnels. To understand these drying processes, this study investigated the migration and precipitation of solutes via capillary forces during drying in packed columns using silica sand or glass beads as packed layers and X-ray CT analysis. In addition, the apparent permeability of a column packed with silica sand containing precipitation was examined using a flow experiment. The results indicate that the precipitation and accumulation of solutes were significant near the drying surfaces of the columns. The apparent mass transfer coefficient at a relatively early stage of the drying process indicates that the migration rate of solutes depends strongly on the capillary forces during the drying process. Furthermore, the apparent permeability of the columns with precipitation decreased significantly. These indicate that the precipitation and accumulation of solutes with drying in the groundwater reduce the porosity and permeability, and the advection of groundwater around the repository may be suppressed.
1. Introduction
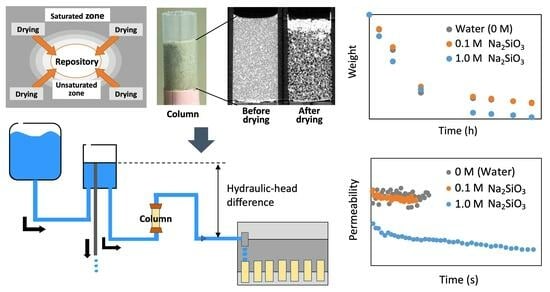
High-level radioactive waste is planned for underground geological disposal at depths larger than 300 m. Its implementation in Japan is estimated to require approximately 20, 10, 50, and 10 years for site investigations, repository construction, operation, and repository closure, respectively [1,2]. That is, the access tunnels of the repository would be ventilated for over 50 years until closure. Under these ventilation conditions, an unsaturated zone of mixed liquid and gas phases forms around the tunnels, and drying progresses from the host rock (groundwater-saturated zone) into the tunnels (unsaturated zone). The host rocks surrounding the repository are plutonic and sedimentary, with a low hydraulic conductivity of 10−7 m/s or less, and the host rock pores and groundwater flow paths are considered fine [2]. The drying process for such fine porous media continuously results in a capillary effect (an effect of solution being supplied to the surface by capillary force) and shifts the solute toward the dried surface. The solute may then be precipitated near the drying surface [3,4].
In contrast, the cementitious materials used in the construction of repositories and tunnels form a highly alkaline environment around the repository [5,6]. This alkalinity causes silicate minerals in the bedrock to dissolve in the groundwater. This, in turn, increases the concentration of silicic acid in the groundwater [7,8]. In this environment, the precipitates associated with desiccation are silicates. The precipitated silicate can then reduce the hydraulic conductivity of the groundwater around the repository. This suppresses the migration of radionuclides dissolved in the groundwater.
Previous studies on solute precipitation by drying focused on the efflorescence of salts associated with the drying of porous building materials [9,10,11,12] and the salinization of soils affecting crop production [13,14]. In a modeling study, Huinink et al. developed a simple model based on the advection–diffusion equation for the transportation behavior of ions in a drying porous medium to reveal the transportation properties of ions in a similar medium [15]. Guglielmini analyzed the drying process in porous materials saturated with a salt solution using a one-dimensional model for drying processes developed by Huinink et al. [15]. They also reported an intermediate regime when the convection and diffusion fluxes were balanced [16]. Li and Guo studied the effects of salt precipitation, evaporation flux, and surface temperature in homogeneous and heterogeneous porous media [17]. Eloukabi et al. reported the influence of the average pore size of the porous media and the initial salt concentration on the drying process in the presence of dissolved NaCl [18].
However, the drying of solutes in groundwater during radioactive waste disposal has not been reported in terms of permeability change. To understand the drying processes related to radioactive waste repositories, this study focused on the migration and precipitation of solutes associated with the drying process in porous media. The porosity of the columns and the change in apparent permeability were evaluated experimentally using packed columns with silica sand or glass beads filled with a high concentration of CsCl or Na2SiO3 solution through drying experiments using X-ray computed tomography (X-ray CT) analysis and flow experiments.
2. Materials and Methods
2.1. Column Preparation and Drying Experiment
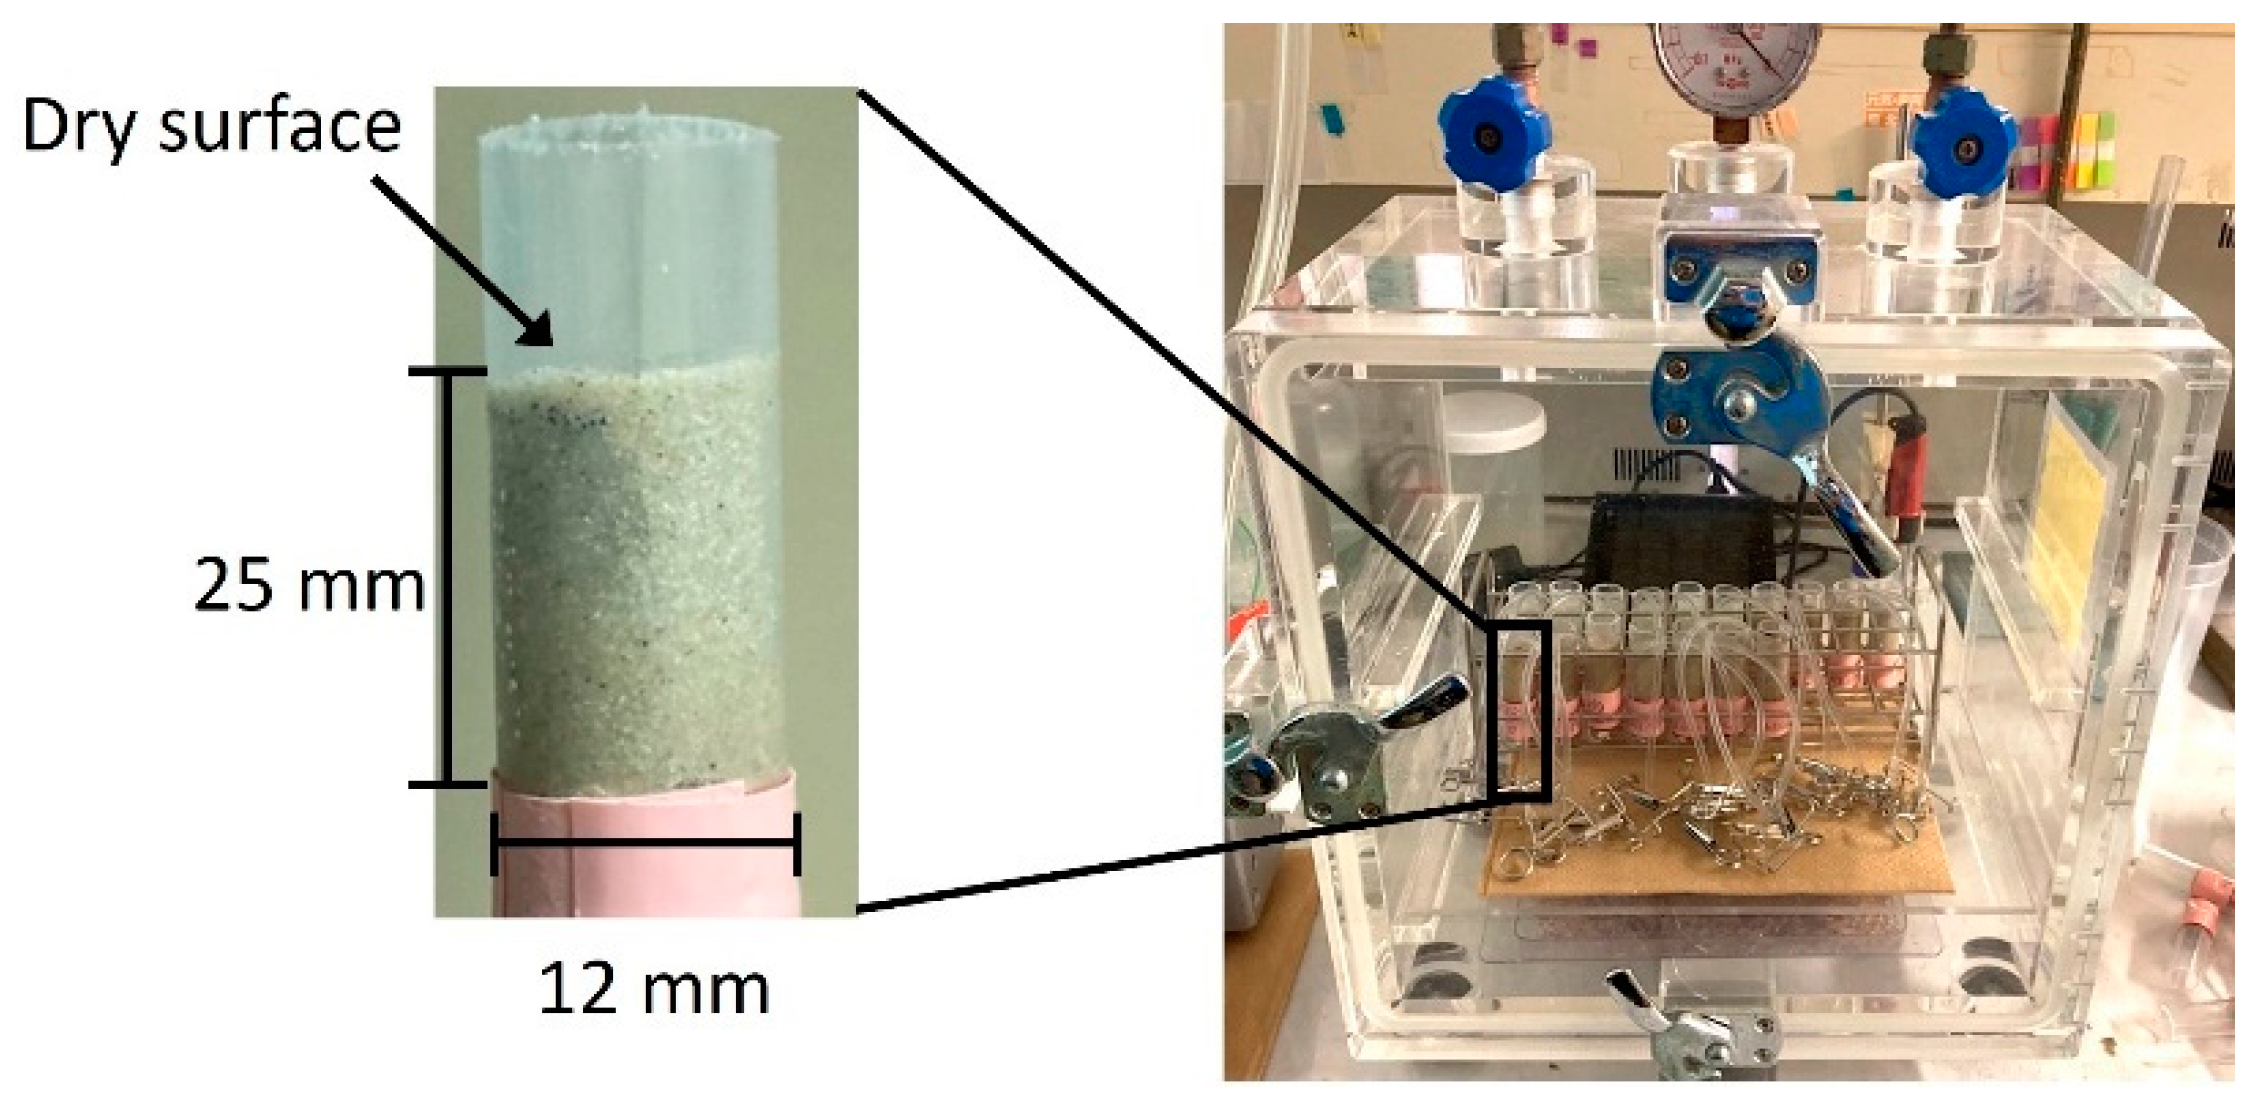
In the column preparation, silica sand (TOHOKU KEISYA, No. 6; particle size (φ) 0.35 mm; particle sharp is granular; composition is shown in Table 1) or glass beads (AS ONE; φ 0.50–0.71 mm and 0.99–1.40 mm; particle shape is uniformly spherical) were packed into a column (inner diameter: 12.8 mm and packing length: 25 mm). Silica sand was used to simulate the host rock in the actual underground environment around the repository. In addition, glass beads were used in a preliminary experiment to establish a method for analysis by X-ray CT and evaluation of porosity in the drying experiment. Hereinafter, silica sand is referred to as SS, and glass beads are referred to as GB (GB φ0.5 and GB φ1.0). Before packing, the packing particles were washed with nitric acid and pure water until the pH remained constant at 6. The packed columns were filled with CsCl or Na2SiO3 solution at concentrations of 0, 0.1, and 1.0 M. These CsCl solutions were used in this study because of their high X-ray absorption capacity and convenient observation using X-ray CT. In addition, Na2SiO3 solutions were used based on the assumption of a higher concentration of silicic acid leaching from the host rocks around the repository because of the highly alkaline conditions caused by cementitious materials. After saturating the packed columns with the CsCl or Na2SiO3 solution, the columns were dried in a vacuum desiccator containing silica gel (Figure 1). A rubber stopper was attached to one side of the column so that only the top of the column was dry. During drying, the weight changes in the columns were monitored for several weeks.
In addition, before and after drying, the columns were analyzed using X-ray CT (Comscantechno, ScanXmate-D225RSS270) to visualize the migration and precipitation of solutes by drying and to obtain the CT value distribution. The CT values are numerical values of the X-ray absorptivity of an object, with 0 for water and −1000 for air. The porosities of the columns were determined based on the CT values and the subsequent equations. The effective porosity of the column with precipitation after drying (no water content), , is given by
where is the CT value of the column containing the solid phase (original packed particles), air, and precipitated particles (PP) obtained by X-ray CT analysis, and is that of the column containing only the solid phase and PP. Here, the initial porosity of the whole column with no PP, , is given by
where is the average CT value of the column containing only the solid phase and air (drying conditions) obtained by X-ray CT analysis. Since the value of is experimentally obtained in advance, is determined using Equation (2), and is calculated using Equation (1) at each measurement point. The values of for the columns prepared in this study were in the range of 0.35–0.38. Meanwhile, the saturation rate of PP, , of the column containing solid phase, air, and PP after drying is expressed by
Additionally, Equations (1)–(3) yields
On the other hand, an equation using CT values has been proposed by Rangel-German and Kovscek [20] to estimate the water saturation (ratio), Sw, in a column under the water-saturated condition containing solid phase, air, and water (with no precipitate) and is widely used.
2.2. Flow Experiments
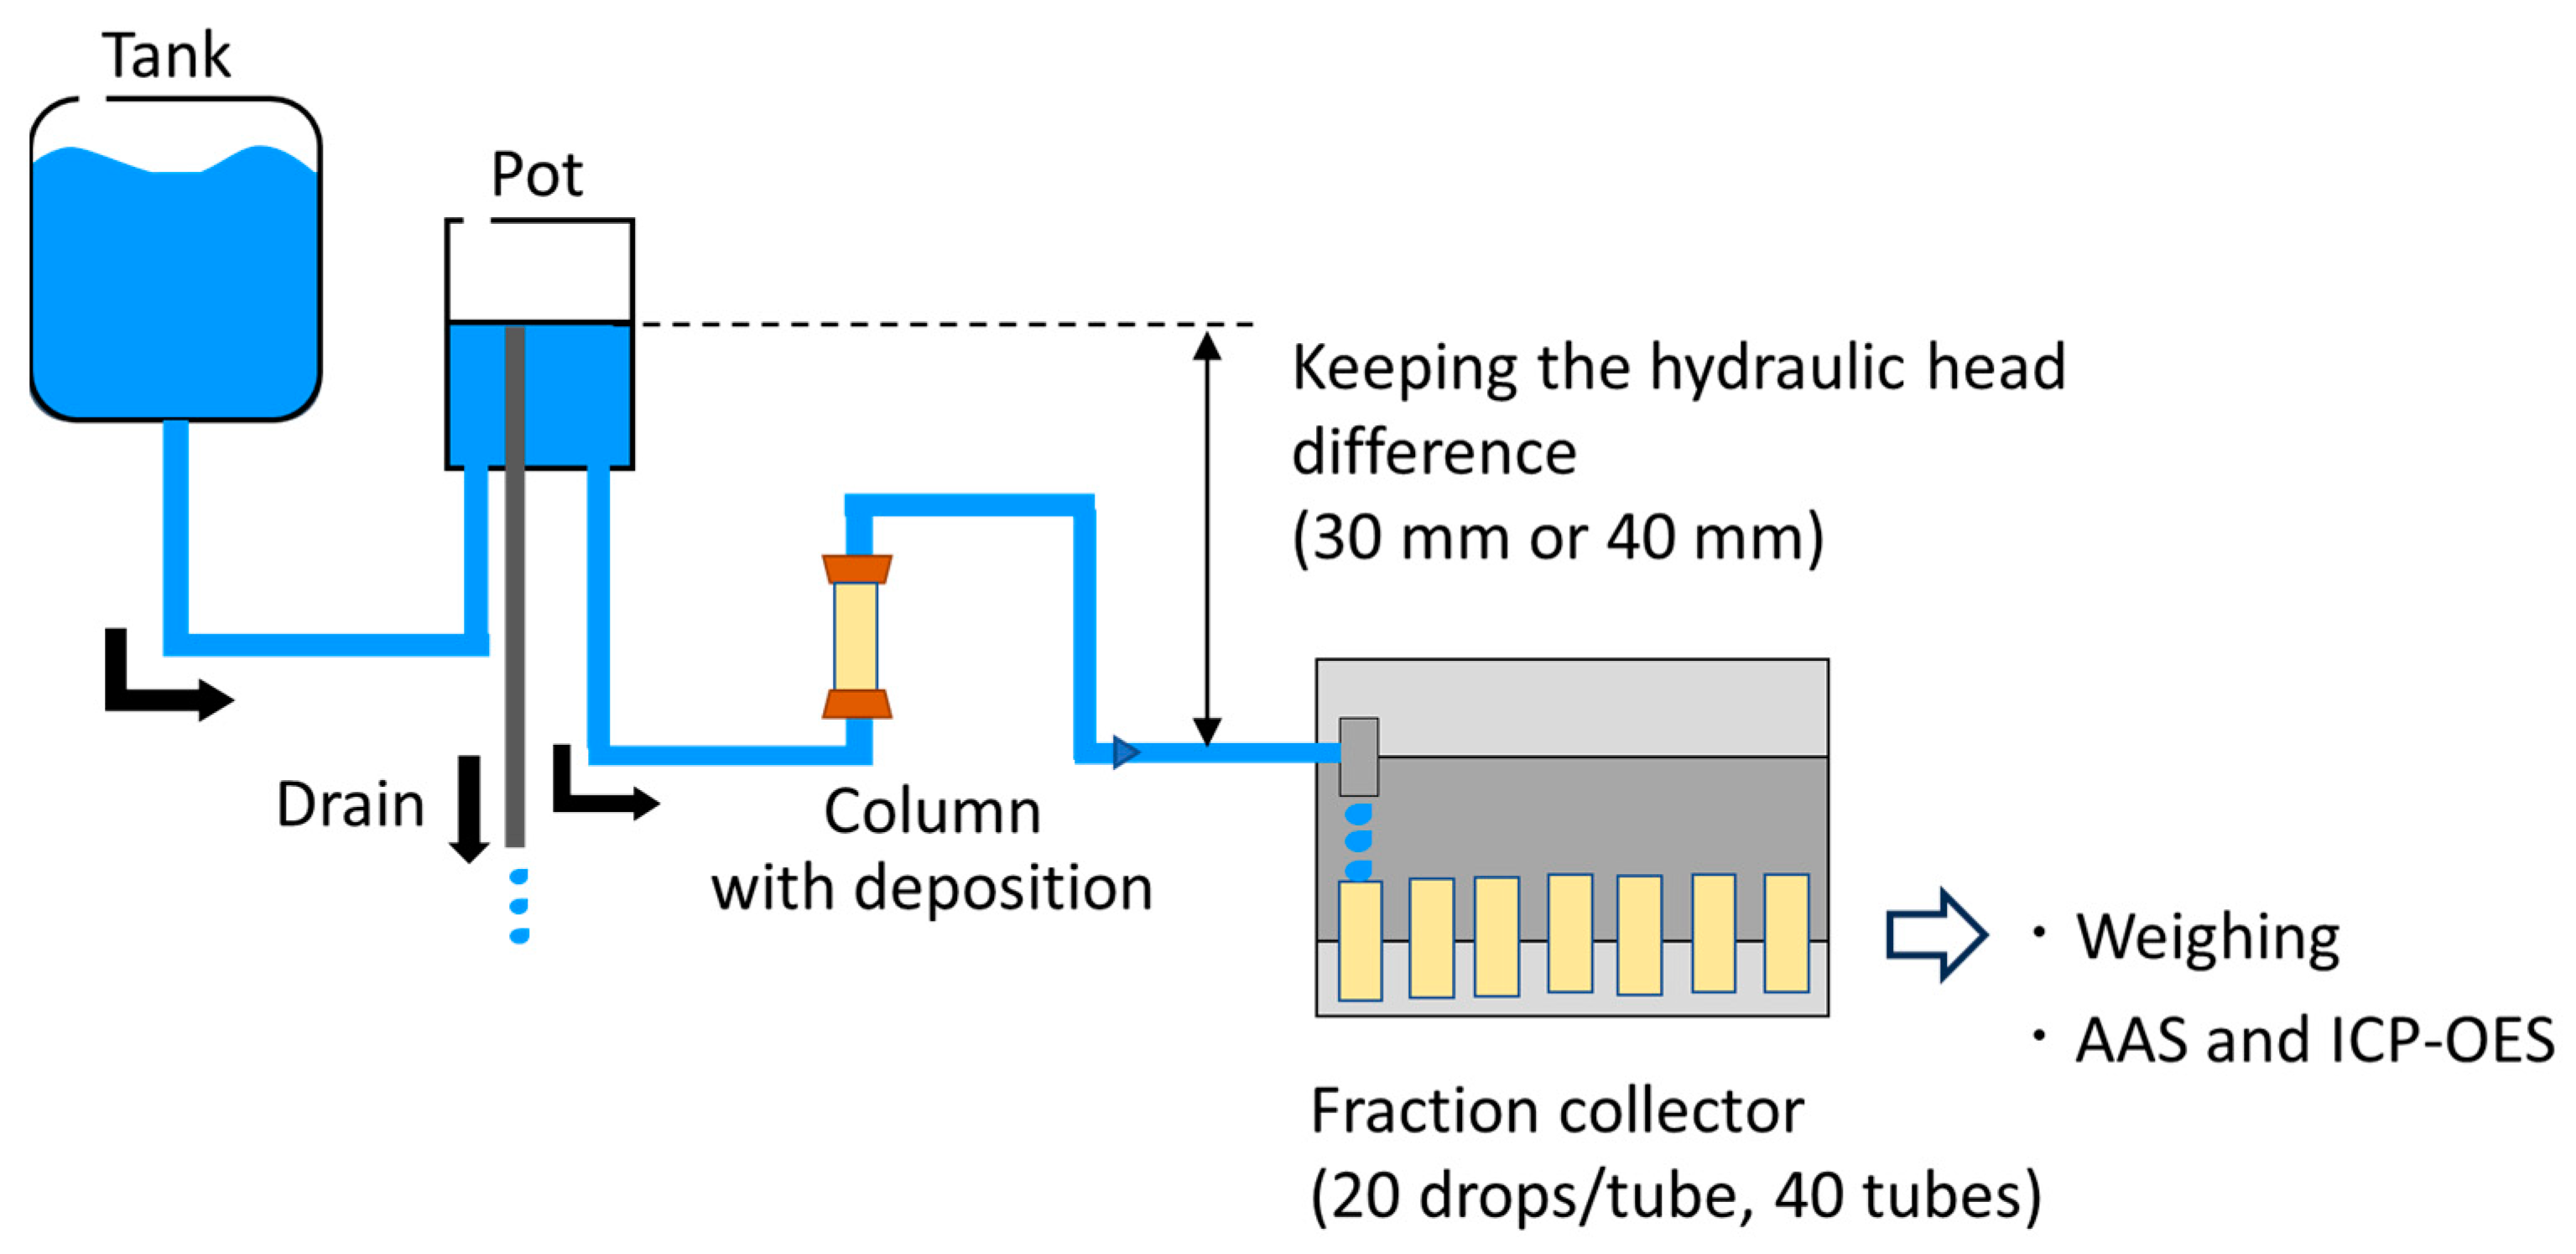
The change in permeability of the SS columns with precipitation after drying was investigated through a flow experiment using an overflow system under a constant pressure gradient. A schematic of the overflow system is shown in Figure 2. In this system, a tank was filled with a sufficient amount of solution that continuously flowed into a pot. The height of the solution surface inside the pot was maintained constant by the overflow mechanism. The solution flowed into the column with a constant hydraulic head difference between the solution surface in the pot and the solution outlet in the fraction collector. In this study, the hydraulic head difference was set to 0.3 m.
Table 2 summarizes the fluid conditions used in the flow experiment. An identical concentration of CsCl (0.1 M or 1.0 M) was used for the SS column that was filled with CsCl solution and dried. In addition, pure water was used for the SS column that was filled with Na2SiO3 solution and dried. In the surrounding repository, silicic acid dissolves from the host rock and becomes highly concentrated due to the highly alkaline conditions caused by the cementitious components in the groundwater, while the pH decreases to a neutral pH of 8 by mixing with the original groundwater, and the concentration of silicic acid also decreases to approximately 2 × 10⁻³ M of its solubility. The use of pure water as the fluid in the experiment simulates the flow of groundwater containing low concentrations of silicic acid into the porous media where the silicic acid was precipitated during the drying process.
During the flow experiment, 20 drops/tube of effluent were collected in 40 tubes using a fraction collector. The time required to collect 20 drops/tube and the weight of the collected effluent were determined to evaluate the apparent permeability. The concentrations of the dissolved components in the effluents were determined using atomic absorption spectrometry (AAS, iCE 3300, Thermo Fisher Scientific, Waltham, MA, USA) and inductively coupled plasma optical emission spectroscopy (ICP-OES; Avio 550, Perkin Elmer, Waltham, MA, USA).
Here, the permeability (m2) can be calculated based on Darcy’s law:
where Q is the volume flow rate (m3/s), A is the cross-sectional area of the column (m2), Q/A is Darcy fluid flow velocity (m/s), µ is the fluid viscosity (Pa·s), l is the length of the packed layer (m), is the fluid density (g/m3), g is the acceleration of gravity (m/s2), and Δℎ is the hydraulic head difference (m). In the experiment, Q (m3/s) was obtained from the weight of 20 drops/tube of effluent and the time required for collection.
3. Results and Discussion
3.1. Weight Change and X-ray CT Analysis in Drying Experiments
3.1.1. Column Packed with GB
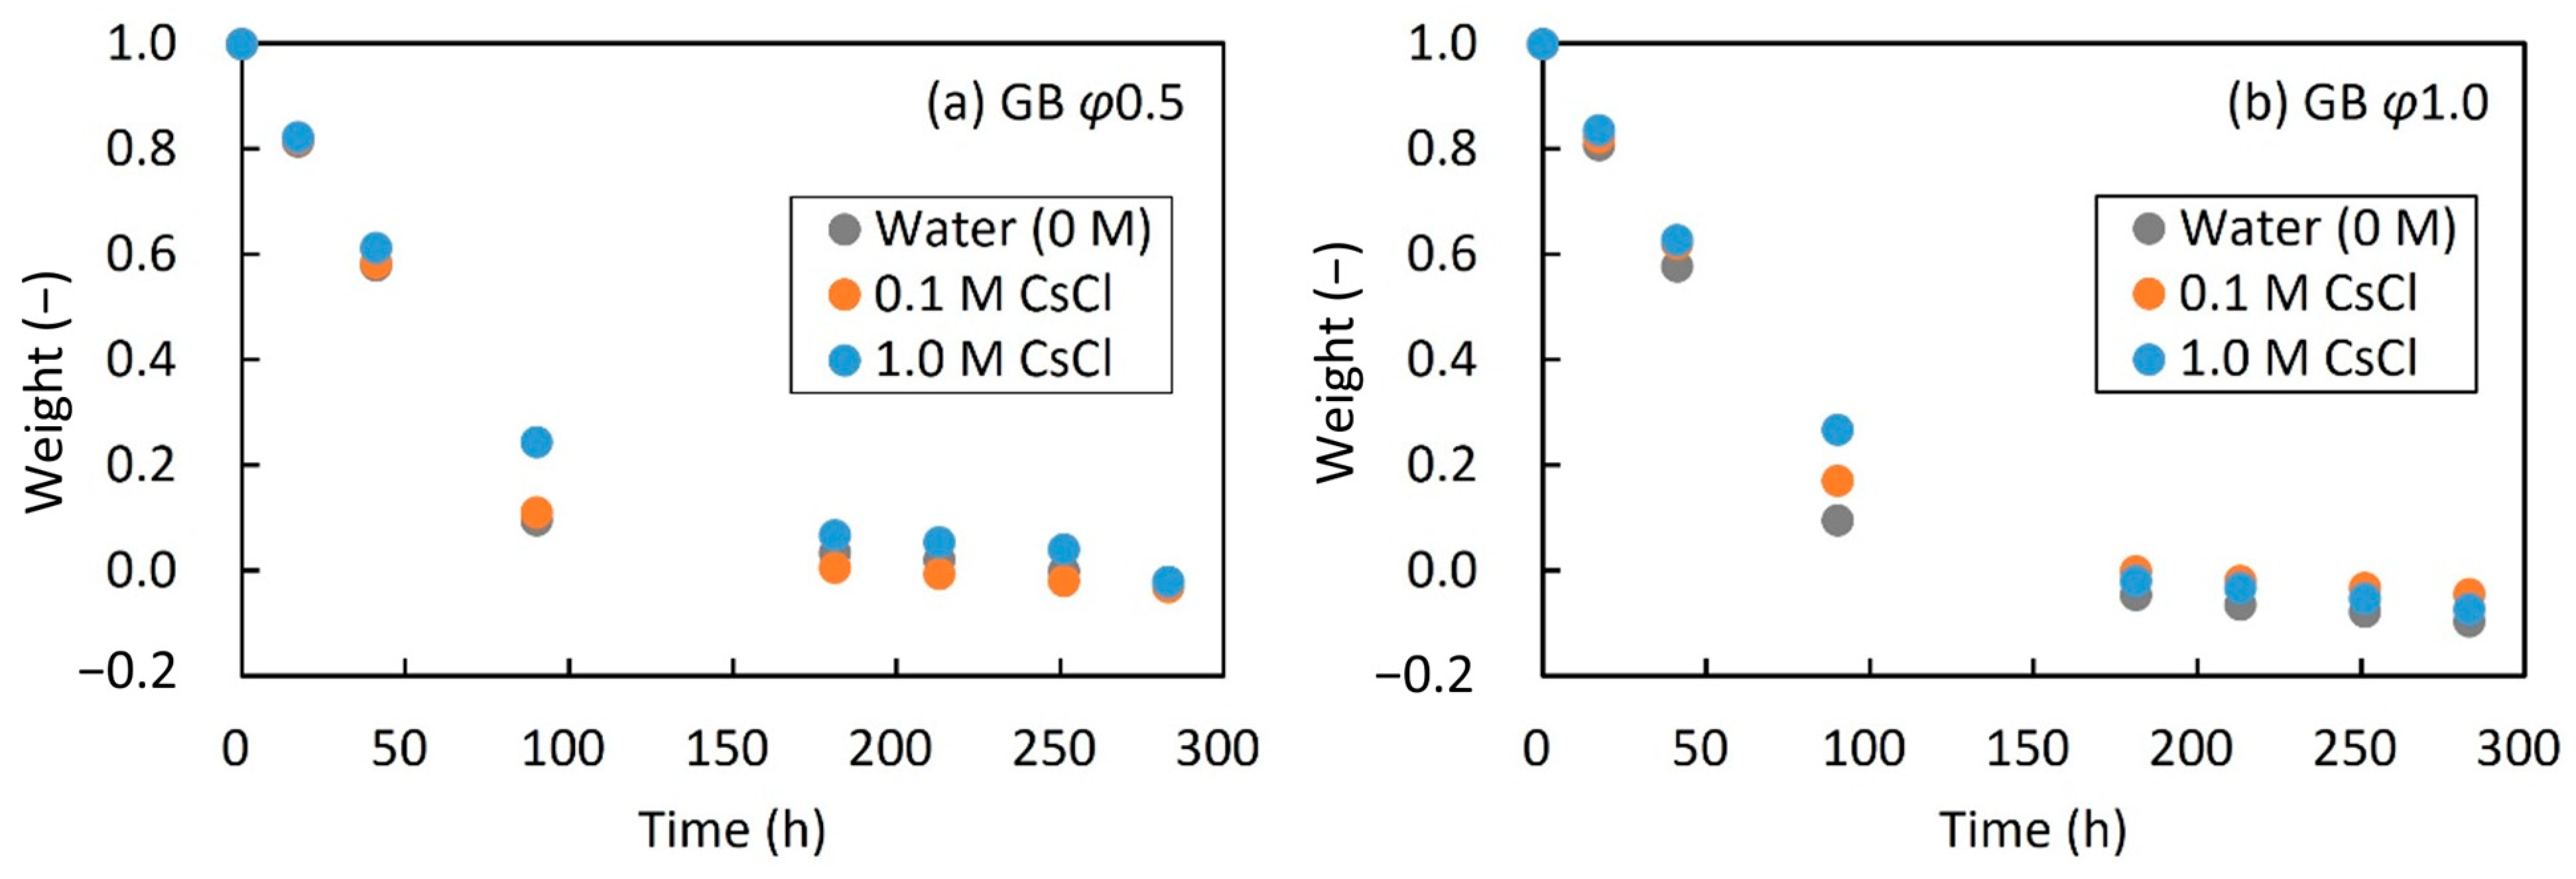
As a preliminary experiment, drying experiments were performed with the GB φ0.5 and GB φ1.0 columns. Figure 3 shows the weight changes over time for the GB columns filled with 0 (pure water), 0.1, and 1.0 M CsCl. The negative weight presented in Figure 3 occurred owing to the evaporation of the solution in the tube connected to the rubber stopper at the bottom of the column. In Figure 3, the slope of the first half (~about 100 h) is steep for all the conditions, and the second half is more gradual. This is probably due to the fact that the first half is the free water drying regime, while the second half is mainly drying surface adsorbed water on the packing particles. In addition, the drying rate for the GB columns filled with 1.0 M CsCl is marginally lower than that for the GB columns filled with pure water and 0.1 M CsCl. This indicates that the precipitation of solutes in the pores between the GB particles is likely to have reduced the drying rate.
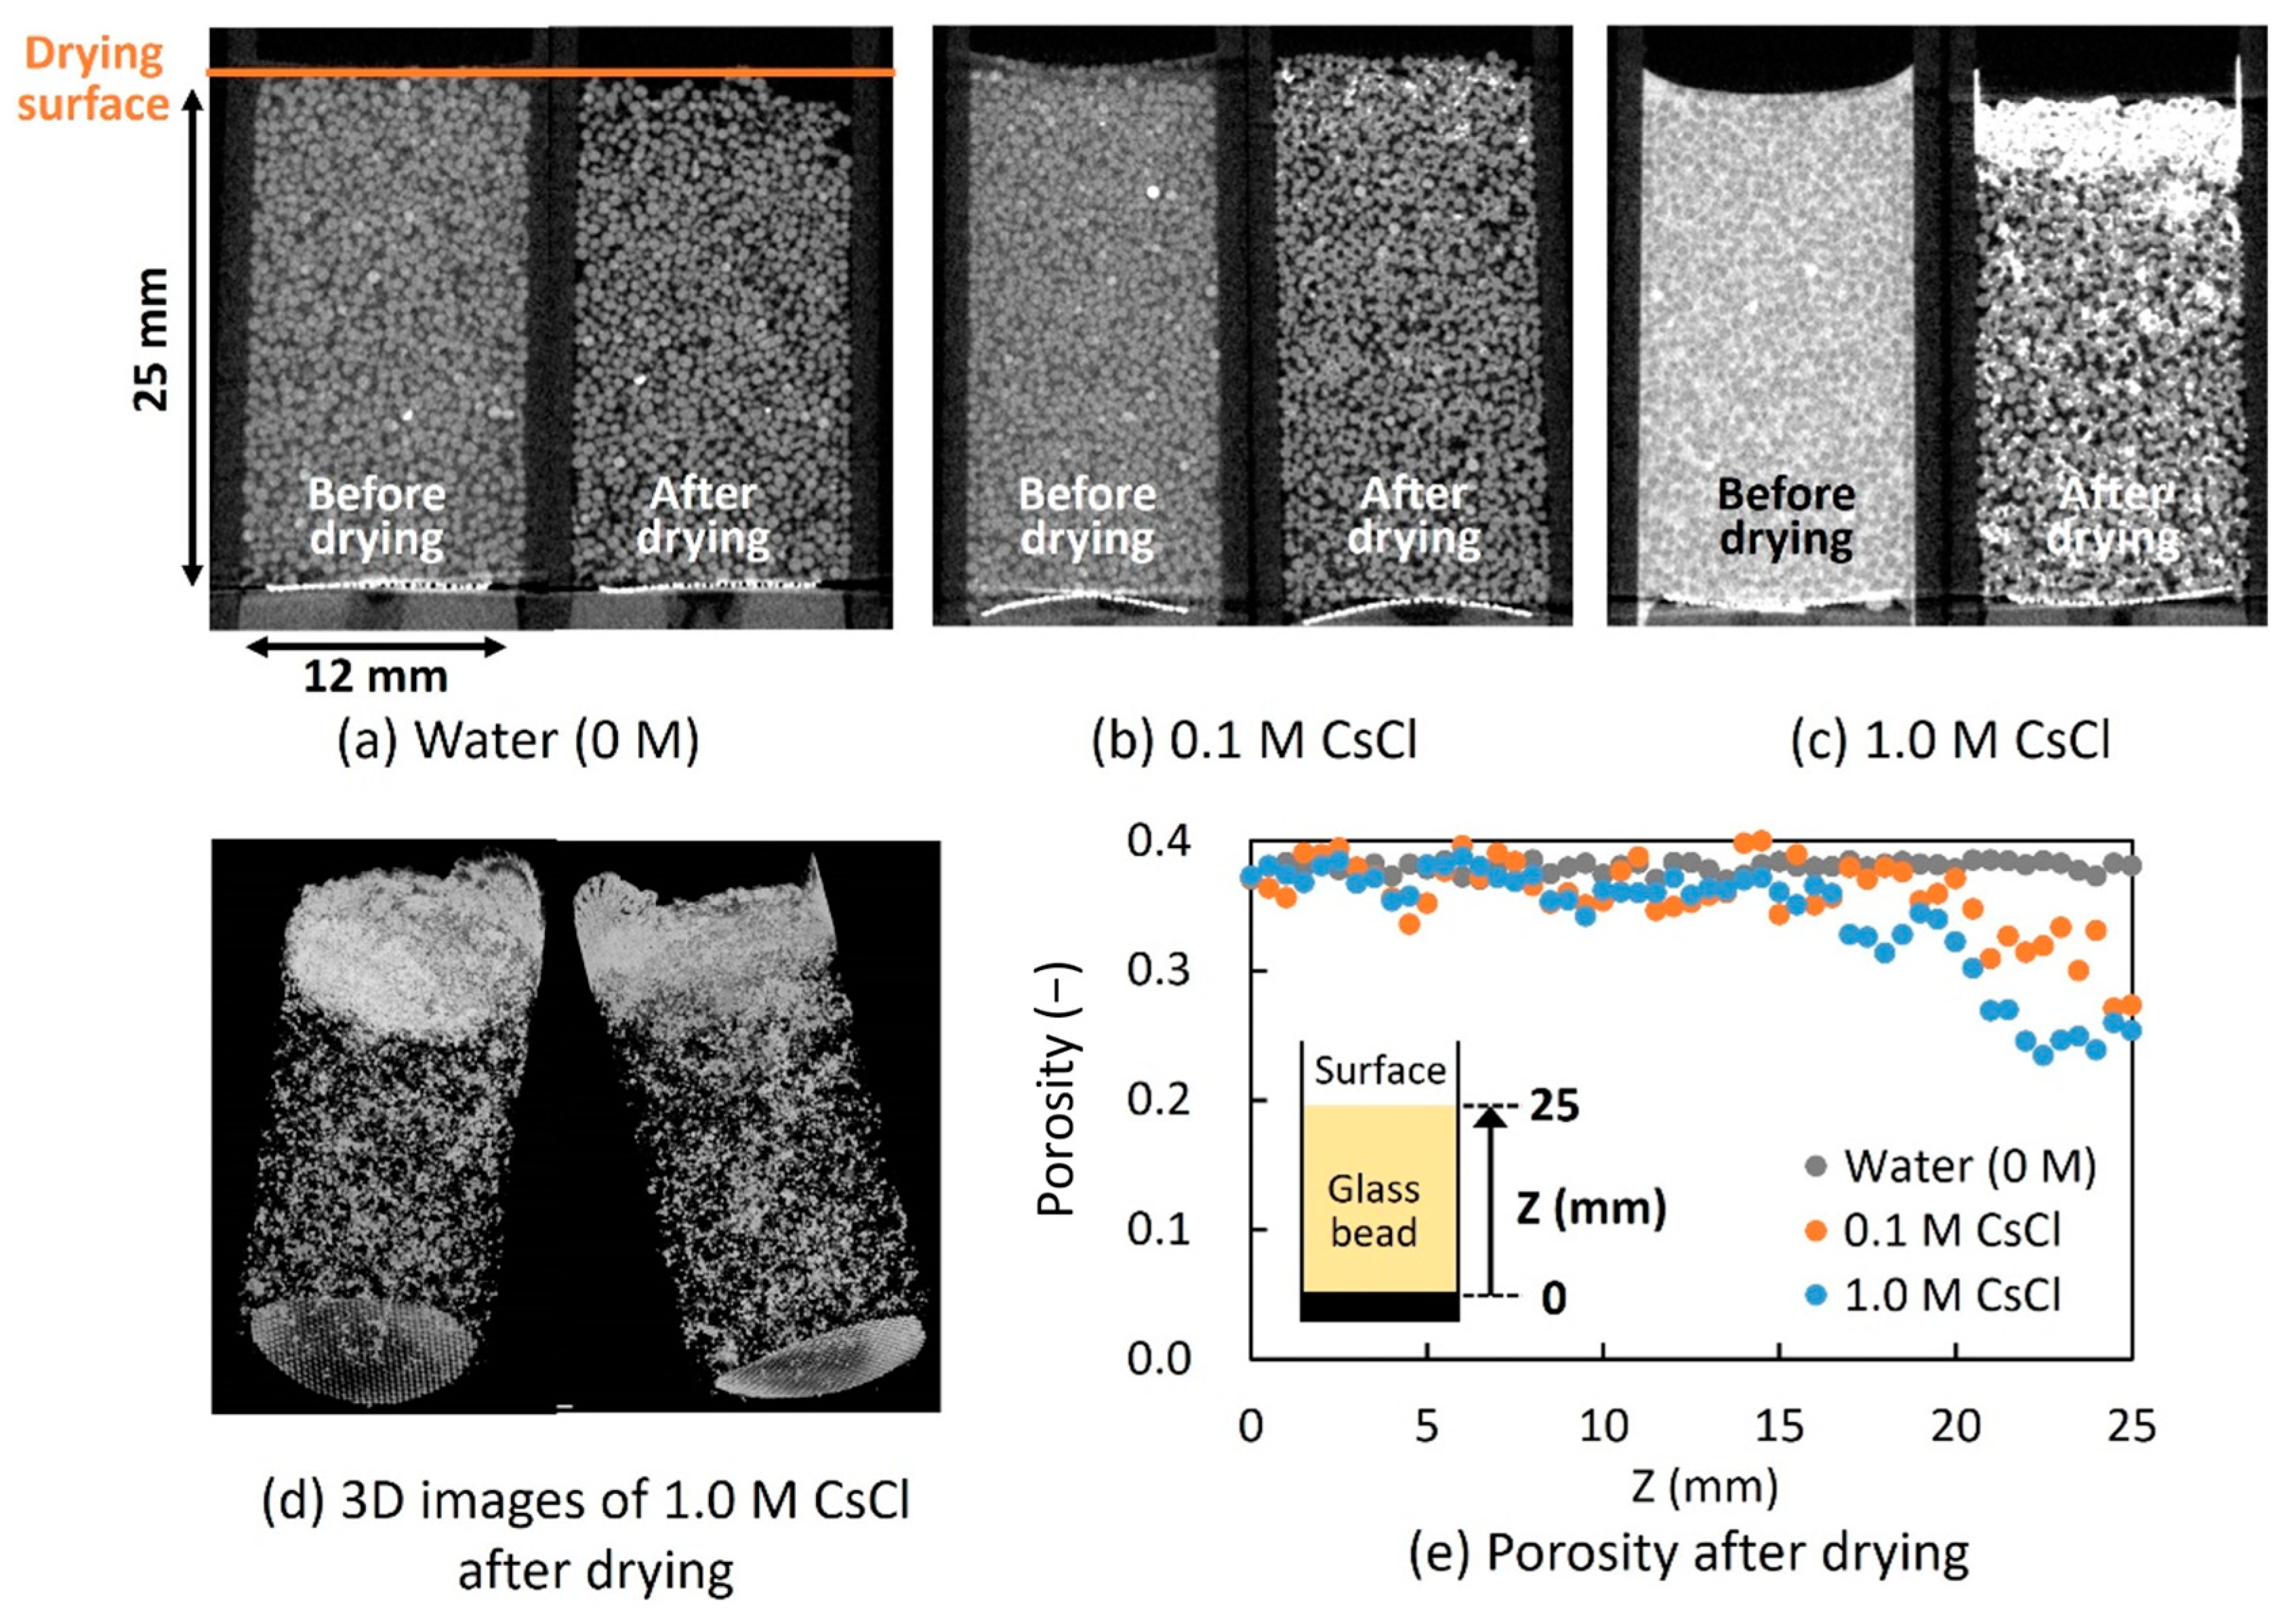
Figure 4 and Figure 5 show the X-ray CT images before and after the drying experiment, and the porosity after drying was determined from the CT values for the GB columns. In the X-ray CT images, the areas of high X-ray absorption are presented in white. In Figure 4e and Figure 5e, the x-axis corresponds to the height direction of the columns. The plots show the average porosity values in the width direction at each height.
Before drying, a white color was observed for the entire GB column filled with CsCl. This indicated that Cs with a high X-ray absorption capacity were present throughout the column. After drying, a white distribution was observed. This indicated the precipitation of the CsCl solute in the pores on the surface of the GB particles. In addition, a gradient of the white distribution was observed in the GB columns filled with 1.0 M CsCl; the white distribution became more pronounced near the drying surface (top of the images in Figure 4c,d and Figure 5c,d). With regard to the porosity shown in Figure 4e and Figure 5e, although it did not differ along the column height direction (z) in the GB columns filled with pure water, a marginal decrease near the drying surface was observed in the GB columns filled with 1.0 M CsCl. These results indicate that in the GB columns filled with CsCl, the solute was precipitated and accumulated, decreasing the porosity near the drying surface. That is, in the GB columns filled with 1.0 M CsCl, the effective drying surface area of the solution was limited by the precipitation of solute near the drying surface, resulting in a relatively low drying rate. However, although mass transfer owing to capillary force [21] or the wettability of glass tends to decrease with larger particle sizes and result in a lower drying rate, no difference in drying rate was remarkably observed between columns with different particle sizes in this study.
3.1.2. Column Packed with SS
The SS columns were designed to simulate the sedimentary rocks in an underground environment where a radioactive waste repository is constructed. The filled solutions for the SS column were pure water, 0.1 and 1.0 M CsCl, and 0.1 and 1.0 M Na2SiO3. Na2SiO3 was used to simulate the silicic acid leaching from host rocks under the highly alkaline conditions formed by the use of cementitious materials in repository construction.
Figure 6 shows the weight changes of the SS columns during drying over time. The drying rate of the SS column filled with 1.0 M CsCl was almost the same as that of the GB columns. However, the drying rate was independent of the concentration of Na2SiO3. This may be a result of the fact that the negative weight (degree of dryness in the tube) in the second half was larger for 1.0 M Na2SiO3. In addition, the slope of the first half of Figure 6 is steep for all the SS column conditions, similar to that for the GB columns shown in Figure 3. This indicates that the first half (~about 100 h) is in the free water drying regime, while the second half is mainly the drying of surface adsorbed water on the packing particles. That is, the rate-limiting factor for the drying rate is the mass transfer at the drying surface. More specifically, if the mass transfer by capillary force in the column with drying is rate-limiting, the rate of mass transfer by capillary force will vary as drying progresses. However, during the experiments, the drying rate remained nearly constant over time at a relatively early stage. This indicated that the mass transfer to the drying surface by capillary forces occurred quickly in comparison with the evaporation of the solution. Here, the precipitation of CsCl and Na2SiO3 is considered to have occurred from the state of ions or molecules uniformly dispersed in solution to high concentrations by drying and then to surface accumulation as precipitated particles via colloids, so the term “mass transfer” in this study refers to includes colloidal transport [3].
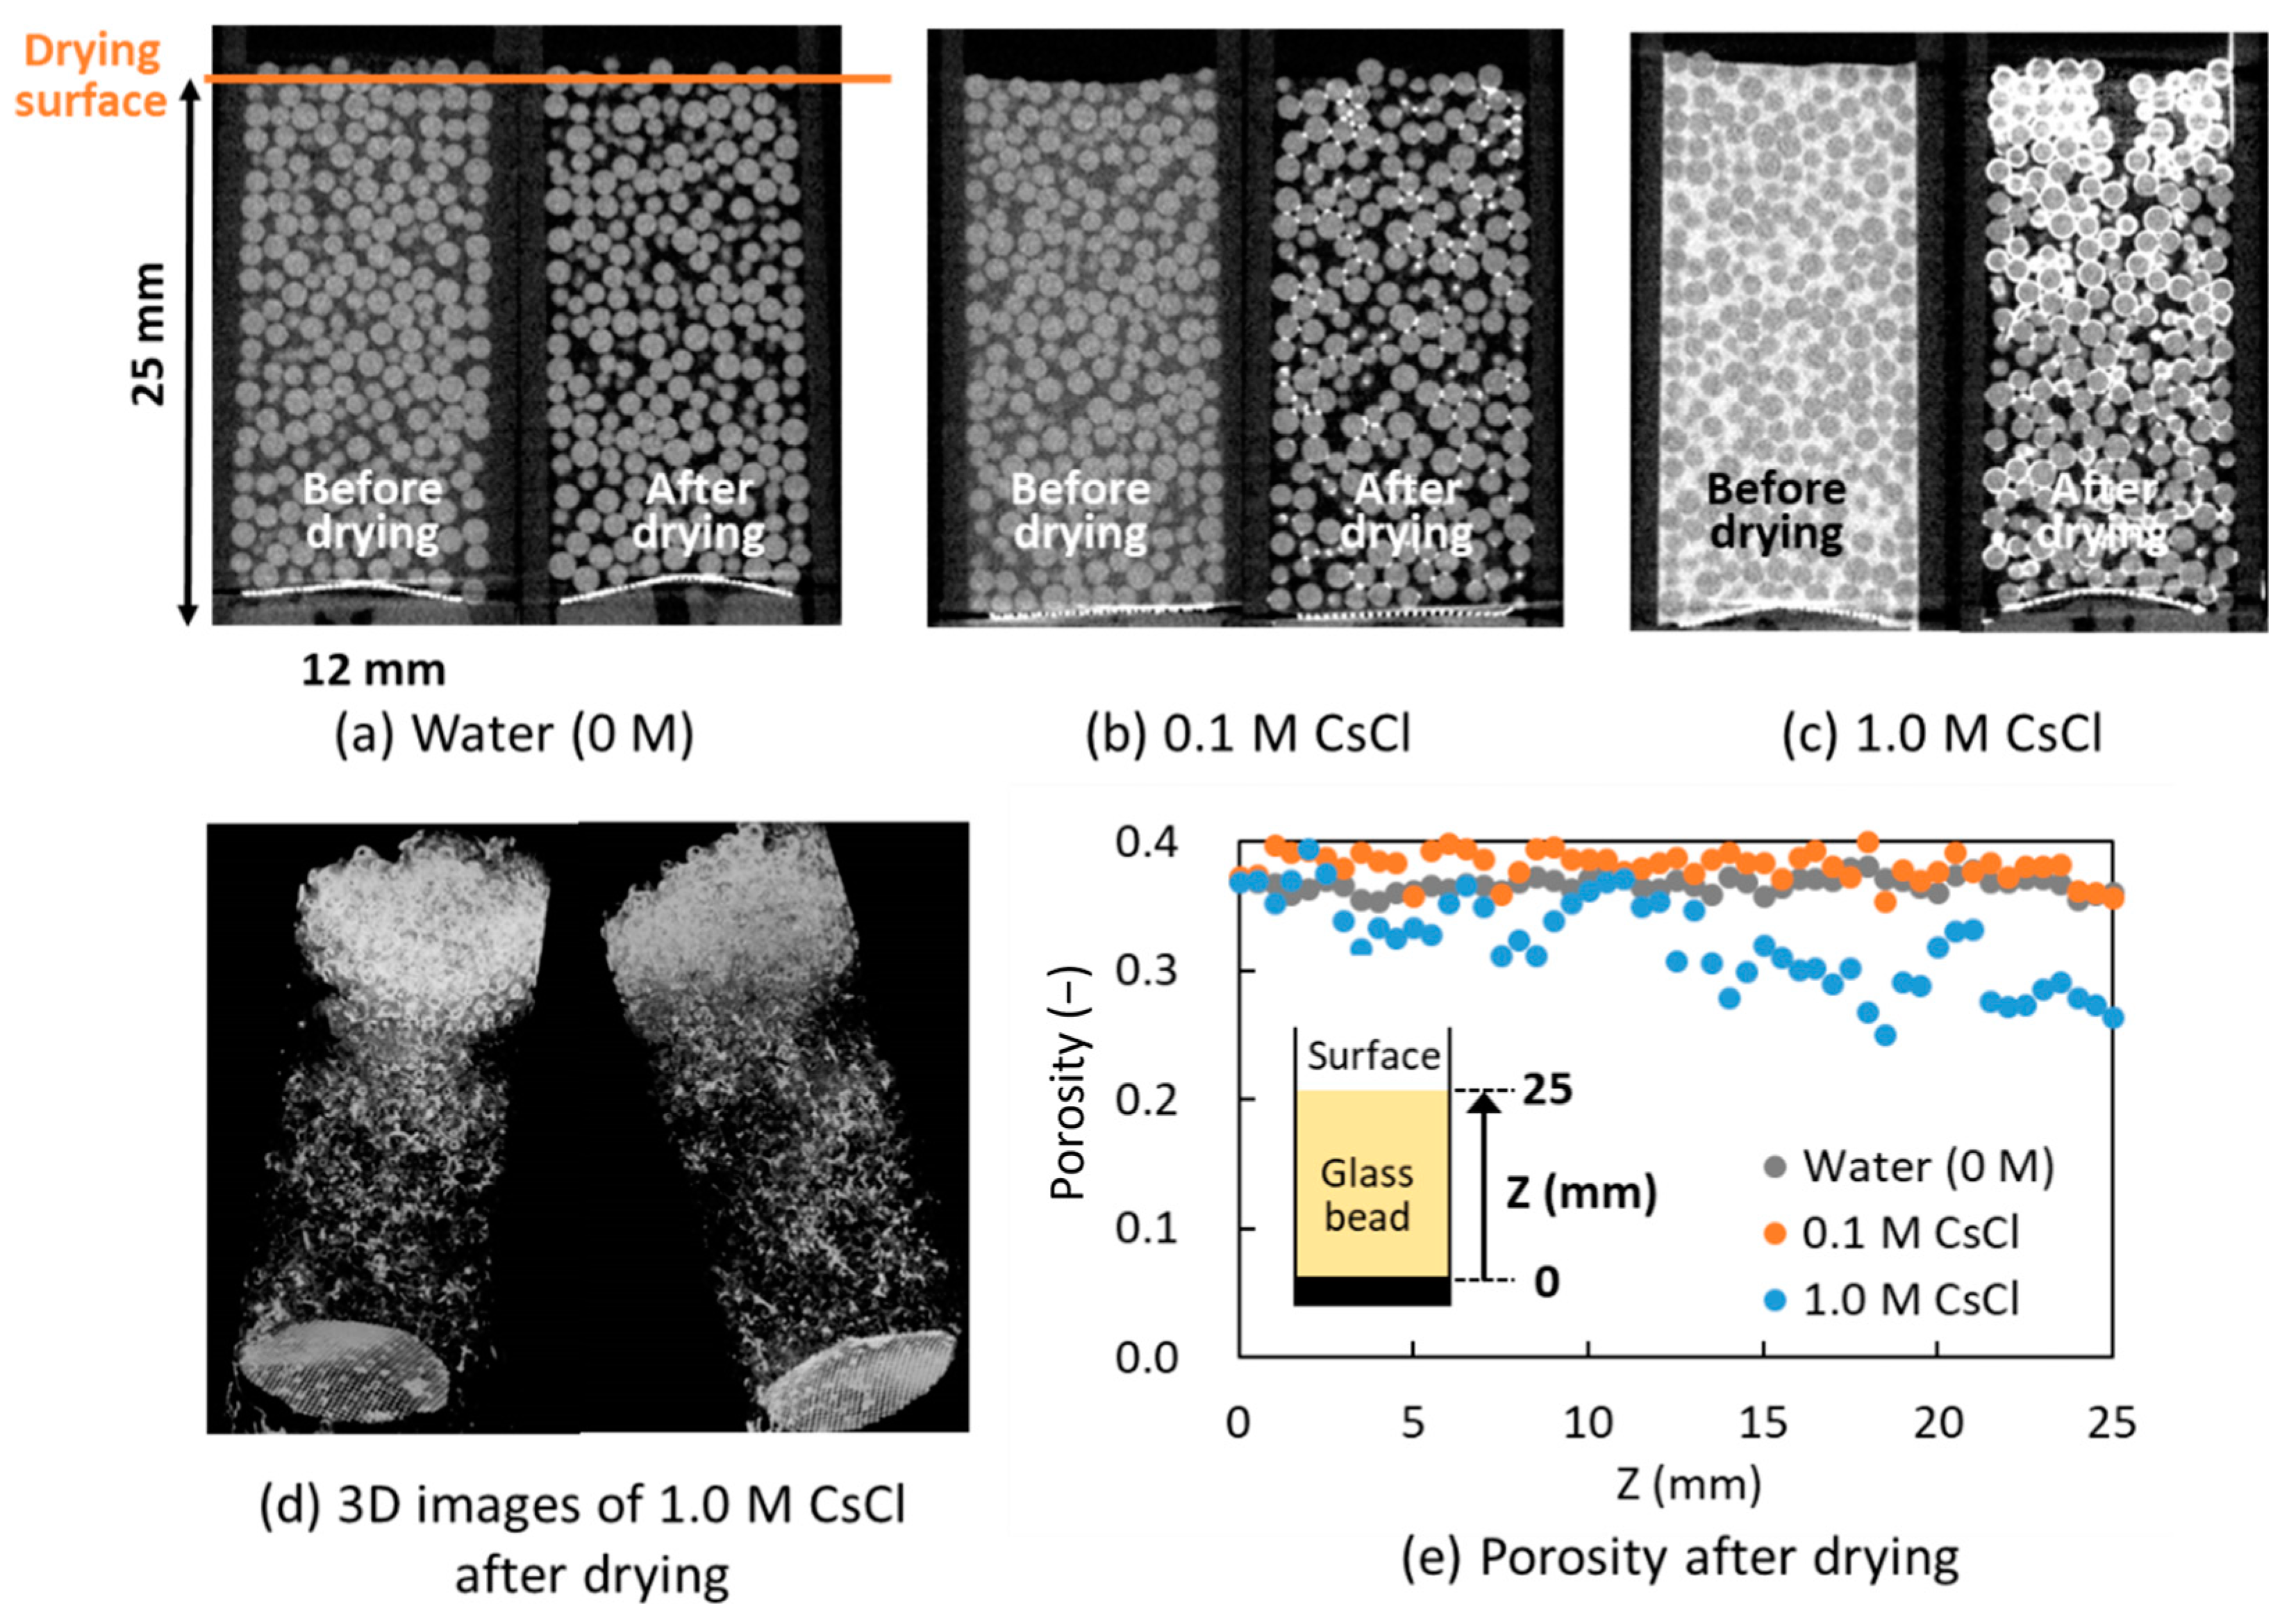
Figure 7 and Figure 8 show the X-ray CT images before and after the drying experiment and the porosity after drying for the SS columns filled with CsCl solutions. In Figure 7, for both 0.1 and 1.0 M concentrations, the precipitation and accumulation of CsCl solutes by drying were observed near the drying surface. In addition, the solute accumulation was localized for 1.0 M CsCl (Figure 7c,d). This indicated that multiple flow paths with locally different porosities existed initially and/or were formed in the column during drying. This occurred because the particle shape of SS was not uniform, and the particle size of SS (0.2–0.3 mm) was smaller than that of GB (0.5–1.0 mm).
Furthermore, the porosity shown in Figure 7e and Figure 8e decreased toward the drying surface, and it was significant for the SS column initially filled with 1.0 M CsCl compared with that of 0.1 M CsCl. This tendency is similar to that observed for the GB columns. In contrast, the porosity near the drying surface in the SS column initially filled with 1.0 M CsCl was approximately 0.30 (Figure 7e), whereas that of the GB columns initially filled with 1.0 M CsCl was approximately 0.25 (Figure 4e and Figure 5e). This may be because the porosity is represented as average values in the width direction at each height, and the accumulation of the CsCl solute is distributed in the z-direction in the SS column and in the width direction near the drying surface (as shown in Figure 7c,d). Considering that the porosity, solution volume, and solution concentration before drying were equal for the GB and SS columns, the difference in porosity after drying was owing to the difference in particle size. As mentioned in Section 3.1.1, smaller particle sizes result in finer pores that promote solution migration via capillary forces. Thereby, it affects the distribution of the precipitated solutes.
For the SS column initially filled with the Na2SiO3 solution shown in Figure 8, the precipitation of silicates is difficult to visually distinguish from silica sand compared to CsCl. However, the analysis using CT values showed a change in porosity that decreased near the drying surface (Figure 8e). Furthermore, the degree of decrease in porosity near the drying surface was higher for the column initially filled with 1.0 M Na2SiO3 than for 0.1 M Na2SiO3, indicating the dependency of the solute amount. This implied that even in the SS columns filled with Na2SiO3 (which did not display visual change in the X-ray CT images), the solute was precipitated and accumulated near the drying surface by the drying process and capillary effects of drying, similar to the CsCl condition.
Here, the permeability of the column with precipitation after the drying experiment was calculated using the Kozeny–Carman equation. It is a simplified expression of the relationship between porosity and permeability:
and
Here, is the permeability at each point i, is the permeability of pure water for the SS column without precipitation, is the porosity of the SS column at i, and is the porosity of the entire SS column without precipitation. The overall permeability, , of the SS column with precipitation is given by
where L is the column length (m) and n is the total number of measurement points. Note that Z in Figure 7e and Figure 8e is given by
Thus, can be obtained from Equations (6) to (8). This study calculated by using the average value of CT data at each Z and Equation (1).
The calculated results of for each condition are listed in Table 3. Here, the value of was set to n = 25 as a sufficiently large value so that the value of depends on the number of divisions n. Similar to the porosity, the calculated results revealed a tendency for a decrease in with an increase in the concentration of the filling solution used in the drying experiments. These calculated values are compared with the experimental results shown in Section 3.3.
3.2. Evaluation of Apparent Mass Transfer Coefficient Based on Water Evaporation Model
3.2.1. Concept of Water Evaporation Model
As mentioned in Section 3.1, the results for the weight changes in the drying experiments (Figure 3 and Figure 6) indicated that the first half (~about 100 h) was in the free water drying regime, and the second half was mainly surface adsorbed water drying on the surface of the packing particles. The rate-limiting step of drying in the first half is the mass transfer at the evaporation surface at the top of the columns. In other words, the capillary effect during the drying process contributes to the surface accumulation of solutes in the free-water drying regime. To confirm these drying rates and the contribution of mass transfer, the apparent mass transfer coefficient at a relatively early stage of the drying process was calculated based on the water evaporation model and additional drying experiments.
Figure 9 shows a conceptual diagram of the water evaporation model under the condition of resistance at the water surface. On the water surface, a gradient existed between the saturated water vapor pressure, (Pa), and water vapor pressure in the bulk, (Pa). The flux N (kg/(m2·s)) is expressed by
where k is the mass transfer coefficient (kg/(m2·s·Pa)). From the equation of state, , is given by
where is the molecular weight of water (kg/mol), is the volume (m3), is the weight of water (kg), is the gas constant (J/(mol·K)), and is the temperature (K). In addition, the weight of water per unit volume, (kg/m3), is given by
From Equations (10) and (12), the flux is expressed as
where is the weight of the saturated water per unit volume (kg/m3). In addition, the apparent mass transfer coefficient is defined as
where the unit of is m/s. It is the general unit for the mass transfer coefficient. In addition, the weight change in water in the column over time, , is given by
where denotes the area of the evaporation surface in the column (m2). The weight of water in the bulk per unit volume was assumed to be zero because, in this study, drying was performed under decompression conditions with vacuuming. Furthermore, because the weight of the saturated water per unit volume can be considered constant, is expressed as follows:
Integrating Equation (15) with an initial weight of water (kg), we obtain
In addition, the relationship between , the diffusion coefficient of water vapor ( = 0.22 × 10⁻⁴ (m2)), and the liquid film thickness ( (mm)) is expressed by
From these formulas and the weight change in water in the three columns of pure water over time described in Section 3.2.2, the apparent mass transfer coefficient, , is discussed based on the water evaporation model and the effect of the liquid film.
3.2.2. Estimation of the Apparent Mass Transfer Coefficient and Liquid Film Thickness
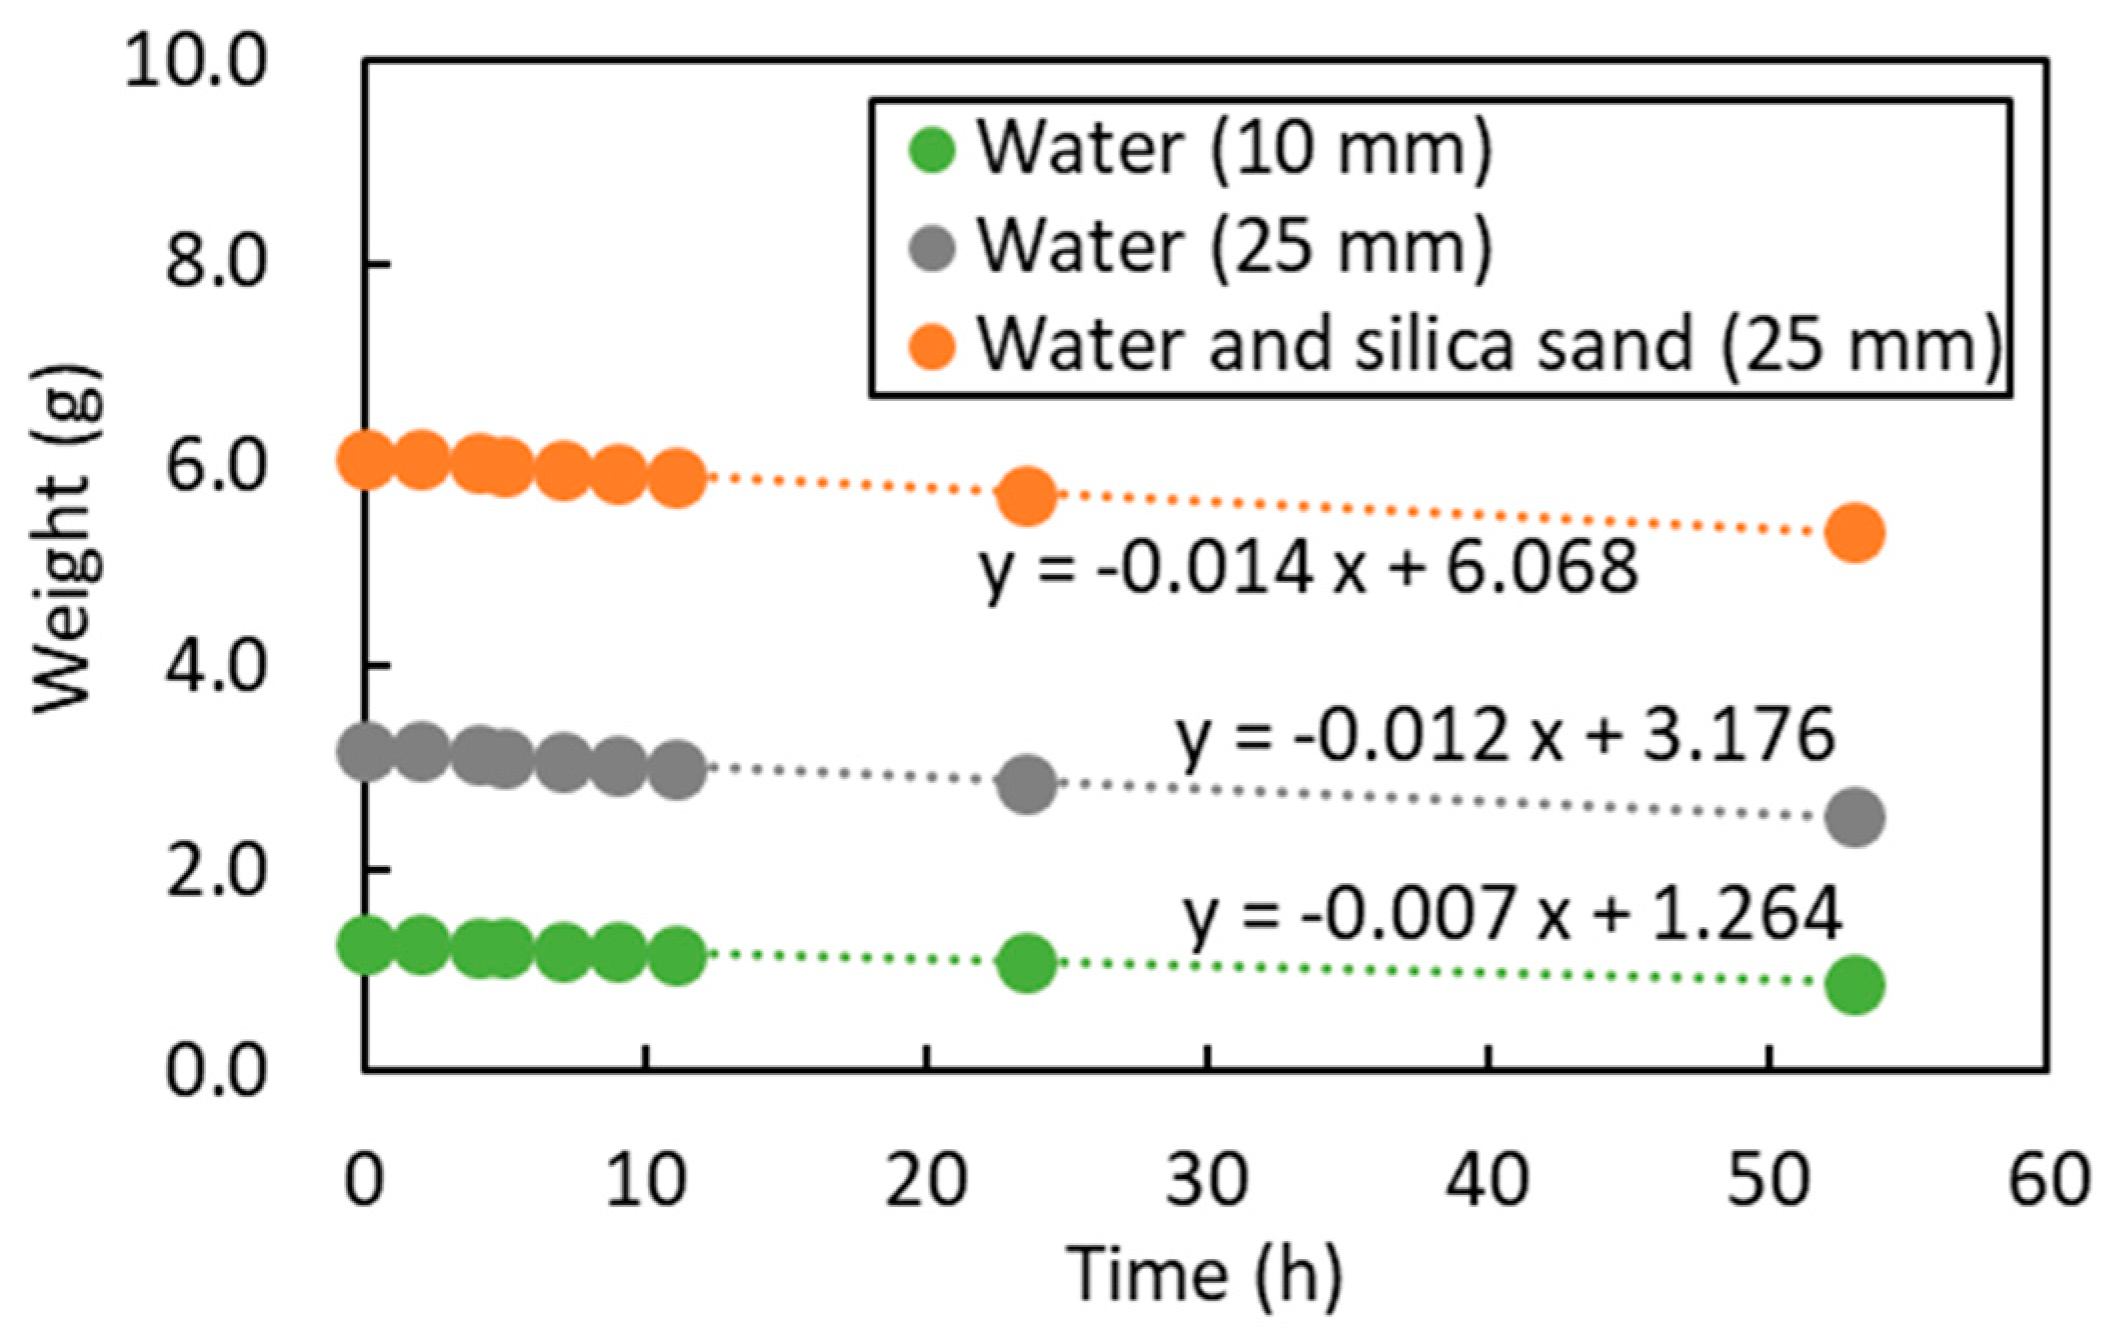
In this study, three additional columns were prepared: one filled with pure water of 25 mm height (equal to that of the column mentioned in Section 2.1), one filled with pure water of 10 mm height (corresponding to the volume of the porosity in the SS column mentioned in Section 2.1), and one filled with SS and pure water of 25 mm height (corresponding to the SS column filled with pure water mentioned in Section 2.1). The columns were then dried for 53 h in a vacuum desiccator containing silica gel.
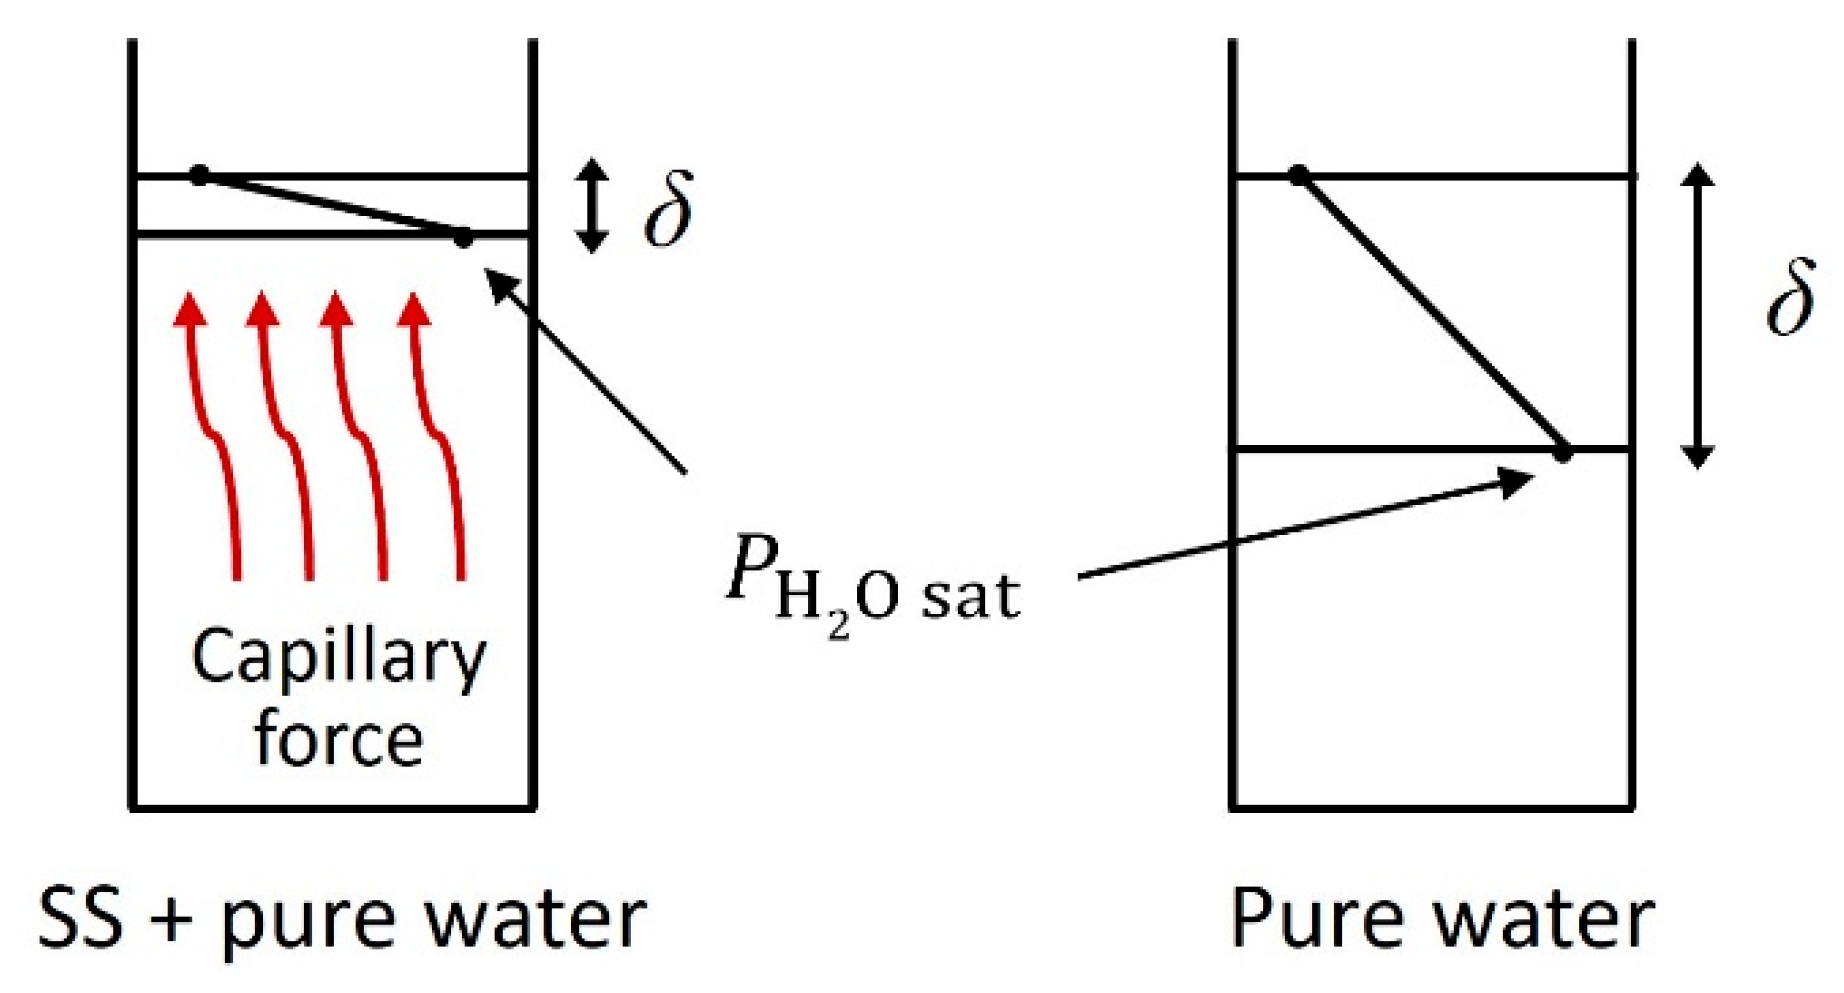
Figure 10 shows the weight changes in the three columns over time. A linear decrease in the column weight was observed under all the conditions. The column filled with SS and pure water displayed the highest progress in drying. In the case of pure water only, further progress in drying was observed for larger volumes of water. For the packed column of SS, the drying area was limited by the solid phase. That is, the value of the evaporation area s in Equation (15) is smaller than that in the absence of a solid phase, and its value is corrected by the initial porosity. Table 4 shows the calculated and for the three columns. The largest and smallest were obtained in the column filled with SS and pure water, which are significantly different from those of pure water only. This indicates that capillary effects facilitate the drying process even when vacuum and silica gel accelerate drying. Figure 11 shows an image of the effect of capillary forces in the column packed with SS and pure water and the difference in from a column packed with pure water only. In the column filled with SS and pure water, pure water was supplied continuously to the drying surface by capillary forces, and the drying progressed by mass transfer, resulting in a smaller . For the column packed with pure water only, no capillary forces acted, and the gradient between and decreased with an increase in .
3.3. Permeability Change in the SS Columns after Drying
Flow experiments were performed using the SS columns after the drying experiment. In the experiments, an equal concentration of CsCl solution was used for the SS column with CsCl precipitation. Moreover, pure water was used for the SS column with Na2SiO3 precipitation (the conditions are summarized in Table 2).
Figure 12 displays the changes in permeability and Cs concentration in the effluent over time for the SS column with CsCl precipitation. For comparison, the change in the permeability of pure water for the SS column without precipitates is also shown as a blank. The permeability of the blank remained almost constant over a flow time of 1400 s. That is, because SS is insoluble in pure water (at approximately pH 6), the pore change owing to solution flow could have been a result of particle rearrangement. However, its effect on permeability was limited, as shown in Figure 12a. For the CsCl condition, the permeability of 0.1 M CsCl was almost constant, similar to that of the blank. However, the permeability of 1.0 M CsCl was initially approximately 1/3 less than that of the blank and increased gradually with time. The initial decrease in permeability indicated that the precipitation and accumulation of solutes near the drying surface reduced the overall permeability of the column. Furthermore, the increase in permeability over time was owing to the dissolution of the precipitated CsCl. In fact, the solubility of CsCl is approximately 11 M at 25 °C [22], and as shown in Figure 12b, the Cs concentration in the effluent was slightly higher than that in the influent (black line in Figure 12b). When the CsCl solution continued to flow under the 1.0 M CsCl condition, the precipitated CsCl dissolved continuously and eventually attained the permeability of the blank. Therefore, it can be inferred that the temporal change in permeability for the column with solute precipitates depended highly on the dissolution behavior of the precipitate.
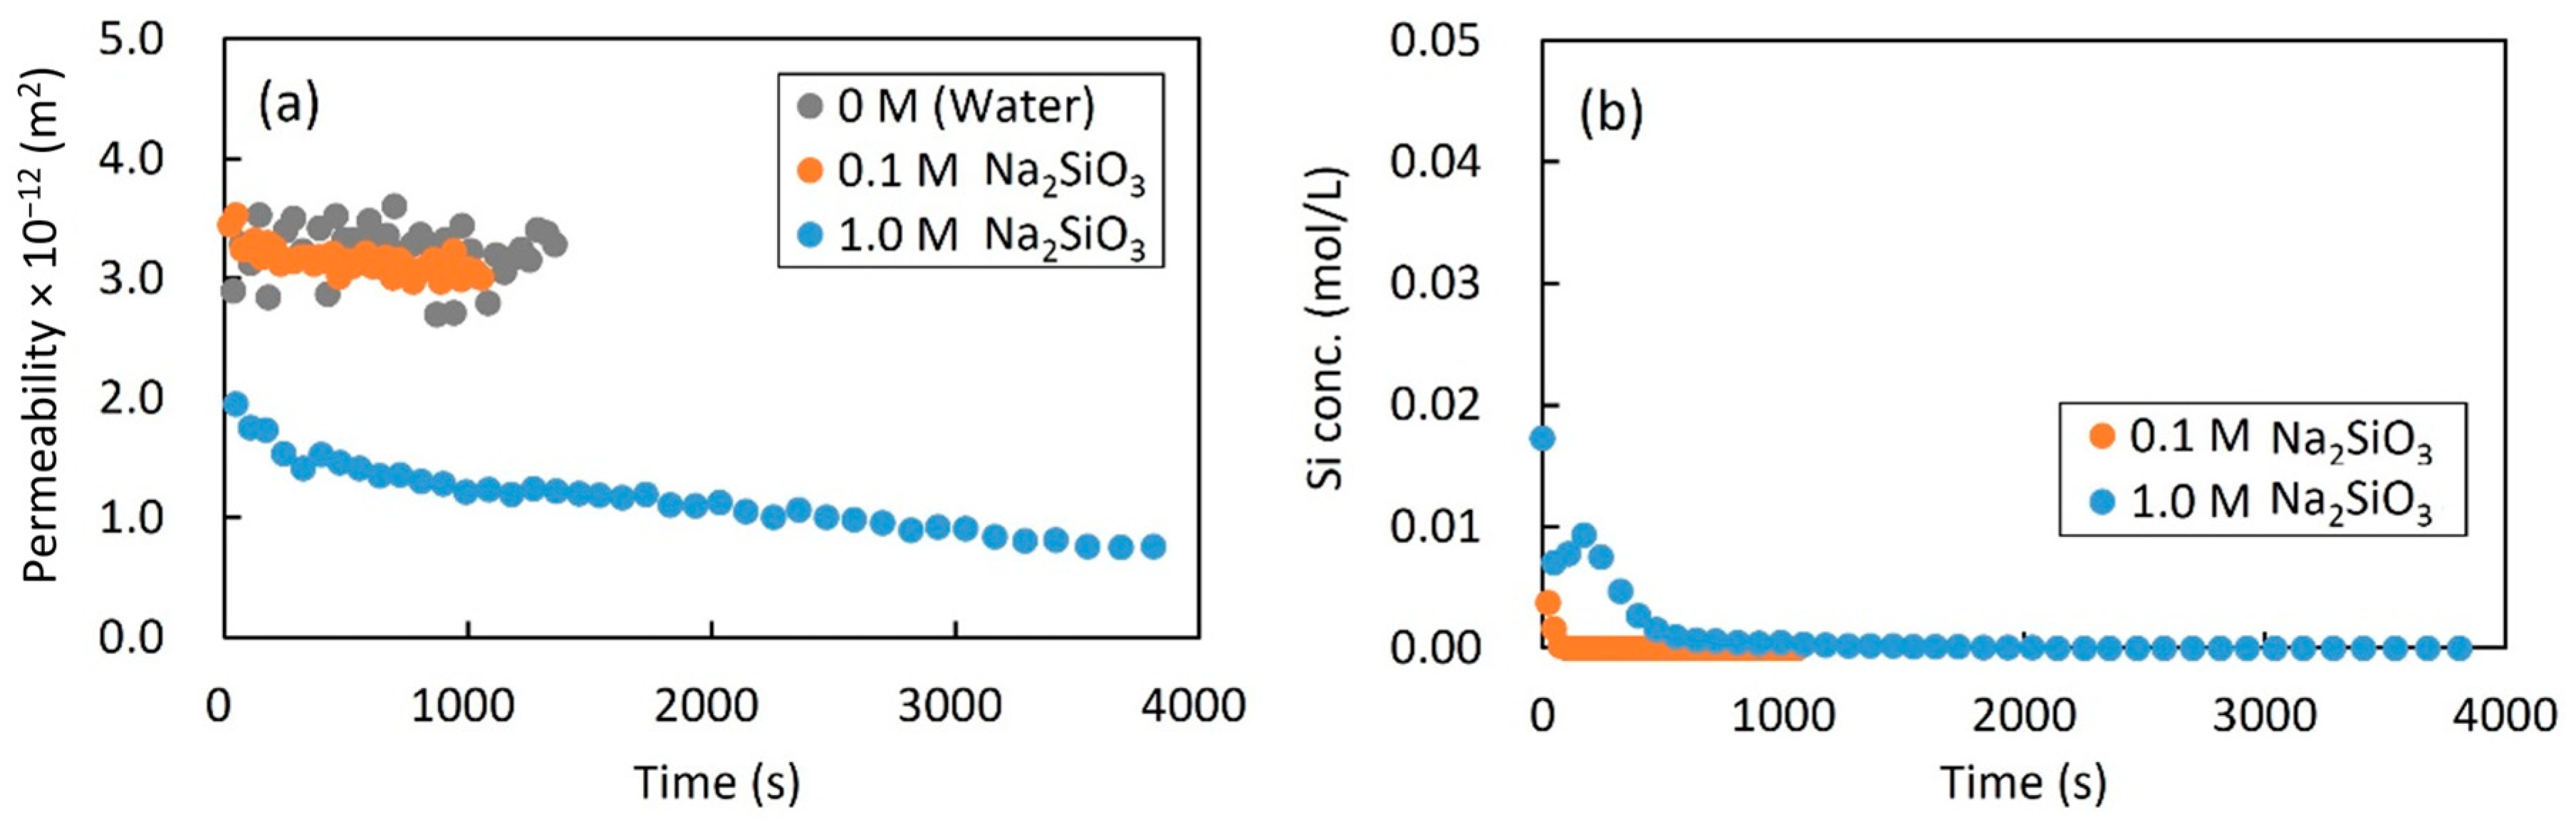
Figure 13 shows the changes in permeability and Si concentration in the effluent over time for the SS column with Na2SiO3 precipitation. The change in the permeability of the SS column in the case with no precipitation is shown as a blank. The permeability of the column precipitated with 0.1 M Na2SiO3 decreased slightly with time. However, it was almost equal to that of the blank. In contrast, the permeability of the column precipitated with 1.0 M Na2SiO3 was significantly lower than that of the blank or the column precipitated with 0.1 M Na2SiO3 and continued to decrease with time. This implies that solute precipitation by drying reduced the permeability, similar to the 1.0 M CsCl condition. For the Si concentrations for the 0.1 and 1.0 M Na2SiO3 columns, the effluent immediately after the start of the flow experiment contained a small amount of Si and was not detected thereafter. Because the pH of pure water is approximately 6 (a condition in which silicates hardly dissolve [23]), the slight increase in the initial Si concentration is owing to the extrusion of precipitates rather than dissolution. In addition, the decrease in permeability over time may have been caused by the rearrangement of the precipitated particles in the column with the fluid flow.
On the other hand, comparing the experimental k with the calculated kT from the Kozeny–Carman equation shown in Table 3, the tendency of k to decrease with the concentration of the filling solution in the columns in the drying experiment was consistent with . The little difference between k and values is attributed to the fact that the and used in the calculations are the values for the SS column of pure water without precipitates, which was slightly different from the column for which the was evaluated. The porosity and permeability were influenced significantly by the individual differences because of the packing of the particles in the column. In addition, the Kozeny–Carman equation is a simplified expression of the relationship between porosity and permeability. Therefore, it is difficult to fully reproduce the actual permeability values obtained from the experiments.
In the actual environment around the repository, highly alkaline conditions caused by cementitious materials result in the leaching of silicic acid to high concentrations. However, the drying process during disposal site operation can potentially precipitate silicic acid near the drying surface. After the disposal site is closed, the highly alkaline groundwater gradually moves downstream, and the original groundwater (pH 8) with the limited solubility of silicic acid (=2.0 mM [23]) is continuously supplied upstream of the disposal site. The experiment shown in Figure 13 simulated these conditions by continuously injecting pure water into the column after the precipitation of silicic acid. The experimental results showed a decrease in permeability and a small extrusion of precipitates out of the column. This indicates that when an unsaturated zone is formed temporarily owing to ventilation during disposal, the solute accumulation effect owing to drying reduces the permeability and contributes to the suppression of groundwater advection.
4. Conclusions
The changes in mass transfer and permeability after drying in wet porous media were evaluated experimentally. The weight changes in the drying experiments of packed columns with GB or SS initially filled with pure water, CsCl, or Na2SiO3 revealed that the drying rate decreased with an increase in the solution concentration. X-ray CT images of the columns before and after drying revealed significant X-ray absorption in the columns initially filled with the CsCl solution and solute precipitation near the drying surface. The porosity, based on the CT values, decreased near the drying surface of the columns under high-concentration conditions for both CsCl and Na2SiO3 solutions. These results indicate that the drying process in the packed layer may be limited by mass transfer during evaporation through the gas–liquid interface at the top of the column. Based on the water evaporation model, the apparent mass transfer coefficient verified that the column with packed particles displayed a higher apparent mass transfer coefficient than the column with water only (no packed particles). Furthermore, in the flow experiments using an overflow system with an SS column with precipitation, the permeability decreased significantly owing to the surface accumulation of precipitates. In particular, the permeability of the column of 1.0 M Na2SiO3 decreased with time owing to the rearrangement of the precipitates. These results indicate that the migration and precipitation of solutes by capillary forces associated with drying decrease the porosity of the porous media around the radioactive waste repository and subsequently decrease the permeability. That is, this implies that the formation of a temporary unsaturated zone by ventilation reduces the permeability and, thereby, suppresses the groundwater advection around the repository.
Author Contributions
Idea development and conceptualization, T.S., T.C. and Y.N.; data curation, T.S.; validation, T.S.; writing—original draft preparation, T.S.; funding acquisition, T.S. and Y.N.; methodology, T.S., K.H., T.C. and Y.N.; investigation, K.H.; writing—review and editing, K.H., T.C. and Y.N. All authors have read and agreed to the published version of the manuscript.
Funding
This study was supported by Kakenhi Grants-in-Aid (Nos. 21H04664 and 22K14627) from the Japan Society for the Promotion of Science (JSPS).
Data Availability Statement
The data presented in this study have been included in the manuscript. Detailed data are available from the corresponding author upon reasonable request.
Conflicts of Interest
All authors certify that they have no affiliations with or involvement in any organization or entity with any financial or non-financial interests in the subject matter or materials discussed in this manuscript.
References
- NUMO. Safety of the Geological Disposal Project 2010-Safe Geological Disposal Based on Reliable Technologies. Available online: https://www.numo.or.jp/technology/technical_report/pdf/TR-13-05.pdf (accessed on 15 January 2024).
- NUMO. The NUMO Pre-Siting SDM-Based Safety Case. Available online: https://www.numo.or.jp/technology/technical_report/pdf/NUMO-TR21-01_rev220222.pdf (accessed on 15 January 2024).
- Keita, E.; Faure, P.; Rodts, S.; Coussot, P. MRI evidence for a receding-front effect in drying porous media. Phys. Rev. E Stat. Nonlin. Soft Matter. Phys. 2013, 87, 062303. [Google Scholar] [CrossRef] [PubMed]
- Keita, E.; Faure, P.; Rodts, S.; Coussot, P.; Weitz, D.; Faure, P. Evaporation from a capillary tube: Experiment and modelization. In Proceedings of the 5th International Conference on Porous Media and Their Applications in Science, Engineering and Industry, Kona, HI, USA, 22–27 June 2014. [Google Scholar]
- Atkinson, A.; Everitt, N.M.; Guppy, R.M. Time Depndence of pH in a cementitious repository. MRS Proc. 1988, 127, 439. [Google Scholar] [CrossRef]
- Natkunarajah, K.; Masilamani, K.; Maheswaran, S.; Lothenbach, B.; Amarasinghe, D.A.S.; Attygalle, D. Analysis of the trend of pH changes of concrete pore solution during the hydration by various analytical methods. Cem. Concr. Res. 2022, 156, 106780. [Google Scholar] [CrossRef]
- Roadcap, G.S.; Kelly, W.R.; Bethke, C.M. Geochemistry of extremely alkaline (pH > 12) ground water in slag-fill aquifers. Ground Water 2005, 43, 806–816. [Google Scholar] [CrossRef] [PubMed]
- Walther, J.V. Relation between rates of aluminosilicate mineral dissolution, pH, temperature, and surface charge. Am. J. Sci. 1996, 296, 693–728. [Google Scholar] [CrossRef]
- Dow, C.; Glasser, F.P. Calcium carbonate efflorescence on Portland cement and building materials. Cem. Concr. Res. 2003, 33, 147–154. [Google Scholar] [CrossRef]
- Pel, L.; Huinink, H.; Kopinga, K.; van Hees, R.P.J.; Adan, O.C.G. Efflorescence pathway diagram: Understanding salt weathering. Constr. Build. Mater. 2004, 18, 309–313. [Google Scholar] [CrossRef]
- Wang, J.B.; Li, F.S.; Zhou, Z.H.; Du, P.; Xu, D.Y.; Xie, N.; Cheng, X.; Liu, Y. Effect of zeolite on waste based alkali-activated inorganic binder efflorescence. Constr. Build. Mater. 2018, 158, 683–690. [Google Scholar] [CrossRef]
- Rodriguez-Navarro, C.; Ilić, T.; Ruiz-Agudo, E.; Elert, K. Carbonation mechanisms and kinetics of lime-based binders: An overview. Cem. Concr. Res. 2023, 173, 107301. [Google Scholar] [CrossRef]
- Chen, X.Y. Evaporation from a salt encrusted sediment surface—Field and laboratory studies. Soil Res. 1992, 30, 429–442. [Google Scholar] [CrossRef]
- Bringedal, C.; Schollenberger, T.; Pieters, G.J.M.; van Duijn, C.J.; Helmig, R. Evaporation-driven density instabilities in saturated porous media. Transp. Porous Media 2022, 143, 297–341. [Google Scholar] [CrossRef]
- Huinink, H.P.; Pel, L.; Michels, M.A.J. How ions distribute in a drying porous medium: A simple model. Phys. Fluids 2002, 14, 1389–1395. [Google Scholar] [CrossRef]
- Guglielmini, L.; Gontcharov, A.; Aldykiewicz, A.J.; Stone, H.A. Drying of salt solutions in porous materials: Intermediate-time dynamics and efflorescence. Phys. Fluids 2008, 20, 077101. [Google Scholar] [CrossRef]
- Li, X.H.; Guo, M. Experimental study of evaporation flux, salt precipitation, and surface temperature on homogeneous and heterogeneous porous media. Adv. Civ. Eng. 2022, 2022, 1–11. [Google Scholar] [CrossRef]
- Eloukabi, H.; Sghaier, N.; Ben Nasrallah, S.; Prat, M. Experimental study of the effect of sodium chloride on drying of porous media: The crusty-patchy efflorescence transition. Int. J. Heat Mass Transf. 2013, 56, 80–93. [Google Scholar] [CrossRef]
- Tohoku KEISYA Co, Ltd. Web Page, Product Information. Available online: https://www.tohoku-keisya.co.jp/products/ (accessed on 15 January 2024).
- Rangel-German, E.R.; Kovscek, A.R. Experimental and analytical study of multidimensional imbibition in fractured porous media. J. Petrol. Sci. Eng. 2002, 36, 45–60. [Google Scholar] [CrossRef]
- Coussot, P. Scaling approach of the convective drying of a porous medium. Eur. Phys. J. B 2000, 15, 557–566. [Google Scholar] [CrossRef]
- Acree, W.E., Jr. Solubility Data Series Volume 59, Polycyclic Aromatic Hydrocarbons: Binary Non-Aqueous Systems, Part II: Solvents F-Z. 1995. Available online: https://iupac.github.io/SolubilityDataSeries/volumes/SDS-59.pdf (accessed on 15 January 2024).
- Stumm, W.; Morgan, J.J. Aquatic Chemistry: Chemical Equilibria and Rates in Natural Waters; Wiley: New York, NY, USA, 1996. [Google Scholar]
Figure 1.
An image of the drying experiment in the vacuum desiccator containing silica gel.

Figure 2.
Schematic of flow experiment with overflow system.

Figure 3.
Weight change in the GB columns over time during the drying experiment ((a) GB φ0.5; (b) GB φ1.0). The vertical axis is normalized to the initial weight of the GB columns filled with solutions.
Figure 3.
Weight change in the GB columns over time during the drying experiment ((a) GB φ0.5; (b) GB φ1.0). The vertical axis is normalized to the initial weight of the GB columns filled with solutions.

Figure 4.
X-ray CT analysis of the GB φ0.5 columns. (a–c) Cross-sectional X-ray images before and after drying; (d) three-dimensional images for 1.0 M CsCl after drying; and (e) porosity after drying according to the height direction of the columns. The plots in (e) are average values of the porosity in the width direction at each height.

Figure 5.
X-ray CT analysis of the GB φ1.0 columns. (a–c) Cross-sectional X-ray images before and after drying; (d) three-dimensional images for 1.0 M CsCl after drying; and (e) porosity after drying according to the height direction of the columns. The plots in (e) are average values of porosity in the width direction at each height.

Figure 6.
Weight change in the SS columns over time during the drying experiment ((a) CsCl; (b) Na2SiO3). The vertical axis is normalized to the initial weight of the SS columns filled with solution.
Figure 6.
Weight change in the SS columns over time during the drying experiment ((a) CsCl; (b) Na2SiO3). The vertical axis is normalized to the initial weight of the SS columns filled with solution.

Figure 7.
X-ray CT analysis for the SS columns filled with pure water and CsCl. (a–c) Cross-sectional X-ray images before and after drying; (d) three-dimensional images for 1.0 M CsCl after drying; and (e) porosity after drying according to the height direction of the columns. The plots in (e) are average values of the porosity in the width direction at each height.

Figure 8.
X-ray CT analysis for the SS columns filled with pure water and Na2SiO3. (a–c) Cross-sectional X-ray images before and after drying; (d) three-dimensional images for 1.0 M CsCl after drying; and (e) porosity after drying according to the height direction of the columns. The plots in (e) are average values of the porosity in the width direction at each height.

Figure 9.
Conceptual diagram of water evaporation model.

Figure 10.
Weight changes of three columns over time.

Figure 11.
An image of the capillary force effect and liquid film thickness.

Figure 12.
Changes in (a) permeability and (b) Cs concentration of the effluent over time for the SS columns with CsCl precipitation. The black lines in (b) indicate the Cs concentration in the influent.
Figure 12.
Changes in (a) permeability and (b) Cs concentration of the effluent over time for the SS columns with CsCl precipitation. The black lines in (b) indicate the Cs concentration in the influent.

Figure 13.
Changes in (a) permeability and (b) Si concentration of the effluent over time for the SS columns with Na2SiO3 precipitation.
Figure 13.
Changes in (a) permeability and (b) Si concentration of the effluent over time for the SS columns with Na2SiO3 precipitation.


Table 1.
Composition of silica sand [19].
Table 1.
Composition of silica sand [19].
| SiO2 | Al2O3 | Fe2O3 | CaO | Na2O | K2O | TiO2 | Ig.loss | |
|---|---|---|---|---|---|---|---|---|
| % | 90.47 | 5.43 | 0.25 | 1.12 | 1.42 | 0.89 | 0.13 | 0.29 |
Table 2.
Summary of experimental conditions.
| Abbreviation | Column | Drying Experiment | Flow Experiment | |
|---|---|---|---|---|
| Packed Layer | Particle Size, φ | Filling Solution | Fluid | |
| GB φ0.5 | Glass bead | 0.5 mm | Pure water | - |
| 0.1 M CsCl | - | |||
| 1.0 M CsCl | - | |||
| GB φ1.0 | 1.0 mm | Pure water | - | |
| 0.1 M CsCl | - | |||
| 1.0 M CsCl | - | |||
| SS | Silica sand | 0.35 mm | Pure water | Pure water |
| 0.1 M CsCl | 0.1 M CsCl | |||
| 1.0 M CsCl | 1.0 M CsCl | |||
| 0.1 M Na2SiO3 | Pure water | |||
| 1.0 M Na2SiO3 | Pure water |
Table 3.
Calculated kT of the SS column with precipitation (after drying) for each condition.
| Filling Solution | Fluid | Calculated kT (m2) |
|---|---|---|
| 0.1 M CsCl | 0.1 M CsCl | 2.62 × 10⁻¹² |
| 1.0 M CsCl | 1.0 M CsCl | 2.21 × 10⁻¹² |
| 0.1 M Na2SiO3 | Pure water | 2.87 × 10⁻¹² |
| 1.0 M Na2SiO3 | Pure water | 2.28 × 10⁻¹² |
Table 4.
The apparent mass transfer coefficient and for three columns.
| Condition (Filled Height) | (kg/(s·m2)) | δ (mm) |
|---|---|---|
| Pure water (10 mm) | 2.65 × 10⁻⁵ | 19.13 |
| Pure water (25 mm) | 1.56 × 10⁻⁵ | 32.41 |
| SS and pure water (25 mm) | 7.39 × 10⁻⁵ | 6.86 |
Disclaimer/Publisher’s Note: The statements, opinions and data contained in all publications are solely those of the individual author(s) and contributor(s) and not of MDPI and/or the editor(s). MDPI and/or the editor(s) disclaim responsibility for any injury to people or property resulting from any ideas, methods, instructions or products referred to in the content. |
© 2024 by the authors. Licensee MDPI, Basel, Switzerland. This article is an open access article distributed under the terms and conditions of the Creative Commons Attribution (CC BY) license (https://creativecommons.org/licenses/by/4.0/).
Share and Cite
MDPI and ACS Style
Seki, T.; Hongo, K.; Chida, T.; Niibori, Y. Reduction in Apparent Permeability Owing to Surface Precipitation of Solutes by Drying Process and Its Effect on Geological Disposal. Minerals 2024, 14, 428. https://doi.org/10.3390/min14040428
AMA Style
Seki T, Hongo K, Chida T, Niibori Y. Reduction in Apparent Permeability Owing to Surface Precipitation of Solutes by Drying Process and Its Effect on Geological Disposal. Minerals. 2024; 14(4):428. https://doi.org/10.3390/min14040428
Chicago/Turabian StyleSeki, Tsugumi, Kanta Hongo, Taiji Chida, and Yuichi Niibori. 2024. "Reduction in Apparent Permeability Owing to Surface Precipitation of Solutes by Drying Process and Its Effect on Geological Disposal" Minerals 14, no. 4: 428. https://doi.org/10.3390/min14040428
Note that from the first issue of 2016, this journal uses article numbers instead of page numbers. See further details here.