Article

Research on the Grinding Process of Superhard Particles in the Fluidized Bed Opposed Jet Mill Based on the CFD-DEM Methodology

1
School of Mechanical Engineering and Rail Transit, Changzhou University, Changzhou 213164, China
2
Jiangsu Key Laboratory of Green Process Equipment, Changzhou 213164, China
3
Jiangsu Province Engineering Research Center of Intelligent Manufacturing Technology for the New Energy Vehicle Power Battery, Changzhou 213164, China
*
Author to whom correspondence should be addressed.
Minerals 2024, 14(4), 437; https://doi.org/10.3390/min14040437
Submission received: 23 March 2024 / Revised: 20 April 2024 / Accepted: 20 April 2024 / Published: 22 April 2024

Abstract

:
The process of superhard particle breakage in the grinding zone of the fluidized bed opposed jet mill is investigated using the CFD-DEM (computational fluid dynamics-discrete element method) coupling method with the Tavares UFRJ Breakage Model in the present study. The effects of structural and operational parameters, such as target plate structure, nozzle position, air inlet velocity, and feed rate, on the equipment stress distribution, airflow velocity, pressure field, particle velocity, and cumulative particle size distribution are thoroughly studied to determine the optimal structural and operational parameters. Experimental validation is conducted, including scanning electron microscope (SEM) observation of particle morphology and analysis of particle size distribution of ground product particles. The simulation results indicate that the wear rate of the structure without a target plate is lower than that of the structure with a target plate in the grinding central zone. Therefore, the structure without a target plate is chosen for further investigation. The cumulative particle size distribution after grinding is influenced by nozzle position, air inlet velocity, and feed rate. The particle D50 is positively correlated with nozzle spacing and feed rate, while it is negatively correlated with air inlet velocity. The optimal grinding effect is achieved when the distance between the nozzle and the center of the grinding zone ranges from 52.5 mm to 72.55 mm, the air inlet velocity is 950 m/s, and the feed rate is 10.5 g/s. Through experimental investigation, it has been observed that when the feed rate is 10 g/s, the particle size distribution becomes more uniform. Furthermore, consistent trends in the cumulative particle size distribution in the experiment and simulation results can be found, which validates the present numerical model. It was observed that particles at low feed rates retain certain angular edges, while particle roundness increases at high feed rates.

1. Introduction

In the fluidized bed opposed jet mill, the particle is entrained and accelerated by two high-speed airflows along the same axis, causing particles to collide and undergo grinding [1]. The jet mill offers advantages such as high crushing efficiency, low energy consumption, and minimal material contamination, which is primarily employed in the production of food, medicines, chemicals, and minerals. It is also suitable for the ultrafine grinding of various superhard materials [2]. Taking quartz as an example, it is an oxide of silicon, characterized by a crystalline framework structure [3], and classified as a superhard material with high hardness (Mohs hardness of 7) and low brittleness. Consequently, it poses challenges in terms of crushing difficulty, strong equipment wear, and a wide particle size distribution of the grinding product [4,5]. Following the grinding process, quartz undergoes multiple processing techniques to yield silica micro-powder with superior performance. Based on particle morphology, the obtained silica micro-powder products can be classified into angular and spherical types [6], which are widely utilized in industries such as manufacturing and electronics [7]. Angular silicon micro-powders find extensive applications in metallurgy, ceramics, and construction, with particles retaining distinct edges [8]. Spherical silicon micro-powders are primarily employed in the electronics industry, where high sphericity, small particle size, and high purity are crucial. Particularly in the rapidly evolving landscape of the electronic packaging industry, the demand for silicon micro-powders with higher roundness is steadily increasing [9,10]. Compared to other abrasives, quartz possesses characteristics such as high hardness, excellent abrasion resistance, stable chemical properties, and lower costs [11]; consequently, it is widely utilized as a superhard abrasive for grinding purposes. Currently, the production of quartz powder mainly relies on ball mills [12], but challenges faced include a higher proportion of coarse particles, wide particle size distribution, severe equipment wear, and low product purity. Addressing the issues above, the use of the fluidized bed opposed jet mill not only reduces equipment wear, enhances particle purity and crushing efficiency but also provides theoretical guidance for the production of silicon micro-powders. Simultaneously, it contributes to advancing the theoretical research on jet mills and holds significance for engineering studies and practical production.
Currently, much relevant research on the grinding process and jet mills has been conducted. Brosh et al. [13] established a three-dimensional numerical CFD-DEM grinding model based on the k-ε turbulence model equation. The model describes the relevant functions of particle grinding under the action of stress loads, which is of significant importance for studying the behavior of jet mills. Liu et al. [14] employed the CFD method to numerically simulate and analyze the chamber structure and flow field of a fluidized bed opposed jet mill; the distribution of internal flow fields and traces of airflow were obtained. This provides a reliable theoretical basis for optimizing the structure of jet mills. Koeninger et al. [15] studied the grinding, conveying, and grading processes of glass bead particles in a fluidized bed jet mill. The influence of operating parameters and structural parameters on the grinding effect of the jet mill was investigated in some studies. Wang et al. [16] carried out air flow milling of normal maize starch samples with different moisture contents by changing different classifier frequencies (2400–4200 rpm) and analyzed the morphology and functional properties of starch particles after grinding. Santos et al. [17] combined particle hydrodynamics and friction models to analyze the impact of solid retention and inlet gas velocity on gas–solid dynamics; the study revealed that there is a significant particle-particle interaction when the solid retention rate is 700 g and the pressure is 1 bar. Liu et al. [18] used a jet mill to reduce the diameter of high-purity lithium carbonate powder. They found that feed rate and classifier rotation speed affect the particle size distribution of the material by experiments, and the optimal grinding parameters are as follows: the feeder frequency of 25–28 Hz, the classifier wheel frequency of 30–35 Hz, and the induced draft fan frequency of 35–40 Hz. Strobel et al. [19] conducted research based on the finite element method and image analysis. They altered the particle hold-up (100–700 g) and nozzle pressure of aluminum (0.5–3 bar) and glass spheres to investigate the microscopic structural changes induced by stress during the grinding process. Lu et al. [20] carried out grinding experiments using TiAl alloyed powders in a fluidized bed jet mill. They studied the influence of rotation speed and gas pressure on the particle characteristics of the resulting product, finding that the powder forms coarse agglomerates and finer flake-like fragments at speeds above 5600 rpm and increasing the frequency of the classifier wheel further enhances the number of fragments, which provides an explanation for the breakage mechanism of powder during the grinding process. Additionally, some studies have investigated the particle morphology of quartz after grinding in the jet mill and discussed the associated grinding mechanisms. Chen et al. [21] utilized ultrafine grinding equipment to prepare sub-micron silica particles, investigating the mechanism and morphology of silica particle fragmentation in a mill with and without a salt solution. Lee et al. [22] employed the CFD-DEM method to simulate the grinding of silica particles in a jet mill at different rotational speeds (5000–14,000 rpm) of the rotor classifier and found that uniformly sized particles can be obtained at a speed of 14,000 rpm. It can be observed that research on the jet mill primarily employs experimental and numerical simulation methods. However, due to measurement difficulties in the grinding zone (airflow convergence zone) under actual working conditions, there are limitations in studying the gas–solid coupling effect and the application of different particle forms. Furthermore, obtaining accurate measurements of particle impact velocity inside the jet mill and assessing wall wear pose significant challenges.
The present study investigates the gas–solid phase interaction and examines the impact of various operational and structural parameters on the grinding process of quartz sand using the CFD-DEM coupling method. The study also explores the applicability of the Tavares UFRJ Breakage model in the fluidized bed opposed jet mill while providing an extensive analysis of the impact on target plate structure and wear of equipment. Additionally, it analyzes and predicts the application of particles with different morphologies. These findings contribute to offering theoretical guidance for practical production processes involving quartz as well as insights into enhancing particle grinding efficiency and optimizing the structure of the jet mill.

2. Mathematical Model

2.1. Gas Phase Physical Model

The equations for the conservation of mass, momentum and energy in the gas phase are as follows [23]:
The gas phase mass balance equation is:
a f ρ f t + ( a f ρ f v f ) = 0
The gas phase momentum balance equation is:
t ( a f ρ f v f ) + ( a f ρ f v f v f ) = a f p + τ f + F p f
The gas phase energy balance equation is:
t ( ρ f E f ) + v f ρ f E f + P = k e f f T + τ v f
where, af is the gas volume fraction, ρf is the gas density, vf is the gas velocity, p is the pressure, τf is the gas stress tensor, Fpf is a momentum source term that allows the CFD to consider the drag force exerted on the DEM particles, Ef is the total gas phase energy, keff is the effective thermal conductivity of the gas phase, and T is the gas temperature.

2.2. Discrete Phase Physical Model

2.2.1. Tavares UFRJ Breakage Model

The Tavares UFRJ Breakage model is an energy-based model [24,25]. The principle is illustrated in Figure 1. In this breakage model, when the energy imparted to a particle through impact or compression exceeds its intrinsic fracture energy, the particle undergoes fragmentation. The original large particle is replaced by smaller particles that disperse. The critical value for this process is referred to as the particle fracture energy. When the impact energy on the particle is relatively low, damage and breakage occur on the particle surface, leading to the generation of small particle powder. Due to the damage mechanism, the intrinsic fracture energy of the particle may decrease.
Tavares [26] proposed that the degree of particle breakage during stress testing is directly correlated to the specific energy applied and the median fracture energy of the particles, the calculation formula is as follows:
t 10 = A 1 exp ( b e E k E p )
where, t10 is the degree of breakage particle of the fragments; A and b are model parameters that should be fitted to the experimental data; Ep is the median fracture energy of the particles; and eEk is the effective impact energy. Compared to the specific breakage energy of particles, a higher impact energy Ek corresponds to higher values of t10, resulting in a finer offspring size distribution.

2.2.2. Particle Motion Equations

The solution to the translational motion equation of particles is based on Newton’s second law [27], and the motion equation is:
ρ p d v p d t = f v f v p + g ρ p ρ f p p + τ p + F n + F t
where, ρp is the particle density, f is the drag coefficient, vp is the particle velocity, Pp is the particle pressure, τp is the particle stress tensor, g is the acceleration of gravity, and Fn and Ft are normal and tangential contact forces.
The equation for calculating Fn and Ft is as follows:
F n = k 12 δ + γ v 12 e 12 e 12 / V p
F t = ξ F n
where k12 is the spring constant, δ is the amount of overlap between two grinding particles, γ is the damping coefficient, v12 is the relative velocity of the two grinding particles, e12 is the unit vector of two grinding particle positions, Vp is the particle volume, and ξ is the friction coefficient.

2.3. Physical Model of Gas–Solid Two-Phase Flow

In the context of gas–solid interactions, the predominant force acting on particles is the drag force. The calculation formula for the drag force experienced by an individual particle is as follows:
F D = V f f a p v f ν p
where, ap is the particle volume fraction, and the relationship with af is: ap = 1 − af.
In this study, the Gidaspow model has also been employed, and the representation of f in the Gidaspow model is given as follows [28]:
f = 0.75 ρ f a f a p d p v f v p C D a f 2.65 a f 0.8 150 a p 2 μ f a f d p 2 + 1.75 ρ f a p v f v p d p a f < 0.8
where, dp is the particle diameter, μf is the gas viscosity, CD is the drag coefficient which is calculated as follows:
C D = 24 1 + 0.15 R e p 0.087 R e p < 1000 0.44 R e p 1000
where, Rep is the particle Reynolds number.

3. Model and Boundary Conditions

3.1. Geometric Model and Grid Independence Verification

3.1.1. Geometric Model

Material particles are injected into the feed nozzle of the jet mill from the feed port, while the airflow is accelerated by the Laval nozzle and shares the same line of trajectory as the material particles, impelling the particles forward. Accelerating under the influence of the high-speed airflow, the particles collide and break apart at the convergence point of the airflow in the center of the grinding zone. The grinding particles ascend with the airflow to the classifying zone, in which the coarse particles are flung to the periphery and sidewalls of the classifier wheel under centrifugal forces and then returned to the grinding zone for further grinding, while the fine particles subjected to smaller centrifugal force are discharged through the outlet for gas–solid separation and product collection.
The geometric structure of the fluidized bed opposed jet mill is depicted in Figure 2. Due to the complex internal structure and the fact that the excess structure has little influence on the flow field of the cavity, SolidWorks 2016 software is employed to simplify the modeling process according to the practical size of the jet mill. Compressed gas enters through the intake nozzle, and particles are released from the inlet of the feed nozzle. The present study mainly focuses on gas–solid multiphase flow and particle grinding processes, therefore only the grinding zone is taken into consideration.

3.1.2. Grid Independence Verification

After processing the airflow mill model through Design Modeler 2022 (DM), ANSYS Meshing 2022 software is employed for partitioning the mesh for the computational domain of the flow field and the rotating domain. The sliding mesh technique is utilized for the rotational motion of the classifier wheel, with a particular focus on mesh refinement at the classifier wheel and nozzle locations to enhance computational accuracy. Employing the same meshing approach, the mesh grid contains a total of 134,687, 264,680, 316,449, 446,942, and 610,485 cells. Notably, when the number of mesh cells exceeds 264,680, the change in airflow velocity and pressure is small. The airflow velocity and pressure exhibit negligible variations, exerting a minor influence on the particle grinding process. Considering both computational efficiency and accuracy, the mesh with 264,680 cells is selected for the present numerical simulation.

3.2. Simulation Conditions and Coupling Models

The present study employs a CFD-DEM coupled model, and the coupling process involves bidirectional data transfer [29]. The detailed coupling process is as follows: (a) A flow field computation for the first time step is conducted in Fluent 2022 software. (b) An iteration for the same duration occurs in EDEM 2022 software. Particle information, such as location, volume, and motion, is transmitted back to Fluent through the coupling interface. This step allows for the calculation of particle-fluid interactions. (c) Iterations for each time step enable transient simulation of the grinding process.
In the present study, EDEM 2022 software is used to simulate particle behaviors, and quartz is selected as the feed particle material. To simplify calculations, irregularly shaped quartz particles are modeled as spherical particles with a 1 mm diameter. The walls are made of carbon steel, and the Tavares UFRJ Breakage model is used for simulation. The relevant parameters are obtained through experiments and references [30,31], as shown in Table 1. Particle and wall parameters are presented in Table 2, while contact parameters are presented in Table 3.
In the present study, the commercial CFD software Fluent 2022 is used for the prediction of flow fields. The standard k-epsilon turbulence model is chosen, which is widely used in the field of fluidized bed opposed jet mills [32], and the SIMPLE algorithm is adopted as the velocity–pressure decoupling algorithm. The simulation considers flow within a circular pipe, with the actual diameter defined as the hydraulic diameter, and the rotational speed of the classifier wheel is set at 5000 rpm. To focus more on the behavior of airflow and particles in the central grinding zone and considering the relatively minor impact of complex geometrical shapes, the Laval nozzle is omitted. The inlet velocity is set to match the exit speed of gas passing through a Laval nozzle. After simulation calculations, inlet speeds are adjusted between 750 m/s and 1050 m/s. The nozzle inlet is set as a velocity inlet, and the mill exit is a pressure outlet. Boundary conditions are listed in Table 4.

3.3. Model Validation

To verify the reliability of the simulation model in this study, Lee et al.’s dataset was utilized for validation purposes. The original particles and the average particle size obtained after grinding at 10,000 rpm by Lee [22] were 13.7 µm and 11.83 µm, respectively. The product volume distribution is shown in Figure 3. The simulation results of velocity fields, pressure fields, and the product volume distribution have been compared with the results in the literature [22].
As shown in Figure 3 and Figure 4, both the pressure and velocity fields exhibit similar trends. In the grinding zone, the velocity is lowest at the grinding convergence center, corresponding to the highest pressure, while velocities are relatively higher and pressures lower at the outlet. Moreover, the product volume distribution follows a similar trend, with most particle diameters falling within the range of 0–40 µm. The simulations showed an average particle size of 12.63 µm, while Lee [22] obtained an average particle size of 11.83 µm at 10,000 rpm. Though minor disparities exist, attributed to differing models utilized in our study compared to the literature, as well as the stochastic nature of particle collision and fragmentation, the overall trends remain consistent.

4. Result and Discussion

4.1. Target Plate Structure Optimization

The relative wear model [33] is used in EDEM, and the particles are bounced back to the wall after colliding and breaking, which leads to the wear of the equipment. Additionally, the distribution of tangential cumulative force on the equipment reflects the distribution of wear on the device. Through the analysis of the tangential cumulative force distribution result, the zone with the most serious wear is identified. As shown in Figure 5a, two ‘Λ’-shaped silicon carbide target plates are added to the center of the grinding zone of the fluidized bed opposed jet mill, and the angle between the target plates is 15°. The particles are accelerated by high-speed airflow and collide with the target plate, and they rebound and grind with the inner wall of the grinding chamber many times. The numerical simulation of the model with and without the target plate structure is carried out. The quartz particles with a diameter of 1 mm are selected as the feed particles, and the feed rate is 7 g/s. To improve computational efficiency, the particles are released in a short time interval (0.008 s).
As shown in Figure 5a, it is observed that when there is a target plate structure in the grinding zone, the cumulative force is mainly distributed on the target plate, while the inner wall wear of the grinding zone is less. This is because the particles mainly collide with the target plate to grind under the action of air flow, and some particles bounce back to the inner wall of the grinding zone for secondary grinding. As shown in Figure 5b, the wear of the equipment without a target plate is mainly concentrated on the wall of the feed nozzle tube and the inner wall of the grinding zone. The cumulative tangential force on the nozzle wall is 2.67 × 10⁵ N, while the cumulative tangential force on the inner wall of the grinding zone is 4.14 × 10⁵ N. Consequently, it can be inferred that the inner wall of the grinding zone undergoes more serious wear due to these higher forces. Additionally, within the grinding zone, the cumulative tangential force applied to the central region is 3.07 × 10⁵ N, whereas the forces at the edges and corners reach 1.07 × 10⁵ N. As a result, the wear on the central region of the inner wall is more severe compared to the wear at the edges. This is because when there is no target plate, particles are driven by the airflow, colliding and grinding with each other, and some particles rebound to the inner wall of the grinding zone and the edge of the pipe wall for secondary grinding. It can be seen that the non-target plate structure has less wear on the equipment than the target plate structure. This is because the accelerated particles collide and grind at the convergence of the center of the grinding zone, and most of the kinetic energy is converted into grinding energy. Therefore, the non-target plate structure helps to reduce the wear of the equipment.
Figure 6 shows the comparison of total tangential cumulative force and particle size distribution with or without target plate structure. In Figure 6a, the cumulative tangential force of the equipment increases sharply, and the wear quantity increases greatly within 0.015 s. The total cumulative tangential force of the equipment with a target plate is 1.94 × 10⁶ N, while the cumulative tangential force of the equipment without a target plate is 8.41 × 10⁵ N, which indicates that the wear quantity of the equipment with a target plate is larger than that of the equipment without a target plate. Figure 6b shows the cumulative distribution of particle size with the fitting of the 3-exponential (ExpDec3) function, and R2 shows the fitting degree of the fitting line. For simulation results with or without the target plate structure, the D50 of particles is 82.4 µm and 57 µm, respectively, while the D90 of particles is 681.1 µm and 299.3 µm, respectively. The grinding process without the target plate structure results in smaller D50 and D90 particle sizes, indicating a higher proportion of fine particles, uniform particle distribution, and a narrower particle size distribution. Therefore, the fluidized bed opposed jet mill without the target plate structure is selected for further study.
As depicted in Figure 7, during the analysis of the velocity contour while adding the target plate structure, certain ‘dead zones’ can be observed. These zones are located at the upper center, inner side, and lower part of the target plate, where airflow velocities are relatively low. When particles reside in these regions, it becomes difficult for them to undergo further grinding and fragmentation. Consequently, the inclusion of the target plate structure leads to a higher proportion of coarse particles and a wider particle size distribution. With the target plate in place, materials impact the plate walls at high speeds for grinding, primarily undergoing impact fragmentation, thus resulting in the formation of larger coarse particles. Conversely, in the absence of the target plate structure, particle-to-particle collisions primarily lead to impact and edge fragmentation [34], the latter contributing to the formation of finer particles. Hence, finer products are obtained in configurations without the target plate.

4.2. Distance between the Nozzle and the Grinding Convergence Center L

To further optimize the structure of the jet mill, the distance between the nozzle outlet and the convergence center of the grinding zone is defined as L, and the structure is shown in Figure 2. The parameters are determined by practical engineering application, while modeling and simulation analysis are carried out for different distances L. The mechanisms of complex flow in the grinding zone and the influence of distances L on the grinding efficiency are explored. The simulation conditions are shown in Table 5.

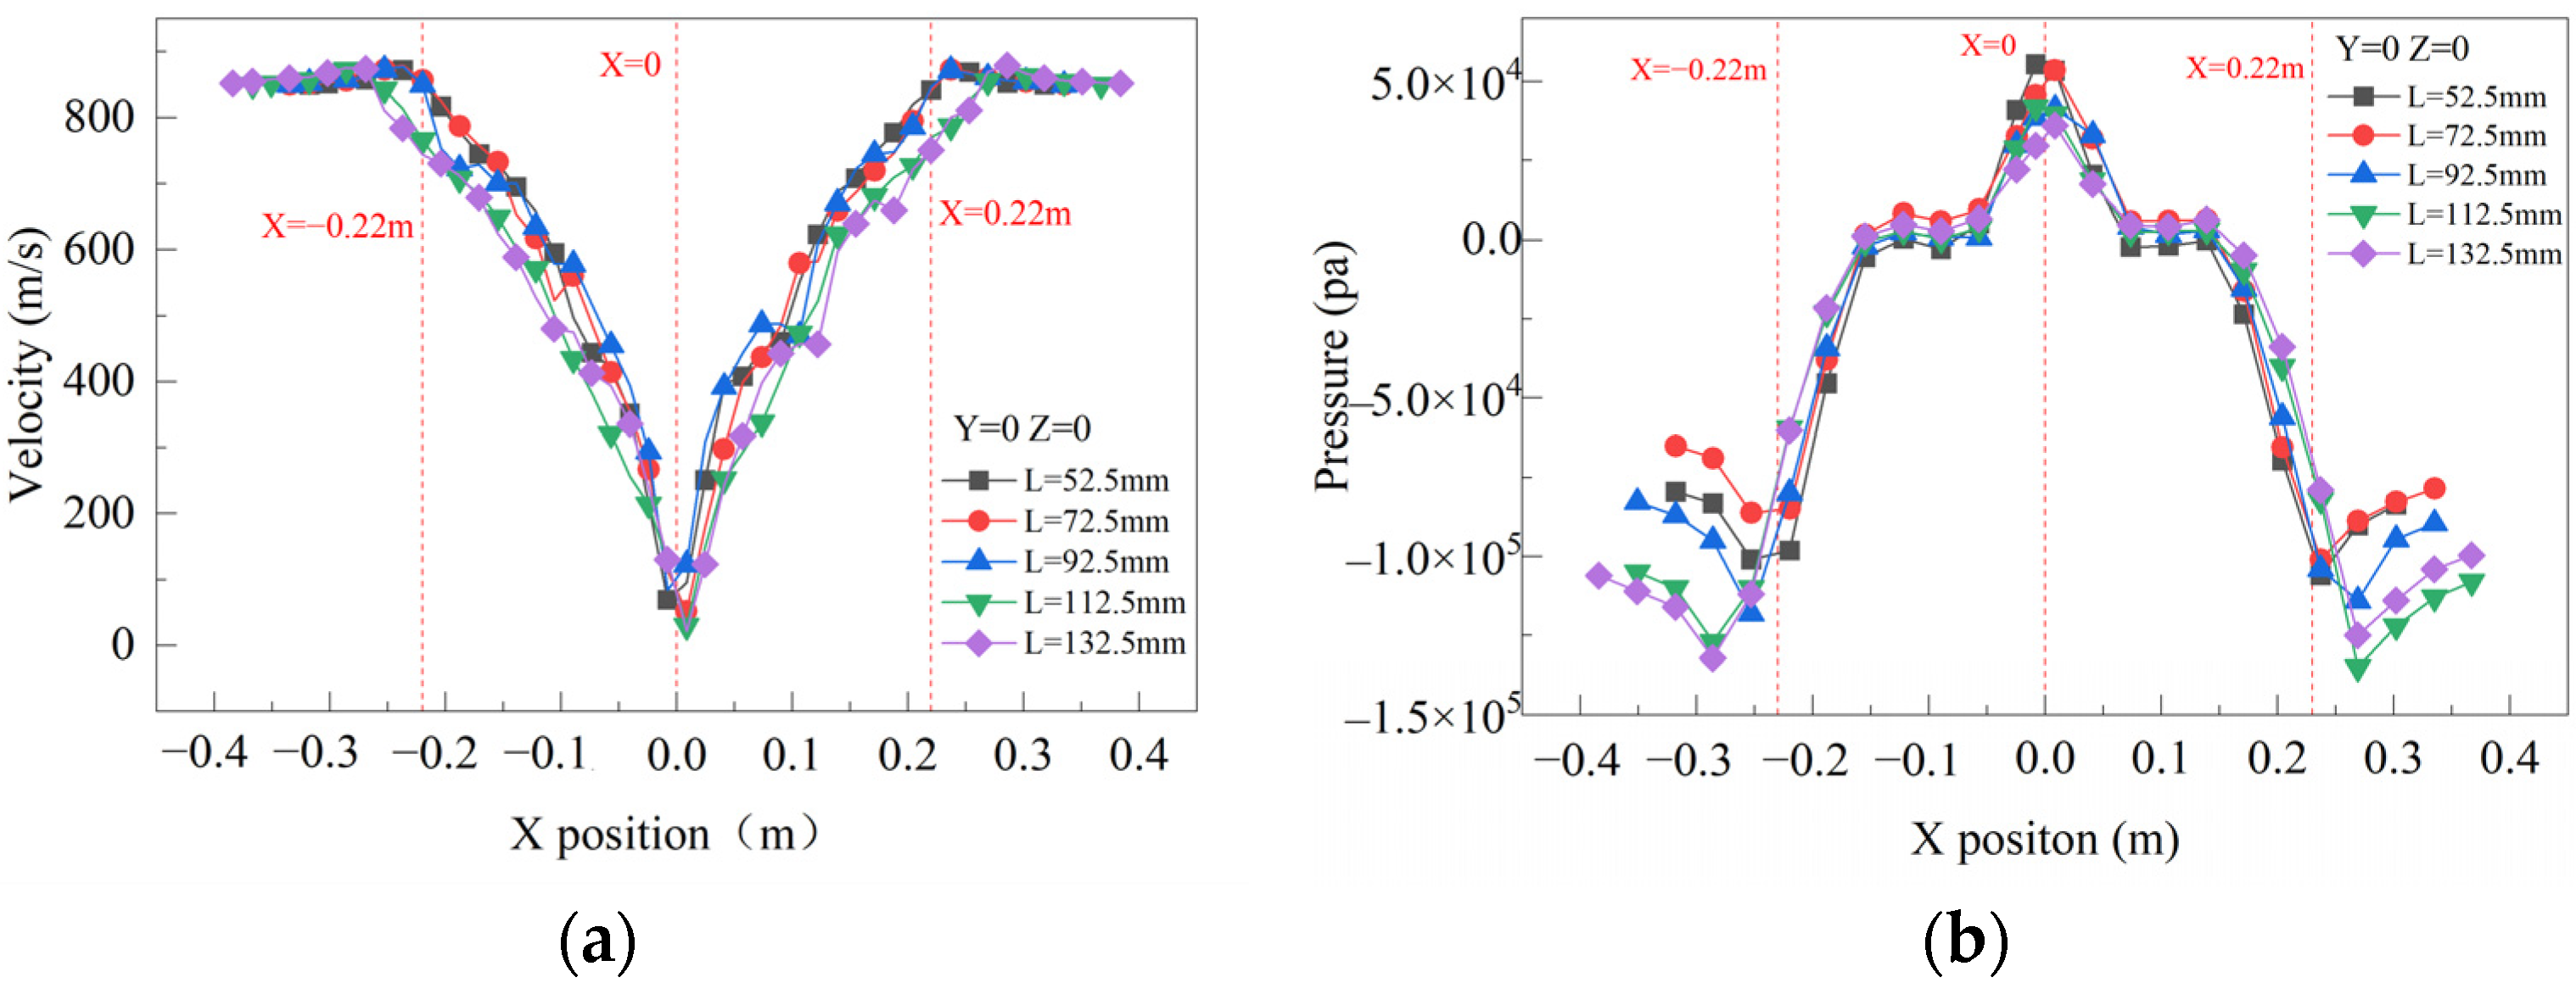
4.2.1. Flow Field of the Grinding Zone

In Figure 8, the flow field in the grinding zone is analyzed under the condition that the inlet speed is 850 m/s and L is 92.5 mm. The high-speed jet is ejected from the nozzle, and the particles entrained by the airflow converge and collide at a high speed at the center of the grinding zone. As the airflow collides with each other, rising and falling airflows are formed at the center. The falling airflow causes the particles to return to the grinding zone and continue to grind, while the rising airflow transports the ground particles to the outlet.
As shown in Figure 8a, the highest airflow velocity can be found at the nozzle outlet in the grinding zone. After the particles accelerate for a period of time, the airflow velocity gradually decreases along the axial direction due to the continuous exchange of kinetic energy between particles and airflow. The particles collide and grind at the center of the grinding zone, and the airflow velocity is the smallest in this zone. It is observed that the airflow velocity is relatively low near the inner wall, which reduces the wear between the particles and the wall surface and improves the reliability of the equipment. As shown in Figure 8b, the airflow begins to converge at the center of the grinding zone to maximize the pressure in the central zone. This is due to the minimum airflow velocity in the center zone.
As shown in Figure 9, with the different separation distances L, the positions of the maximum airflow velocity vary between 0.22 m and 0.35 m on both sides of the X-axis (Y = 0 and Z = 0 in Figure 2). From the positions of the maximum airflow velocity (around the point of X = ±0.22) to the airflow convergence center (X = 0), the pressure gradually rises and the airflow speed gradually decreases, which is conducive to the grinding of material particles. At the center of the airflow convergence (X is approximately 0), the airflow velocity is the lowest and the pressure is the highest.
When L = 52.5 mm, 72.5 mm, 92.5 mm, 112.5 mm and 132.5 mm, the lowest airflow velocity at the center of the grinding zone is 95.3 m/s, 51.7 m/s, 36.1 m/s, 29.8 m/s and 21.5 m/s, respectively, which all occur at the position of 0.00816 m on the X-axis. At this time, the pressure is the largest, which is 53,400 Pa, 53,600 Pa, 41,400 Pa, 39,700 Pa, and 36,000 Pa, respectively. Therefore, at the airflow convergence center, as the distance L increases, the minimum velocity of the airflow decreases and the maximum pressure increases.

4.2.2. Effect of Distance L on the Particle Grinding Process

In Figure 10a, the average velocity of the particles reaches the maximum value within 0.01 s by changing the distance L. The maximum velocities of the particles in the grinding zone are as follows: 135.52 m/s, 172.44 m/s, 194.82 m/s, 209.43 m/s and 222.52 m/s, which increases by 39.92 m/s, 22.38 m/s, 14.61 m/s and 13.09 m/s, respectively. It can be seen that increasing the distance L will increase the maximum velocity of the particle, as the particle’s acceleration distance under the drive of the airflow also increases with the increase of L, and the time to for acceleration becomes longer. Among them, the increase in particle velocity is most obvious when L increases from 52.5 mm to 72.5 mm. Although the maximum velocity of the particles is the highest when L = 132.5 mm, the particles cannot immediately collide when they are fully accelerated due to the large separation distance L. As the particles continue to move with the airflow, the velocity of the particles will then gradually decrease until the particles collide due to the influence of fluid resistance, which imposes negative effects on the grinding efficiency. Therefore, the structure of L = 132.5 m is not considered as the optimal structure in the present study.
Figure 10b shows the cumulative particle size distribution with the ExpDec3 function fitting. With different separation distances L, R2 is always within the range of 0.99–1, which indicates that the cumulative particle size distribution could be well fitted by the ExpDec3 function. It can also be found that the results of cumulative particle size distribution show consistent trends under different L values, and the particle D50 gradually increases from 36.3 µm to 69.1 µm with the increase of distance L. As the separation distance increases, the particle size distribution becomes wider. Because a narrow particle size distribution of ground product particles is always required in practical engineering, the structure with the smaller separation distance L is preferred. Additionally, for L = 52.5 mm and 72.5 mm, the maximum particle velocities are 135.52 m/s and 172.44 m/s, respectively, which have been nearly fully accelerated. Therefore, the structure with L between 52.5 mm and 72.5 mm is regarded as the optimal structure and will be used in later study, as it shows a narrower particle size distribution and better grinding performance.

4.3. Optimization of Operating Parameters

4.3.1. Effect of Inlet Velocity (Vi) on the Particle Grinding Process

To improve computational efficiency and simplify the simulation, the structure of the Laval nozzle is ignored, and the inlet velocity Vi is defined as the gas velocity at the nozzle outlet without considering the details of airflow under the influence of the nozzle shape. Once the particles are released into the airflow, they will be accelerated by an airflow with a velocity of Vi. The inlet velocity will affect the particle velocity, thus affecting the grinding efficiency.
As shown in Figure 11a, when the inlet velocity Vi = 750 m/s, 850 m/s, 950 m/s, 1050 m/s, within 0.008 s, the particle velocity reaches the maximum value, which is 132.1 m/s, 204.84 m/s, 245.91 m/s, 267.64 m/s, respectively, which is increased by 72.74 m/s, 41.07 m/s, 21.73 m/s. The particle velocity increases most obviously when the airflow velocity is from 750 m/s to 850 m/s. After 0.02 s, the average velocity of the particles tends to be stable, and the average velocity and maximum velocity of the particles increase with the increase of the inlet velocity. Due to the increase of the inlet velocity, the material particles are accelerated by the airflow, thus obtaining more kinetic energy.
Figure 11b shows the particle size distribution at different inlet velocities, and peaks appear when the product particle size is 11 μm and 200 μm. After grinding, for the particles with a diameter greater than 150 μm, the particles with a diameter of 200 μm show the highest proportion. This can be attributed to the use of the Tavares UFRJ Breakage Model based on the particle replacement model in the simulation [24], as illustrated in Figure 1. When particles are impacted, surface damage and breakage occur, leading to the replacement of the fragmented particles with others of varying diameters. The size distribution obtained from the particle replacement model can be obtained from slow compression experiments [35] or impact tests [36]. Additionally, the particle size of approximately 1/5th of the original particle size is of special significance [37], as there is a peak in the particle size distribution within this size range. This is consistent with the observed particle size distribution patterns in the slow compression experiments [35] and impact tests [36]. Therefore, the Tavares UFRJ Breakage Model is used to simulate the grinding process of superhard particles, which can predict the particle size distribution of the product after grinding. The percentage with the product particle diameter of 11 μm represents the proportion of fine particles in the present study. When Vi is 750 m/s, 850 m/s, 950 m/s, and 1050 m/s, the proportion of fine particles with a diameter of 11 μm is 46.695%, 45.728%, 51.613%, and 55.504%, respectively. The fine particles obtained by grinding at Vi = 950 m/s and Vi = 1050 m/s are significantly more than those at 750 m/s and 850 m/s. As Vi increased from 850 m/s to 950 m/s and 1050 m/s, the proportion of fine particles of 11 μm increased by 5.885% and 3.891%, respectively, which means that when Vi = 950 m/s and 1050 m/s, the product has finer particles and better grinding performance, which can meet the requirements of engineering application. Therefore, the preferred Vi is 950 m/s and 1050 m/s for particle grinding. However, in practical engineering applications, the higher the airflow velocity, the more energy is required for the equipment. Therefore, Vi = 1050 m/s is not considered in this study, and Vi = 950 m/s is selected as the optimal inlet velocity in the present study, at which the grinding performance is better.

4.3.2. Effect of Feed Rate (F) on the Particle Grinding Process

The particles are released at the feed nozzle, while the inlet velocity is 950 m/s and the distance L = 72.5 mm. Different feed rates F of 3.5 g/s, 7 g/s, 10.5 g/s, 14 g/s, and 17.5 g/s are employed to study the effect of feed rate F on the grinding process.
As shown in Figure 12a, the velocity of particles reaches the maximum value within 0.01 s. When F = 3.5 g/s, 7 g/s, 10.5 g/s, 14 g/s, and 17.5 g/s, the maximum velocity of particles is 170.52 m/s, 160.93 m/s, 146.76 m/s, 119.42 m/s, and 100.77 m/s, respectively. The maximum velocity of particles decreases with the increase of F. This is because with the increase of F, on the one hand, the concentration of particles in the grinding zone increases at the same time, the energy that can be obtained by a single particle decreases, the kinetic energy of particles is low, and particles are difficult to be accelerated. On the other hand, the increase of F leads to the accumulation of particles near the feed nozzle to form a granular bed, which limits the flow rate of airflow, thus affecting the increase of particle velocity. After 0.02 s, the average velocity of particles tends to be stable between 40 m/s and 45 m/s; when F is between 3.5 g/s and 10.5 g/s, the average velocity of particles decreases with the increase of feed rate.
The increase of feed rate F means that the number of particles in the grinding zone at the same time is greater; therefore, the number of collisions between particles and the grinding probability increases. However, Figure 12b shows the cumulative particle size distribution after fitting the ExpDec3 function, and it can be seen that with the increase of the feed rate F, the D50 is 25 µm, 26 µm, 39 µm, 53 µm, and 65 µm, respectively. The D50 increases with the increase of F, which means that as the feed rate increases, the particle size distribution becomes wider. When F = 17.5 g/s, the particle size distribution is relatively wide. This is due to the increase in the feed rate F, the available kinetic energy per individual particle is reduced. As a result, the decrease in particle velocity leads to the difficulty of breaking particles and the increase of coarse particles.
When F decreases, the number of particles in the grinding chamber decreases at the same time, and more kinetic energy can be obtained by a single particle. As shown in Figure 12a, the average velocity of the particles increases, but the decrease in particles leads to a decrease in particle collision frequency. Under the condition of F = 3.5 g/s, the particle collision and grinding probability becomes low due to the small particle concentration, and the grinding performance does not achieve the expected performance. When F = 17.5 g/s, there are more coarse particles. Therefore, both excessively large and excessively small values of F are unfavorable for the comminution of the material; there exists an optimal feed rate F, which ensures a narrow distribution of particle sizes and obtains a desirable grinding efficiency [38]. As shown in Figure 12b, the cumulative particle size distribution exhibits the smallest standard deviation when F = 10.5 g/s. This indicates that the optimal feed rate F (10.5 g/s) results in a narrower particle size distribution, achieving the desired grinding efficiency.

4.4. Experimental Verification

As shown in Figure 13, a certain type of fluidized bed opposed jet mill was used in the experiment. The feed particles were 180 μm quartz particles. The rotation speed of the classifier wheel was 10,000 rpm, the grinding pressure was 0.8 MPa, the distance L = 72.5 mm, and the grinding time was set to 10 min. The feed rate Fi is selected as 7 g/s, 10 g/s and 14 g/s. After collecting samples, the particle size distribution and particle morphology were observed using a Malvern particle size tester and scanning electron microscope (SEM).

4.4.1. Particle Size and Distribution

As shown in Figure 14, the particle size distribution and particle cumulative distribution at different feed rates were obtained under the grinding pressure of 0.8 MPa. The particle size D50 of the product varies with different feed rates, with values of 3.6 µm, 4.8 µm, and 6.1 µm; similarly, the D90 values are 10.531 µm, 12.353 µm, and 13.140 µm respectively. When Fi increased from 10 g/s to 14 g/s, D90 increased by 1.822 µm, and the particle size distribution became wider. The particle fineness decreased with an increase in feed rate, leading to an increase in the average particle size and a widening of the particle size distribution.
The experimental result is consistent with the simulation results in Section 4.3.2. When Fi = 7 g/s, more fine particles lead to uneven product distribution. When Fi is 10 g/s, the fineness of the product particles is better and the particle size distribution is more uniform. Therefore, 10 g/s is selected as the feed rate for the practical project. The simulation shows that the grinding result is better at the feed rate of 10 g/s, which is consistent with the results of the experimental feed rate.
Figure 15 shows the cumulative distribution comparison between the experiment and the simulation. The inlet velocity is 950 m/s through the simulation of 0.8 MPa grinding pressure. The other simulation and experiment conditions are as follows: the diameter of the feed particles is 180 μm, the rotation speed is 10,000 rpm, L = 72.5 mm, F = 10 g/s and the simulation time is 0.03 s. Furthermore, according to the literature [25,39], it is observed that particles of varying sizes of the same material maintain consistent settings for parameters such as γ, Emin, and Ct in the context of the Tavares UFRJ Breakage model. The fitting parameters A and b related to t10 remain unchanged, whereas parameters E, φ, and σ undergo alterations. Specifically, the parameter settings for particles with a size of 120 μm are as follows: E = 370.9 J/kg, φ = 1.55, σ = 0.37. The simulation results show a particle D50 value of 9.863 µm, while the particle D50 obtained by the experiment is 6.1 μm. This is due to the time limitation of calculation, and the particles are ground in a short time. The particle D50 and the particles larger than 50 μm are not completely ground, and there is a tendency to continue to grind. In the simulation, 5% of the particles are not completely ground between 50 μm and 100 μm. Therefore, the simulated D50 is 3.763 μm, slightly larger than the experimental D50 within a reasonable range. Additionally, the cumulative particle size distribution trend obtained by numerical simulation is basically consistent with the experimental results, and the accuracy of the simulation results is verified by experiments.

4.4.2. Analysis of Particle Morphology

As shown in Figure 16, the size and morphology of the initial particles and the abrasives at different feed rates Fi were observed by SEM. The particle grinding mode in the fluidized bed opposed jet mill is mainly impact and wear, as shown in Figure 16b. When the feed rate decreases, the kinetic energy obtained by a single particle increases, the particle size of the block particles is reduced, and the small debris particles are increased. The edges of the large particles are sharp, and the shape is irregular. The particle grinding mechanism is mainly impacted, so irregularly shaped large particles are generated, and the surface is rough and uneven.
As shown in Figure 16d, when the feed rate increases, numerous block-shaped particles emerge, with a higher proportion of coarse particles and a relatively smaller proportion of small debris particles. This is because when the feed rate increases, the kinetic energy obtained by a single particle decreases, which is not enough to make the particles completely broken. The particle grinding mechanism is mainly shear wear, friction and shear between particles, causing the trimming of the edges of larger particles and producing fine debris, so the particle size is larger and the roundness is higher.
As shown in Figure 16c, when the feed rate is moderate, the particle size distribution is more uniform, the surface of the rough particles after grinding is uneven, the shape is irregular, and the abrasive retains a certain angle. It is suitable for use as a filler material in the ceramic and building fields. The fine particles after discharge have high roundness, regular shape, and good uniformity, which are suitable for use as coatings in the electronic field.

5. Conclusions

The CFD-DEM coupling method is used to study the process and mechanism of particle grinding in the fluidized bed opposed jet mill, where the target plate structure, nozzle position, gas inlet velocity, and the feed rate of particles have been taken into consideration. The simulation results are verified by experiments to obtain the optimal structural and operational parameters. Using scanning electron microscopy (SEM) to observe the morphology of particles at different feed rates, an analysis of the applications of particles with different morphologies is conducted. The main research results are as follows:
  • The non-target plate structure in the grinding zone is beneficial to reduce the wear of the equipment. From 0 to 0.015 s, the tangential cumulative force of the equipment without the target plate structure is 8.41 × 10⁵ N, which is less than 1.94 × 10⁶ N when the equipment has a target plate structure. When there is a target plate, the particles are mainly broken by impact, resulting in the formation of large coarse particles. On the contrary, when there is no target plate structure, the collision between particles mainly leads to impact and edge breakage, which is more conducive to the formation of finer particles. Therefore, the particle size distribution without the target plate structure is narrower and more uniform after grinding, which further verifies the advantage of the non-target plate structure in the grinding zone;
  • According to the numerical simulation, the optimal structural and operational parameters are obtained as follows: the distance between the nozzle and the grinding convergence center L is between 52.5 mm and 72.55 mm, the gas inlet velocity Vi is 950 m/s, and the feed rate F is 10.5 g/s; the grinding performance is better under this condition;
  • Under the experimental conditions where the inlet pressure is 0.8 MPa, the feed particle size is 180 μm, and the distance between the nozzle port and the grinding convergence center L = 72.5 mm, the particle size distribution becomes wider with the increase of Fi, which is consistent with the simulation results. Selecting Fi = 10 g/s as the feed rate for the practical engineering project proves most suitable, resulting in a uniform distribution of product particle sizes. Furthermore, the comparison between experiment and simulations reveals that the simulated D50 is 9.863 µm, which is slightly larger than the D50 of 6.1 µm obtained by experiments; the negligible deviation validates the simulation results;
  • The morphology of the grinding particles is observed by SEM. It is concluded that when Fi is small, the particle grinding form is mainly impact, with a large particle size and irregular shape, which is suitable for filling materials for ceramics and buildings. When Fi increases, the particle grinding form is mainly abrasion, and the shape of the small particles after edge grinding shows higher roundness, which is suitable for coating as an electronic material.

Author Contributions

Conceptualization, L.S.; methodology, X.L.; software, L.S.; validation, L.S.; formal analysis, X.J.; investigation, S.S., Q.H. and X.H.; resources, X.L.; data curation, X.L.; writing—original draft preparation, L.S.; writing—review and editing, X.L. and X.J.; supervision, X.L., X.J. and H.L.; funding acquisition, X.L. All authors have read and agreed to the published version of the manuscript.

Funding

This project was financially supported by the Jiangsu Key Laboratory of Green Process Equipment, grant number GPE2023013; the Natural Science Foundation of Jiangsu Province, grant number BK20210854; and the research fund of Jiangsu Province Engineering Research Center of Intelligent Manufacturing Technology for the New Energy Vehicle Power Battery, grant number ERC202204.

Data Availability Statement

The data presented in this study are available on request from the corresponding author due to certain policy reasons.

Acknowledgments

The authors would also like to thank the Jiangsu Key Laboratory of Green Process Equipment, and Liu and Jiang from Changzhou University are also gratefully acknowledged.

Conflicts of Interest

The authors declare no conflicts of interest.

References

  1. Tao, Q.; Ding, W.; Chen, G.; Qu, X.; Han, L.; Qin, M. Effect of Jet Milling on HDH CP-Ti Powders: Microstructure and Properties. JOM 2021, 73, 3102–3110. [Google Scholar] [CrossRef]
  2. Koeninger, B.; Spoetter, C.; Romeis, S.; Weber, A.P.; Wirth, K.E. Classifier performance during dynamic fine grinding in fluidized bed opposed jet mills. Adv. Powder Technol. 2018, 30, 1678–1686. [Google Scholar] [CrossRef]
  3. Liu, Q.; Zhang, Z.; Zhai, J.; Zhang, S.; Zhou, K.; Melnikov, A.; Gagarin, L. Geometric form changes of soil quartz minerals under Freeze-thaw weathering. Eng. Geol. 2023, 320, 107133. [Google Scholar] [CrossRef]
  4. Yang, J.; Zhu, P.; Li, H.; Li, Z.; Huo, X.; Ma, S. Impact Crushing Characteristics and Relationship between Multicomponent Complex Ore and Its Component Minerals. Minerals 2023, 13, 676. [Google Scholar] [CrossRef]
  5. Ma, S.; Yang, X.; Li, H.; Xu, W.; Deng, X.; Yang, J. Study on Grinding Behavior Characteristics under Low-Speed Grinding Condition. Minerals 2023, 13, 786. [Google Scholar] [CrossRef]
  6. Wang, L. Industrial Types and Application Characteristics of Quartz Ore Deposits. Conserv. Util. Miner. Resour. 2019, 39, 39–47. (In Chinese) [Google Scholar] [CrossRef]
  7. Antonella, D.G.; Alessandro, C.; Alessandra, F.; Rossi, P.; Susanna, M. Raw materials supply: Kaolin and quartz from ore deposits and recycling activities. The example of the Monte Bracco area (Piedmont, Northern Italy). Resour. Policy 2021, 74, 102473. [Google Scholar]
  8. Malathy, R.; Rajagopal Sentilkumar, S.R.; Prakash, A.R.; Das, B.B.; Chung, I.M.; Kim, S.H.; Prabakaran, M. Use of Industrial Silica Sand as a Fine Aggregate in Concrete—An Explorative Study. Buildings 2022, 12, 1273. [Google Scholar] [CrossRef]
  9. Guo, Q.; Li, G.; Zhu, P.; Xu, Z.; Zhao, T.; Sun, R.; Wong, C.P. Interfacial engineering of epoxy/silica nanocomposites by amino-rich polyethyleneimine towards simultaneously enhanced rheological and thermal-mechanical performance for electronic packaging application. Compos. Part B 2022, 245, 110214. [Google Scholar] [CrossRef]
  10. Yeasmin, F.; Mallik, A.K.; Chisty, A.H.; Robel, F.N.; Shahruzzaman, M.; Haque, P.; Rahman, M.M.; Hano, N.; Takafuji, M.; Ihara, H. Remarkable enhancement of thermal stability of epoxy resin through the incorporation of mesoporous silica micro-filler. Heliyon 2021, 7, e05959. [Google Scholar] [CrossRef] [PubMed]
  11. Pan, X.; Li, S.; Li, Y.; Guo, P.; Zhao, X.; Cai, Y. Resource, characteristic, purification and application of quartz: A review. Miner. Eng. 2022, 183, 107600. [Google Scholar] [CrossRef]
  12. Kohobhange, S.P.K.; Manoratne, C.H.; Pitawala, H.M.T.G.A.; Rajapakse, R.M.G. The effect of prolonged milling time on comminution of quartz. Powder Technol. 2018, 330, 266–274. [Google Scholar] [CrossRef]
  13. Brosh, T.; Kalman, H.; Levy, A.; Peyron, I.; Ricard, F. DEM–CFD simulation of particle comminution in jet-mill. Powder Technol. 2014, 257, 104–112. [Google Scholar] [CrossRef]
  14. Liu, X.; Chen, Z. Numerical Simulation and Measurement of Flow Field in the Chamber of a Fluidized Bed Opposed Superfine Jet Mill. Chin. J. Process Eng. 2009, 9, 170–174. (In Chinese) [Google Scholar]
  15. Koeninger, B.; Hensler, T.; Romeis, S.; Peukert, W.; Wirth, K.-E. Dynamics of fine grinding in a fluidized bed opposed jet mill. Powder Technol. 2018, 327, 346–357. [Google Scholar] [CrossRef]
  16. Wang, L.; Wang, P.; Saleh, A.S.M.; Yang, Q.; Ge, Y.; Wang, N.; Yang, S.; Xiao, Z. Influence of Fluidized Bed Jet Milling on Structural and Functional Properties of Normal Maize Starch. Starch-Stärke 2018, 70, 1700290. [Google Scholar] [CrossRef]
  17. Araújo dos Santos, D.; Baluni, S.; Bück, A. Eulerian Multiphase Simulation of the Particle Dynamics in a Fluidized Bed Opposed Gas Jet Mill. Processes 2020, 8, 1621. [Google Scholar] [CrossRef]
  18. Liu, J.; Dai, J.; Jia, Y.; Yuan, Y. Jet milling in optimization of particle size of high purity lithium carbonate. Chem. Ind. Eng. Prog. 2018, 37, 4162–4167. (In Chinese) [Google Scholar] [CrossRef]
  19. Strobel, A.; Köninger, B.; Romeis, S.; Schott, F.; Wirth, K.-E.; Peukert, W. Assessing stress conditions and impact velocities in fluidized bed opposed jet mills. Particuology 2020, 53, 12–22. [Google Scholar] [CrossRef]
  20. Lu, X.; Liu, C.-C.; Zhu, L.-P.; Qu, X.-H. Influence of process parameters on the characteristics of TiAl alloyed powders by fluidized bed jet milling. Powder Technol. 2014, 254, 235–240. [Google Scholar] [CrossRef]
  21. Chen, J.; Pan, Z.; Wang, Y. Preparation of submicron-sized quasi-spherical silica particles via ultrafine grinding with chemical-dissolution assistance. Powder Technol. 2018, 339, 585–594. [Google Scholar] [CrossRef]
  22. Lee, H.W.; Song, S.; Kim, H.T. Improvement of pulverization efficiency for micro-sized particles grinding by uncooled high-temperature air jet mill using a computational simulation. Chem. Eng. Sci. 2019, 207, 1140–1147. [Google Scholar] [CrossRef]
  23. Lv, K.; Min, F.; Zhu, J.; Ren, B.; Bai, X.; Wang, C. Experiments and CFD-DEM simulations of fine kaolinite particle sedimentation dynamic characteristics in a water environment. Powder Technol. 2020, 382, 60–69. [Google Scholar] [CrossRef]
  24. Barrios, G.K.P.; Jiménez-Herrera, N.; Tavares, L.M. Simulation of particle bed breakage by slow compression and impact using a DEM particle replacement model. Adv. Powder Technol. 2020, 31, 2749–2758. [Google Scholar] [CrossRef]
  25. Tavares, L.M.; Rodriguez, V.A.; Sousani, M.; Padros, C.B.; Ooi, J.Y. An effective sphere-based model for breakage simulation in DEM. Powder Technol. 2021, 392, 473–488. [Google Scholar] [CrossRef]
  26. Tavares, L.M. Analysis of particle fracture by repeated stressing as damage accumulation. Powder Technol. 2008, 190, 327–339. [Google Scholar] [CrossRef]
  27. Xu, L.; Wu, F.; Ren, H.; Zhou, W.; Yan, Y. Experimental and numerical investigation on erosion of circular and elliptical immersed tubes in fluidized bed. Powder Technol. 2022, 409, 117820. [Google Scholar] [CrossRef]
  28. Ferreira, V.O.; El Geitani, T.; Junior, D.S.; Blais, B.; Lopes, G.C. In-depth validation of unresolved CFD-DEM simulations of liquid fluidized beds. Powder Technol. 2023, 426, 118652. [Google Scholar] [CrossRef]
  29. El-Emam, M.A.; Zhou, L.; Shi, W.; Han, C.; Bai, L.; Agarwal, R. Theories and Applications of CFD–DEM Coupling Approach for Granular Flow: A Review. Arch. Comput. Methods Eng. 2021, 28, 4979–5020. [Google Scholar] [CrossRef]
  30. Tavares, L.; King, R. Single-particle fracture under impact loading. Int. J. Miner. Process. 1998, 54, 1–28. [Google Scholar] [CrossRef]
  31. Tavares, L.M. Review and further validation of a practical single-particle breakage model. KONA Powder Part. J. 2022, 39, 62–83. [Google Scholar] [CrossRef]
  32. Sabia, C.; Casalini, T.; Cornolti, L.; Spaggiari, M.; Frigerio, G.; Martinoli, L.; Martinoli, A.; Buffo, A.; Marchisio, D.L.; Barbato, M.C. A novel uncoupled quasi-3D Euler-Euler model to study the spiral jet mill micronization of pharmaceutical substances at process scale: Model development and validation. Powder Technol. 2022, 405, 117573. [Google Scholar] [CrossRef]
  33. Cheng, Z.; Wang, X.; Wang, S.; Wang, S.; Yang, Z. Wear Analysis on Middle Pan of Scraper Conveyor. Coal Technol. 2017, 36, 227–229. (In Chinese) [Google Scholar] [CrossRef]
  34. Rajeswari, M.S.R.; Azizli, K.A.M.; Hashim, S.F.S.; Abdullah, M.K.; Mujeebu, M.A.; Abdullah, M.Z. CFD simulation and experimental analysis of flow dynamics and grinding performance of opposed fluidized bed air jet mill. Int. J. Miner. Process. 2011, 98, 94–105. [Google Scholar] [CrossRef]
  35. Cleary, P.W.; Sinnott, M.D. Simulation of particle flows and breakage in crushers using DEM: Part 1—Compression crushers. Miner. Eng. 2015, 74, 178–197. [Google Scholar] [CrossRef]
  36. Li, H.; McDowell, G.; Lowndes, I. Discrete element modelling of a rock cone crusher. Powder Technol. 2014, 263, 151–158. [Google Scholar] [CrossRef]
  37. Tavares, L.M.; Chagas, A.S.D. A stochastic particle replacement strategy for simulating breakage in DEM. Powder Technol. 2021, 377, 222–232. [Google Scholar] [CrossRef]
  38. Lewis, S.; Antonia, B.; Alan, B.; Mojtaba, G. Effect of grinding nozzles pressure on particle and fluid flow patterns in a spiral jet mill. Powder Technol. 2021, 394, 439–447. [Google Scholar]
  39. Tavares, L.M.; Cavalcanti, P.P.; Carvalho, R.M.D.; Silveira, M.W.D.; Bianchi, M.; Otaviano, M. Fracture probability and fragment size distribution of fired Iron ore pellets by impact. Powder Technol. 2018, 336, 546–554. [Google Scholar] [CrossRef]
Figure 1. Principle of the Tavares UFRJ Breakage Model: (a) Initial feed particle; (b) Replacement moment; (c) Broken particle.
Minerals 14 00437 g001
Figure 2. Geometric structure of the fluidized bed opposed jet mill. [mm]: 1—Classifier wheel; 2—Classifying zone; 3—Grinding zone; 4—Feed nozzle; 5—Air inlet nozzle.
Minerals 14 00437 g002
Figure 3. Comparison of the product volume distribution between simulation and the literature [22].
Minerals 14 00437 g003
Figure 4. Comparison of contours between simulation and the literature: (a) Comparison of velocity contour; (b) Comparison of pressure contour.
Minerals 14 00437 g004
Figure 5. Distribution of tangential cumulative force of equipment: (a) With target plate; (b) Non-target plate.
Minerals 14 00437 g005
Figure 6. Comparison of parameters with and without target plate: (a) Total tangential cumulative force; (b) Cumulative particle size distribution.
Minerals 14 00437 g006
Figure 7. Velocity contour and vector with target plate structure: (a) Velocity contour; (b) Velocity vector.
Minerals 14 00437 g007
Figure 8. Contours of velocity and pressure in the grinding zone: (a) Velocity contour; (b) Pressure contour.
Minerals 14 00437 g008
Figure 9. Comparison of cross-section airflow parameters under different L values: (a) Airflow velocity; (b) Airflow pressure.
Minerals 14 00437 g009
Figure 10. Comparison of particle parameters under different L values: (a) Particle average velocity; (b) Cumulative particle size distribution.
Minerals 14 00437 g010
Figure 11. Comparison of particle parameters under different Vi values: (a) Particle velocity; (b) Particle size distribution.
Minerals 14 00437 g011
Figure 12. Comparison of particle parameters under different F values: (a) Particle velocity; (b) Standard deviation of cumulative particle size distribution.
Minerals 14 00437 g012
Figure 13. Experimental fluidized bed opposed jet mill.
Minerals 14 00437 g013
Figure 14. Particle size distribution and cumulative distribution of experimental particles: (a) Particle size distribution; (b) Particle cumulative distribution.
Minerals 14 00437 g014
Figure 15. Comparison of cumulative particle size distribution between experiment and simulation.
Minerals 14 00437 g015
Figure 16. SEM photos of feed particles and particles at different feed rates: (a) Feed particles; (b) Fi = 5 g/s; (c) Fi = 10 g/s; (d) Fi = 14 g/s.
Minerals 14 00437 g016
Table 1. Parameters used in the Tavares UFRJ Breakage Model.
SymbolValueMeaning
d0 (mm)1The E50 parameter indicates the transition particle size
γ5Damage constant
E (J/kg)328.1Limiting crushing energy
Φ1.61To calculate the crushing energy of particles
σ0.4Standard deviation of the fracture energy
A (%)38.8Fitting parameter of the t10
b0.0176Fitting parameter of the t10
dmin (mm)0.01Minimum particle size for breakage
Emin1 × 10−4Minimum collision energy
Ct0Fraction of shear energy
Table 2. Particle and wall parameter settings in EDEM.
ObjectDensity/kg·m−3Poisson’s RatioShear Modulus/Pa
Particle26500.267.63 × 1010
Wall78000.307.00 × 108
Table 3. Contact parameter settings in EDEM.
Collision ModeContact ModelStatic Friction
μs
sliding Friction
μk
Restitution Coefficient
E
Particle–particleHertz-Mindlin0.380.050.3
Particle–wallHertz-Mindlin0.500.050.5
Table 4. Boundary condition settings in Fluent.
PositionBoundary ConditionInlet Velocity/(m/s)Hydraulic Diameter/mTurbulence Intensity/%
Gas inletVelocity inlet750–10500.024.5
OutletPressure outlet-0.065.0
Table 5. Simulation schemes for different L values.
Group NumberVi (m/s)L (mm)
185052.5
285072.5
385092.5
4850112.5
5850132.5
Disclaimer/Publisher’s Note: The statements, opinions and data contained in all publications are solely those of the individual author(s) and contributor(s) and not of MDPI and/or the editor(s). MDPI and/or the editor(s) disclaim responsibility for any injury to people or property resulting from any ideas, methods, instructions or products referred to in the content.

