
Crystallization of Jarosite with Variable Al3+ Content: The Transition to Alunite


Curtin Institute of Functional Molecules and Interfaces, Department of Chemistry, Curtin University, GPO Box U1987, Perth WA 6845, Australia
Minerals 2017, 7(6), 90; https://doi.org/10.3390/min7060090
Submission received: 28 March 2017
/
Revised: 29 May 2017
/
Accepted: 29 May 2017
/
Published: 1 June 2017
(This article belongs to the Special Issue Nucleation of Minerals: Precursors, Intermediates and Their Use in Materials Chemistry)
Abstract
:This study focused on the formation of the jarosite-alunite solid solution at relatively low temperature, 90 °C. It was found that the transition from jarosite to alunite results in significant changes in the powder X-ray diffraction pattern, the infrared spectrum and thermal behavior when the degree of substitution reached ≥50%. The initial Al/(Al + Fe) in solution, however, required to achieve these substitution levels in the solid is ≥90%. The morphology shows that the faceted jarosite form goes through an intergrown transition to a spherical morphology of pure alunite. This morphology has not been previously observed for alunite and most likely reflects the formation temperature. Rietveld analysis shows that the a lattice parameter obeys Vegard’s Rule while the c lattice parameter behavior is more complex. Empirical modelling of the incorporation of Fe into alunite supports the general trends found in the X-ray diffraction data for the behaviour of the a-axis with Al/Fe content. The dehydration of the Al3+ ion could be a significant contribution to the activation energy barrier to alunite formation as found for other minerals. Finally, dynamic light scattering showed that the nucleation behavior for jarosite and Fe-containing alunite are significantly different. Alunite appears to nucleate continuously rather than in a single nucleation event.
1. Introduction
The mixed iron sulphate mineral jarosite [KFe3(SO4)2(OH)6] forms under acidic, wet conditions such as acid sulphate soils [1], acid mine wastes [2], saline lakes [3] and hypogene systems [4]. Interest in jarosite increased after it was found on Mars in 2004 and confirmed that the planet had water at some point in its history [5]. In terrestrial environments, jarosite is also of interest. Acid-mine drainage is a serious environmental concern with jarosite a major mineral constituent of these systems [6,7]. The formation of jarosite in acid-mine drainage systems can be beneficial in that heavy metals can be incorporated into the structure, along with consumption of some of the acid [7,8], and thereby limit environmental harm [9,10]. Jarosite is also produced in some industrial hydrometallurgical operations (such as zinc processing) to remove unwanted iron and improve metal concentrates [11,12]. Understanding the formation of jarosite (and alunite) in the environment is important, therefore, for these reasons.
Alunite is isostructural with jarosite, where the Fe3+ is replaced with Al3+ [13,14,15,16,17]. Recently, it has also been found on Mars [18]. In nature, jarosite is said to be rarely found as the pure Fe end member and has some Al substitution [19,20]. In nature, however, many other substitutions are likely to be observed in the jarosite/alunite structures in addition to the Fe/Al substitution, as found by Scott [21,22]. For this reason, synthetic samples are often used to determine relationships free from other substitutional interferances [13,14,15]. Alunite is also said to be found in nature with significant Fe substitution [13,14,15], although studies on natural K-alunite/jarosite samples are rare in the literature. However, the work of Brophy et al. [23] makes the comment that “alunite show little, if any, Fe3+ even when the mineral occurs in an iron rich environment”. Despite this, Brophy et al. [23] were able to synthesise a variety of different compositions spanning the solid solution. Therefore, the lack of natural intermediates more likely reflects formation conditions. The work of Basciano and Peterson [24] mentions that, in many samples, vacancies can exist in both the A position (where the monovalent cation is found) and the octahedral B position (occupied by the Al or Fe ion in this case). Vacancies can result in hydronium ion substitution elsewhere in the structure for charge balancing reasons. However, Nielson et al. [25] found that the presence of hydronium ion is not common in alunite. In the alunite system, charge balancing probably occurs by having vacancies in the B site. Lower temperatures are also said to favour B site vacancies according to Scarlett et al. [26]. In addition, vacancies in the B site can cause significant c lattice parameter reductions.
Other comprehensive investigations of the jarosite-alunite solid solution are from the group of Navrotsky [13,14]. These investigations mainly focus on the thermodynamics [14] of formation and in particular the difference between Na and K containing jarosites [13]. There is a lack of information in these manuscripts on how the infrared spectroscopy or thermal behaviour alters for the entire solid solution from 0 to 1, but there is previously published infrared spectroscopy information on jarosite and alunite [9,15,27,28] looking at the formation of the Fe and Al end members of the jarosite family to determine their spectroscopic characteristics [9]. Similarly, the work of Rudolph et al. [29] looked at the formation of synthetic alunites and their characterisation by diffraction and thermal techniques. Finally, the work of Grube [15] looked at the impact of reaction times on alunite formation at 190 °C showing that longer times increases the potassium content.
This work aims to expand on these previous studies by investigating the formation of jarosite and alunite across the entire compositional range. The solids are investigated using X-ray diffraction, infrared spectroscopy, microscopy and thermogravimetry. The results from this set of data will clarify the influence of Fe and Al content on the properties of the particles, from morphology to spectroscopic and thermal behaviour. In particular, these solids are formed at relatively low temperatures (90 °C) in comparison to other studies (>100 °C) and can, therefore, serve as a starting point to understanding the role of formation temperatures on jarosite/alunite properties. The formation temperature of jarosite/alunite is important for many reasons. Geologically, the formation temperature is of fundamental importance, and, in acid-mine drainage systems, the formation temperature is closer to ambient conditions. In order to fully predict jarosite-alunite formation and the particle properties expected, research into lower formation temperatures is required. In addition, in many terrestrial environments, living organisms are able to interact with the growing mineral. Thus, this work is to determine the properties of the particles in the absence of organic matter so that how the solids differ in the presence of living organisms [30] can be properly assessed. These differences (if they exist) may be used as a proxy for determining whether the solids have had contact with living forms during their formation and could help identify when the sample is merely contaminated with organic matter. To complement the experimental data, the incorporation of Fe into alunite using empirical modelling methods has been undertaken to gain further insights into the mechanistic drivers for the solid solution formation. Finally, nucleation kinetics are presented in the presence and absence of Al3+ ions to determine whether the impurity cations significantly alter this.
2. Materials and Methods
2.1. Materials
Ferric sulphate Fe2(SO4)3∙xH2O was obtained from Chem Supply, Gillman, Australia (x was found to be ~9) and potassium nitrate was analytical reagent (AR) grade from Ajax Chemicals, Australia. To alter pH, concentrated sulphuric acid (H2SO4) >95% from Ajax Chemicals or potassium hydroxide (KOH), AR grade from BDH was used. Aluminium sulphate 18H2O (99% purity from BDH) was used as received and digestion of solids involved the use of concentrated hydrochloric acid (32%, AR grade from Ajax).
2.2. Jarosite Formation
Potassium jarosite was prepared according to the methods described in [4,30,31]. This involved dissolving Fe2(SO4)3∙xH20 (6.4 g) and KNO3 (24 g) into 800 g de-ionised water in a clean, glass bottle. Concentrated H2SO4 (0.8 mL) is added to the solution. The bottle is capped and the resulting clear solution is then heated to 90 °C for 24 h. After the allocated time, any solids formed are collected by filtering, washing with de-ionised water three times and drying in a desiccator.
Al3+ was added as Al2(SO4)3∙18H2O solid when present, prior to the addition of water, and dissolved along with the other solids (potassium nitrate and, when present, iron sulphate). The amount of aluminium sulphate was varied from 0 to 0.22 M in the solution.
2.3. Characterisation of Solids
2.3.1. Vibrational Spectroscopy
Infrared spectroscopy is a well-known method to characterize mineral forms as the spectra are phase-specific. The solids for Fourier transform infrared spectroscopy (FTIR) were placed onto a diamond attenuated total reflection (ATR) accessory of a Nicolet iS50 FTIR Spectrometer. A background spectrum was collected before each new scan. Data were collected from 400 to 4000 cm−1 with a spectral resolution of 4 cm−1 in absorbance mode. All spectra were corrected using the ATR correction mode of the instrument using the supplied OMNIC® software.
2.3.2. Scanning Electron Microscopy (SEM)
The washed and dried solids from crystallization experiments were placed on carbon coated SEM stubs and placed in a dessicator to let the stubs dry. They were then sputter-coated with gold or platinum prior to viewing on an Evo Zeiss (Oberkochen, Germany) instrument. The images were collected at a working distance of 10 mm and a voltage of 15 kV unless otherwise stated.
2.3.3. X-ray Diffraction (XRD)
Wide angle, powder XRD was obtained using a D8 Advance (Bruker, Billerica, MA, USA) diffractometer. The solids were dispersed in ethanol and cast onto low-background silicon holders. The XRD pattern was collected using Cu Kα radiation at a 2theta range of 10–50° and 10–120°. The step size was 0.001 for the small angle scan and 0.02 for the larger angle scan using a divergence slit of 0.3°. The sample holder was spun at 30 rpm. Rietveld analysis was performed using the Topas® software. Appropriate cif files for alunite (ICSD#12106)) and jarosite (ICSD#34344) were obtained and the crystal structures were refined against these. Goodness of fit (GOF) values ranged from 1.81 to 2.96 (fitting statistics can be found in the Supplementary Materials, Table S1). A Rietveld refined structure with a GOF of 2.8 is shown in the Supplementary Materials (Figure S1).
2.3.4. Thermogravimetric Analysis (TGA)
TGA was conducted on a TA Instruments SDT 2960, capable of simultaneous DSC-TGA measurements. The thermograms were obtained from ambient to 800 °C at 5 °C per minute in air at a flow rate of 40 mL/min. Approximately 15 mg of sample was heated in a platinum pan for each measurement. The temperature of the instrument was calibrated against the melting points of indium, zinc, tin, silver and gold. The balance was calibrated over the temperature range with standard alumina weights as provided by the vendor. The reproducibility in the mass loss measured was previously found to be ~3% [30].
2.3.5. Elemental Analysis
The solids obtained from synthesis were digested in concentrated HCl and were analyzed for Fe, Al, K and S content using an Agilent 720 inductively coupled plasma–atomic emission spectroscopy (ICP-AES). Analyses were conducted by the Marine and Freshwater Laboratory at Murdoch University.
2.3.6. Dynamic Light Scattering (DLS)
A Nanosizer ZS (Malvern, UK) was utilised to measure the DLS behaviour of solutions in the absence and presence of Al3+ (0.04 M, mole ratio Al:Fe 0.98) cations using a quartz cuvette. This instrument can operate at high temperatures, and so the particle size and particle counts were obtained at 90 °C. Therefore, the concentrations of iron sulphate, potassium nitrate and sulphuric acid and temperature were as per the crystallization experiments for pure jarosite and jarosite I with the pH of the solutions adjusted to pH = 2.1 to allow for comparison with the other experimental results. Both samples were filtered through a Supor 0.2 µm membrane prior to the analysis. The DLS can give two pieces of information: the particle counts and the particle size. The particle counts should be low until nucleation occurs and then will increase until a steady state is reached (in a batch system). Thus, the particle counts were used to determine nucleation rates [32].
2.4. Molecular Modelling
The modelling of cation incorporation was performed by using the previously reported empirical models for alunite [33] and the empirical methods described in [19,33,34] as a starting point. The only variables altered were the A values of the Buckingham Al and Fe-Ooxide (Al/Fe-O1) and Al and Fe-Ohydroxide (Al/Fe-O2) potentials in order to try and improve the fit, particularly for the c lattice parameter. Our previous sulphate potentials, unaltered, were used to model the sulphate molecule [35]. The results of the fitting procedure, along with the experimental values and all potential values are listed in the supplementary information (Tables S2 and S3). The visualization software GDIS [36] was used to construct the simulation cells and GULP [37] was used to minimize their energy. Firstly, a 2 × 2 × 1 supercell of alunite was constructed to give a supercell with similar a, b and c values. Differing degrees of the Al3+ ions were substituted for Fe3+ until all were substituted (36 ions in total). The starting configuration was minimized prior to the substitution of the different ions.
The equation describing the substitution of aluminium ions with iron ions is:
where n is the number of iron cations susbstituting in the supercell. The energy to replace aluminium ions, the Replacement Energy, Er, is calculated according to:
where Einitial is the starting energy of the pure alunite, Efinal is the energy with the iron ion present and n is defined as per Equation (1). The hydration energies of the ions, Ehydration, are the experimental values taken from [38].
K12Al36(SO4)24(OH)72 + nFe3+(aq) → K12FenAl(36-n)(SO4)24(OH)72 + nAl3+(aq),
Er = (Efinal + nEhydration Al) − (Einitial + nEhydration Fe),
3. Results
The jarosite samples discussed herein and the corresponding initial Fe/Al molar ratios can be found in Table 1.
3.1. Morphology
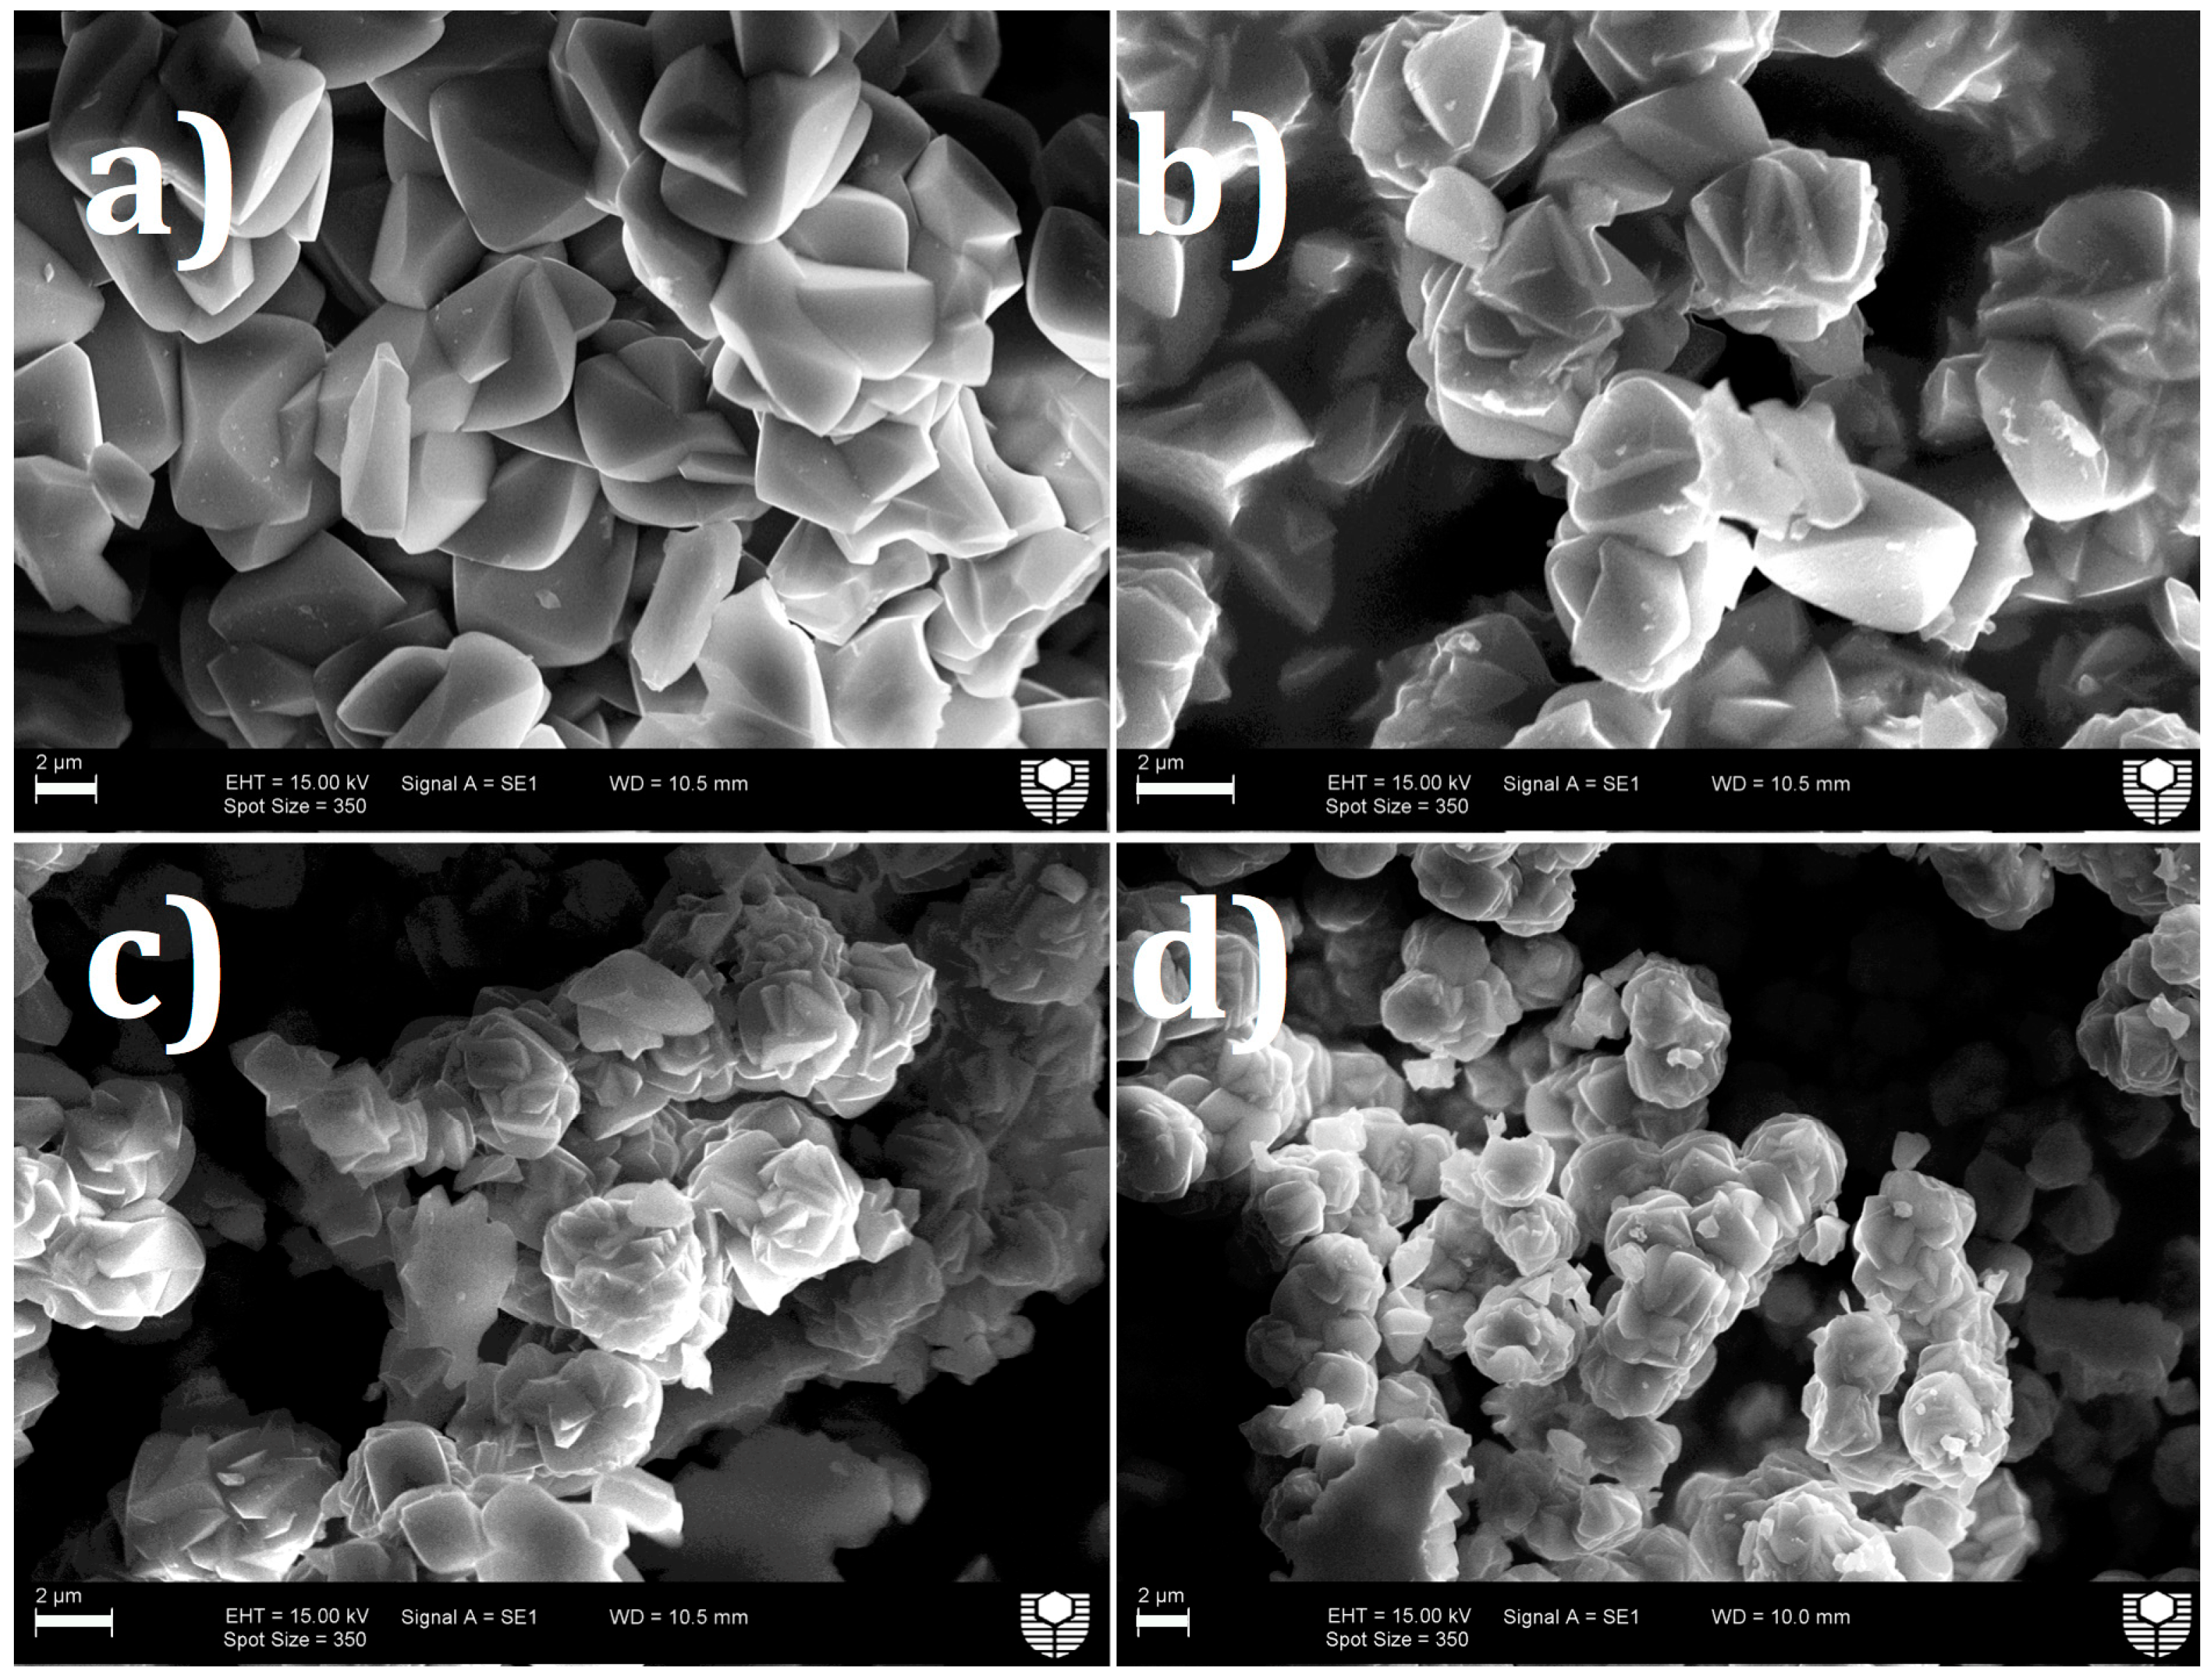
The jarosite particles formed (Figure 1) in the absence of Al3+ ions were similar to those seen by Sasaki [12,39,40]. As the ratio of Fe/Al decreases, the particle morphology did not alter significantly, but the degree of interparticle growth appeared to increase. It also appears that the individual particle size decreased as the ratio of Fe/Al decreased, although this was difficult to quantify due to the degree of intergrowth occurring.
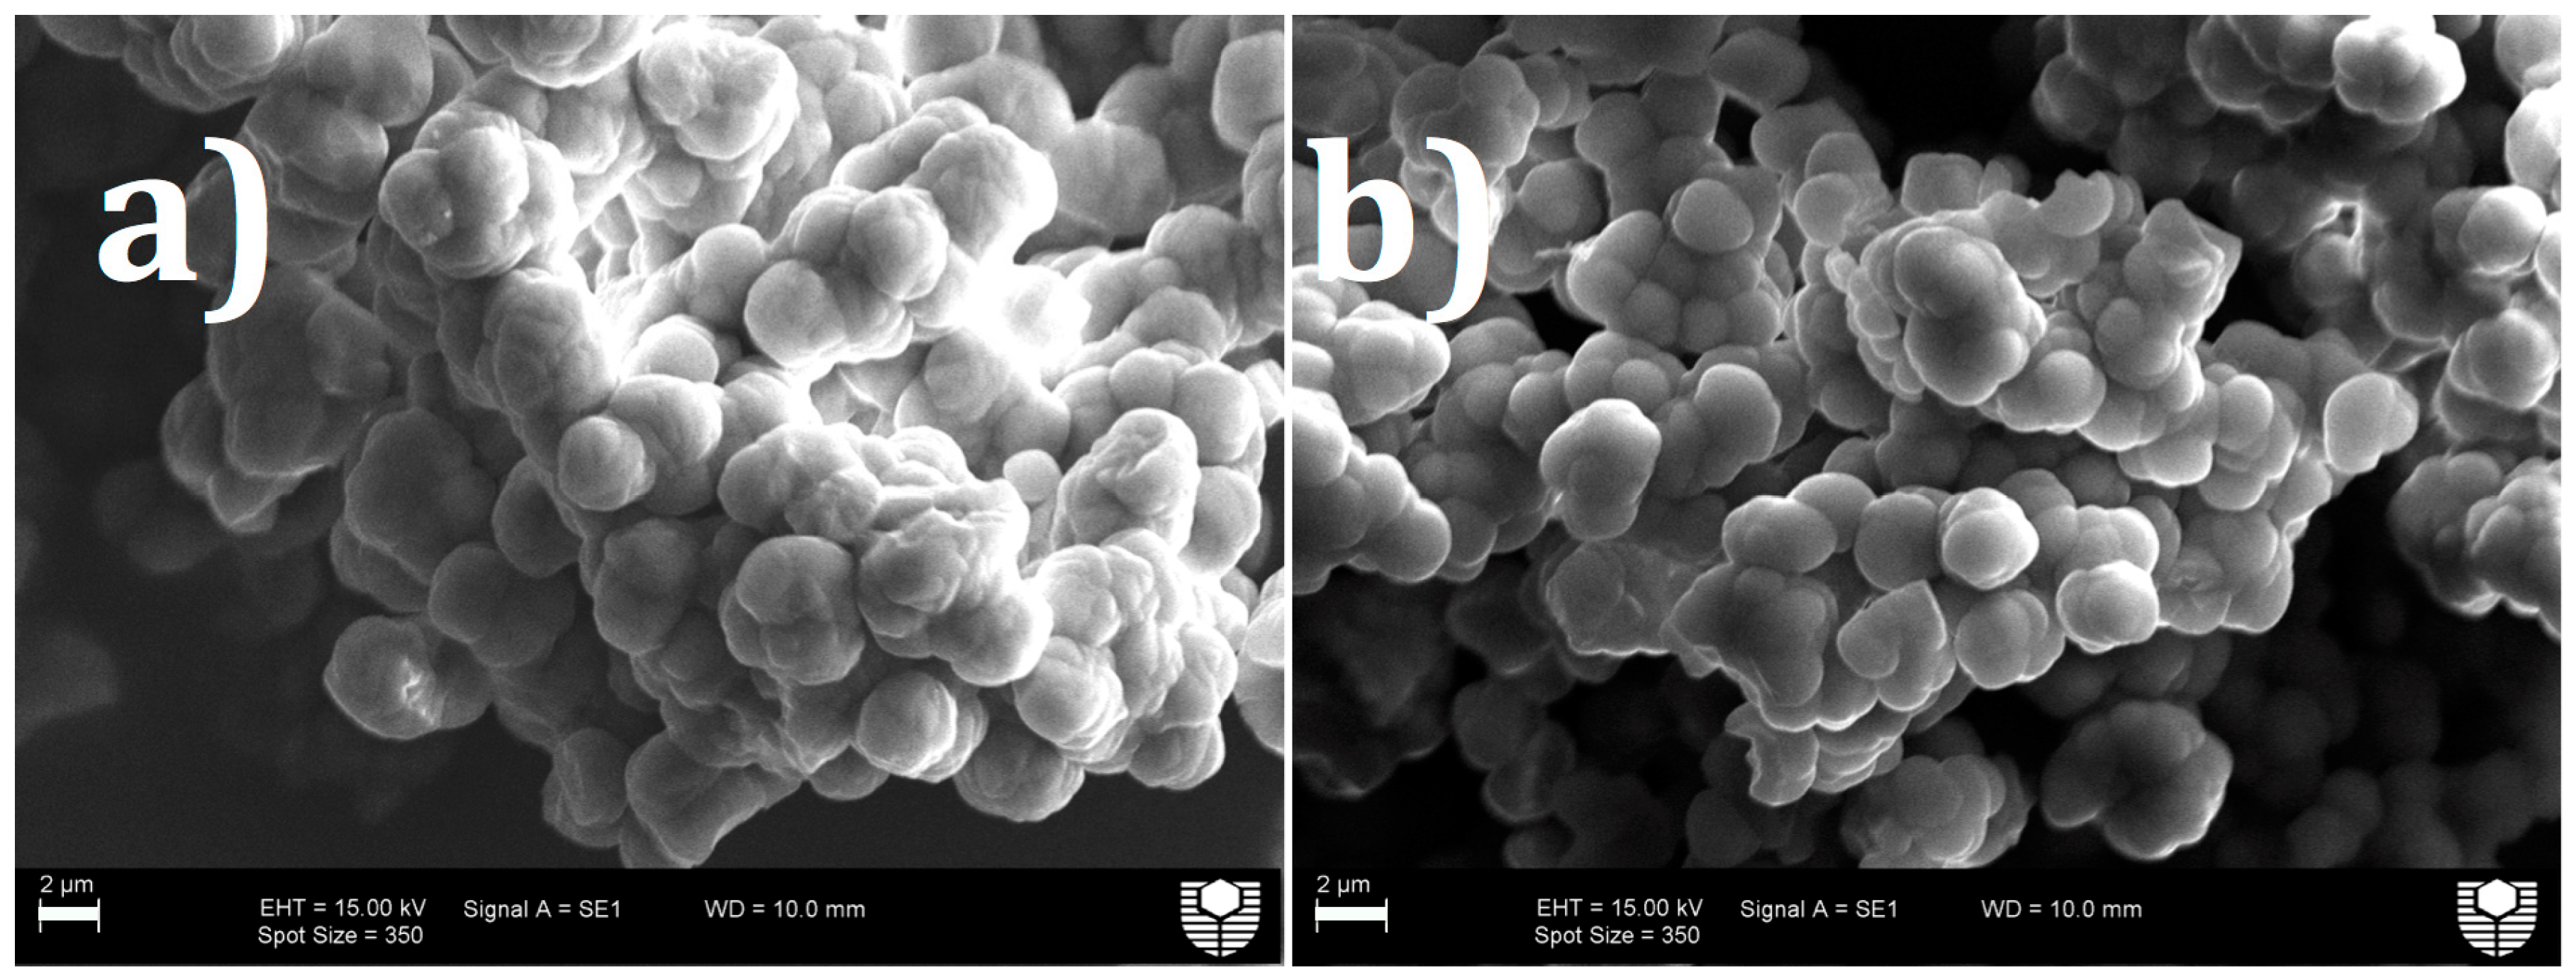
As the ratio of Fe/Al decreased further (<0.11), the morphology of the particles changed from faceted to spherical and remained so with increasing aluminium content (Figure 2 and Supplementary Materials Figure S2). It can be concluded from these images that single-phase solids are formed as there appears to be only one population of particles and not a mixed population as might be expected from mixed phase solids. Furthermore, the alunite particles formed are not faceted as seen for jarosite (Figure 1a) or for alunite formed at higher temperatures [29,33]. However, very few images of alunite are available in the literature for comparison.
3.2. Elemental Analysis
The solids were digested in concentrated acid and sent for ICP analysis to determine their stoichiometry based on elemental analysis. The formula was determined by assuming the sulphate content and determining the number of moles of the K, Al, and Fe relative to sulphate from the ICP data. Finally, the hydronium, water and hydroxide content were determined by charge neutralization considerations as given by (H3O)1-xKxFeyAlz(SO4)2(OH)6-3[y+z](H2O)3(y+z) [14]. The calculated compositions are shown in Table 2.
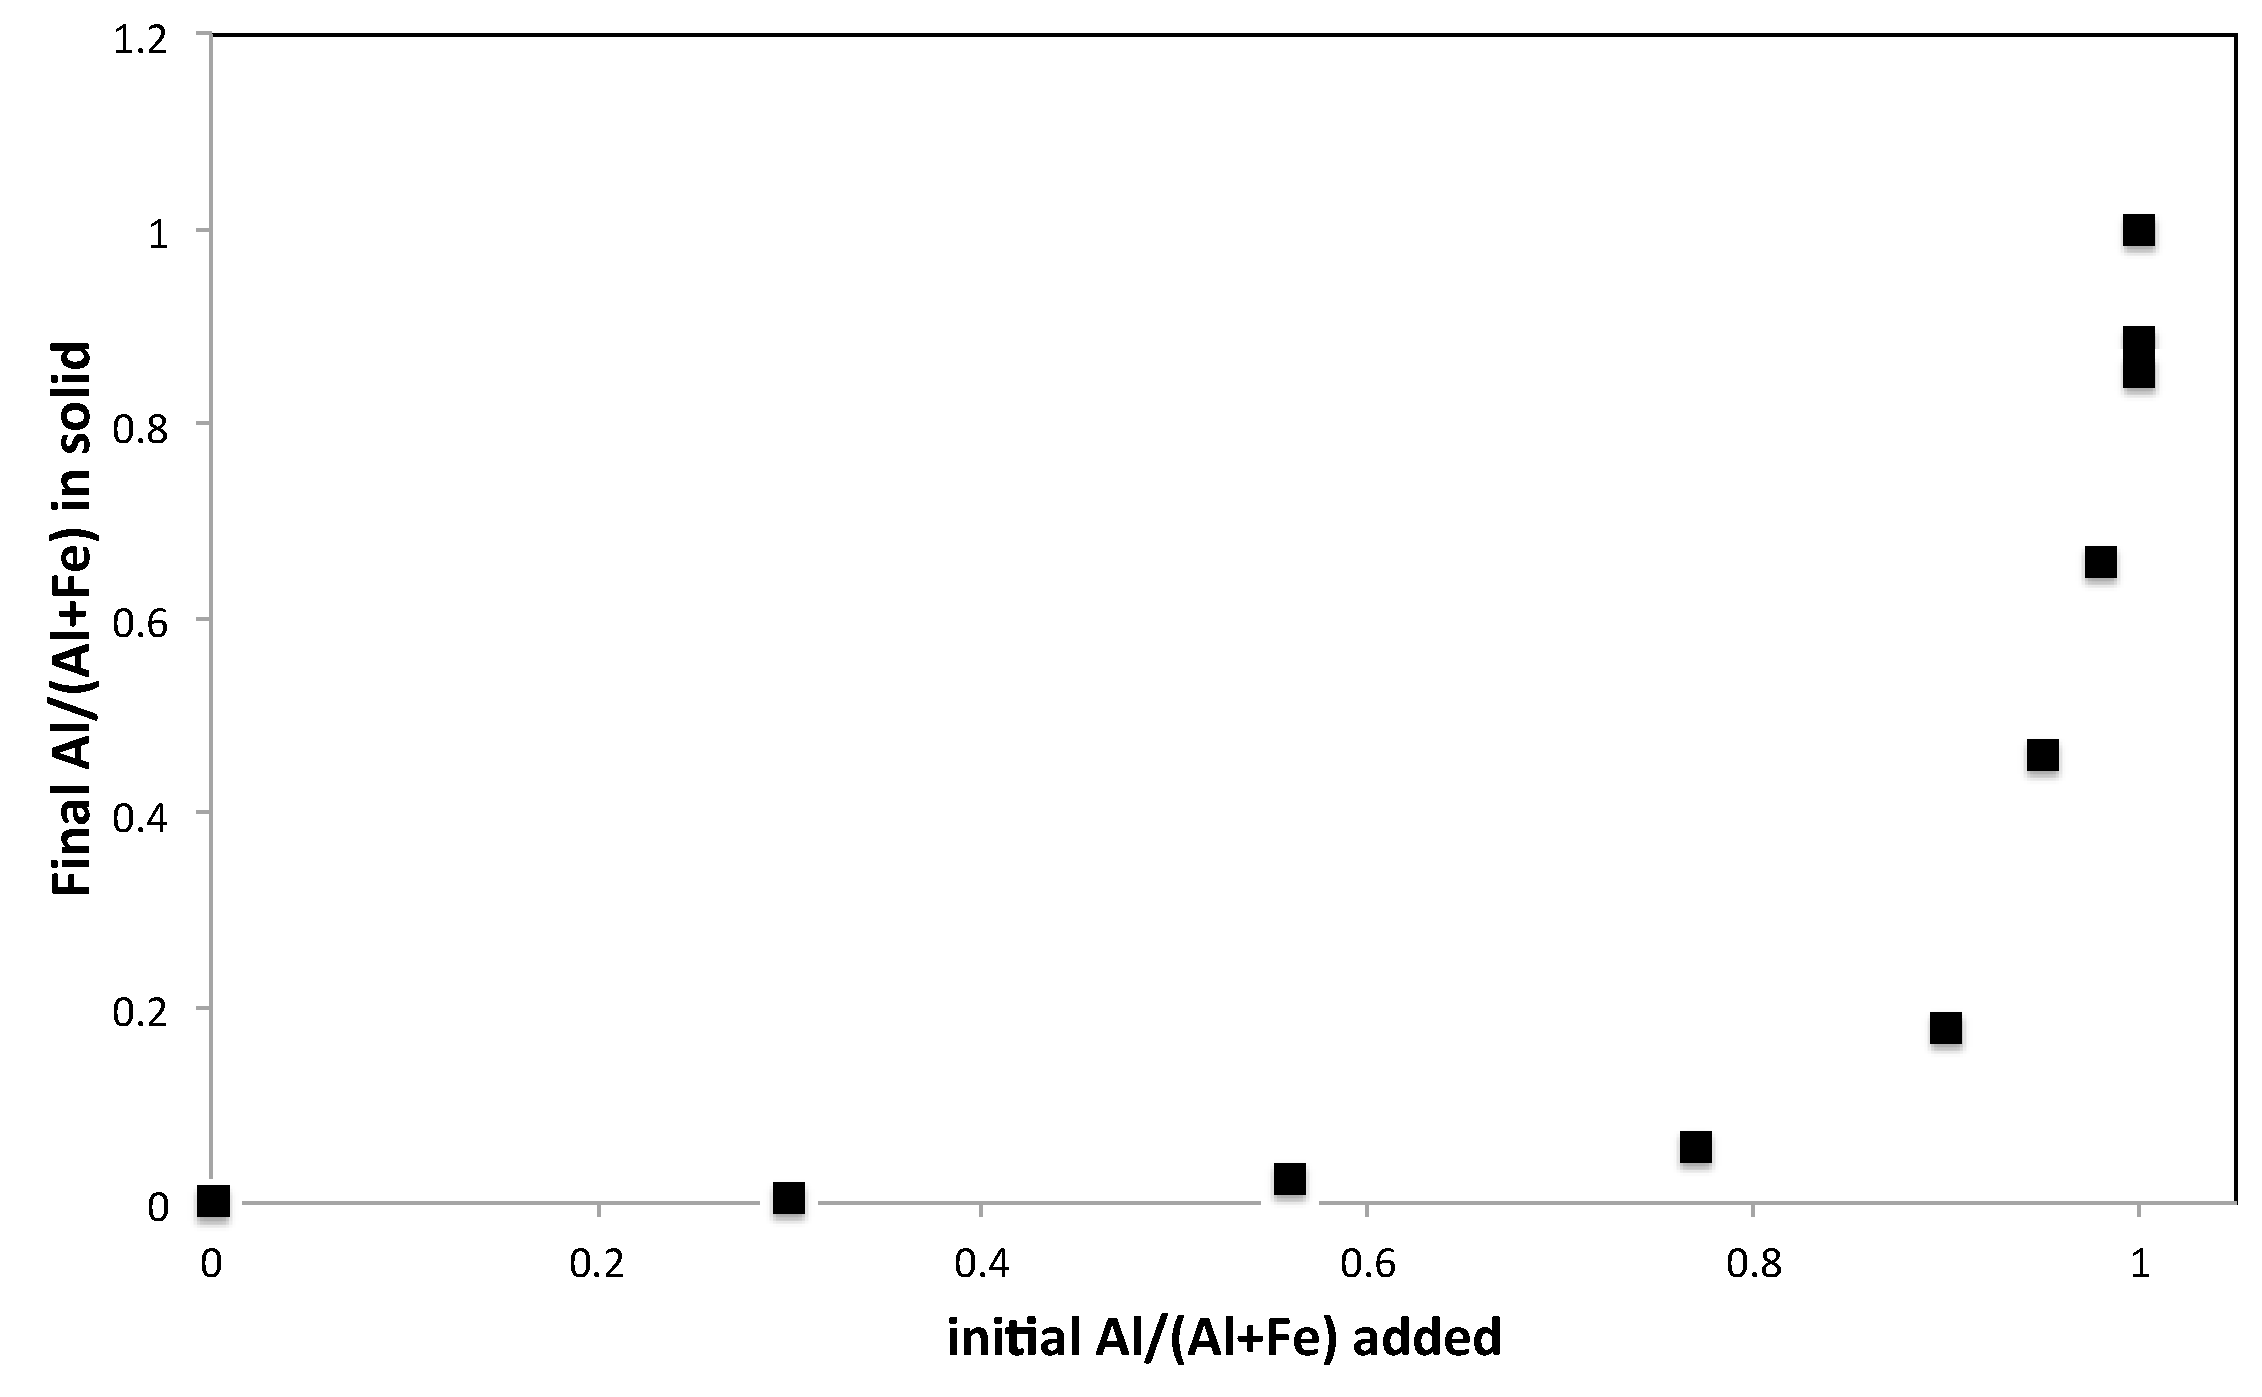
The values for Fe, K and Al were all within expected ranges [9,14]. These results showed that Al substitution above 20% did not occur until the initial solution Al/(Al + Fe) content had increased above 0.9. The initial Al/(Al + Fe) content plotted against the final Al/(Al + Fe) content found in the solid is given in Figure 3. The non-ideal stoichiometry suggests vacancies are present and the % vacancy based on the ideal 3:2 Fe (and/or Al):S ratio is shown in the Supplementary Materials (Figure S3a).
3.3. XRD
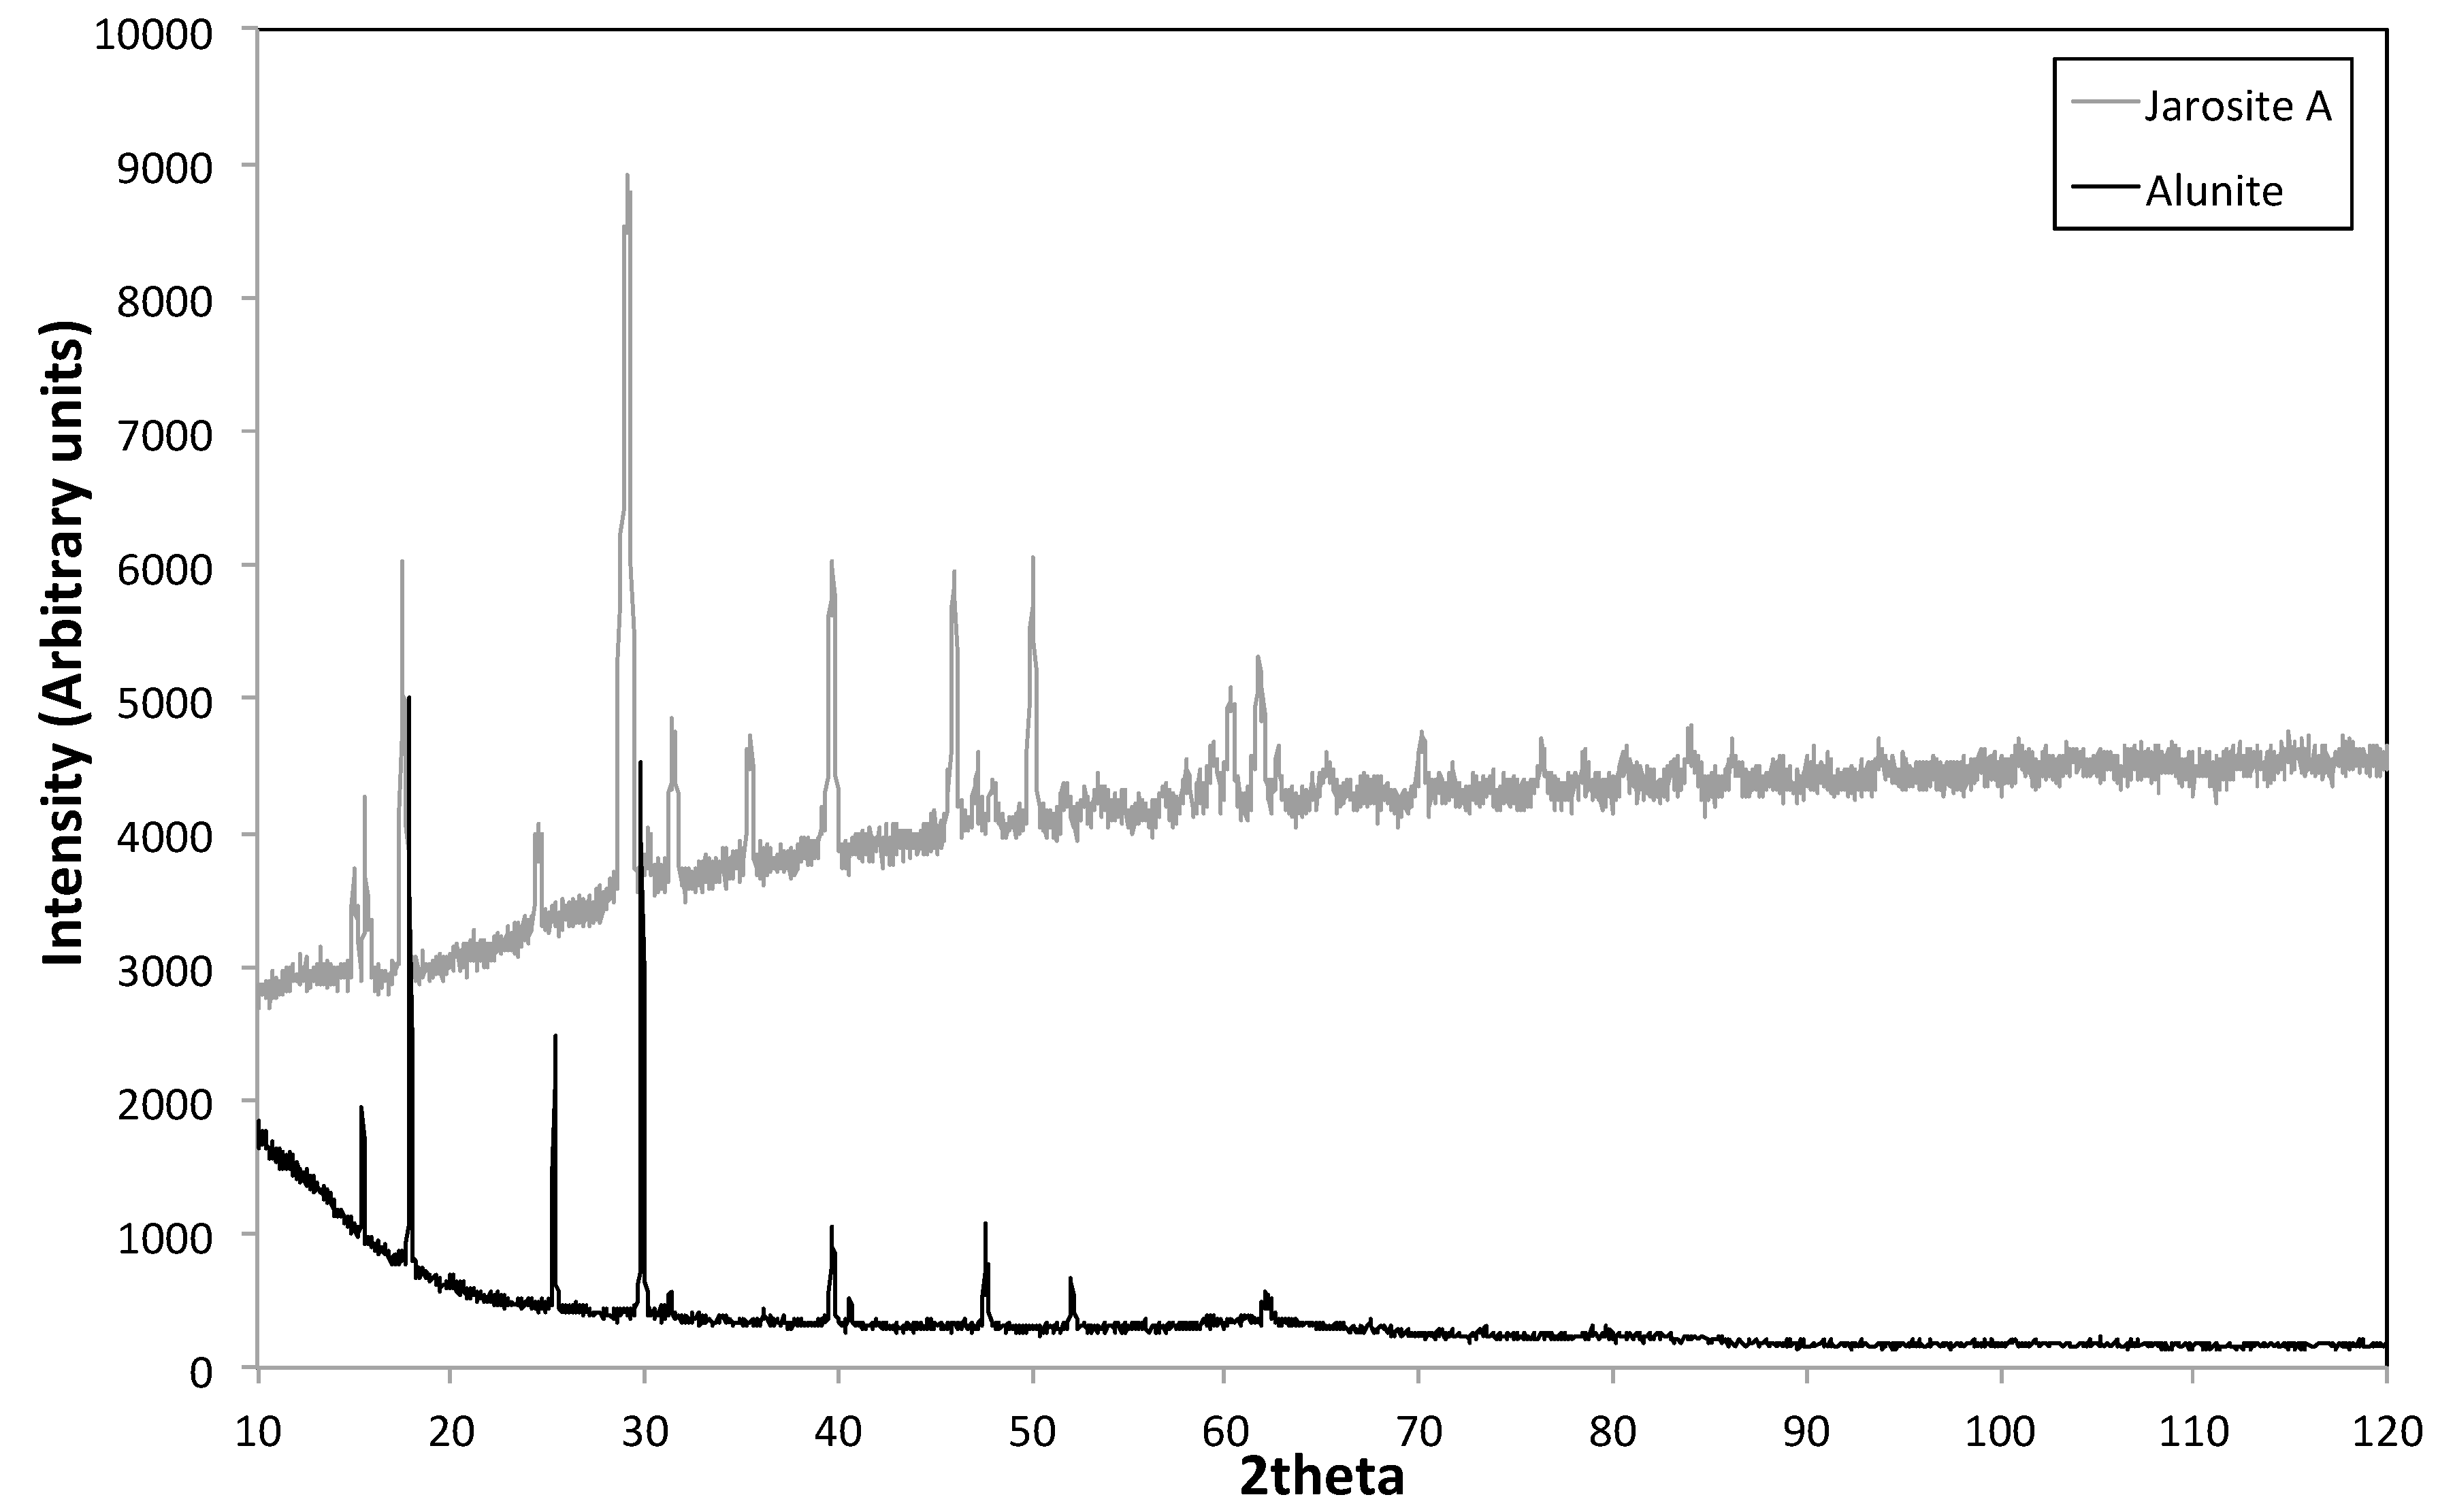
Figure 4 shows the XRD patterns for the two end members: jarosite and alunite. The XRD patterns were indexed to reference patterns (jarosite PDF: 01 076 7597 and alunite PDF: 00 047 1884), confirming their mineralogy at the resolution of the XRD (see Supplementary Materials, Figure S4).
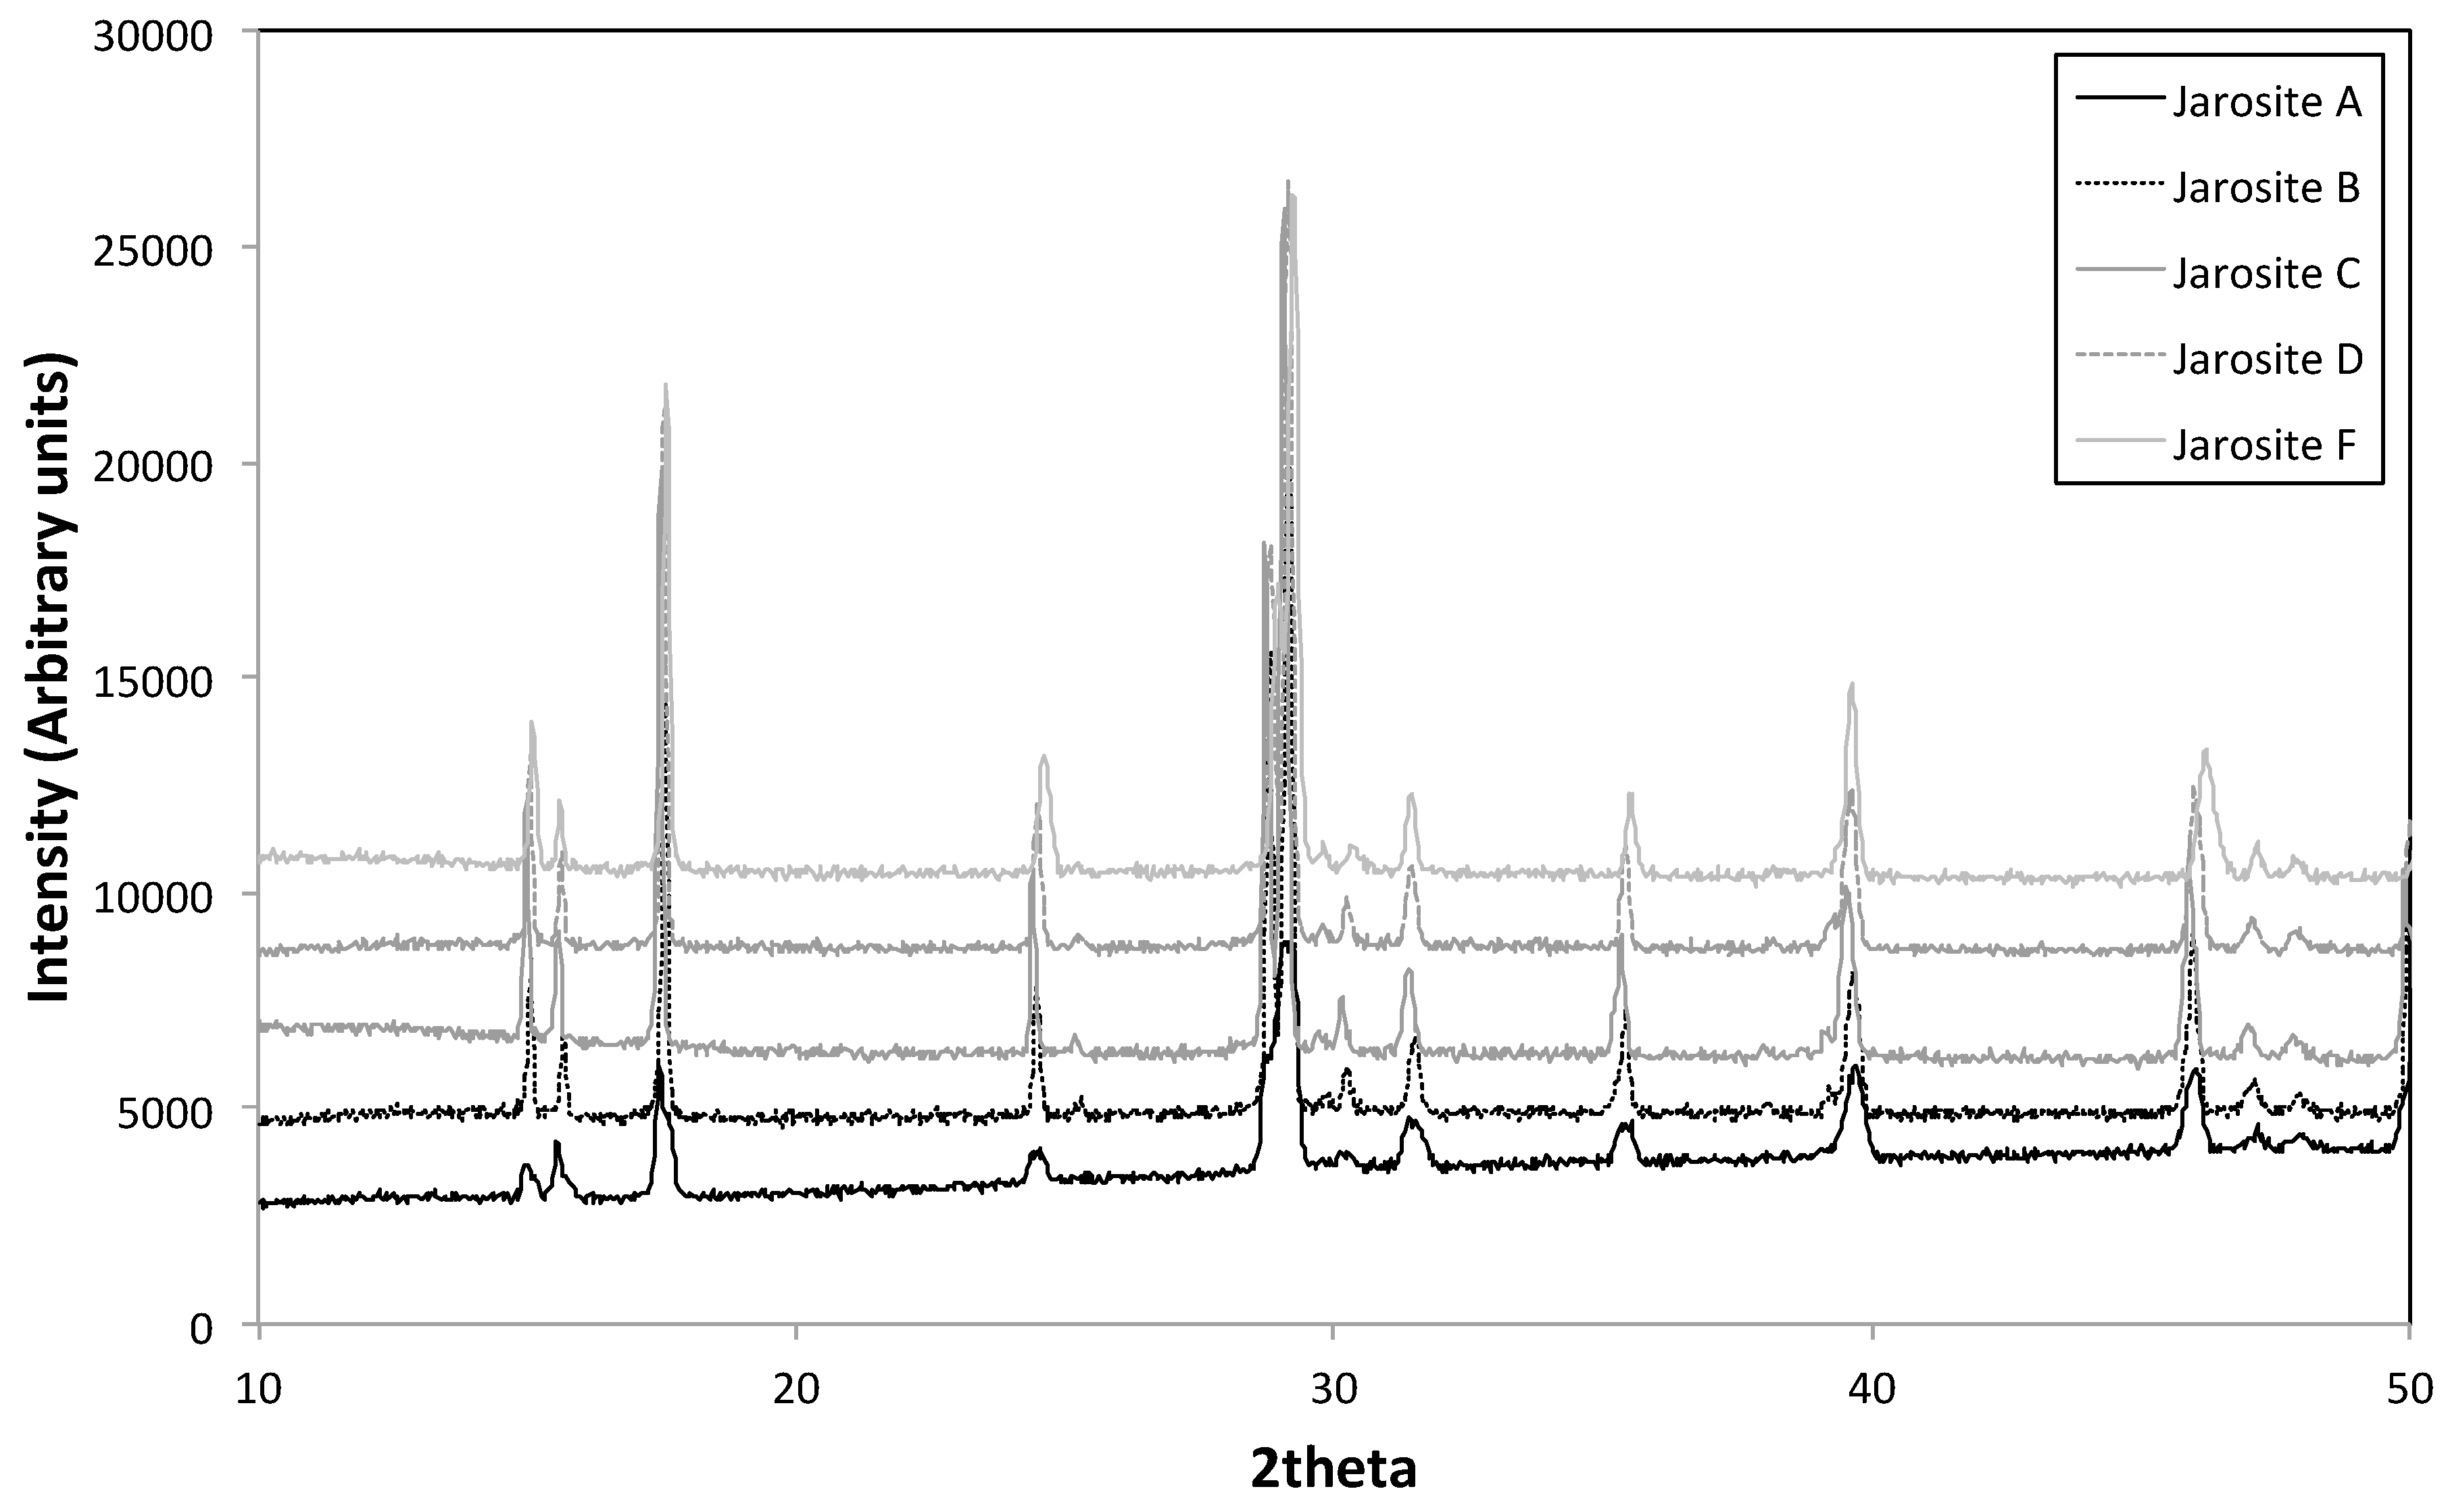
No new reflections were observed in the pattern (Figure 5) with the introduction of aluminium ions to the solution, but there were 2theta shifts in the reflection positions, consistent with lattice parameter changes and Al3+ substitution for Fe3+. Between jarosite H and I, the pattern clearly became alunite-like (Figure 6). This corresponds to a final Al/(Al + Fe) content in the solids of ≥0.5; thus, perhaps this transition is not unexpected.
All of the XRD patterns obtained at 10°–120° 2theta were subsequently used for Rietveld refinement, whereby the patterns were refined as if they were jarosite or alunite. The average lattice parameters obtained for the jarosite and alunite refinements are listed in Table 3, although it must be stressed that the data were collected on low background holders (due to the mg quantities of solids formed) and as such are not ideal for Rietveld analysis.
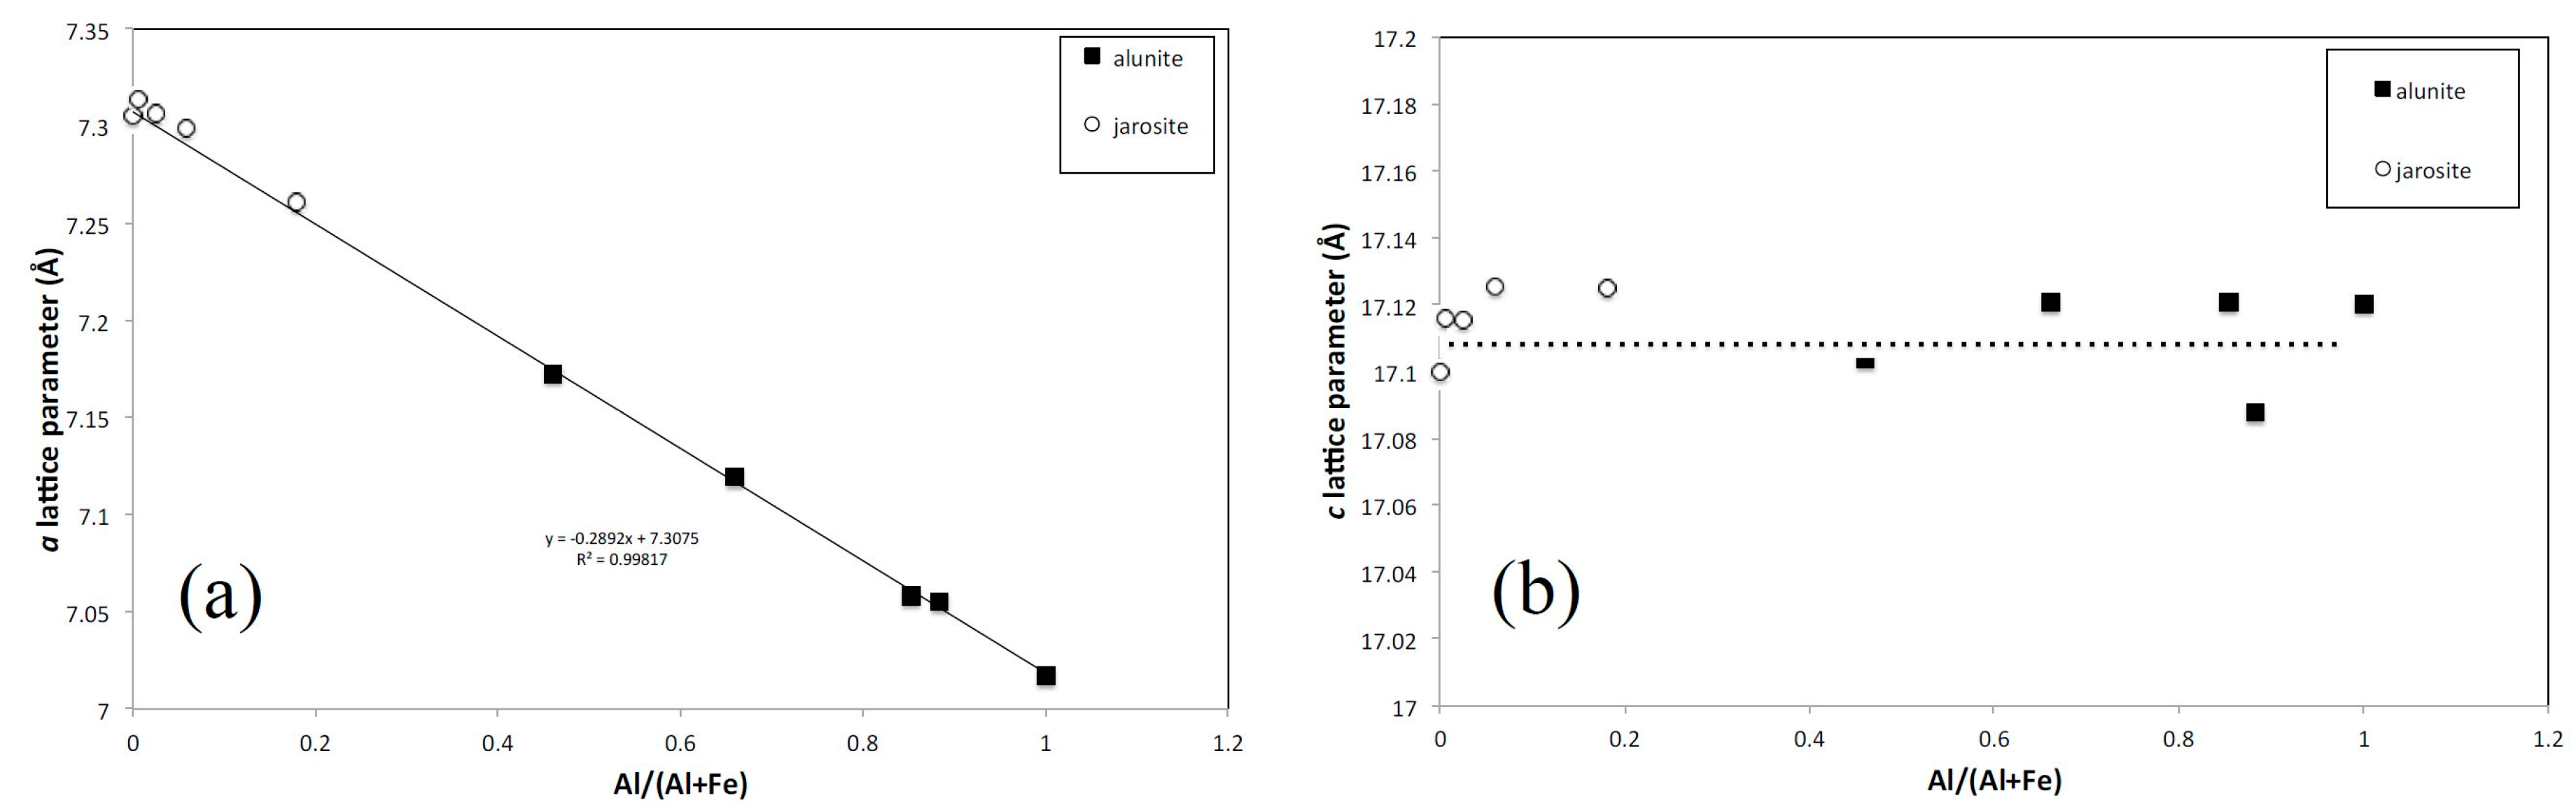
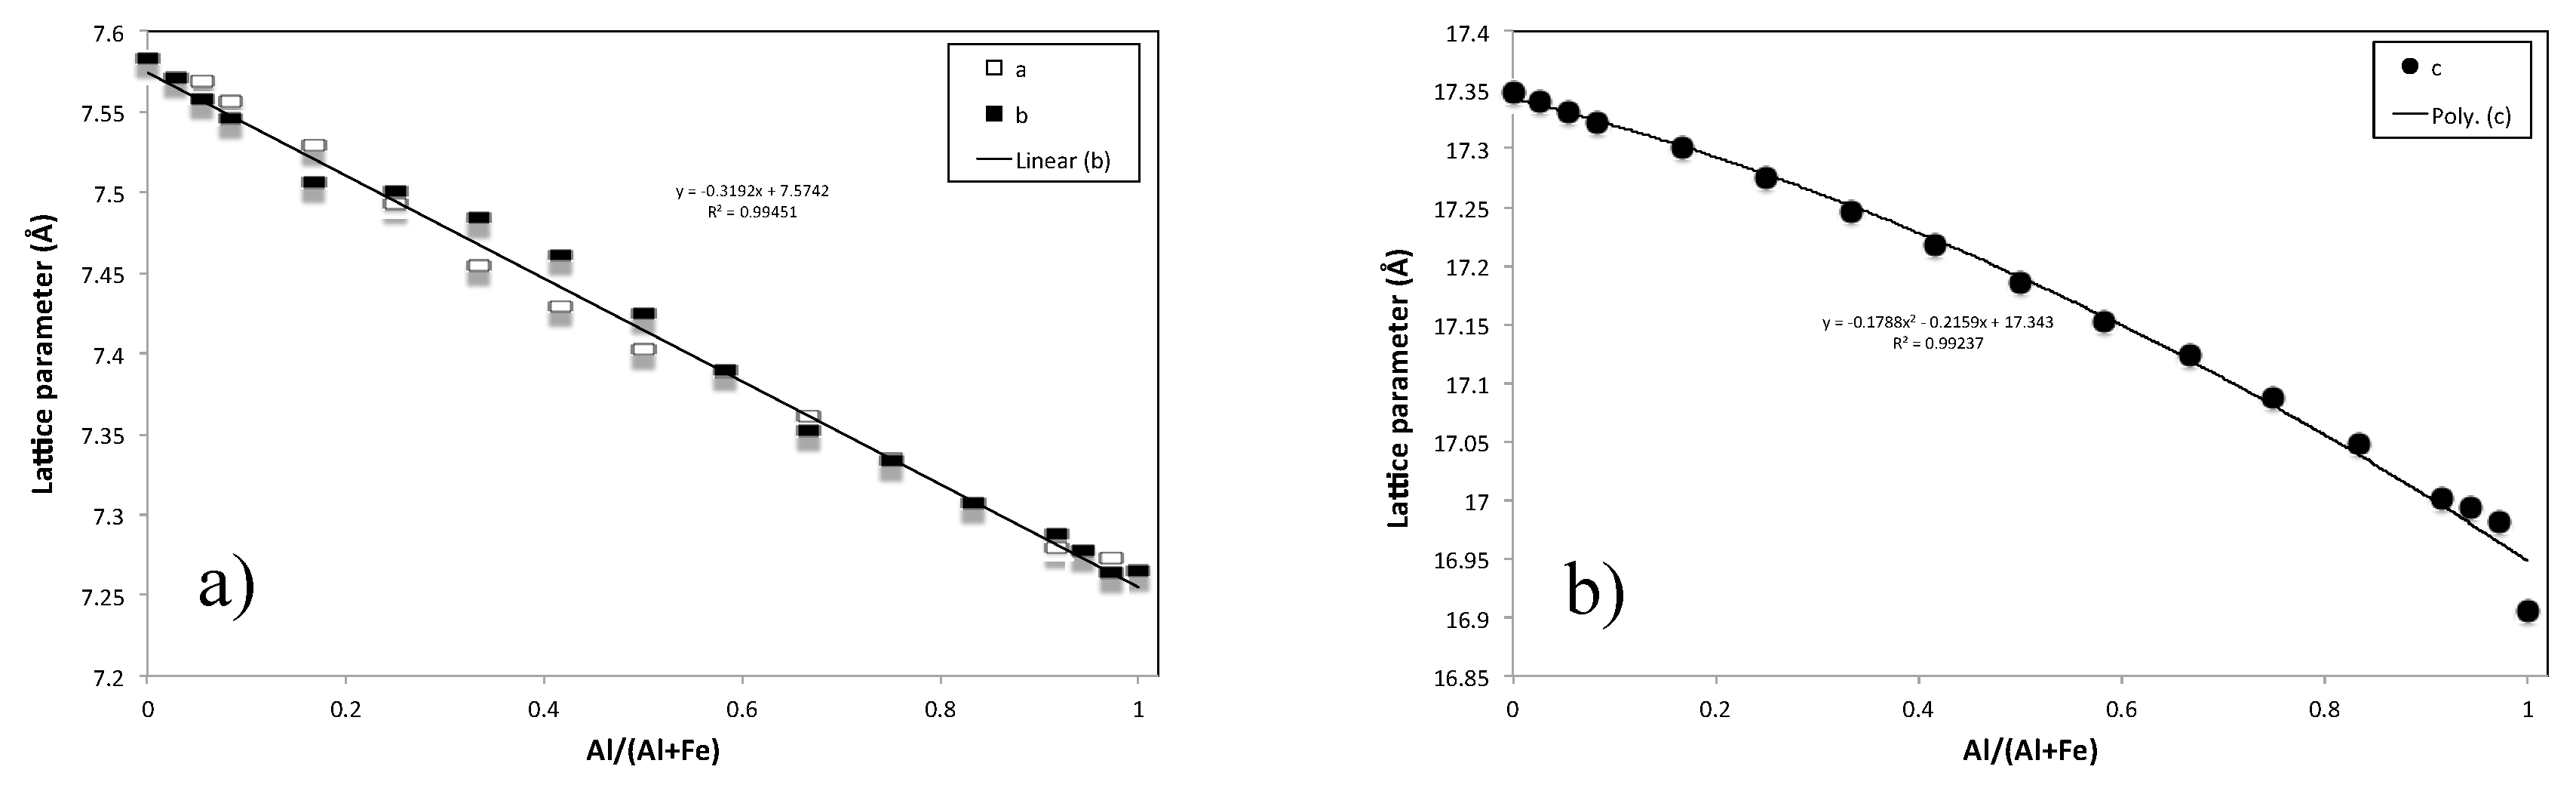
The alunite sample in Table 3 shows a c lattice parameter smaller than reported in [41]. The sample composition in [41] lists that Al, Na, K and S were present and the occupancy of Al is given as 0.989; thus, it is assumed that the difference between this result and [41] are due to the different chemistries and, possibly, the formation temperature of this sample. The data from Table 3 and the final Al/(Al + Fe) content in the solid as determined from the ICP analysis was used to construct Figure 7. This shows that the a lattice parameter has a linear correlation with the Al/(Al + Fe) content and therefore follows Vegard’s Rule [42]. The c lattice parameter does not appear to be altered in any systematic manner with Al/(Al + Fe) content. Both increasing Al content and vacancies would be expected to contract the c-axis, but this is not observed (see Supplementary Materials Figure S3a for vacancies expected). Thus, the c lattice parameter is not found to behave as expected but does generally agree with Brophy et al. [23], who also saw little change in the c-axis with Al content for the series II samples. Increasing K+ content over long periods of days is seen to increase the c lattice parameter according to Grube and Nielsen [15] and the scatter in these values may reflect the variable K+ content.
3.4. Vibrational Sepctroscopy
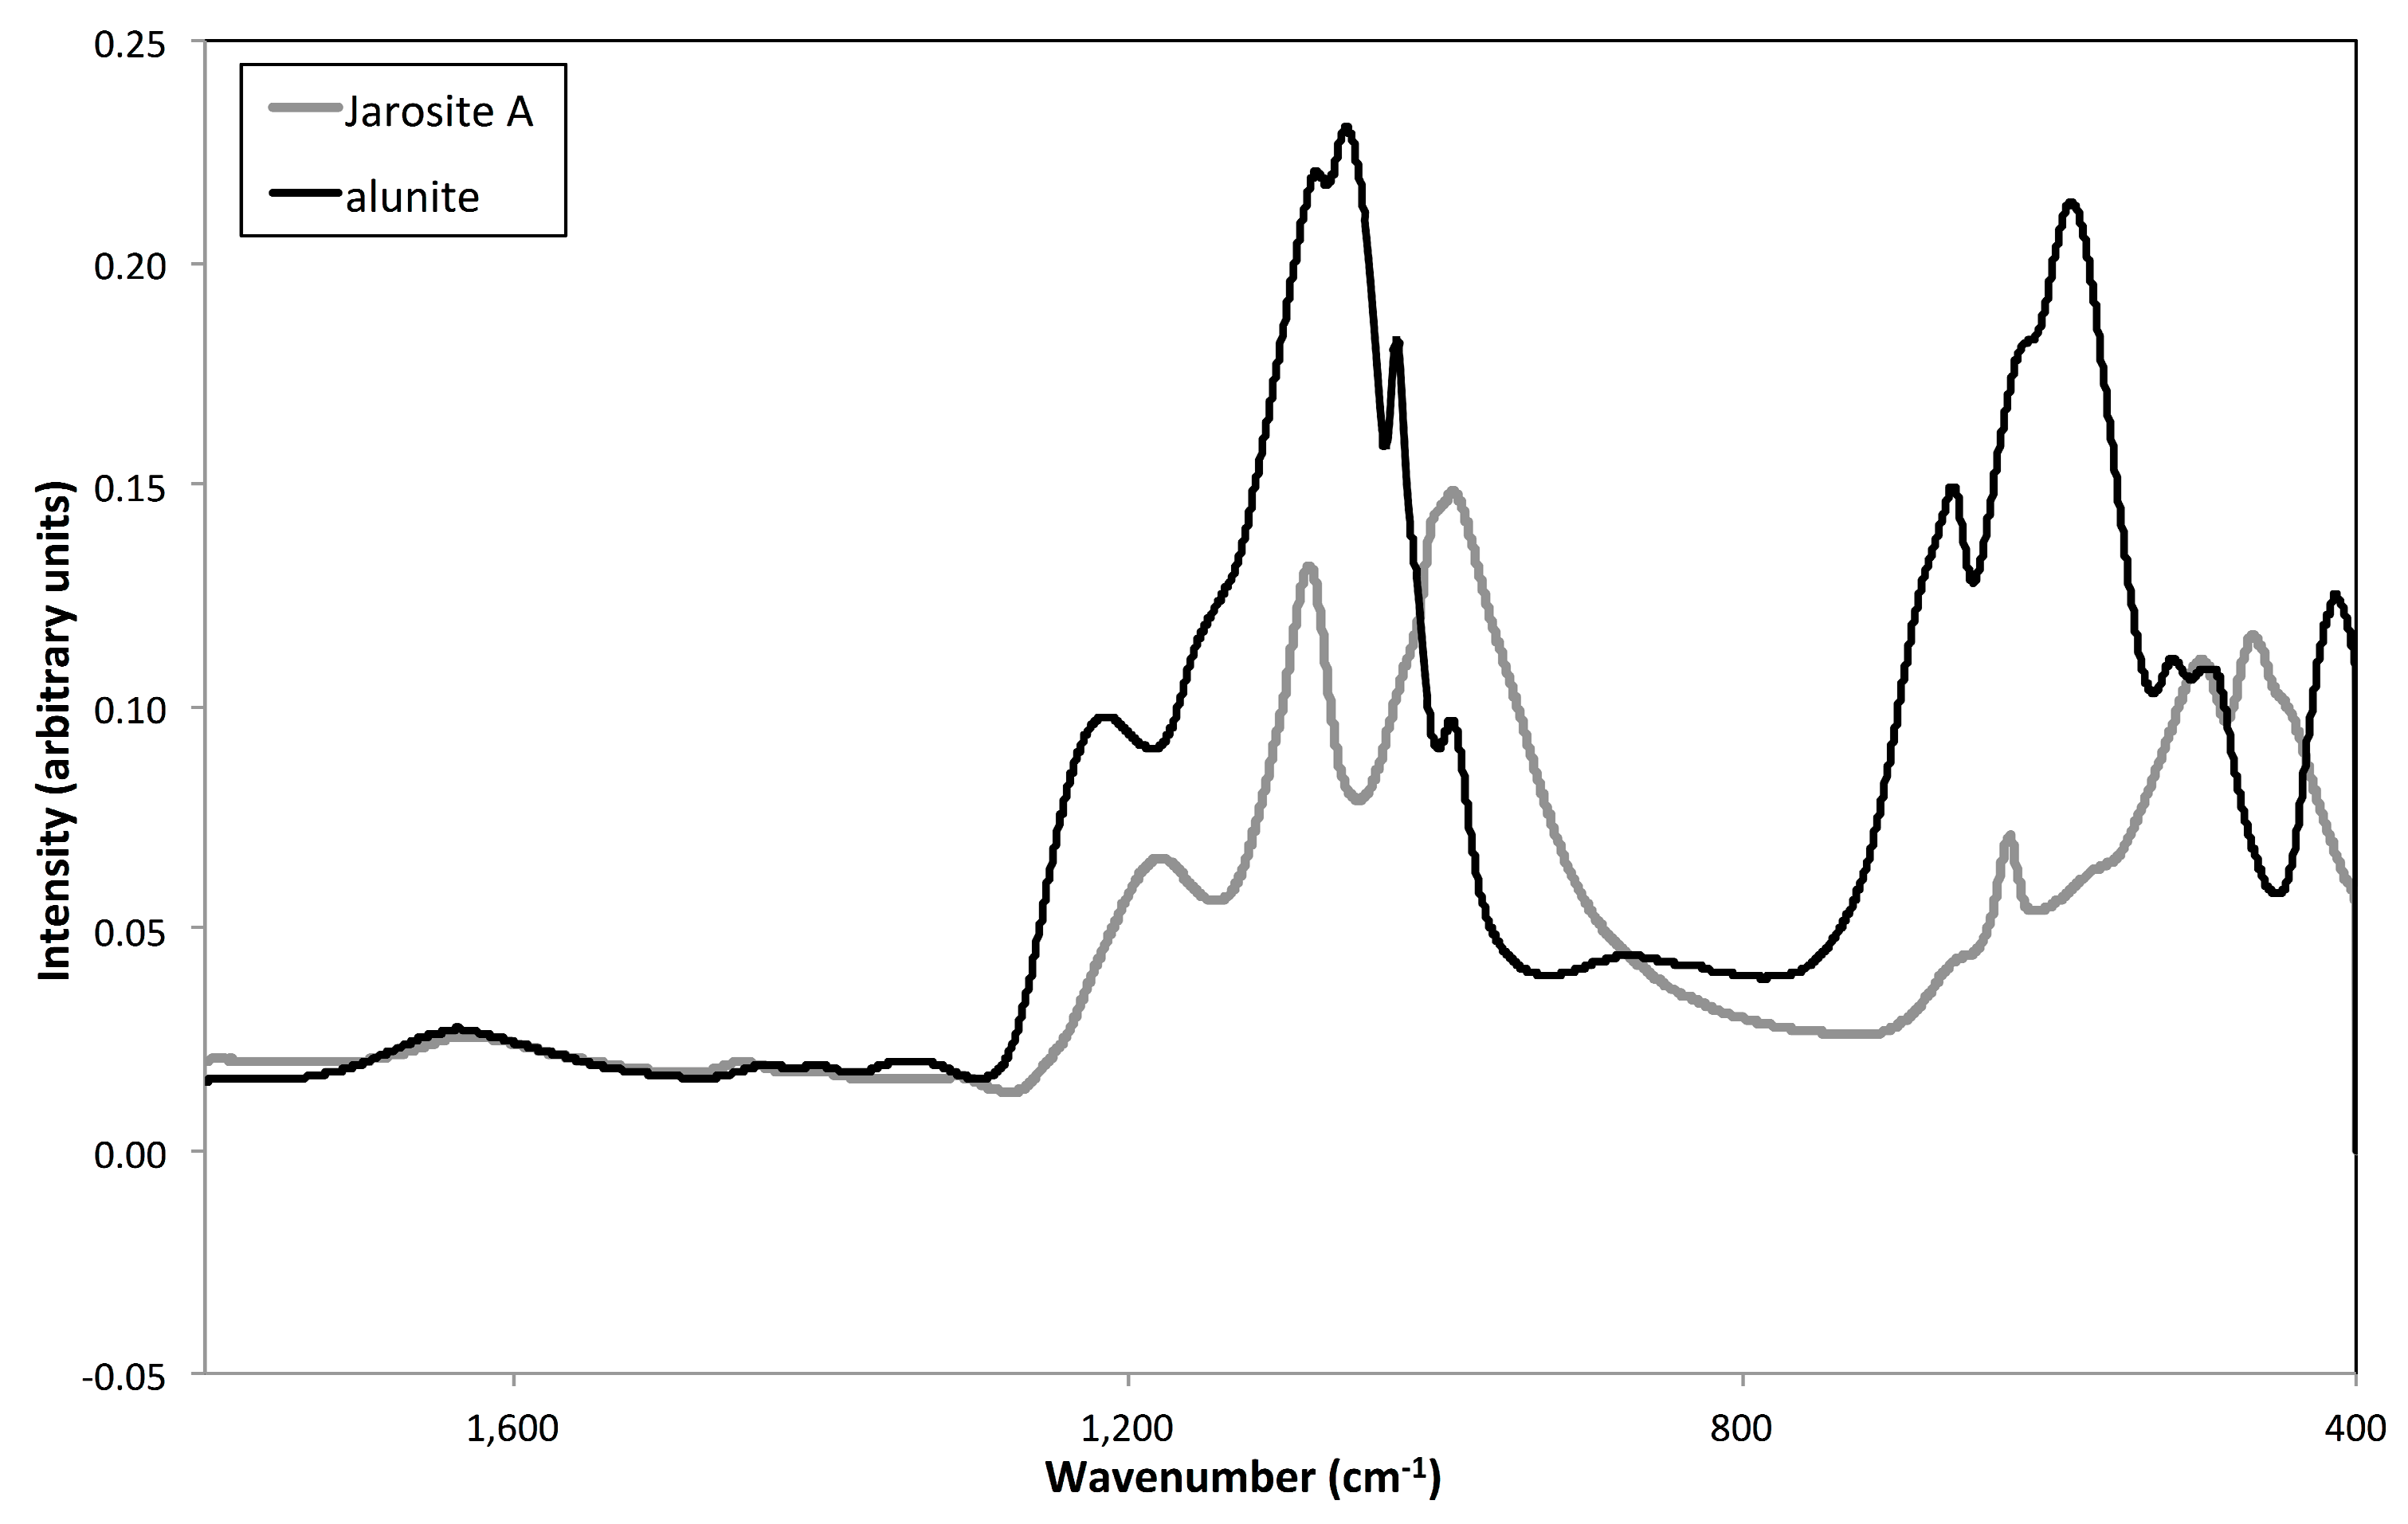
In Figure 8 below, the control jarosite and alunite infrared spectra are shown. The peaks compare well with literature [9,15,27,28], where the sulphate bands are found between 940 and 1300 cm−1. The main differences between the alunite to jarosite spectrum are that the sulphate band is shifted to higher wavenumbers, as are the bands in the 400–700 cm−1 region. This trend is also observed for the water stretch region (see Supplementary Materials, Figure S5).
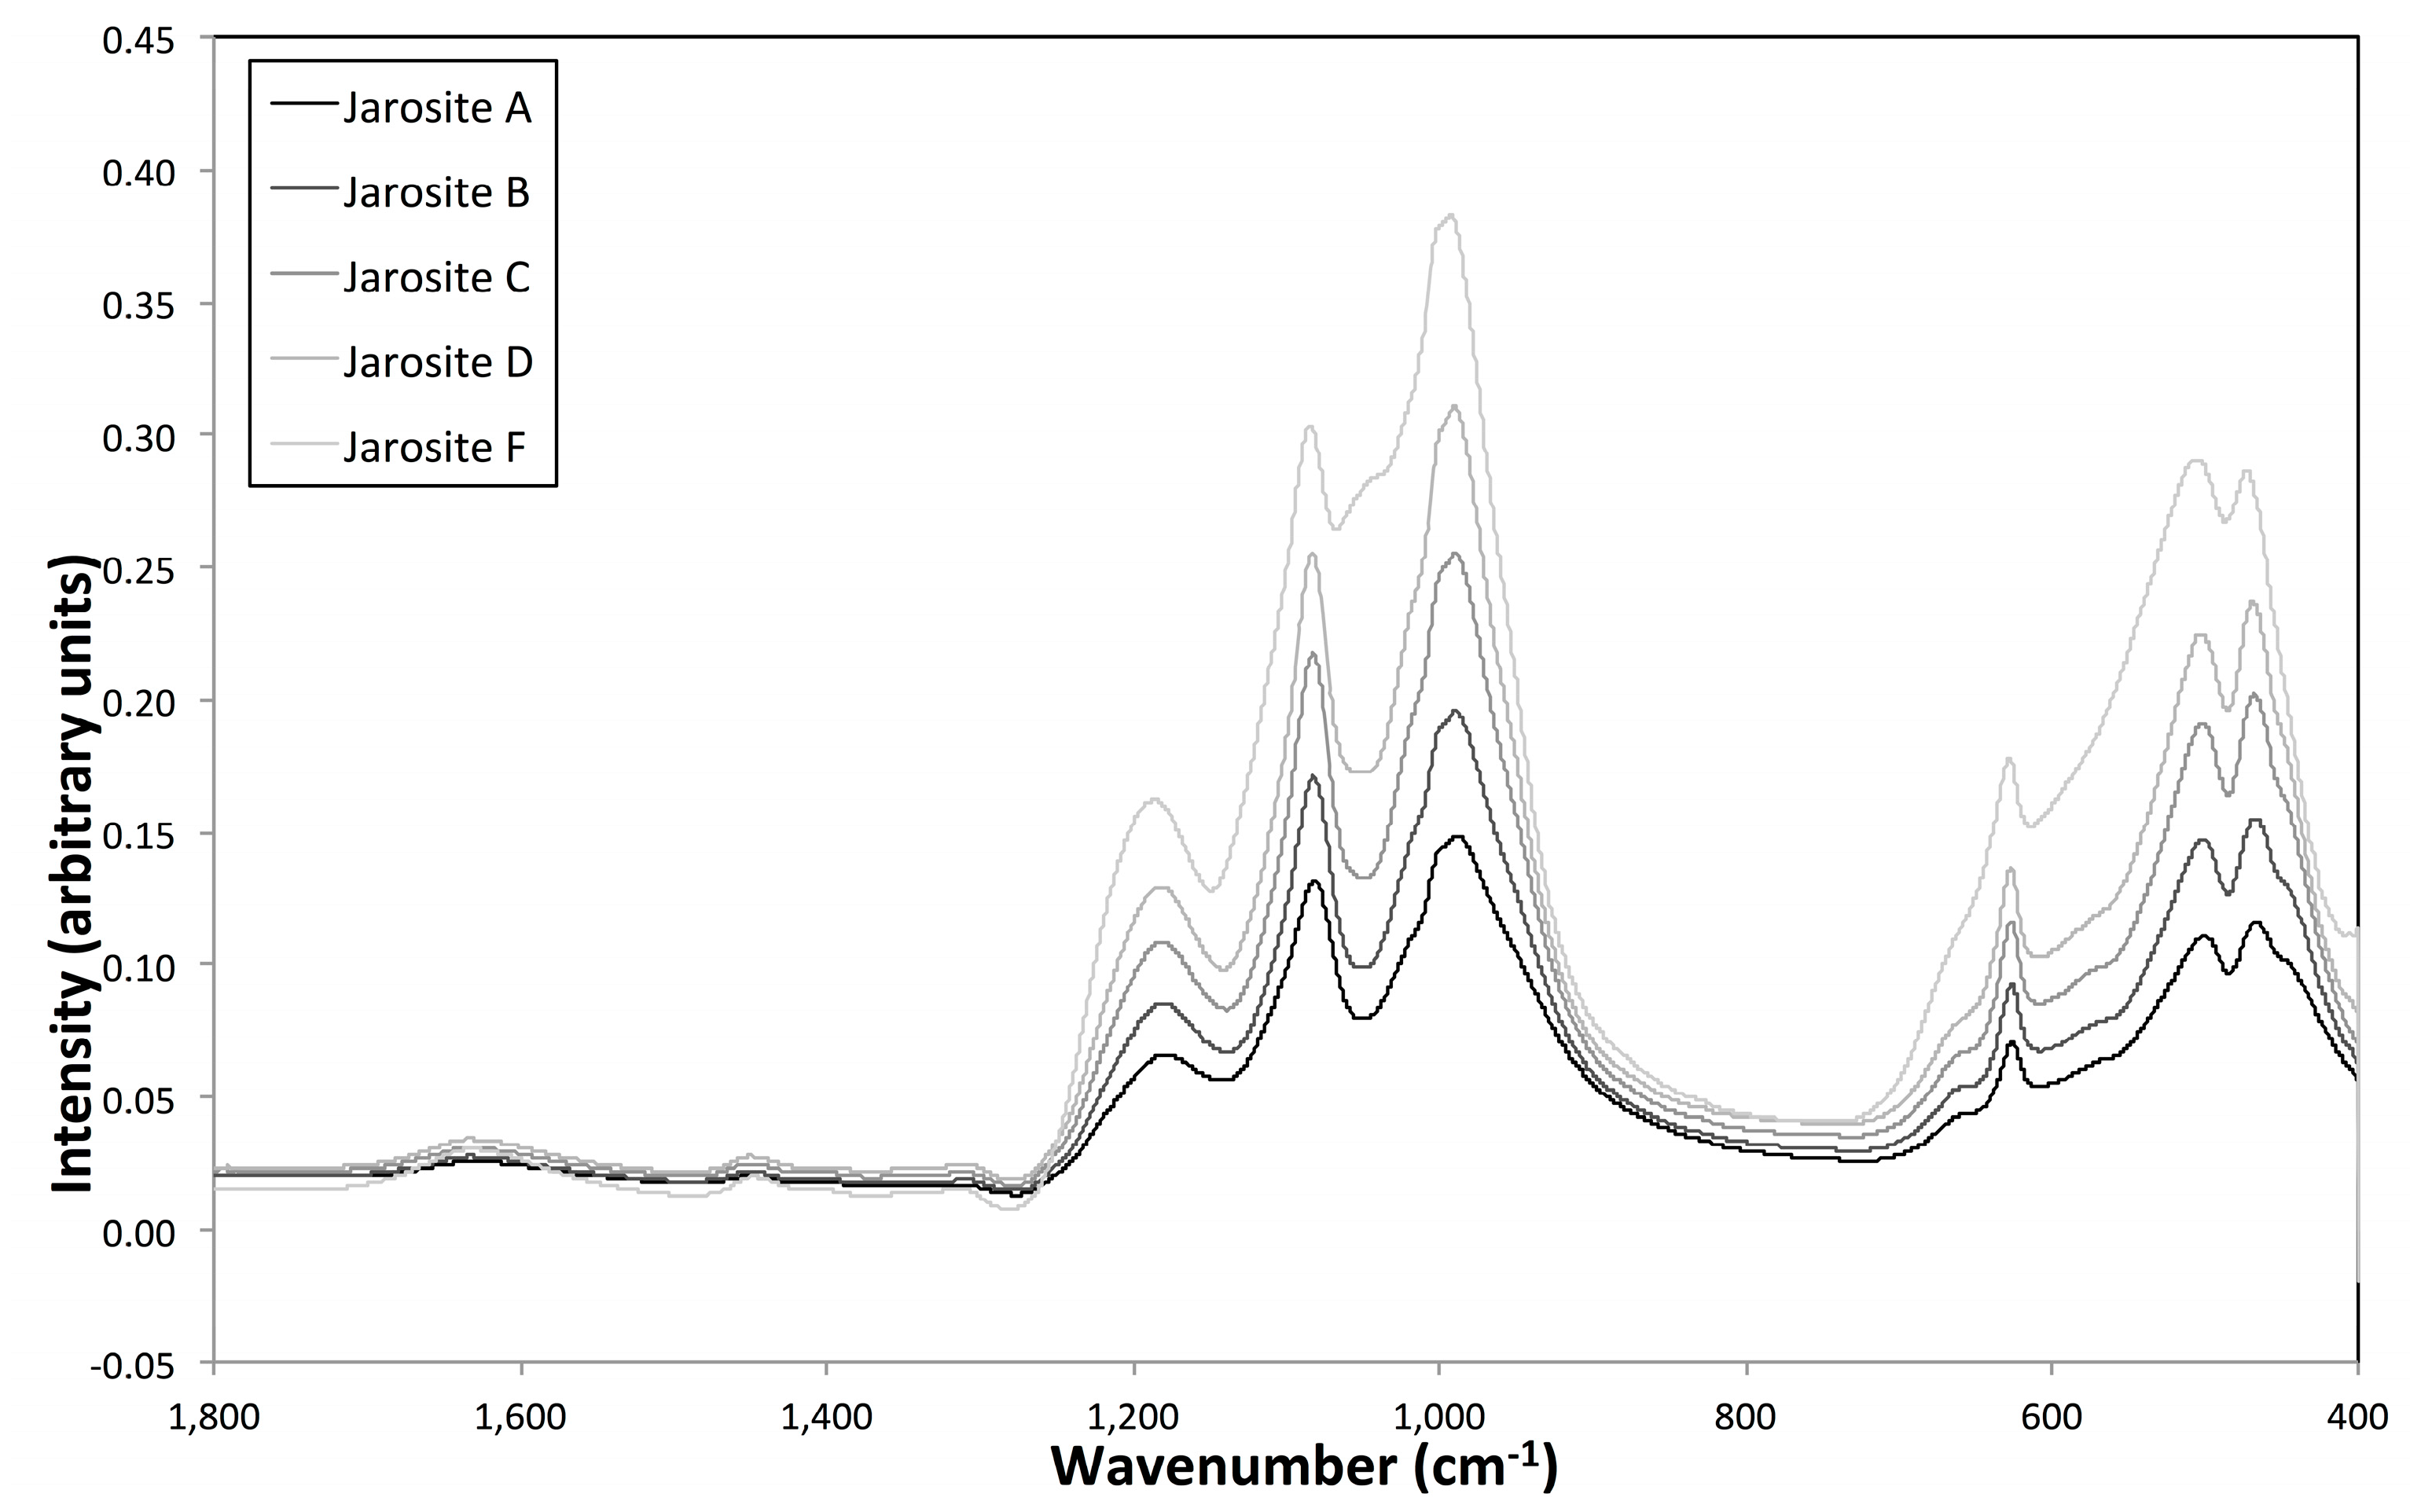
As the initial Al/(Al + Fe) content increased to 0.90, there did not appear to be any significant differences in the infrared spectra of the samples other than a broadening of the features for the jarosite F sample (Figure 9). The 1175 cm−1 band in jarosite A did shift to higher wavenumbers (to 1180 cm−1) by jarosite F, but, given the 4 cm−1 resolution, this may not be significant.
When the initial Al/(Al + Fe) content increased further, there was a clear change in the FTIR spectra from jarosite-like to alunite-like. The transition appeared to occur between jarosite F and jarosite J as found for the XRD patterns (Figure 10a). The broadening of the sulphate band observed for jarosite F and H decreased as the alunite bands became more distinct. Similarly, there was a shift in the OH stretching band (~3400 cm−1) to higher wavenumbers as the structure became more and more alunite-like (Figure 10b). The infrared spectrum of jarosite J was identical to that of pure alunite. The ICP results shows <10% Fe is present in this sample, thus an alunite-like spectrum is not surprising.
3.5. Molecular Modelling
The molecular modelling involved taking the pure alunite structure and the empirical potentials as determined by [33] and incorporating more and more iron until a pure jarosite structure was formed under constant pressure and temperature conditions (see Supplementary Materials for potential parameters and comparison to pure end members). The replacement energy and the lattice parameters after minimization were then plotted versus the aluminium molar fraction. The replacement energy was normalized for the number of iron cations replaced and the results presented in Figure 11. It can be seen that the replacement energy for the pure jarosite (Al mole fraction = 0) is the lowest of all, although the value appears to be plateauing to a steady value. This is found despite the fact that the overall energy for the pure alunite structure is lower than the pure jarosite structure, as would be expected from the differences in formation energy [14].
Looking at the lattice parameters and their variation with Al mole fraction, there is a significant similarity in the trends observed between the real data (see Figure 7 above) for the a-axis and those from modelling (Figure 12). The most significant difference between the experimental and modelling results appears to be in the c lattice parameter behaviour. The c lattice parameter for the experimental samples vary from ~17.08–17.12 Å (and no trend is observed with Al content), while the modelled values vary from ~16.9 to ~17.3 Å (and decrease with Al content). The model therefore predicts a greater expansion than found in real samples. The substitution of Al for Fe (ionic size considerations) is seen to contract the c-axis if all other impacts are ignored (Figure 12b). However, the real samples show no impact with Al content on the c-axis, and this does not correlate with vacancies in the structures (Supplementary Materials Figure S3a). The expected contraction in the c-axis must be being offset by other mechanisms, and one possibility is the different K+ content, which is known to affect the c-axis [15]. In empirical modelling, an error in the modelled lattice parameters of <5% is acceptable. However, this is different to errors within the model. Thus, having established the model, the expected changes in the lattice parameter with iron or aluminium ion substitution should replicate experimental trends. For the a-axis relationship with Al content, this is clearly the case; a slope of 0.32 from the model versus 0.29 from the XRD refinement. This suggests that the a-axis length is indeed dominated by the impact of the Al/Fe content. The significant difference in the c-axis between model and experimental results suggest, then, that the Al/Fe content is not the main determinant.
In the modelling, there are also small differences observed between the a and b lattice parameter values for the substituted solids, suggesting that these solids have structures with a lower symmetry than the pure end members. As the model approaches the pure end members, the a and b lattice parameters become identical.
3.6. Thermal Behaviour
When the intial Al/(Al + Fe) content was below 0.90, the TGA mass loss showed a steady movement of the weight loss regime towards higher temperatures (Figure 13a). At higher Al contents, the weight loss regime also tended towards higher temperatures, but the trend was harder to discern (Figure 13c). The differential (DTA) curves showed this more markedly, particularly for the exotherms occurring at ~200 and 300 °C (Figure 13b). The weight loss up to 300 °C is due to “additional” water as attributed by Kubisz [43]. The ‘additional water’ content was also calculated for the samples in this work (see supplementary information). The weight loss from 300 °C to 560 °C is considered to be due to the loss of structural water and the conversion to K, Al/Fe sulphate (yavapaiite) [13,44], and, in the case of pure jarosite, conversion to hematite. However, these trends were less obvious in the high Al solids due to the broadening of the low temperature transitions (see Figure 13c,d). The endotherm just below 600 °C was similar to that observed by Drouet and Novrotsky [13]. This endotherm is considered to be due to the formation of hematite or corundum [13] and also increases to higher temperatures as more Al is substituted into the structure. The ~700 °C exotherm is associated with de-sulphurization. Although this can occur at a range of temperatures [13], it is clear that this transition tends to increase in temperature with increasing Al content.
3.7. Nucleation Behaviour
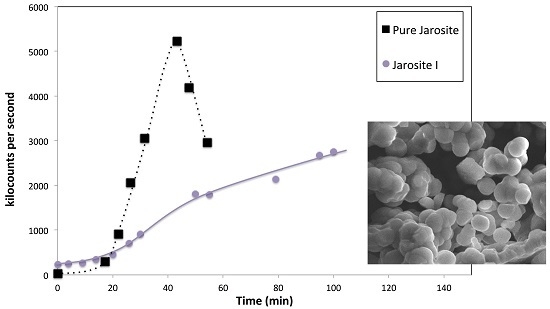
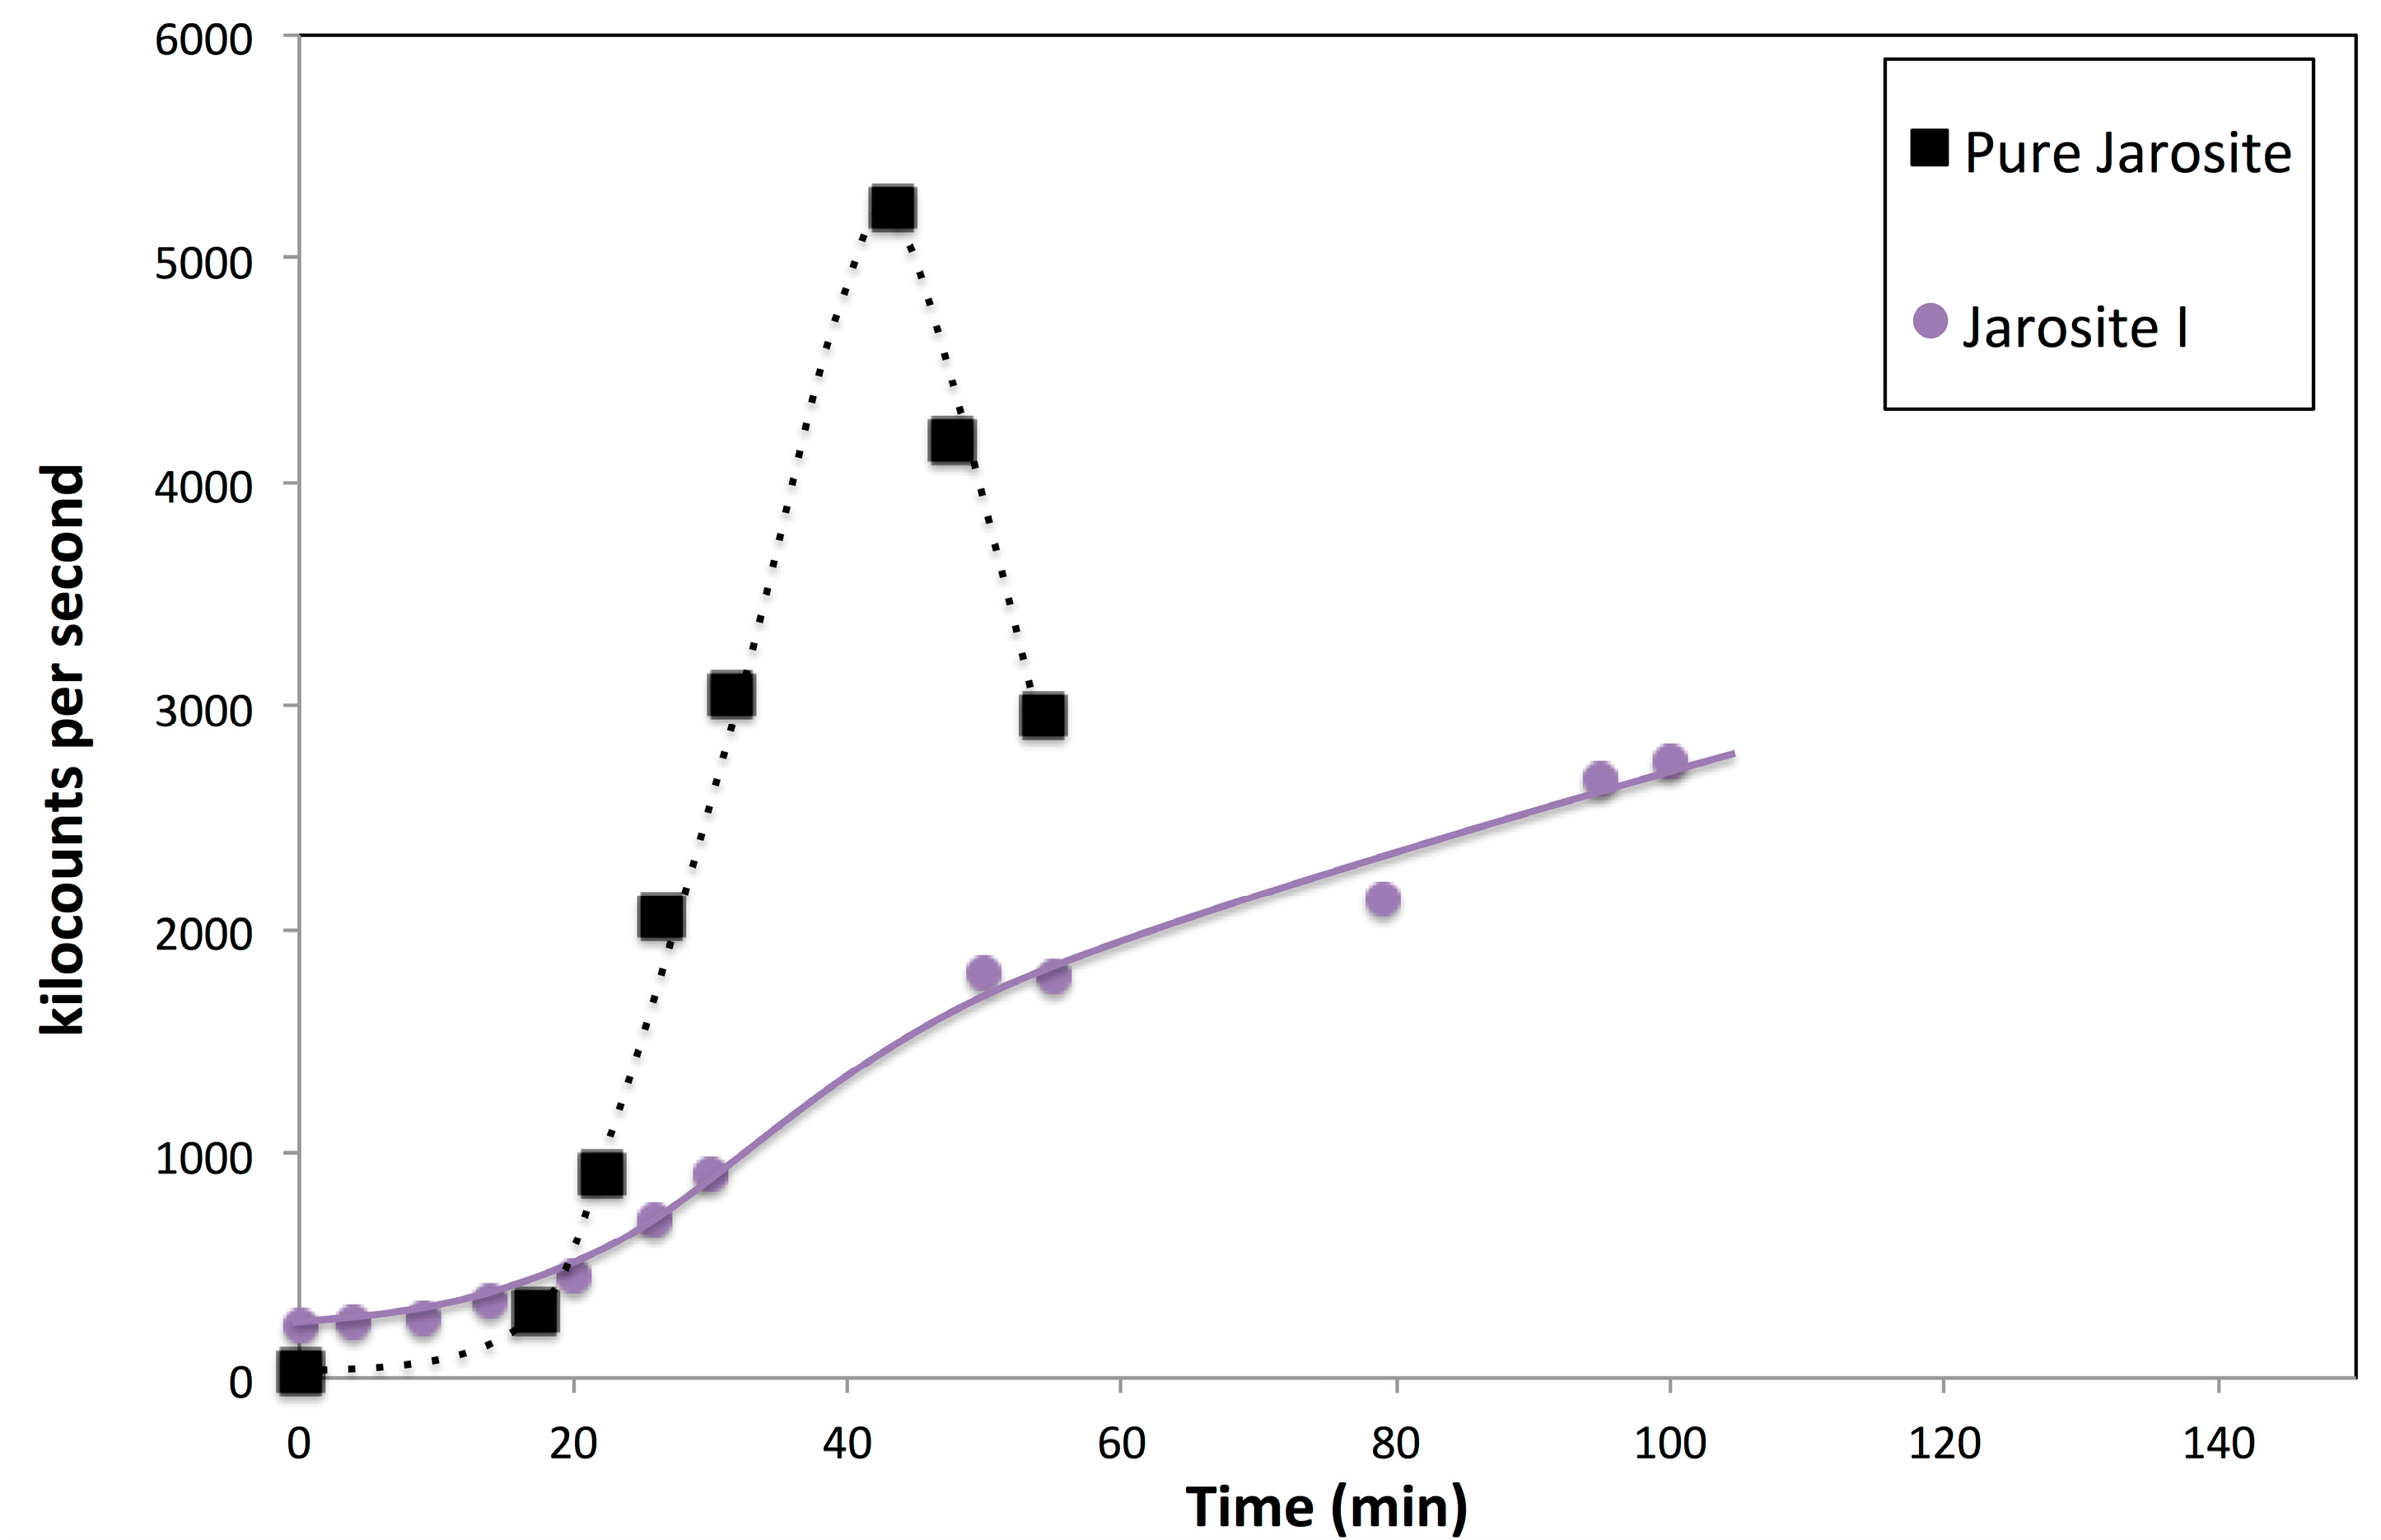
The formation of pure jarosite and a sample with the composition of jarosite I at pH 2.1 were assessed for their nucleation behavior. DLS was used to monitor the particle counts (given as kilocounts per second) in this batch system. The expected behavior is that the counts are low until nucleation occurs, at which point the counts will increase and then remain steady. However, if aggregation or growth processes occur, the counts will drop due to sedimentation of the particles. In addition, if nucleation is not a single event, the counts will continue to increase over time. In the case of pure jarosite (see Figure 14), nucleation did indeed appear to be an individual event at ~20 min with subsequent sedimentation of particles due to aggregation or growth. In contrast, the Fe-substituted alunite sample (jarosite I) showed an increase in particles numbers at ~20 min but also an additional further steady increase in particle numbers that continued after 100 min. The number of particles counted (or nuclei formed) was lower for alunite than jarosite, although this would be expected because the more thermodynamically stable solid usually has the higher surface free energy. Although further work is required, these preliminary results imply that the nucleation of alunite is more complex than that of jarosite and was continuous.
4. Discussion
Morphology results showed that increasing the Al content initially formed smaller, more intergrown particles, which eventually became spherical as the Al mole fraction reached 1. This was supported by the FTIR results that showed that as the Al content increased, the sulphate band broadened and then became alunite-like. A spherical morphology has not previously been mentioned for alunite (as far as the author is aware) and suggests that temperature is a key determinant in the morphology observed for both jarosite and alunite. Thus, at temperatures below 100 °C, alunite formation will not result in solids with distinct crystallographic faces, and this spherical morphology would be expected. As such, the morphology of the solid alunite formed may give clues as to the formation temperature. This morphology may also have consequences for dissolution by virtue of the smaller size and therefore increased surface area.
The added [Al3+] versus incorporated Al3+ (Figure 3) was very similar to Brophy et al. [23], whereby only above an initial Al/(Al + Fe) content of 0.7 did the product begin to show >20% Al substitution. The difference to the results presented here are undoubtedly due to the differences in temperature used to prepare the samples (105 °C in [23] and 90 °C here). In addition, this was not an expected result if considering the alunite has been found to have the lower formation enthalpy. This would suggest that alunite would be less soluble than jarosite and should readily form before any jarosite. Brophy et al. [23] proposed the hydrolysis of the iron and aluminium ions as being the critical factor in determining whether the iron or aluminium ion would be prefered in the structure. This hypothesis is supported by our modelling results, where replacing Al3+ cations with Fe3+ has a lower replacement energy as more substitution occurs. Looking at the replacement energy calculation, every time an Al3+ cation was replaced with an Fe3+ cation, there was a gain in Al3+ hydration energy. Thus, one possible activation energy barrier in the formation of alunite is the dehydration of the Al3+ cation. Cation dehydration being a rate determining step has been found for other systems (barite, for example [45]).
The thermal data showed that alunite contained more “additional” water and had higher decomposition temperatures, especially when no iron was present. This was supported by the ICP data, where the alunite samples were calculated to have higher water contents than the jarosite samples. However, within the alunite samples, lower Fe contents did not always correlate with higher water contents. Overall, however, the data support that the higher hydration energy of Al is a key factor in the formation of alunite type structures.
XRD data confirmed that 50% substitution was required to see an intermediate spectrum having both alunite and jarosite like properties, and Rietveld analysis showed that the a lattice parameter obeyed Vegard’s Rule [42], but the c lattice parameter showed no trend with Al content.
The nucleation behavior of jarosite was as would be expected, showing a sharp increase in particle counts (correlating to the nucleation event) and then some growth or agglomeration mechanisms leading to sedimentation of the particles. In the case of Fe-containing alunite (jarosite I sample), the particle numbers did increase at approximately the same time as the pure jarosite but continued to steadily increase. In this case, a significant jump in the particle counts was not observed. This suggests that nucleation is not a single event but continues to occur throughout the measurement period.
5. Conclusions
Jarosite is a mineral of interest both from an environmental perspective (e.g., acid mine drainage systems) and more recently from a planetary perspective (the discovery of jarosite and alunite on Mars). Therefore, understanding how different formation temperatures and Al/Fe ratios impact infrared spectroscopy, XRD and thermal behaviour is important.
While alunite has the lower formation energy and, therefore, would be expected to be the thermodynamically stable product, high concentrations of Al are required in solution in order to form Al substituted jarosites. Molecular modelling results suggest that this could be due to the hydration energy of Al3+ compared to Fe3+. The higher hydration energy of Al3+ cations means that this energy must be overcome in order to substitute Fe3+ for Al3+.
The TGA results showed that the transition temperatures for structural water removal and de-sulphurization tend to higher temperatures as the Al content is increased in the structure. It was also found that the alunite structure will incorporate more “additional” water as well as structural water, and this was observed in the data as a broad endotherm below 300 °C. This again supports the modelling results that implicate Al3+ dehydration as a key intermediate step. Finally, DLS showed that the number of nuclei followed the expected trend based on surface energy considerations, but that, for alunite, nucleation did not appear to be a single event but rather a continuous one.
Supplementary Materials
The following are available online at www.mdpi.com/2075-163X/7/6/90/s1; Figure S1: XRD pattern and Rietveld fit for jarosite K (GOF 2.8); Figure S2: SEM image of particles formed in the synthesis of the jarosite J sample, Table S1: Fitting statistics for Rietveld refinement of samples; Figure S3: Vacancies and ‘Additional water’ found for samples versus iron content; Figure S4: Experimental XRD patterns for pure end members and their database match, Figure S5: Infrared spectra of pure jarosite (jarosite A) and pure alunite for wavenumbers 4000–1800 cm−1; Table S2: Empirical potentials used in the modelling; Table S3: Comparison between simulated and experimental values (from supercell simulations).
Acknowledgments
I would like to thank Peter Chapman for the TGA analysis and acknowledge the Curtin Centre for Materials Research, Curtin University, WA, Australia for use of the SEM and XRD facilities.
Conflicts of Interest
The author declares no conflict of interest.
References
- Bibi, I.; Singh, B.; Silvester, E. Akaganeite (beta-FeOOH) precipitation in inland acid sulfate soils of south-western New South Wales (NSW), Australia. Geochim. Cosmochim. Acta 2011, 75, 6429–6438. [Google Scholar] [CrossRef]
- Das, S.; Hendry, M.J. Application of Raman spectroscopy to identify iron minerals commonly found in mine wastes. Chem. Geol. 2011, 290, 101–108. [Google Scholar] [CrossRef]
- Long, D.T.; Fegan, N.E.; McKee, J.D.; Lyons, W.B.; Hines, M.E.; Macumber, P.G. Formation of alunite, jarosite and hydrous iron oxides in a hypersaline system: Lake Tyrell, Victoria. Aust. Chem. Geol. 1992, 96, 183–202. [Google Scholar] [CrossRef]
- Dutrizac, J.E.; Jambor, J.L. Jarosites and their application in hydrometallurgy. Rev. Miner. Geochem. 2000, 40, 405–452. [Google Scholar] [CrossRef]
- Klingelhofer, A.K.; Morris, R.V.; Bernhardt, B.; Schröder, C.; Rodinov, D.S.; de Souza Jnr, P.A.; Yen, A.; Gellert, R.; Evalanov, E.N.; Ming, D.W.; et al. Jarosite and hematite at Meridiani Planum from opportunity’s Mossbauer spectrometer. Science 2004, 306, 1740–1745. [Google Scholar] [CrossRef] [PubMed]
- Smith, R.T.; Comer, J.B.; Ennis, M.V.; Branam, T.B.; Butler, S.M.; Renton, P.M. Toxic Metals Removal in Acid mine Drainage Tratment Wetlands; Technical Report; Indiana Geological Survey: Bloomington, IN, USA, 2001. [Google Scholar]
- Figueiredo, M.-O.; da Silva, T.P. The positive environmental contribution of jarosite by retaining lead in acid mine drainage areas. Int. J. Environ. Res. Public Health 2011, 8, 1575–1582. [Google Scholar] [CrossRef] [PubMed]
- Smith, A.M.L.; Hudson-Edwards, K.A.; Dubbin, W.E.; Wright, K. Dissolution of Jarosite [KFe3(SO4)2(OH)6] at pH 2 and 8: Insights from Batch Experiments and Computational Modelling. Geochim. Cosmochim. Acta 2006, 70, 608–621. [Google Scholar] [CrossRef]
- Murphy, P.J.; Smith, A.M.L.; Hudson-Edwards, K.A.; Dubbin, W.E.; Wright, K. Raman and IR spectroscopic studies of alunite-supergroup compounds containing Al3+, Cr3+, Fe3+ and V3+ at the B site. Can. Mineral. 2009, 47, 663–681. [Google Scholar] [CrossRef]
- Smeaton, C.M.; Freyer, B.J.; Weisener, C.G. Intracellular precipitation of Pb by Shewanella putrifaciens CN32 during the reductive dissolution of Pb-jarosite. Environ. Sci. Technol. 2009, 43, 8086–8091. [Google Scholar] [CrossRef] [PubMed]
- Leahy, M.J.; Schwarz, M.P. Modelling jarosite precipitation in isothermal chalcopyrite bioleaching columns. Hydrometallurgy 2009, 98, 181–191. [Google Scholar] [CrossRef]
- Sasaki, K.; Takatsugi, K.; Hirajima, T. Effects of initial Fe2+ concentration and pulp density on the bioleaching of Cu from enargite by Acidianus brierleyi. Hydrometallurgy 2011, 109, 153–160. [Google Scholar] [CrossRef]
- Drouet, C.; Navrotsky, A. Synthesis, characterization, and thermochemistry of K-Na-H3O jarosites. Geochim. Cosmochim. Acta 2003, 67, 2063–2076. [Google Scholar] [CrossRef]
- Drouet, C.; Pass, K.L.; Baron, D.; Drauker, S.; Navrotsky, A. Thermochemistry of jarosite-alunite and natrojarosite-natroalunite solid solutions. Geochim. Cosmochim. Acta 2004, 68, 2197–2205. [Google Scholar] [CrossRef]
- Grube, E.; Nielsen, U.G. The stoichiometry of synthetic alunite as a function of hydrothermal aging investigated by solid-state NMR spectroscopy, powder X-ray diffraction and infrared spectrscopy. Phys. Chem. Miner. 2015, 42, 337–345. [Google Scholar] [CrossRef]
- Stoffregen, R.E.; Alpers, C.N.; Jambor, J.L. Alunite-Jarosite crystallography, thermodynamics, and geochronology. Rev. Mineral. Geochem. 2012, 9, 454–479. [Google Scholar] [CrossRef]
- Alpers, C.N.; Rye, R.O.; Nordstrom, D.K.; White, L.D.; King, B.-S. Chemical, crystallographic and stable isotopic properties of alunite and jarosite from acid-hypersaline Australian lakes. Chem. Geol. 1992, 96, 203–226. [Google Scholar] [CrossRef]
- Ehlmann, B.L.; Swayze, G.A.; Milliken, R.E.; Mustard, J.F.; Clark, R.N.; Murchie, S.L.; Breit, G.N.; Wray, J.J.; Gondet, B.; Puolet, F.; et al. Discovery of alunite in Cross crater, Terra Sirenum, Mars: Evidence for acidic, sulforous waters. Am. Mineral. 2016, 101, 1527–1542. [Google Scholar] [CrossRef]
- Becker, U.; Gasharova, B. AFM observations and simulations of jarosite growth at the molecular scale: Probing the basis for the incorporation of foreign ions into jarosite as a storage material. Phys. Chem. Miner. 2001, 28, 545–556. [Google Scholar] [CrossRef]
- Desborough, G.A.; Smith, K.S.; Lowers, H.A.; Swayze, G.A.; Hammarstrom, J.M.; Diehl, S.F.; Leinz, R.W.; Driscoll, R.L. Mineralogical and chemical characteristics of some natural jarosites. Geochim. Cosmochim. Acta 2010, 74, 1041–1056. [Google Scholar] [CrossRef]
- Scott, K.M. Solid solution in, and classification of, gossan-derived members of the alunite-jarosite family, northwest Queensland, Australia. Am. Mineral. 1987, 72, 178–187. [Google Scholar]
- Scott, K.M. Origin of alunite and jarosite-group minerals in the Mt. Leyshon epithermal gold deposit, northeast Queensland, Australia. Am. Mineral. 1990, 75, 1176–1181. [Google Scholar]
- Brophy, G.P.; Scott, E.S.; Snellgrove, R.A. Sulfate studies II. Solid solution between alunite and jarosite. Am. Mineral. 1962, 47, 112–126. [Google Scholar]
- Basciano, L.C.; Peterson, R.C. Crystal chemistry of the natrojarosite-jarosite and natrojarosite-hydronium jarosite solid-solution series: A synthetic study with full Fe site occupancy. Am. Mineral. 2008, 93, 853–862. [Google Scholar] [CrossRef]
- Nielsen, U.G.; Majzlan, J.; Grey, C.P. Determination and quantification of the local environments in stoichiometric and defect jarosite by solid-state H-2 NMR spectroscopy. Chem. Mater. 2008, 20, 2234–2241. [Google Scholar] [CrossRef]
- Scarlett, N.V.Y.; Grey, I.E.; Brand, H.E.A. Ordering of iron vacancies in monoclinic jarosites. Am. Mineral. 2010, 95, 1590–1593. [Google Scholar] [CrossRef]
- Maubec, N.; Lahfid, A.; Lerouge, C.; Wille, G.; Michel, K. Characterization of alunite supergroup minerals by Raman spectroscopy. Spectrochim. Acta A Mol. Biomol. Spectrosc. 2012, 96, 925–939. [Google Scholar] [CrossRef] [PubMed]
- Spratt, H.J.; Rintoul, L.; Avdeev, M.; Martens, W.N. The crystal structure and vibrational spectroscopy of jarosite and alunite minerals. Am. Mineral. 2013, 98, 1633–1643. [Google Scholar] [CrossRef]
- Rudolph, W.W.; Mason, R.; Schmidt, P. Synthetic alunites of the potassium-oxonium solid solution series and some other members of the group: synthesis, thermal and X-ray characterization. Eur. J. Mineral. 2003, 15, 913–924. [Google Scholar] [CrossRef]
- Crabbe, H.; Fernandez, N.; Jones, F. Crystallization of jarosite in the presence of amino acids. J. Cryst. Growth 2015, 416, 28–33. [Google Scholar] [CrossRef]
- Dutrizac, J.E.; Dinardo, O.; Kaiman, S. Factors affecting lead jarosite formation. Hydrometallurgy 1980, 5, 305–324. [Google Scholar] [CrossRef]
- Mullin, J.W. Nucleation. In Crystallization, 3rd ed.; Butterworth-Heinemann: Oxford, UK, 1961; pp. 172–201. [Google Scholar]
- Acero, P.; Hudson-Edwards, K.A.; Gale, J.D. Influence of pH and temperature on alunite dissolution: Rates, products and insights on mechanisms from atomistic simulations. Chem. Geol. 2015, 419, 1–9. [Google Scholar] [CrossRef]
- Bunney, K.; Freeman, S.R.; Ogden, M.I.; Richmond, W.R.; Rohl, A.L.; Jones, F. Effect of La3+ on the crystal growth of barium sulfate. Cryst. Growth Des. 2014, 14, 1650–1658. [Google Scholar] [CrossRef]
- Jones, F.; Richmond, W.R.; Rohl, A.L. Molecular modelling of phosphonate molecules onto barium sulfate terraced surfaces. J. Phys. Chem. B. 2006, 110, 7414–7424. [Google Scholar] [CrossRef] [PubMed]
- Fleming, S.; Rohl, A.L. GDIS: A visualization program for molecular and periodic systems. Zeitschrift für Kristallographie 2005, 220, 580–584. [Google Scholar] [CrossRef]
- Gale, J.D.; Rohl, A.L. The General Utility Lattice Program. Mol. Simul. 2003, 29, 291–341. [Google Scholar] [CrossRef]
- Marcus, Y. Thermodynamics of solvation of ions Part 5. Gibbs Free energy of hydration at 298.15K. J. Chem. Soc. Faraday Trans. 1991, 87, 2995–2999. [Google Scholar] [CrossRef]
- Sasaki, K. Raman study of the microbially mediated dissolution of pyrite by Thiobacillus ferrooxidans. Can. Mineral. 1997, 35, 999–1008. [Google Scholar]
- Sasaki, K.; Konno, H. Morphology of jarosite-group compounds precipitated from biologically and chemically oxidized Fe ions. Can. Mineral. 2000, 38, 45–56. [Google Scholar] [CrossRef]
- Majzlan, J.; Speziale, S.; Duffy, T.S.; Burns, P.C. Single-crystal elastic properties of alunite, KAl3(SO4)2(OH)6. Phys. Chem. Miner. 2006, 33, 567–573. [Google Scholar] [CrossRef]
- Vegard, L. Die Konstitution der Mischkristalle und die Raumfüllung der Atome. Zeitschrift für Physik 1921, 5, 17–26. [Google Scholar] [CrossRef]
- Kubisz, J. Studies on synthetic alkali-hydronium jarosites II: Thermal investigations. Mineral. Pol. 1971, 2, 51–59. [Google Scholar]
- Kuçuk, F.; Yildiz, K. The decomposition kinetics of mechanically activated alunite ore in air atmosphere by thermogravimetry. Thermochim. Acta 2006, 448, 107–110. [Google Scholar] [CrossRef]
- Piana, S.; Jones, F.; Gale, J.D. Assisted desolvation as a key kinetic step for crystal growth. J. Am. Chem. Soc. 2006, 128, 13668–13674. [Google Scholar] [CrossRef] [PubMed]
Figure 1.
SEM images of jarosite particles formed for sample (a) jarosite A (control); (b) jarosite C; (c) jarosite D; and (d) jarosite F (all scale bars 2 µm).
Figure 1.
SEM images of jarosite particles formed for sample (a) jarosite A (control); (b) jarosite C; (c) jarosite D; and (d) jarosite F (all scale bars 2 µm).

Figure 2.
SEM images of jarosite particles formed for sample (a) jarosite H, and, (b) alunite (all scale bars 2 µm).
Figure 2.
SEM images of jarosite particles formed for sample (a) jarosite H, and, (b) alunite (all scale bars 2 µm).

Figure 3.
Aluminium ion content in the initial solution versus that found in the solid on collection of the product.
Figure 3.
Aluminium ion content in the initial solution versus that found in the solid on collection of the product.

Figure 4.
XRD pattern of end member solids, jarosite and alunite.

Figure 5.
XRD pattern of solids obtained on initial addition of up to 0.9 mole fraction Al. Patterns have been offset in the y-direction for clarity.
Figure 5.
XRD pattern of solids obtained on initial addition of up to 0.9 mole fraction Al. Patterns have been offset in the y-direction for clarity.

Figure 6.
XRD pattern of solids obtained on initial addition of up to 0.9–1.0 mole fraction Al. Patterns have been offset in the y-direction for clarity.
Figure 6.
XRD pattern of solids obtained on initial addition of up to 0.9–1.0 mole fraction Al. Patterns have been offset in the y-direction for clarity.
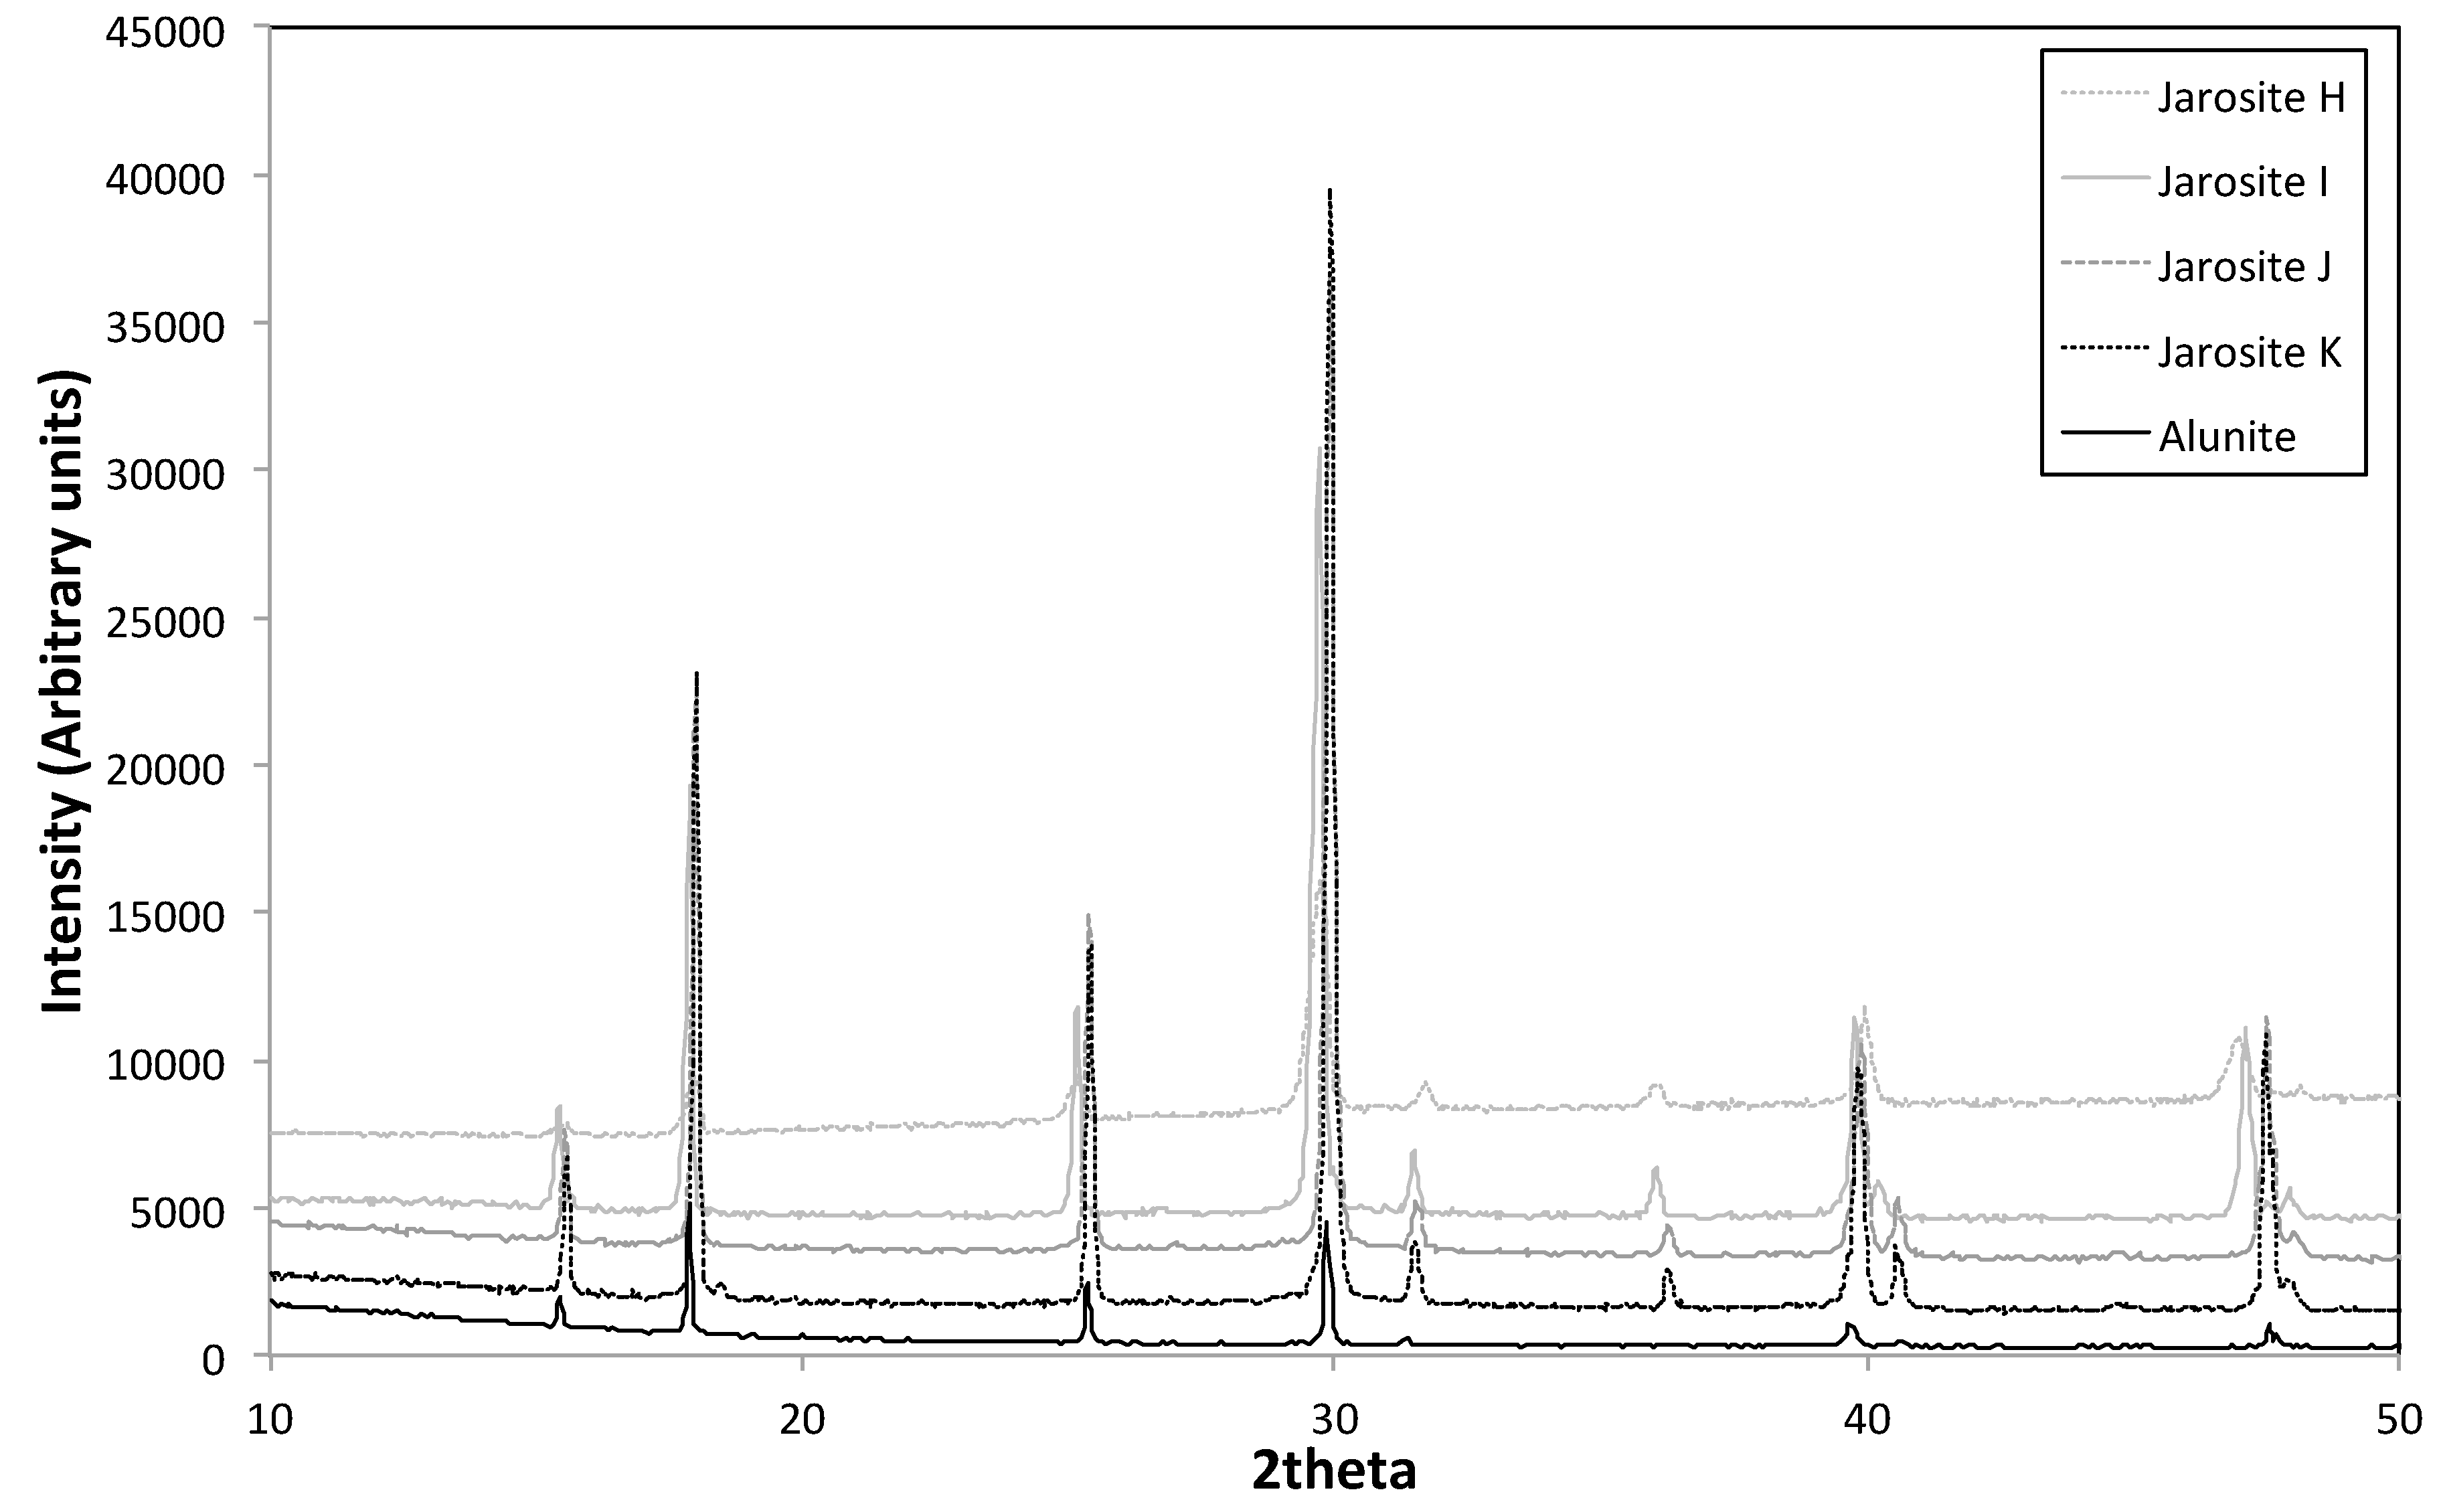
Figure 7.
Lattice parameters (a) a and (b) c obtained from Rietveld analysis for alunite and jarosite versus Al content in solid.
Figure 7.
Lattice parameters (a) a and (b) c obtained from Rietveld analysis for alunite and jarosite versus Al content in solid.

Figure 8.
FTIR spectrum of end member solids (jarosite and alunite).

Figure 9.
FTIR spectra of solids formed on addition of up to 0.9 mole fraction Al.

Figure 10.
FTIR spectra of solids formed at on addition of 0.9–1.0 mole fraction Al. (a) 400–1800 cm−1 region and (b) 2500–4000 cm−1 region. Spectra have been offset in the y-direction for clarity.
Figure 10.
FTIR spectra of solids formed at on addition of 0.9–1.0 mole fraction Al. (a) 400–1800 cm−1 region and (b) 2500–4000 cm−1 region. Spectra have been offset in the y-direction for clarity.
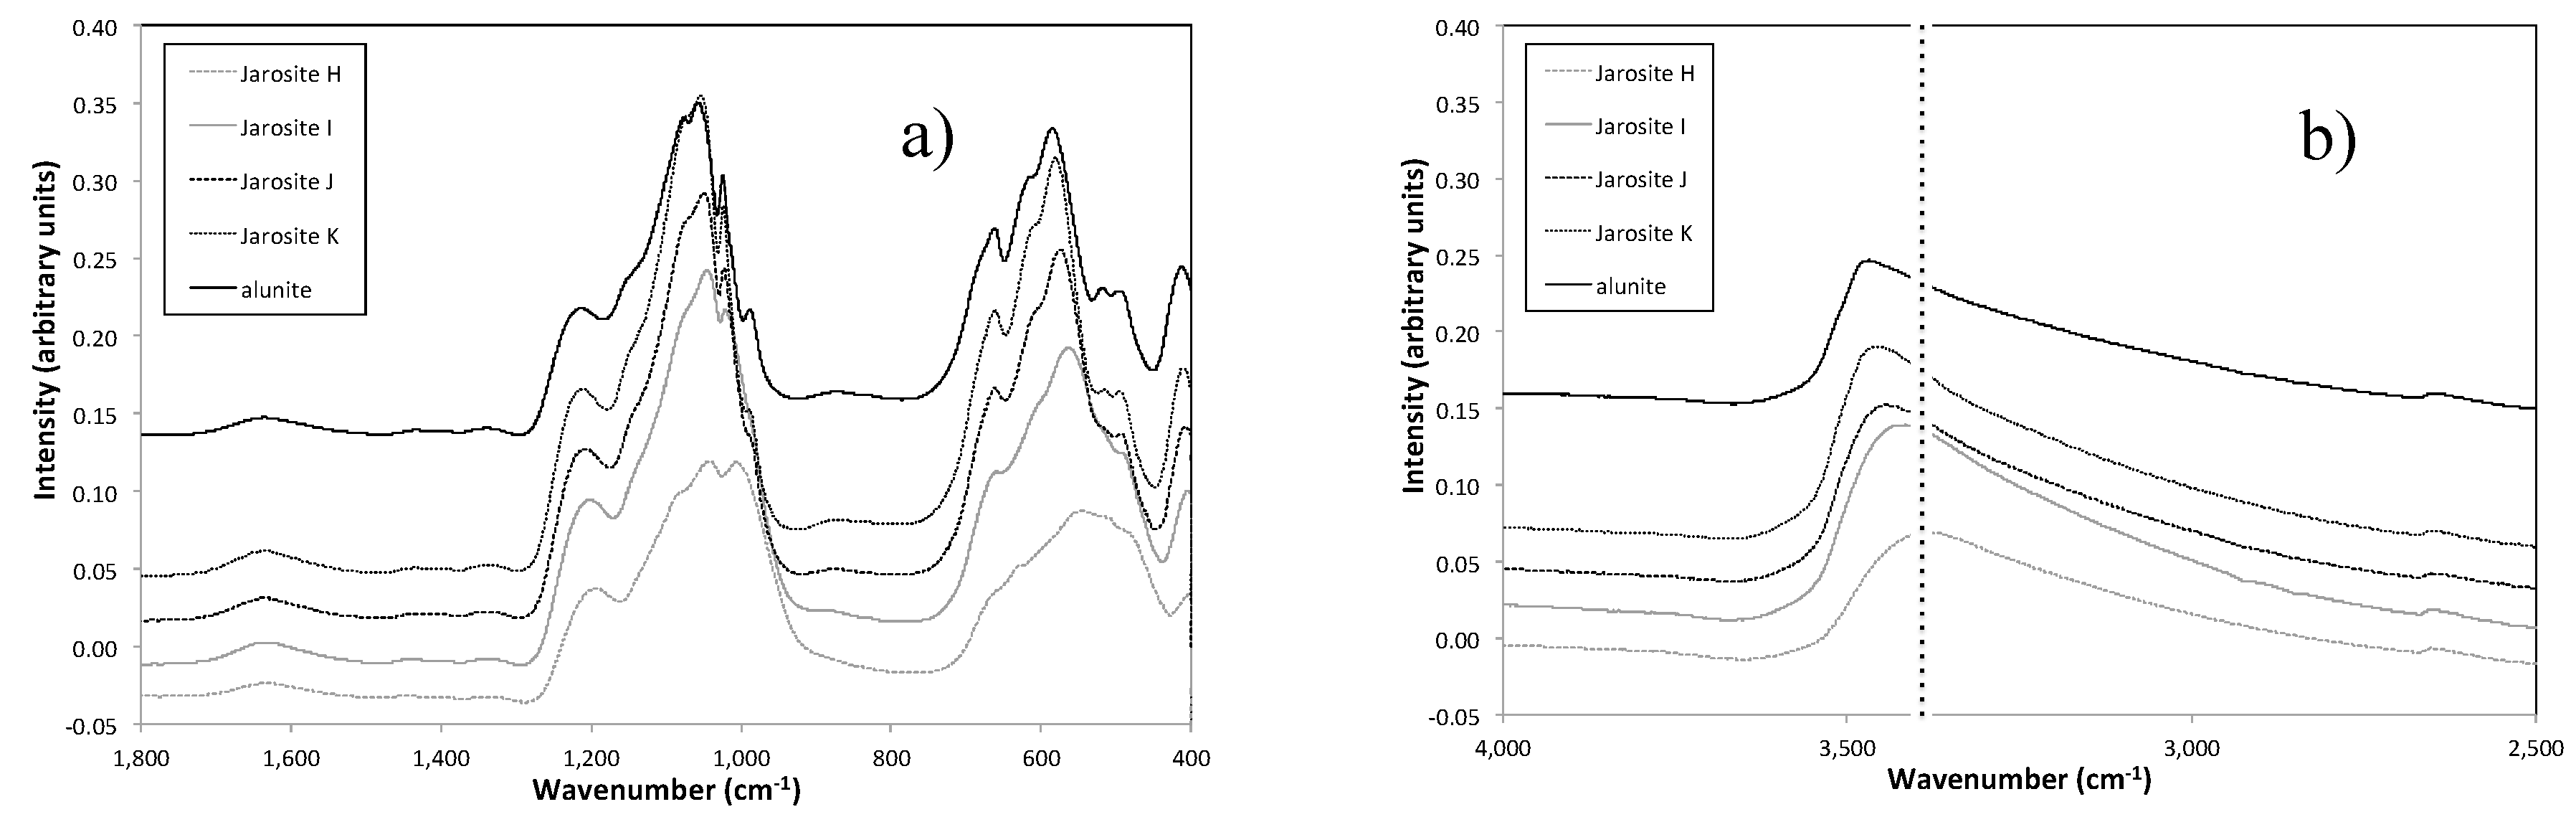
Figure 11.
Replacement energy (eV)/Fe ions substituted versus Al mole fraction.
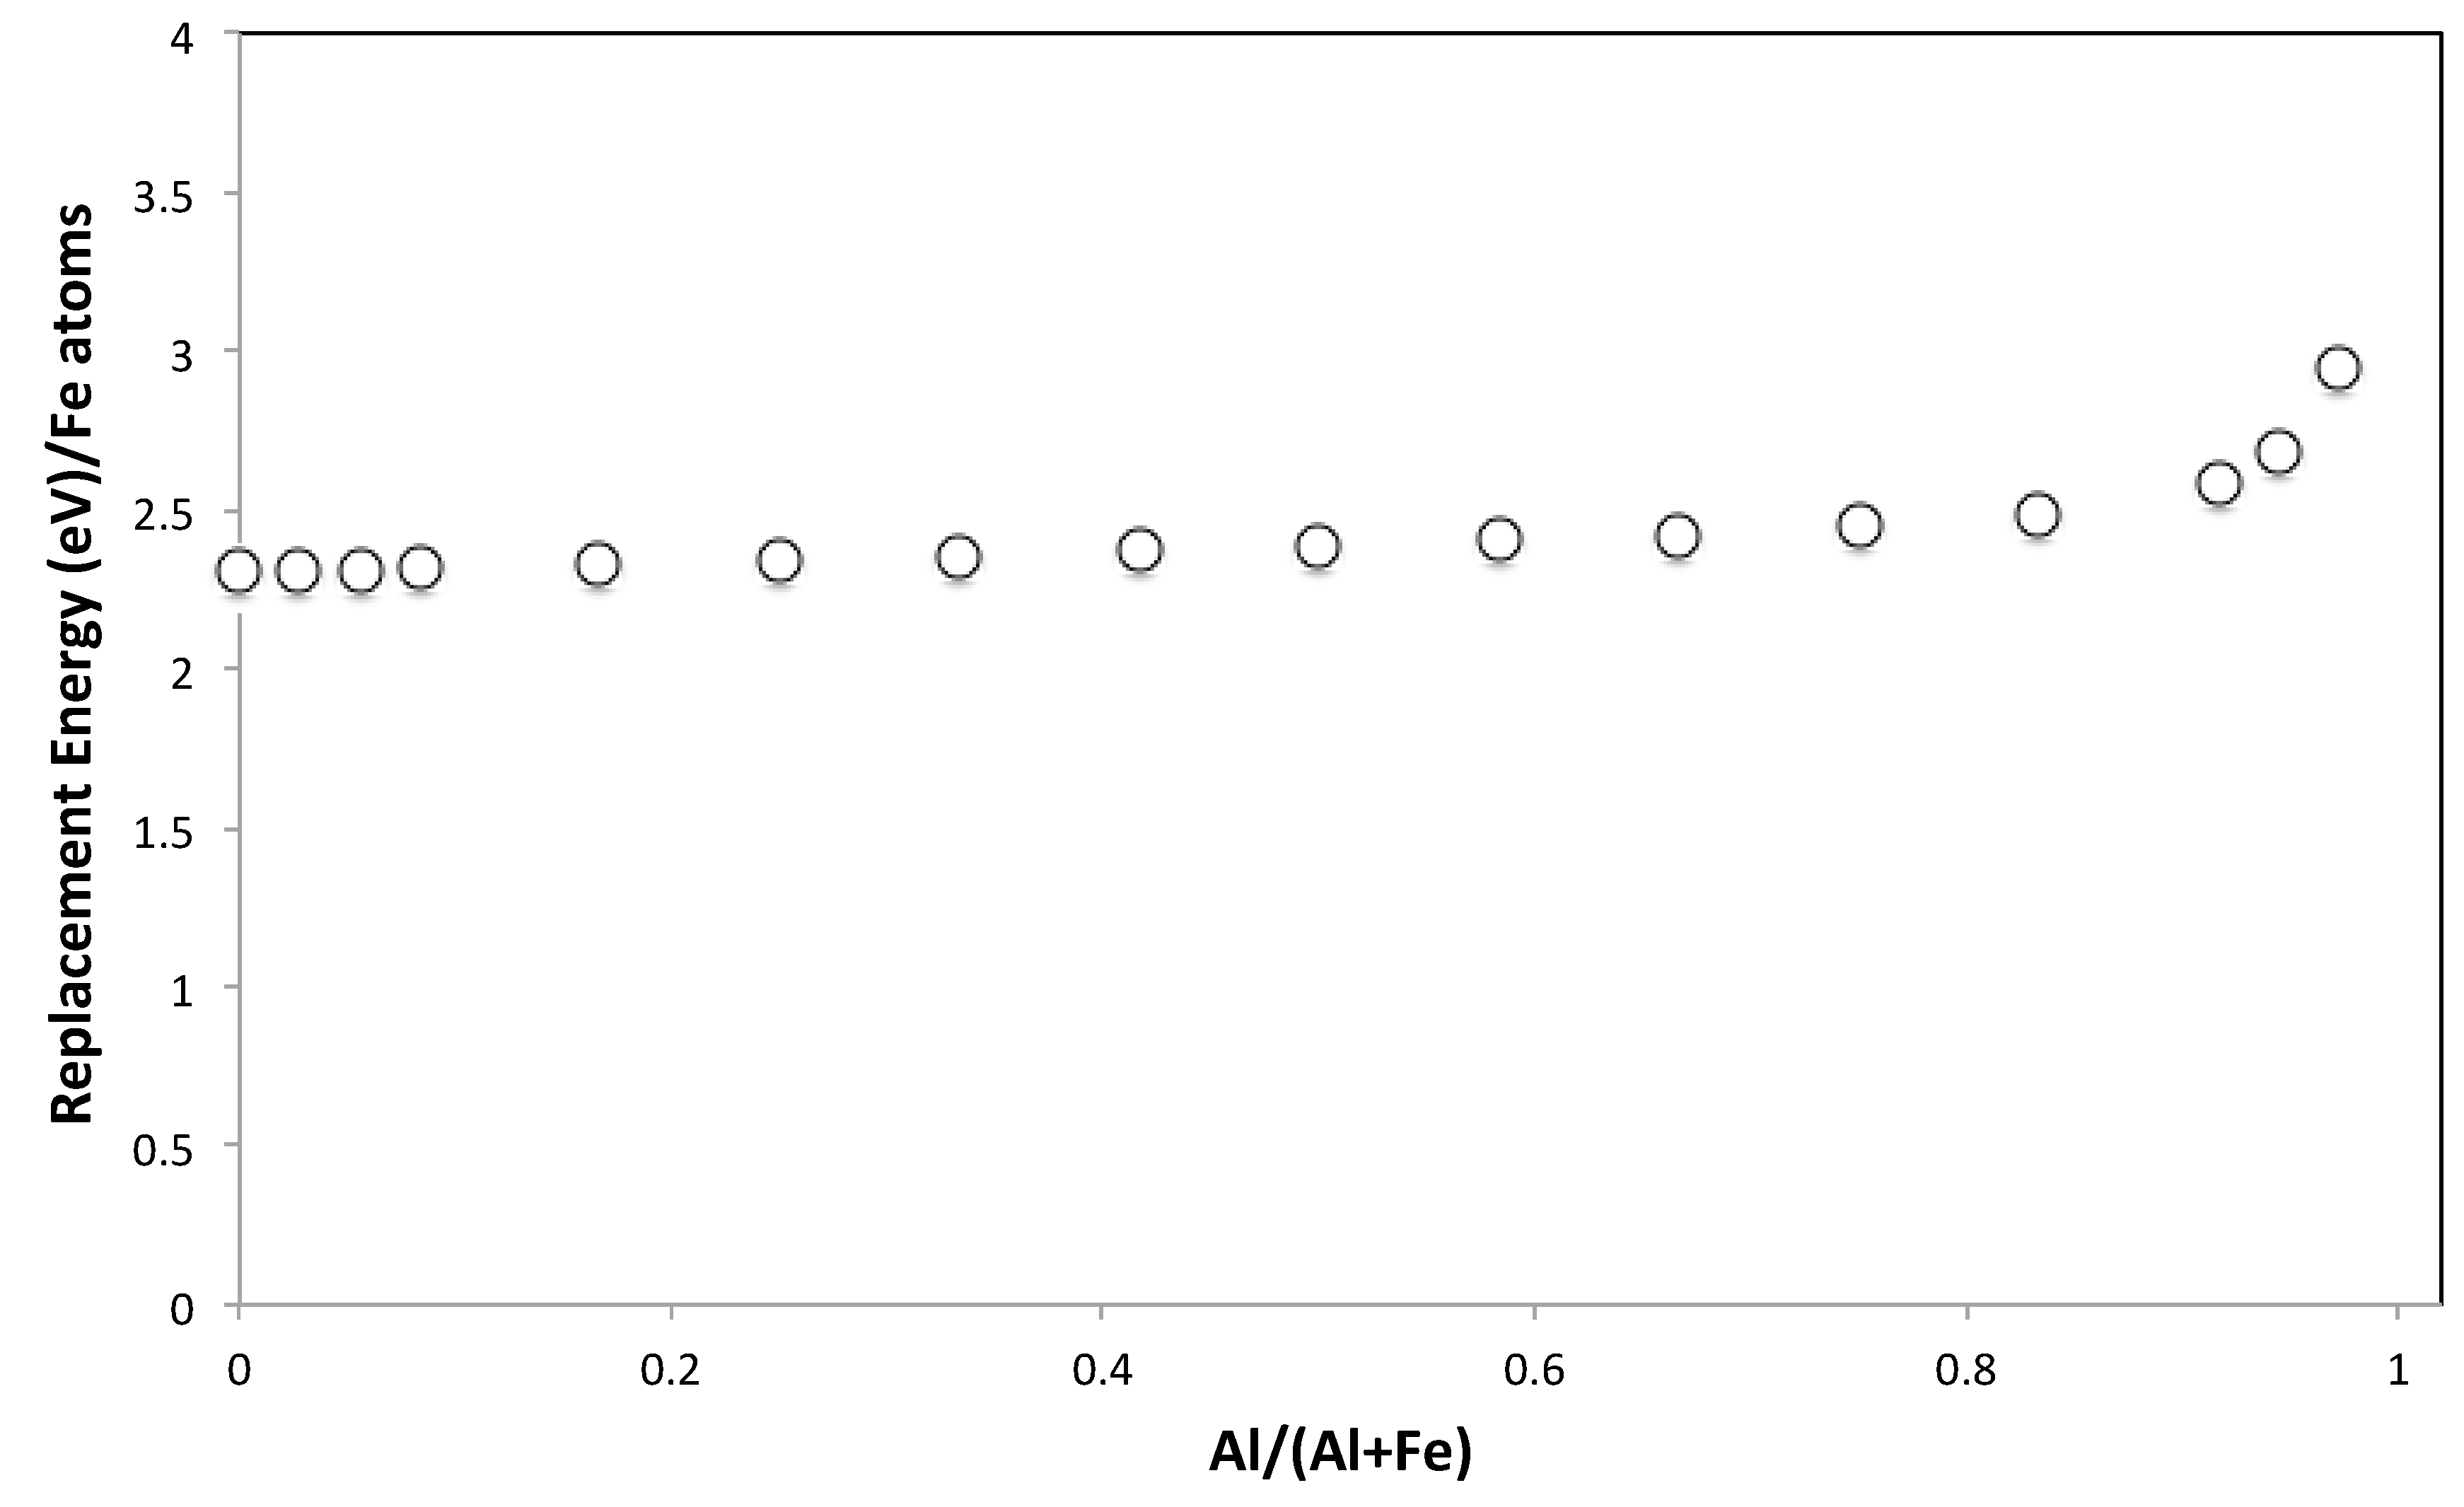
Figure 12.
(a) a and b lattice parameter and (b) c lattice parameter versus Al mole fraction.

Figure 13.
TGA results of mass loss (Relative mass, %) versus temperature (°C) (a,c) and DTA results, Delta T in °C (b,d) for addition of up to 0.9 Al mole fraction (a,b) and 0.9–1.0 mole fraction Al (c,d).
Figure 13.
TGA results of mass loss (Relative mass, %) versus temperature (°C) (a,c) and DTA results, Delta T in °C (b,d) for addition of up to 0.9 Al mole fraction (a,b) and 0.9–1.0 mole fraction Al (c,d).
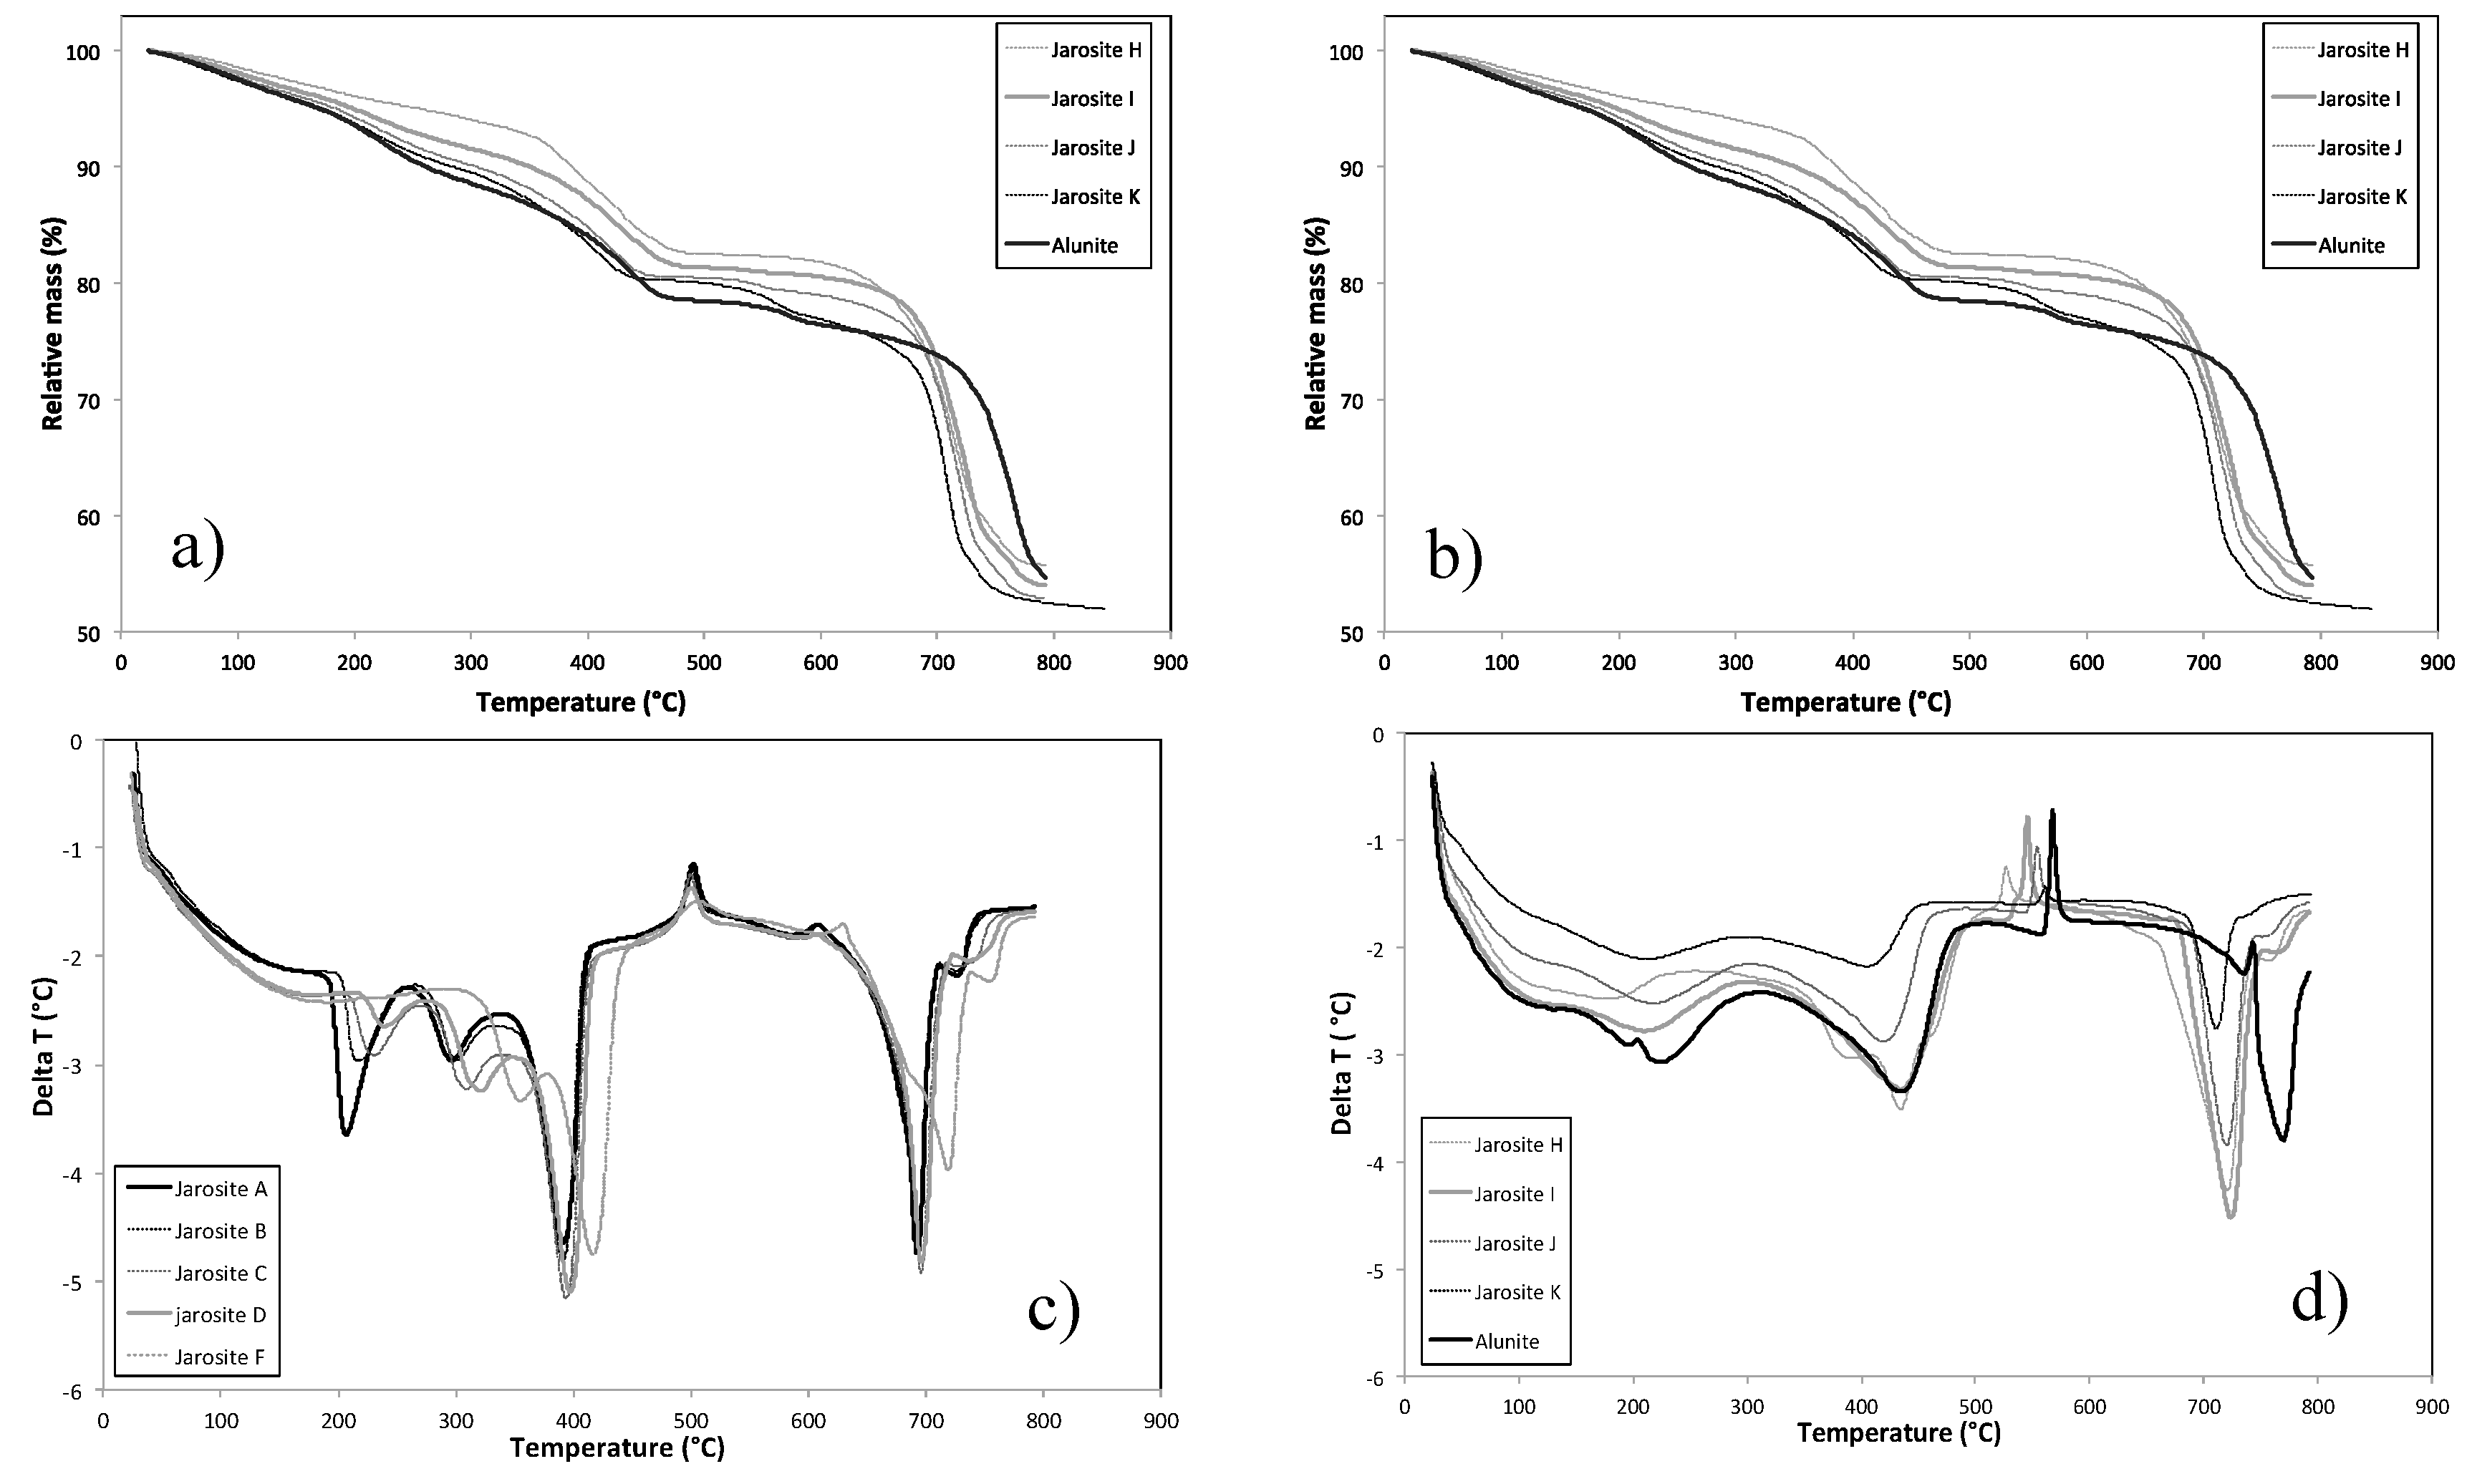
Figure 14.
DLS results of particles counted (kilocounts per second) versus time for pure jarosite and jarosite I.
Figure 14.
DLS results of particles counted (kilocounts per second) versus time for pure jarosite and jarosite I.


Table 1.
List of all samples prepared and the initial molar ratios used to obtain the solids.
| Sample Name | Fe Moles (×10−3) | Al Moles (×10−3) | Fe/Al Molar Ratio | InitialAl/(Al + Fe) |
|---|---|---|---|---|
| Jarosite A | 2.85 | 0 | - | 0 |
| Jarosite B | 1.85 | 0.78 | 2.37 | 0.30 |
| Jarosite C | 1.28 | 1.65 | 0.77 | 0.56 |
| Jarosite D | 0.69 | 2.28 | 0.30 | 0.77 |
| Jarosite E (no solids obtained) | 0 | 3.09 | 0 | 1.00 |
| Jarosite F | 0.74 | 6.53 | 0.11 | 0.90 |
| Jarosite H | 2.22 | 44.0 | 0.05 | 0.95 |
| Jarosite I | 0.89 | 44.0 | 0.02 | 0.98 |
| Jarosite J | 0.04 | 44.0 | 0.01 | 1.00 |
| Jarosite K | 0.02 | 44.0 | 0.005 | 1.00 |
| (Jarosite G) Alunite | 0 | 44.0 | 0 | 1.00 |
Table 2.
Moles and elemental composition of solids formed.
| Sample Name | Fe | Al | K | S | OH− | H2O | H3O+ |
|---|---|---|---|---|---|---|---|
| Jarosite A | 2.61 | 0.00 | 0.88 | 2 | 5.91 | 0.09 | 0.12 |
| Jarosite B | 2.65 | 0.02 | 0.90 | 2 | 5.89 | 0.11 | 0.10 |
| Jarosite C | 2.44 | 0.06 | 0.87 | 2 | 5.63 | 0.37 | 0.13 |
| Jarosite D | 2.33 | 0.15 | 0.84 | 2 | 5.82 | 0.18 | 0.16 |
| Jarosite F | 2.02 | 0.44 | 0.91 | 2 | 5.18 | 0.82 | 0.09 |
| Jarosite H | 1.28 | 1.09 | 0.89 | 2 | 5.02 | 0.98 | 0.11 |
| Jarosite I | 0.80 | 1.55 | 0.86 | 2 | 5.23 | 0.77 | 0.14 |
| Jarosite J | 0.27 | 2.02 | 0.92 | 2 | 4.52 | 1.48 | 0.08 |
| Jarosite K | 0.33 | 1.90 | 0.82 | 2 | 5.16 | 0.84 | 0.18 |
| Alunite | 0.00 | 2.23 | 0.95 | 2 | 4.11 | 1.89 | 0.06 |
Table 3.
Rietveld refinement for samples prepared in this study *.
| Sample Name | Alunite | Jarosite |
|---|---|---|
| Jarosite A | a = 7.306 ± 0.004; c = 17.100 ± 0.008 | |
| Jarosite B | a = 7.3139 ± 0.0005; c = 17.116 ± 0.001 | |
| Jarosite C | a = 7.3068 ± 0.0003; c = 17.1157 ± 0.0008 | |
| Jarosite D | a = 7.2994 ± 0.0003; c = 17.1258 ± 0.0008 | |
| Jarosite F | a = 7.2614 ± 0.0003; c = 17.125 ± 0.001 | |
| Jarosite H | a = 7.173 ± 0.003; c = 17.104 ± 0.007 | |
| Jarosite I | a = 7.1193 ± 0.0001; c = 17.1205 ± 0.0003 | |
| Jarosite J | a = 7.055 ± 0.0005; c = 17.088 ± 0.001 | |
| Jarosite K | a = 7.0579 ± 0.0003; c = 17.1210 ± 0.0008 | |
| (Jarosite G) Alunite | a = 7.0172 ± 0.0003; c = 17.1204 ± 0.0008 |
* The supplementary information gives all the fitting statistics, also structures used are for lowest GOF found for samples with both alunite and jarosite structure possibilities.
© 2017 by the author. Licensee MDPI, Basel, Switzerland. This article is an open access article distributed under the terms and conditions of the Creative Commons Attribution (CC BY) license (http://creativecommons.org/licenses/by/4.0/).
Share and Cite
MDPI and ACS Style
Jones, F. Crystallization of Jarosite with Variable Al3+ Content: The Transition to Alunite. Minerals 2017, 7, 90. https://doi.org/10.3390/min7060090
AMA Style
Jones F. Crystallization of Jarosite with Variable Al3+ Content: The Transition to Alunite. Minerals. 2017; 7(6):90. https://doi.org/10.3390/min7060090
Chicago/Turabian StyleJones, Franca. 2017. "Crystallization of Jarosite with Variable Al3+ Content: The Transition to Alunite" Minerals 7, no. 6: 90. https://doi.org/10.3390/min7060090
Note that from the first issue of 2016, this journal uses article numbers instead of page numbers. See further details here.