Article

Origin of Minerals and Critical Metals in an Argillized Tuff from the Huayingshan Coalfield, Southwestern China

1
State Key Laboratory of Coal Resources and Safe Mining, China University of Mining and Technology, China
2
College of Geoscience and Survey Engineering, China University of Mining and Technology (Beijing), Beijing 100083, China
3
Chongqing Key Laboratory of Exogenic Mineralization and Mine Environment, Chongqing Institute of Geology and Mineral Resources, Chongqing 400042, China
4
Far East Geological Institute, 159 Pr 100-let Vladivostoku, Vladivostok 690022, Russia
*
Author to whom correspondence should be addressed.
Minerals 2017, 7(6), 92; https://doi.org/10.3390/min7060092
Submission received: 3 April 2017 / Revised: 27 May 2017 / Accepted: 1 June 2017 / Published: 5 June 2017

Abstract

:
This paper reports the minerals in an argillized tuff from the Lvshuidong mine, Huayingshan Coalfield, southwestern China. The clay assemblages of the samples are mainly kaolinite, varying proportions of illite and trace chlorite. Other minerals include various proportions of pyrite, small proportions of carbonates (calcite and ankerite), anatase, rutile, hematite, florencite and rare analcite. The clay mineralogy of the tuff profile changes vertically due to the change in the depositional environment. Although illite is minor in the middle and lower parts of the profile, it is relatively abundant in a few topmost samples where the proportion of illite is comparable to that of kaolinite. This is probably because the original volcanic ash was mainly deposited in a continental environment, but marine water may have percolated to the uppermost layers of the ash bed during early diagenesis, leading to the formation of concretions of concentric rings of kaolinite and illite. The samples of this study are derived from alkali mafic volcanic ash with relatively high concentrations of critical metals, including Nb, Ta, Zr, Hf, rare earth elements and Y.

1. Introduction

The Emeishan flood volcanism not only results in dominant basaltic lavas and subordinate pyroclastic rocks, but also flows and tuff of trachytic and rhyolitic composition in the west sub-province [1,2,3]. To the east of the Kangdian Upland, within the central Emeishan large igneous province, a tuff occurs as a possibly correlative band in a wide area covering western Yunnan, southern Sichuan, western Guizhou and Chognqing, where many major coalfields occur in this area (e.g., Songzao, Huayingshan and Zhongliangshan coalfields) (Figure 1). The thickness of the tuff varies from 0.2–21 m, commonly 3–5 m [4], representing a pyroclastic fall associated with the Emeishan flood volcanism. The tuff band can have various mineralogical and geochemical compositions due to different degrees of alteration. For example, Kramer et al. [5] showed that tuff bands from the Sydney Basin represent several cycles of eruptive activity and deposition resulting in a combination of pyroclastic fall, flow and surge with different chemical fingerprints.
On the other hand, altered alkaline volcanic ashes have been reported to be enriched in critical metals such as Nb, Ta, Zr, Hf, Ga and rare earth elements and Y (REY, or REE if Y is not included) [6,7]. Coal-bearing sequences that have been influenced by air-borne volcanic ash falls have also been reported to host some critical metals [8]. Many coals and the host strata in SW China are particularly such cases, which have been known as potential sources of these critical metals [9,10,11].
Previous studies [9,12] have reported the mineralogy and geochemistry of the coal and host rocks (roof and floor strata of coal-seams) from the Huayingshan Coalfield, Sichuan Province, SW China. The coals in this coalfield have been reported to be significantly enriched in critical metals including Zr, Nb, Hf and REY, which are attributed to alkali intra-seam tonsteins and hydrothermal solutions [9]. It has been reported that not only the tonstein-bearing coals, but also the associated non-coal strata distal to coal seams and that underlying the coal seam are enriched in those critical metals [9]; however, the sources and enrichment mechanisms of critical metals in the underlying tuff are not clear.
The present paper reports mineralogical and geochemical characteristics of the altered mafic volcanic ash from the Huayingshan Coalfield and discusses the geological factors responsible for the enrichment of the critical metals and mineral compositions. It also aims to verify the mafic chemical composition of the tuff and to evaluate the possible economic significance of the critical metals in the samples. The argillized tuff bed at the lowermost Longtan Formation is widely distributed in SW China, so that this study is expected to provide additional information on the depositional environment of the large area.

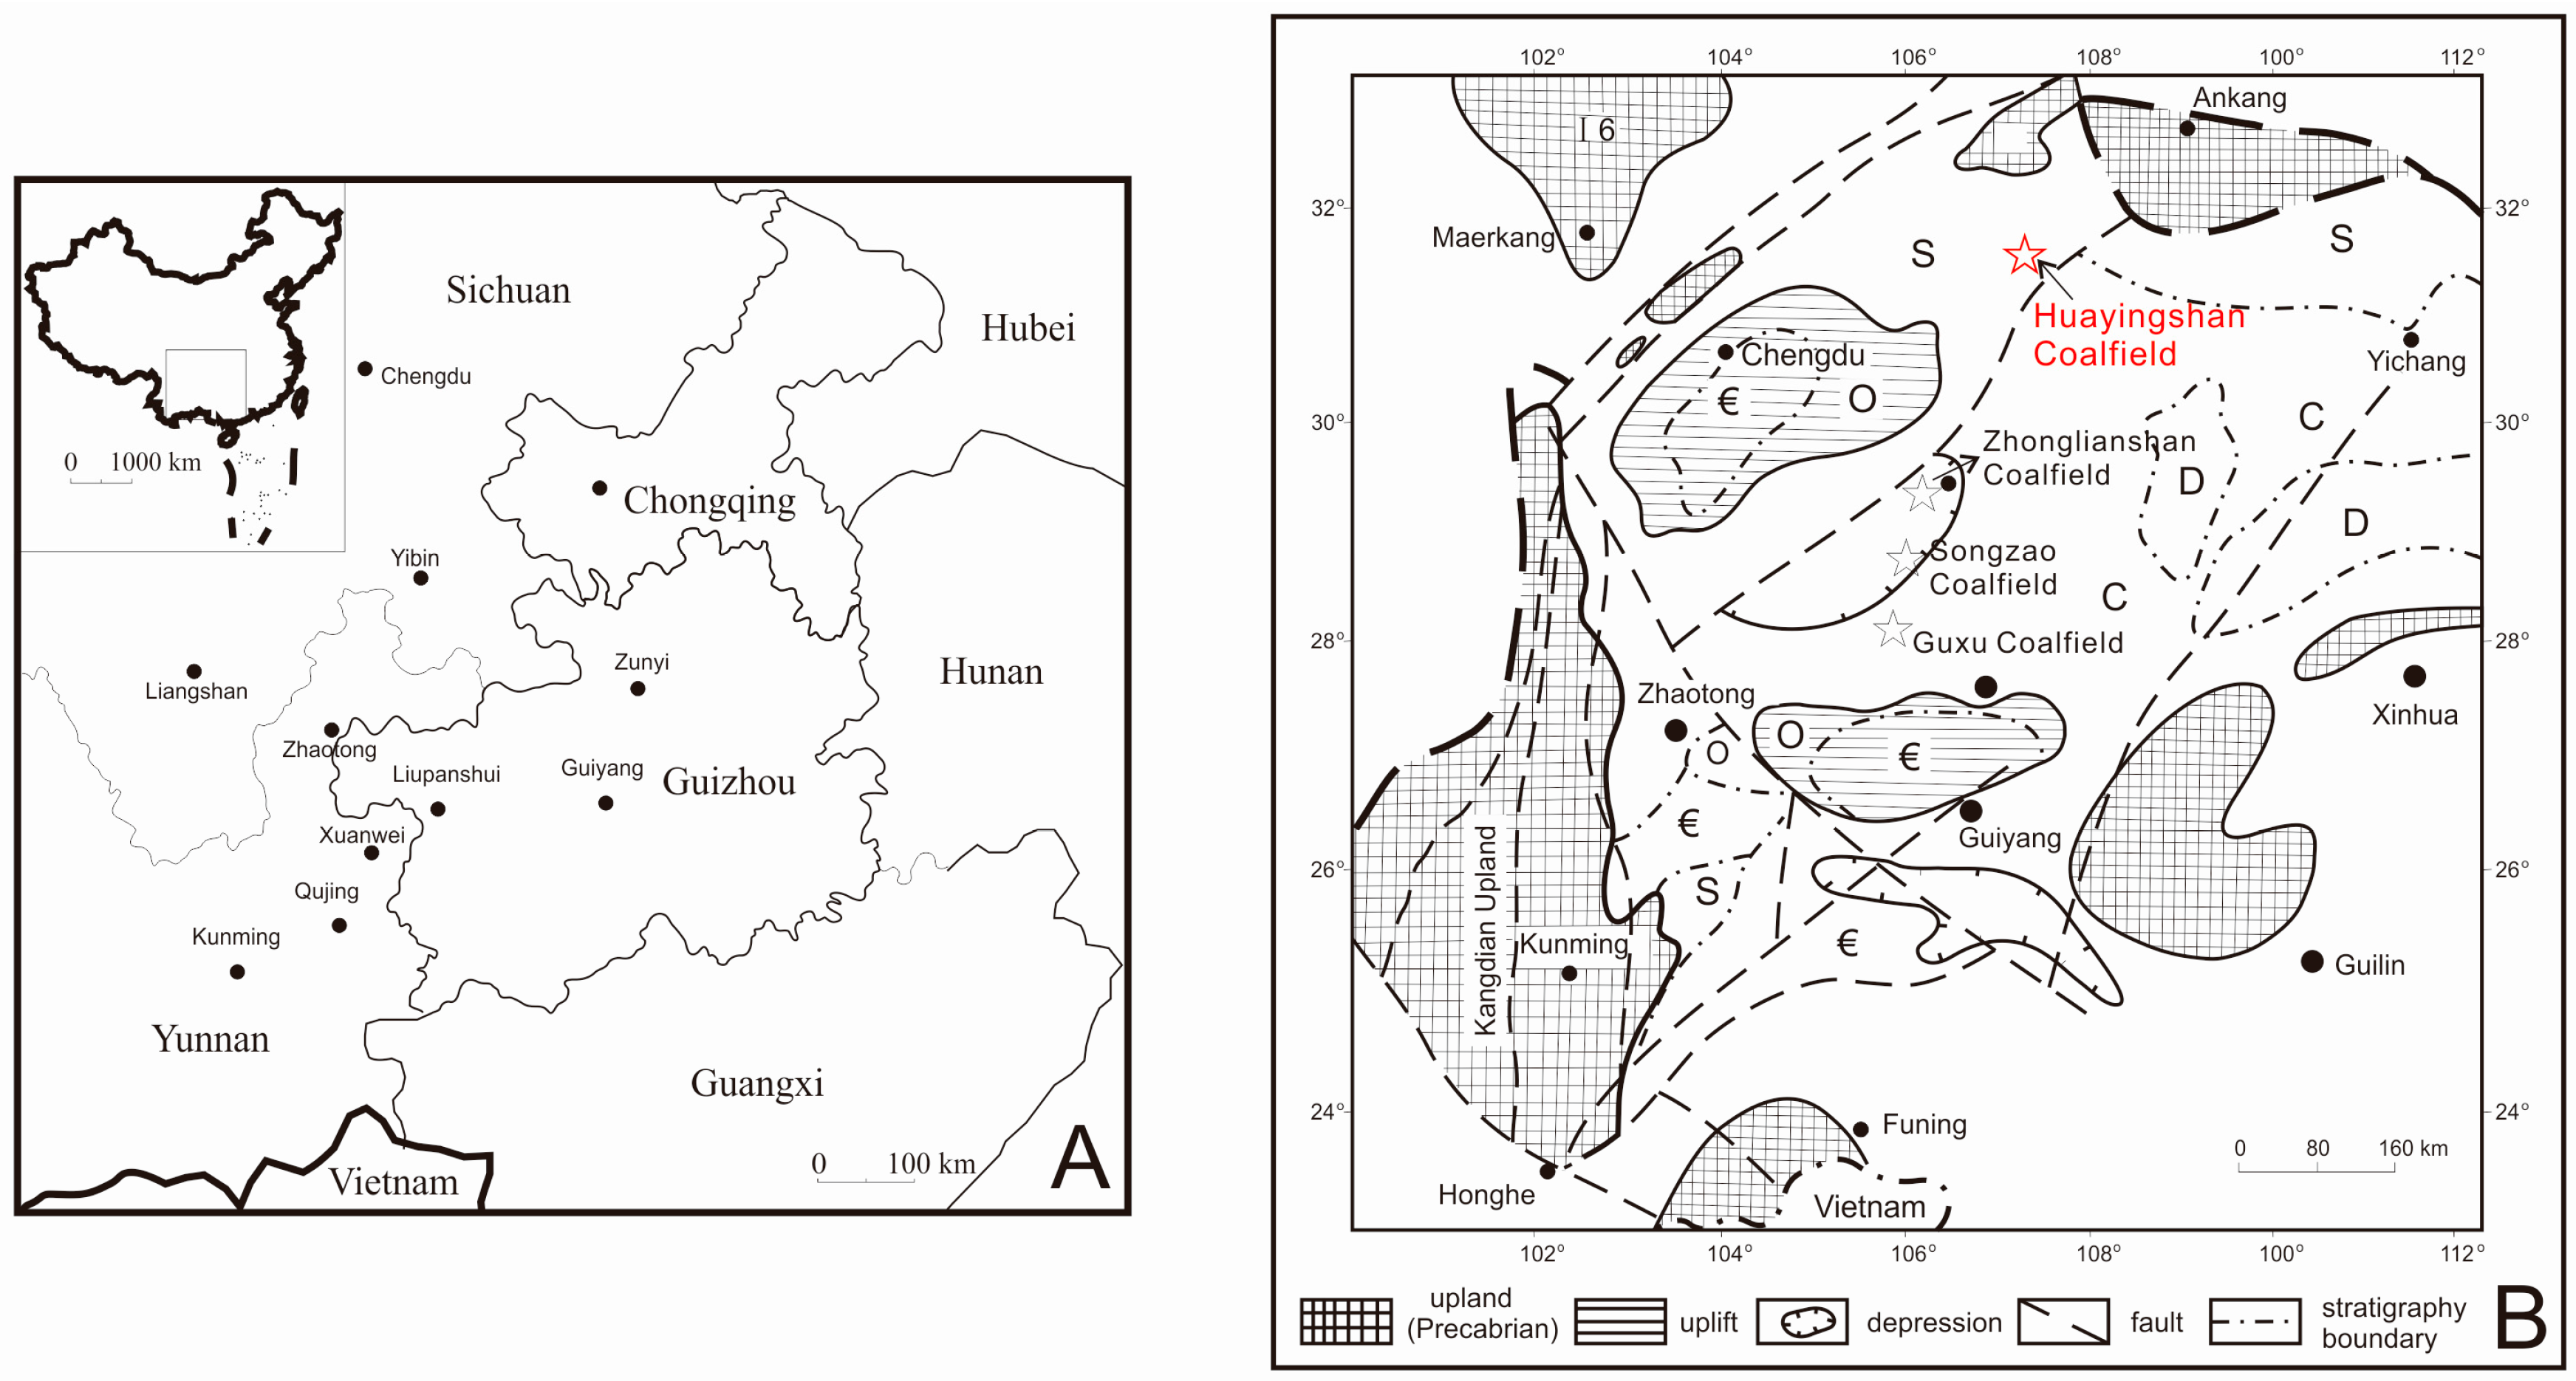
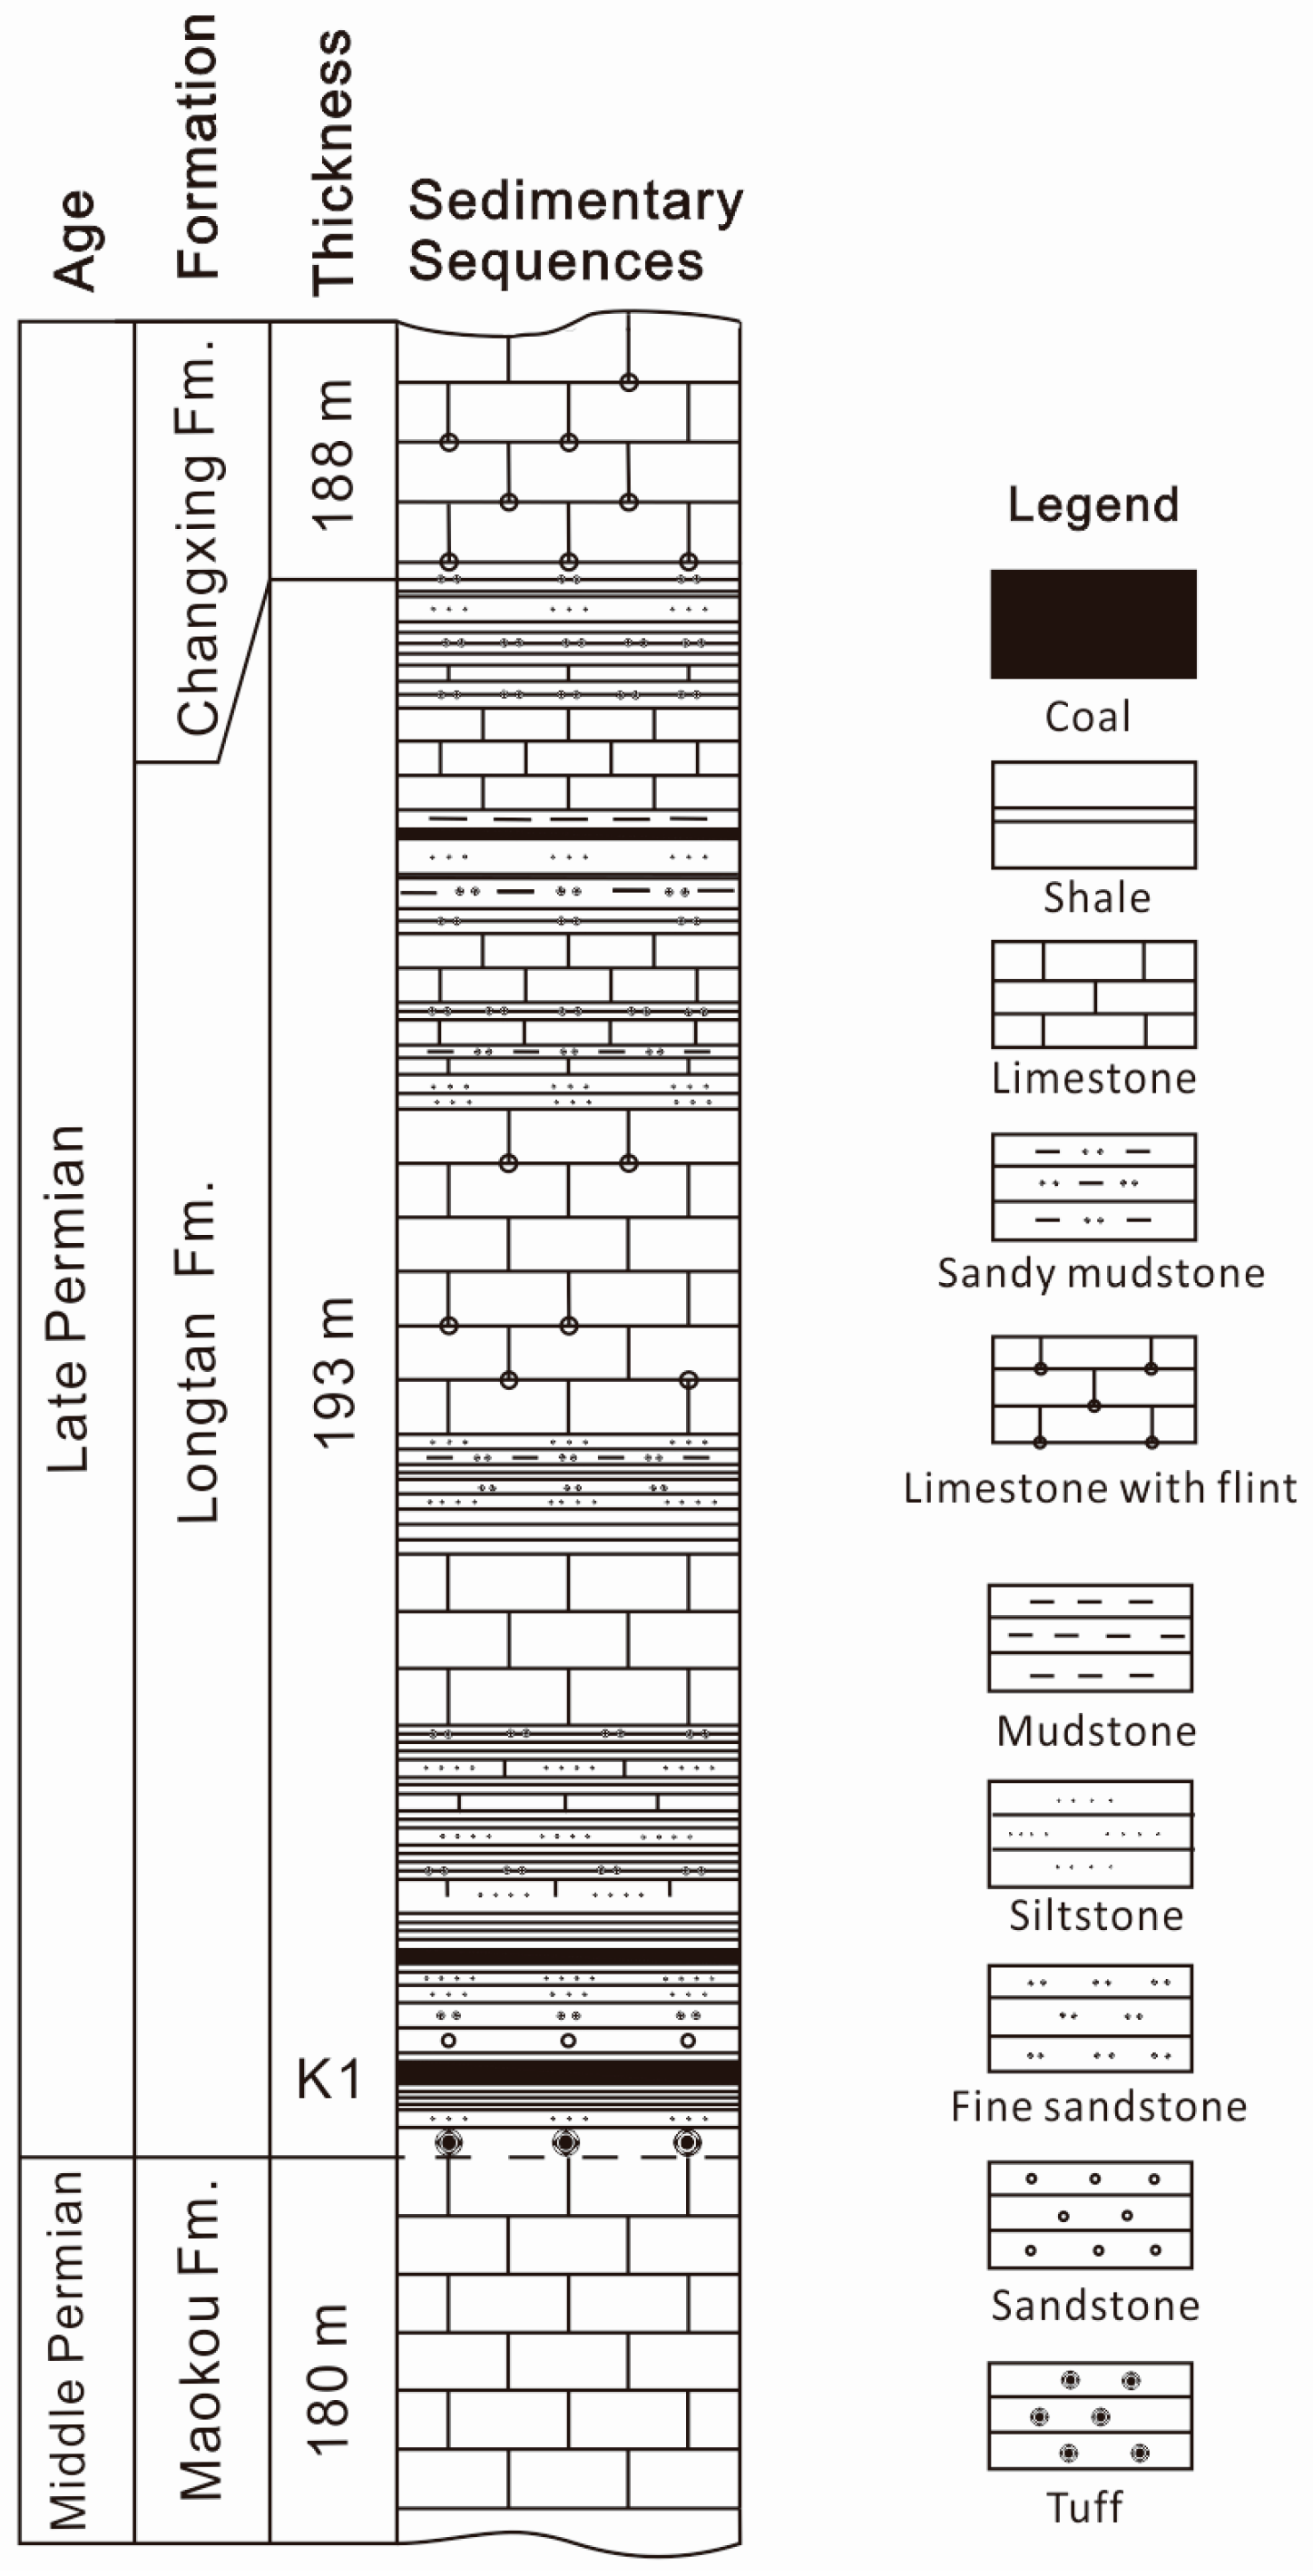
2. Geological Setting

The Huayingshan Coalfield is located in the southeastern Sichuan Province, SW China (Figure 1). The coal-bearing sequences of the coalfield are Lopingian Longtan Formation (Figure 2), which is mainly composed of flint-bearing limestone, mudstone, siltstone, sandstone and 2–3 coal seams. The lowermost coal seam in the Huayingshan Coalfield, which is indexed as K1, is also well developed in the Lopingian strata of other coalfields in SW China. For example, the K1 coal seam of the Huayingshan Coalfield is correlated to the No. 25 coal seam in the Guxu Coalfield and the No. 12 coal seam in the Songzao Coalfield (Figure 1).
A tuff layer with a thickness of mostly 2–5 m, light-grey or light-grey-white in color, lies at the lowermost level of the Longtan Formation in the Huayingshan Coalfield. This tuff is locally named as “bauxite” in the field lithologic descriptions. The tuff bed is disconformably underlain by the Maokou Formation, which is a limestone unit of Guadalupian age. The Longtan Formation is conformably overlain by limestones of the Changxing Formation in the studied area. The Changxing Formation is in turn overlain by the Triassic sediments (the Feixianguan Formation).
A regression, related to the so-called Dongwu Movement, which is a regional uplift event in SW China at the late Guadalupian age, exposed the Yangtze Block and resulted in a depositional hiatus. Subsequently, the elevated Maokou Formation limestone was subjected to intensive erosion. A mafic volcanic eruption then occurred, and volcanic ash fell on to the eroded surface of the Maokou Formation [13].
Extensive transgression, occurring probably during or after the main Lopingian eruption phase of the Emeishan basalts [3], resulted in the thick carbonate and siliciclastic deposits of the Xuanwei and Longtan Formations in eastern Yunnan and western Guizhou, respectively. These strata unconformably overlie the Emeishan Basalts, except in local areas of eastern Chongqing and western Guizhou, where the Longtan Formation directly rests on the erosional surface of the Maokou Formation.
The Lopingian coal-bearing sequences in SW China were deposited within a range of facies spanning from fluvial, through continental-marine transitional, to marine carbonate platform environments [13]. According to Dai et al. [4], before the deposition of the K1 coal seam in the Huayingshan Coalfield, the paleogeographic environment of the area was mainly a tidal flat. After the accumulation of the peat of K1 coal seam, transgression occurred in the eastern coalfield [13], and the studied area was again mainly occupied by a tidal flat environment [4].

3. Samples and Analytical Techniques

Twenty argillized tuff bench samples were collected from a working surface of the Lvshuidong mine, Huayingshan Coalfield. The tuff bed is generally massive bedding, light-grey or light-grey-white in color, with a conchoidal fracture and a soapy feel. The total sampled thickness of the profile is 2 m, 10 cm for each bench sample. These samples are named 1 to 20 from top to bottom. Due to the underground working condition, the top and bottom parts of the tuff bed were not accessible and thus not sampled.
Each sample was also ground to fine powder (about 200 mesh) and split into representative portions for mineralogical and geochemical analyses. The fine powders of the samples were subjected to X-ray diffraction (XRD) analysis, using a Rigaku D/max-2500/PC powder diffractometer with Cu-Kα radiation and a scintillation detector. Mineralogical compositions were quantified from the X-ray diffractograms of tuff samples using the Rietveld-based Siroquant™ software developed by Taylor [14]. More details related to the use of the Siroquant technique for coal and non-coal materials from coal-bearing sequences are given by Ward et al. [15], and many studies have indicated the reliability of this technique (e.g., [15,16,17]).
Percentages of major element oxides (SiO2, TiO2, Al2O3, Fe2O3, MgO, CaO, MnO, Na2O, K2O and P2O5) in the ashes (815 °C) of the powder samples were determined by X-ray fluorescence spectrometry (XRF; ARL ADVANT'XP+). Concentrations of most trace elements in the samples were determined by inductively-coupled plasma-mass spectrometry (ICP-MS). Prior to ICP-MS analysis, the samples were subjected to microwave dissolution in a mixed acid. For each sample (50 mg), the digestion reagent was a mixture of 2 mL 65% HNO3 and 5 mL 40% HF. Description of the ICP-MS techniques for determination of trace elements in rock samples have been discussed by Dai et al. [18]. Fluorine in the samples was determined using a pyrohydrolysis/fluoride ion-selective electrode technique. Mercury in the samples was analyzed using a Milestone DMA-80 Hg analyzer (Milestone, Milan, Italy); the detection limit of Hg is 0.005 ng, and the linearity of the calibration is in the range 0–1000 ng.
Thin-sections and/or polished sections were also made from chips of selected samples. Thin-sections were subjected to petrographic analysis using a Leica DM4500P polarizing microscope equipped with Leica LAS digital imaging software. The minerals in the polished sections were studied using a field emission-scanning electron microscope (FE-SEM, FEI Quanta™ 650 FEG, FEI, Hillsboro, OR, USA), equipped with an EDAX energy-dispersive X-ray spectrometer (EDAX, Mahwah, NJ, USA). Prior to the SEM examination, specimens were coated with carbon to avoid charging effects and then mounted on an aluminum stub, with carbon tape being used to ensure good electrical contact between the specimen and the stub.

4. Results and Discussion

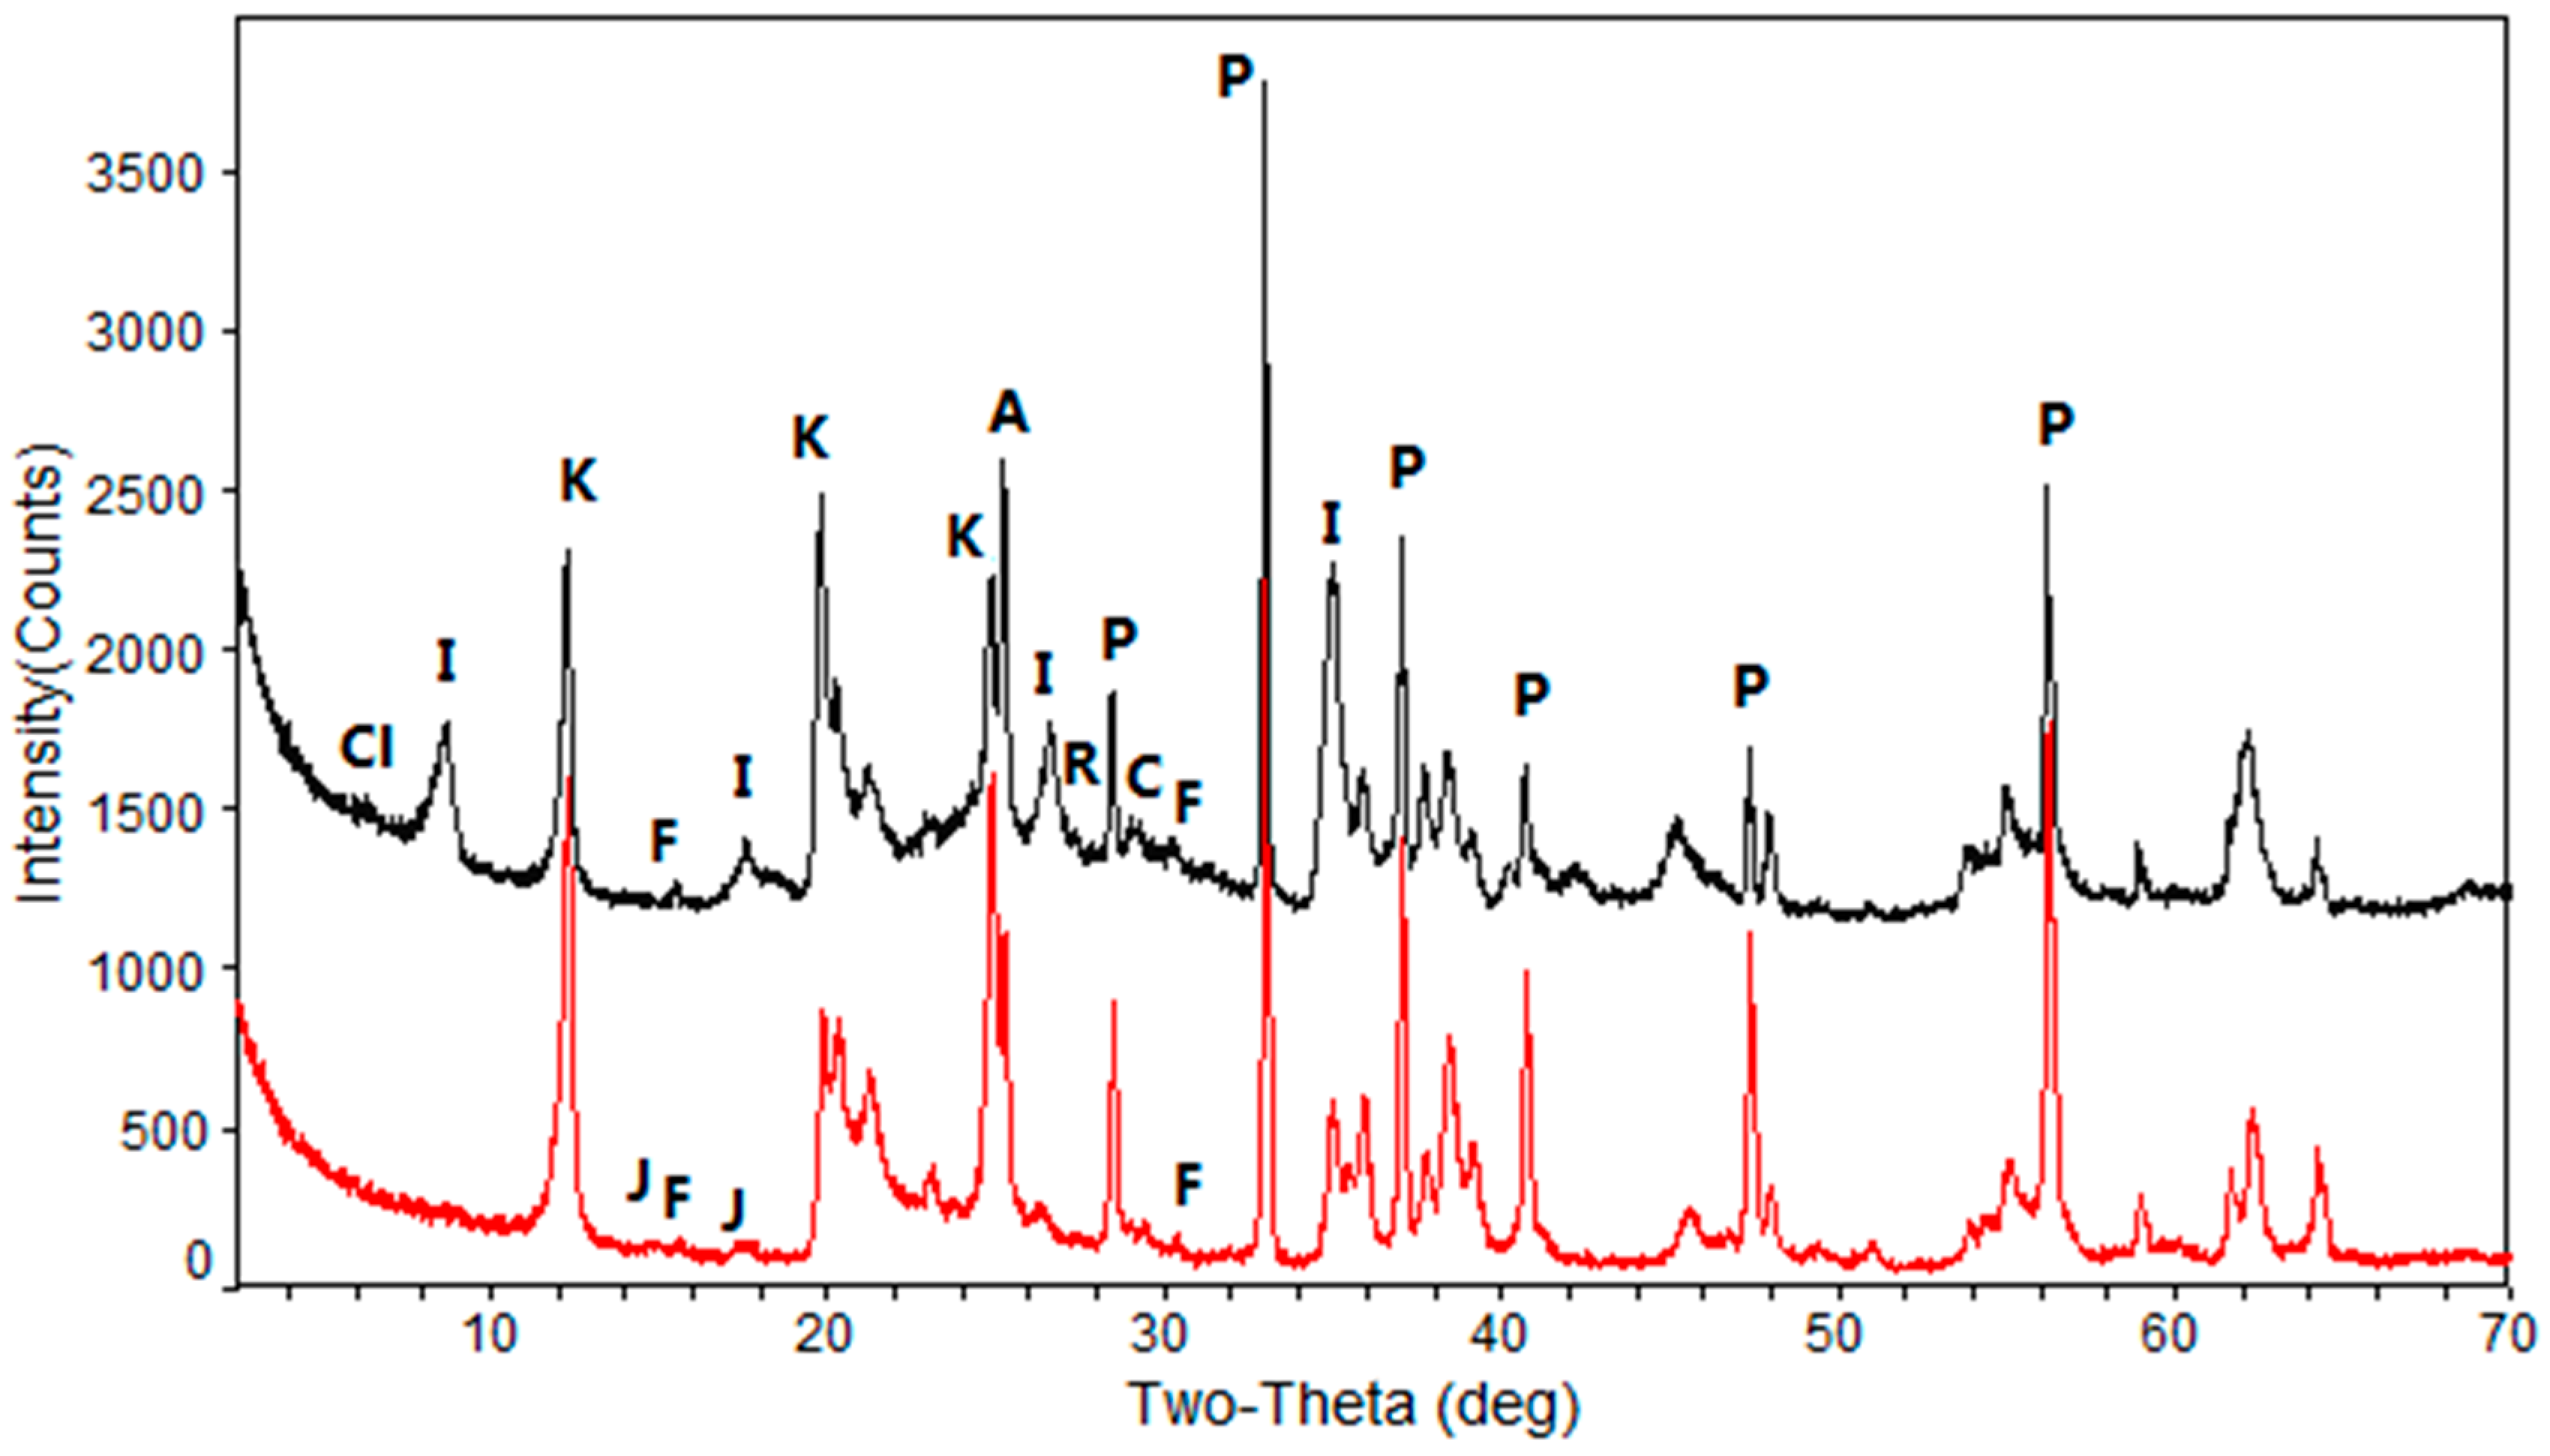
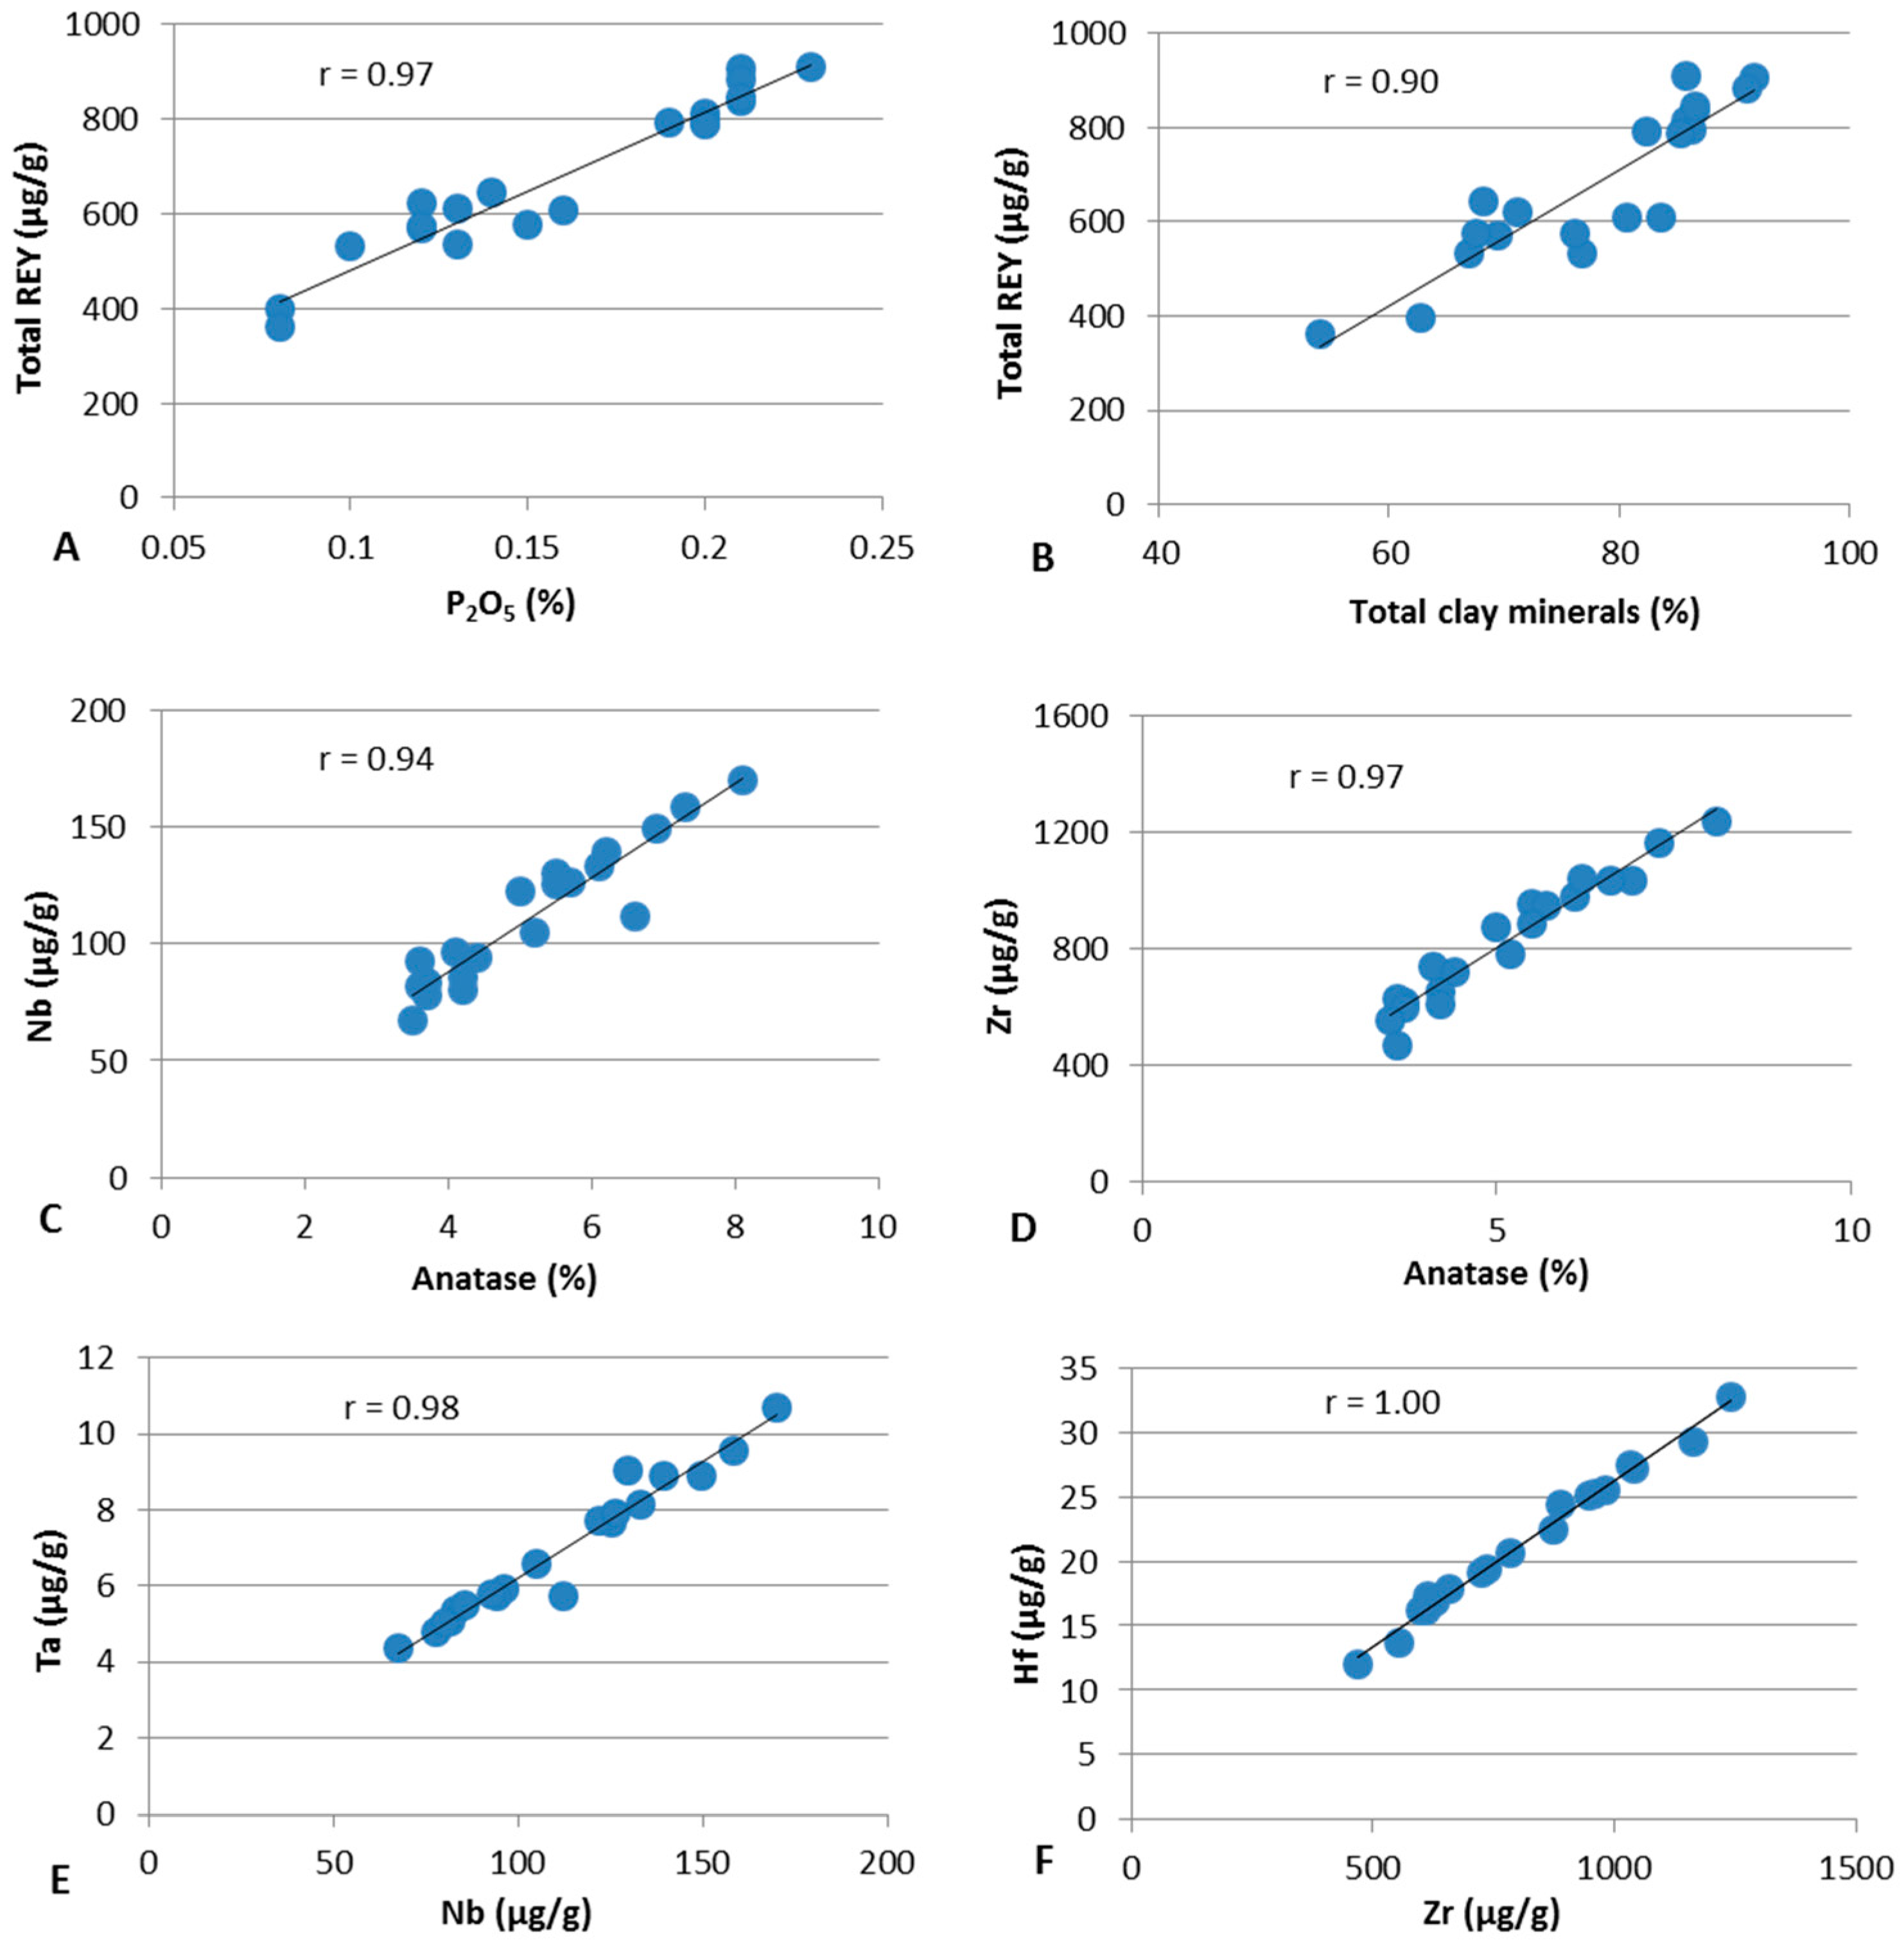
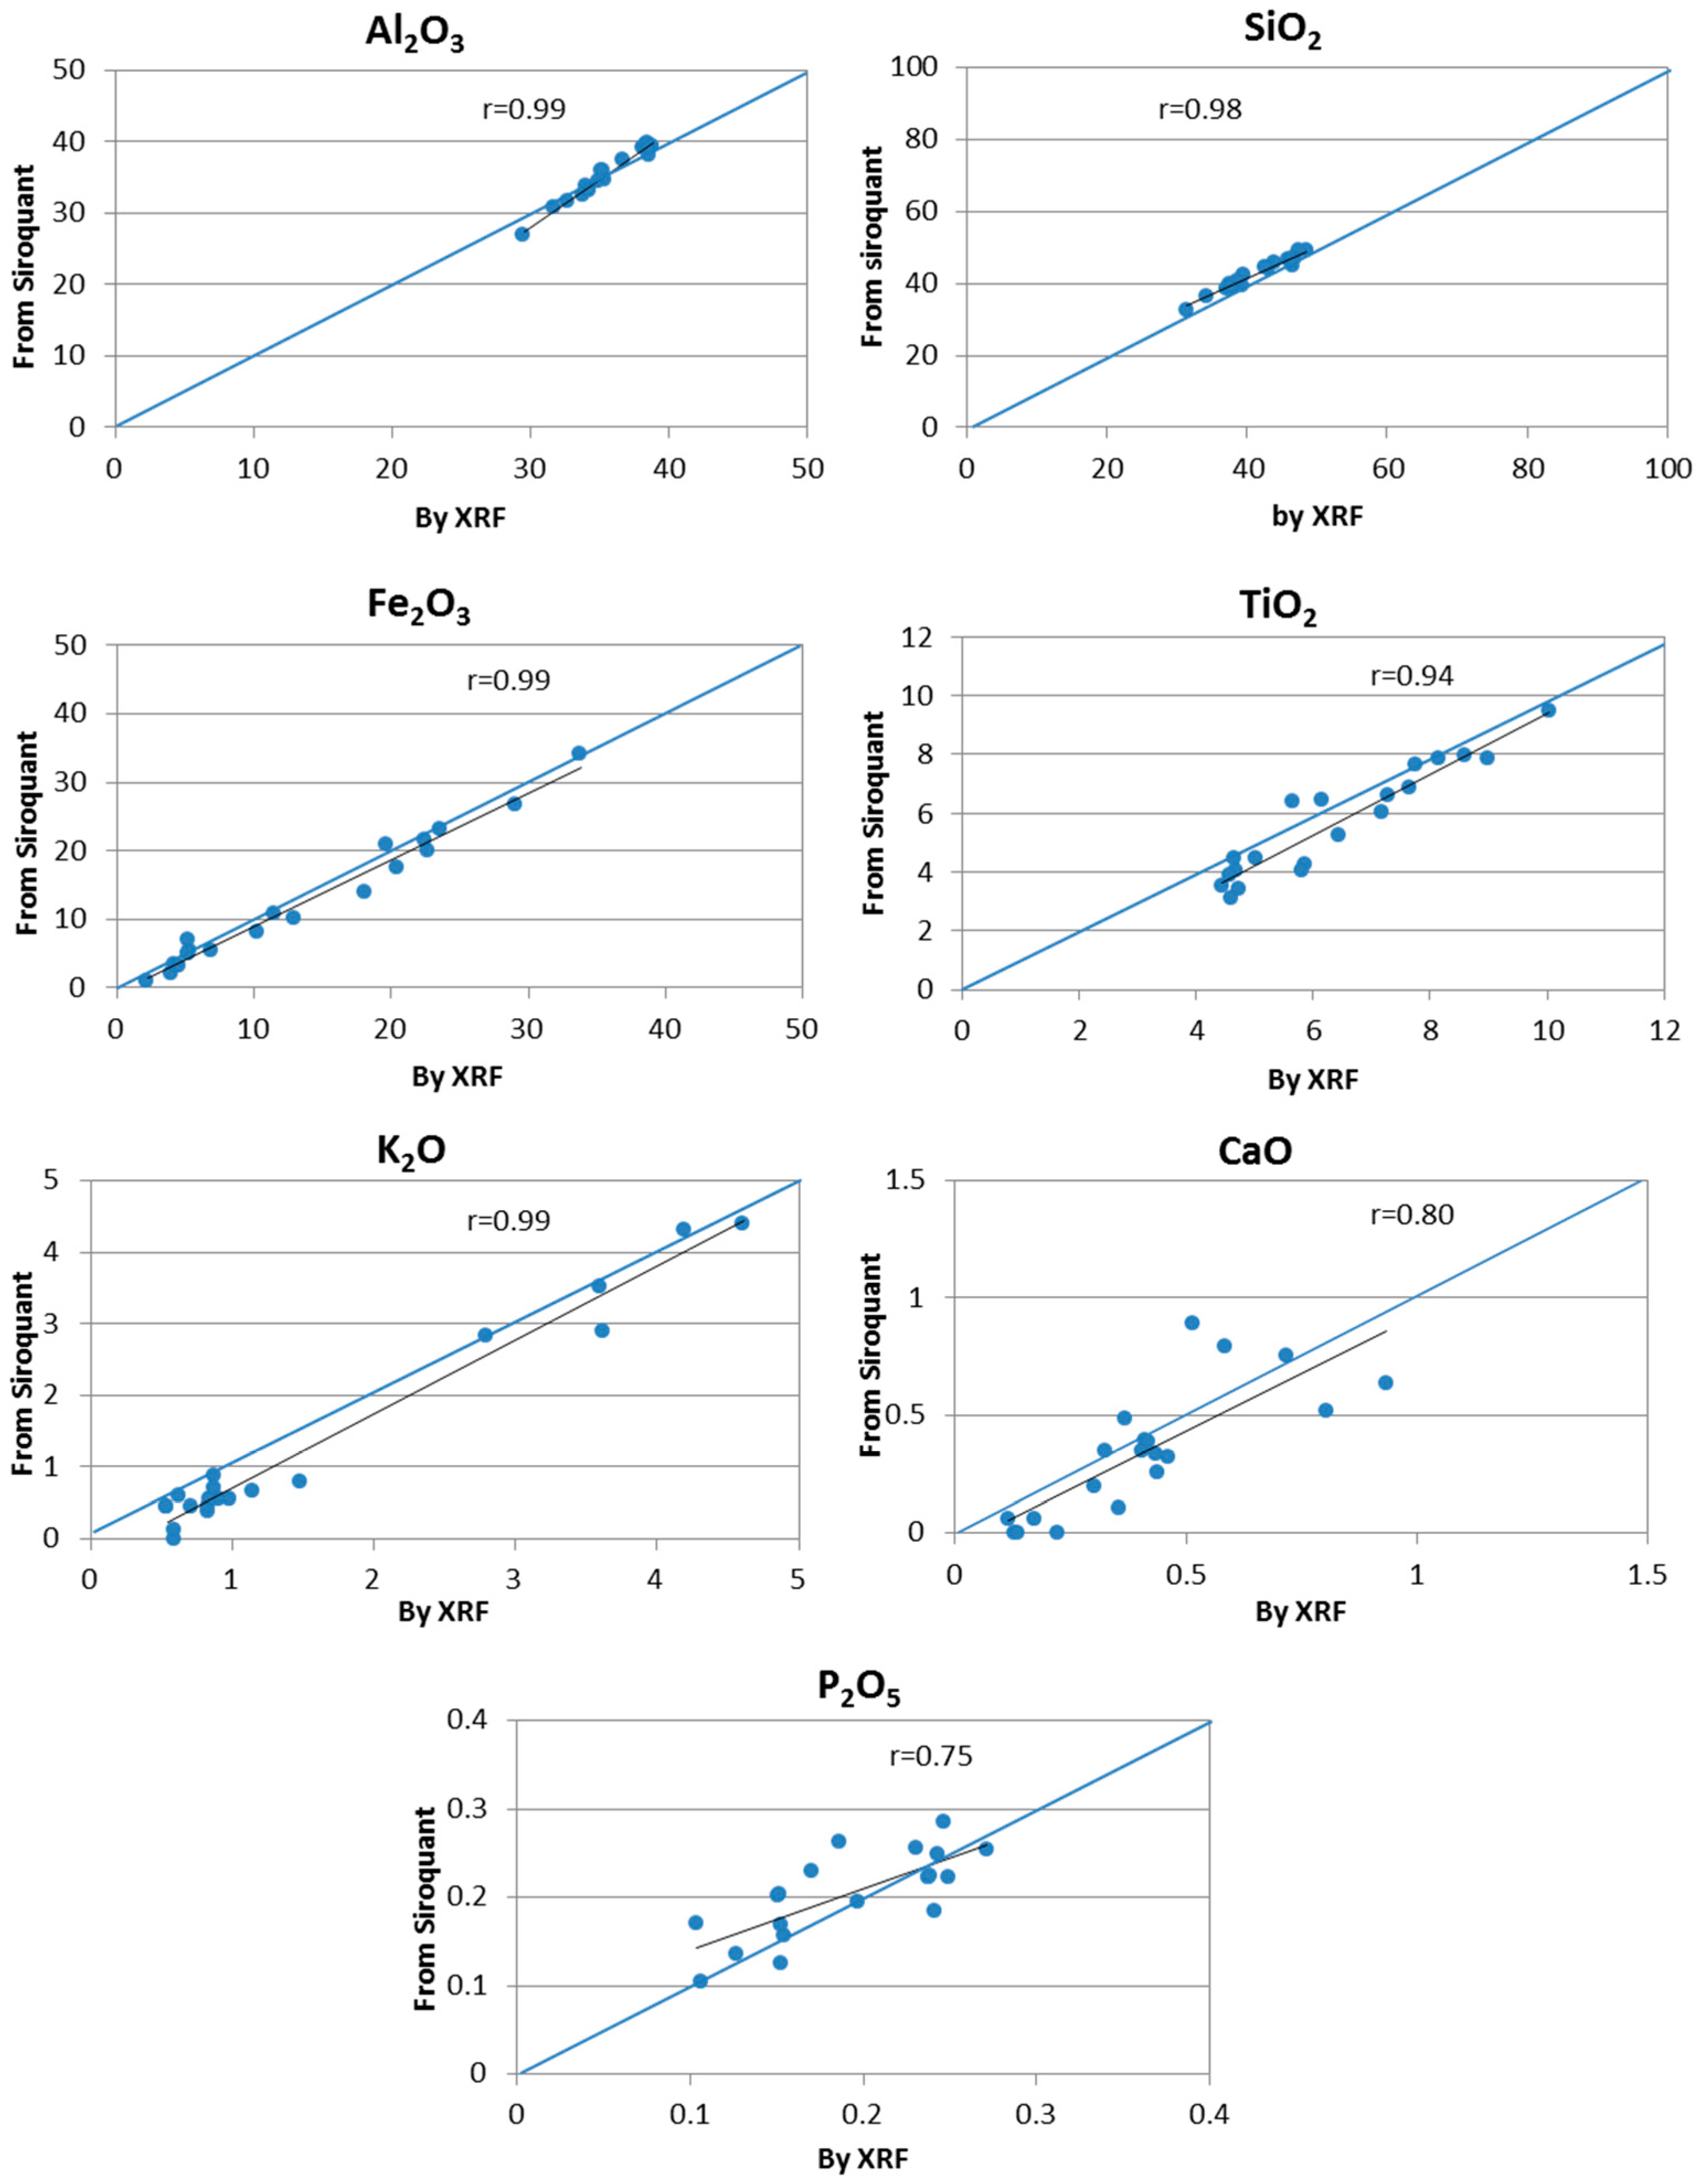
4.1. Comparison between Mineralogical and Chemical Data

Quantitative mineralogical results from XRD analysis and Siroquant interpretation for the tuff samples from the Lvshuidong mine are given in Table 1. Major element geochemical data of high temperature ashes (HTAs), based on XRF analysis, as well as trace element geochemical data are given in Table 2.
The relationship between the chemistry of HTAs and mineralogy was studied to check the reliability of the quantitative XRD data, following the calculation procedure described by Ward et al. [19]. The chemical composition was modified for each sample by deducting the CO2 and H2O+ to derive an equivalent to an ash analysis. The actual chemical composition determined by XRF was also normalized to an SO3-free basis. The correlations of major oxides are shown in Figure 3.
The plots for Al2O3, SiO2 and Fe2O3 of the tuff samples show a high degree of correlation between the respective proportions from the XRD + Siroquant analysis and chemical data. This indicates that Siroquant gives consistent results for those major minerals (e.g., kaolinite, illite and pyrite) that contribute to the major element oxides in the analyzed rocks.
A relatively strong correlation is also observed for the plots of TiO2, K2O and P2O5, with all of the points being relatively close to the 1:1 diagonal line (Figure 3). This indicates that Siroquant also gives consistent results for those minor minerals (anatase and florencite). The plot for CaO shows a relatively broad scatter, with most of the points being under the equality line. This indicates that carbonate minerals are relatively underestimated by the quantitative techniques. Ca ions may also have been absorbed on clay minerals. Titanium may partially occur as a separate Ti-bearing phase (nano particles) precipitated in conjunction with kaolinite [20]. Such a phase is difficult to identify by XRD, which leads to an underestimation of TiO2 by XRD relative to the chemical analysis.

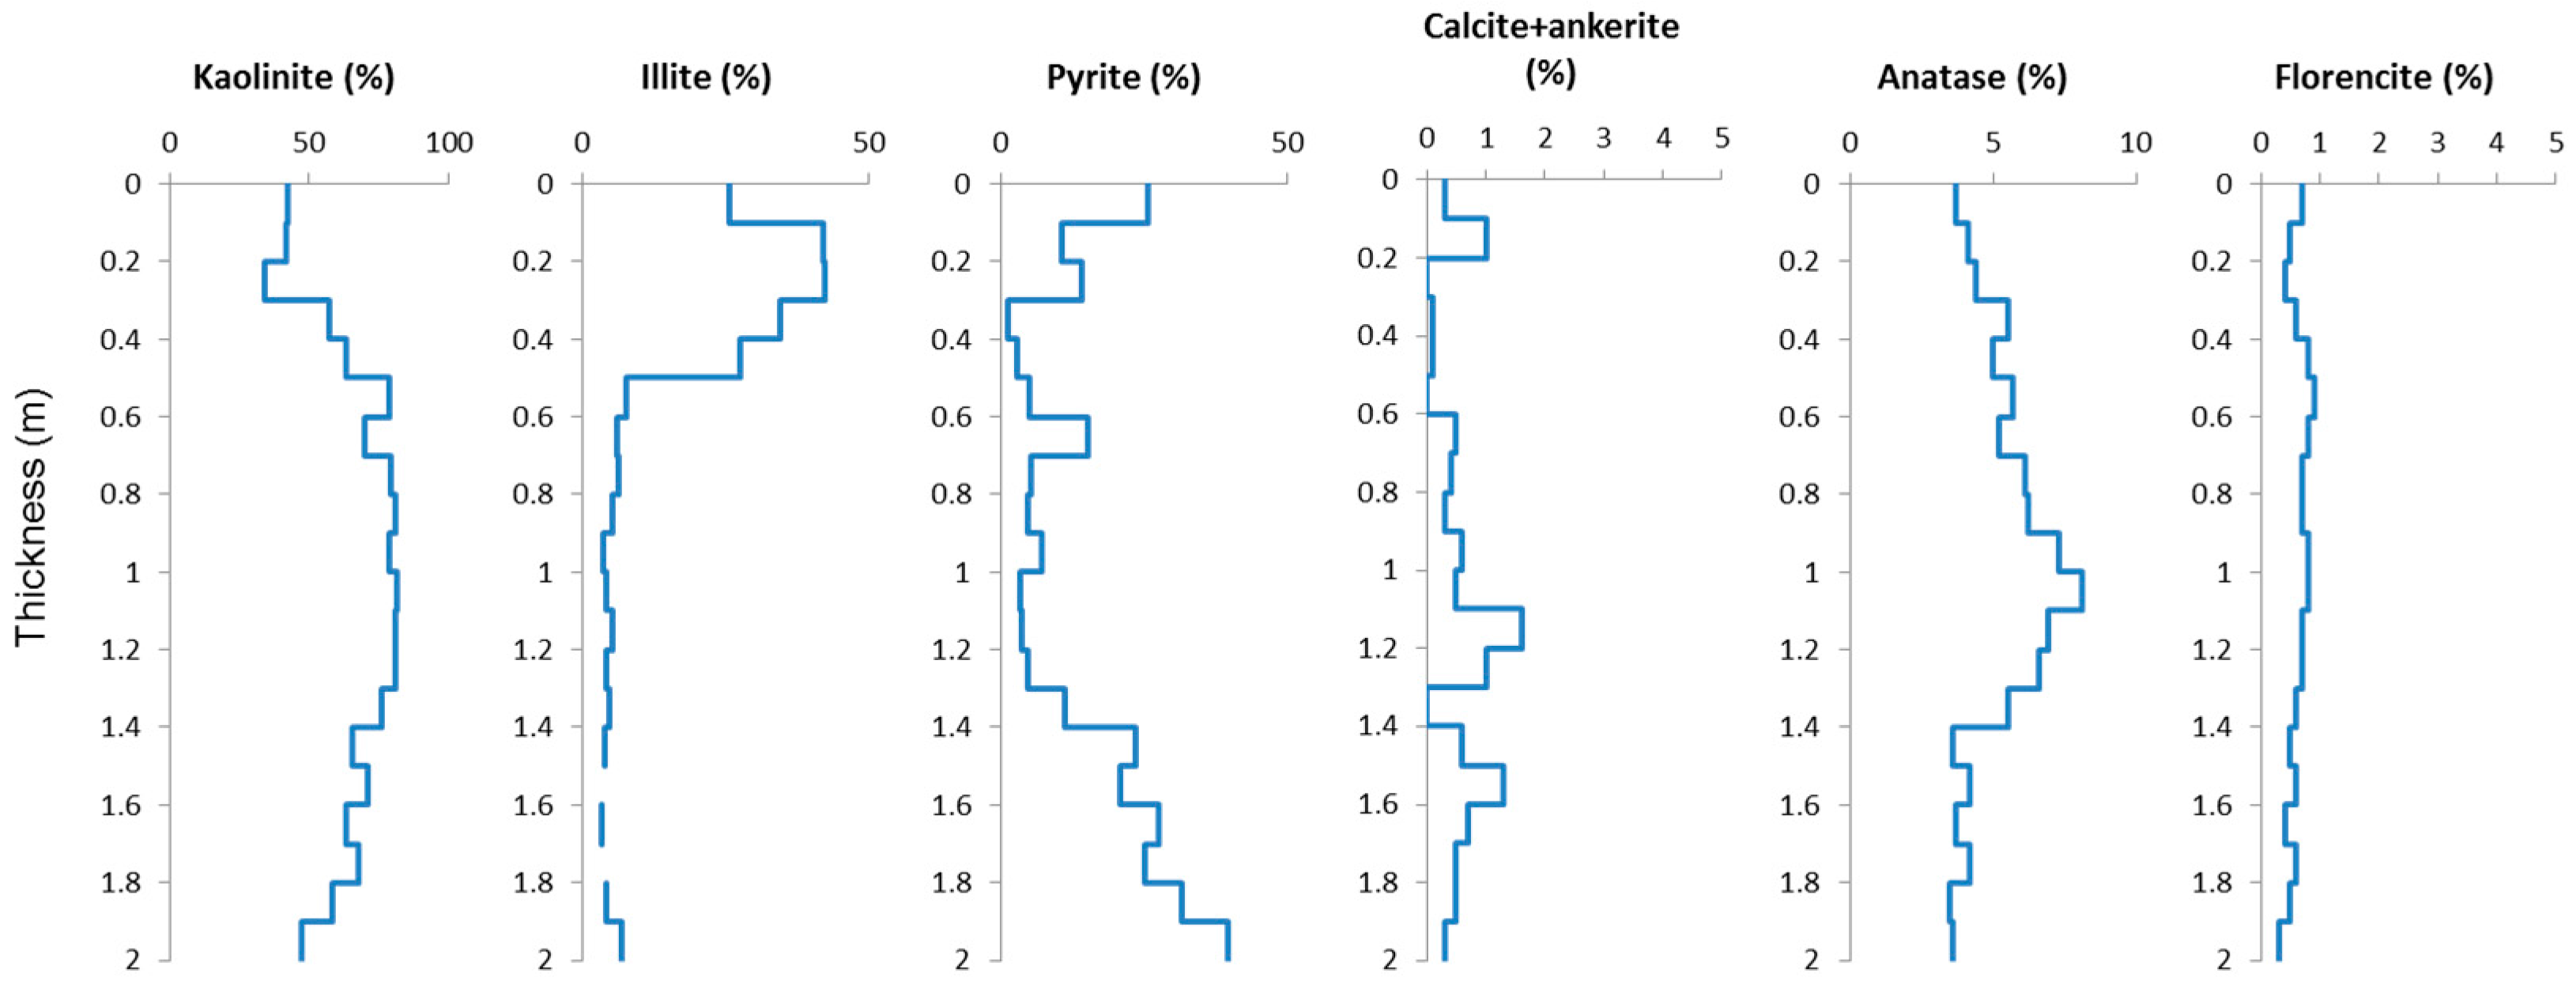
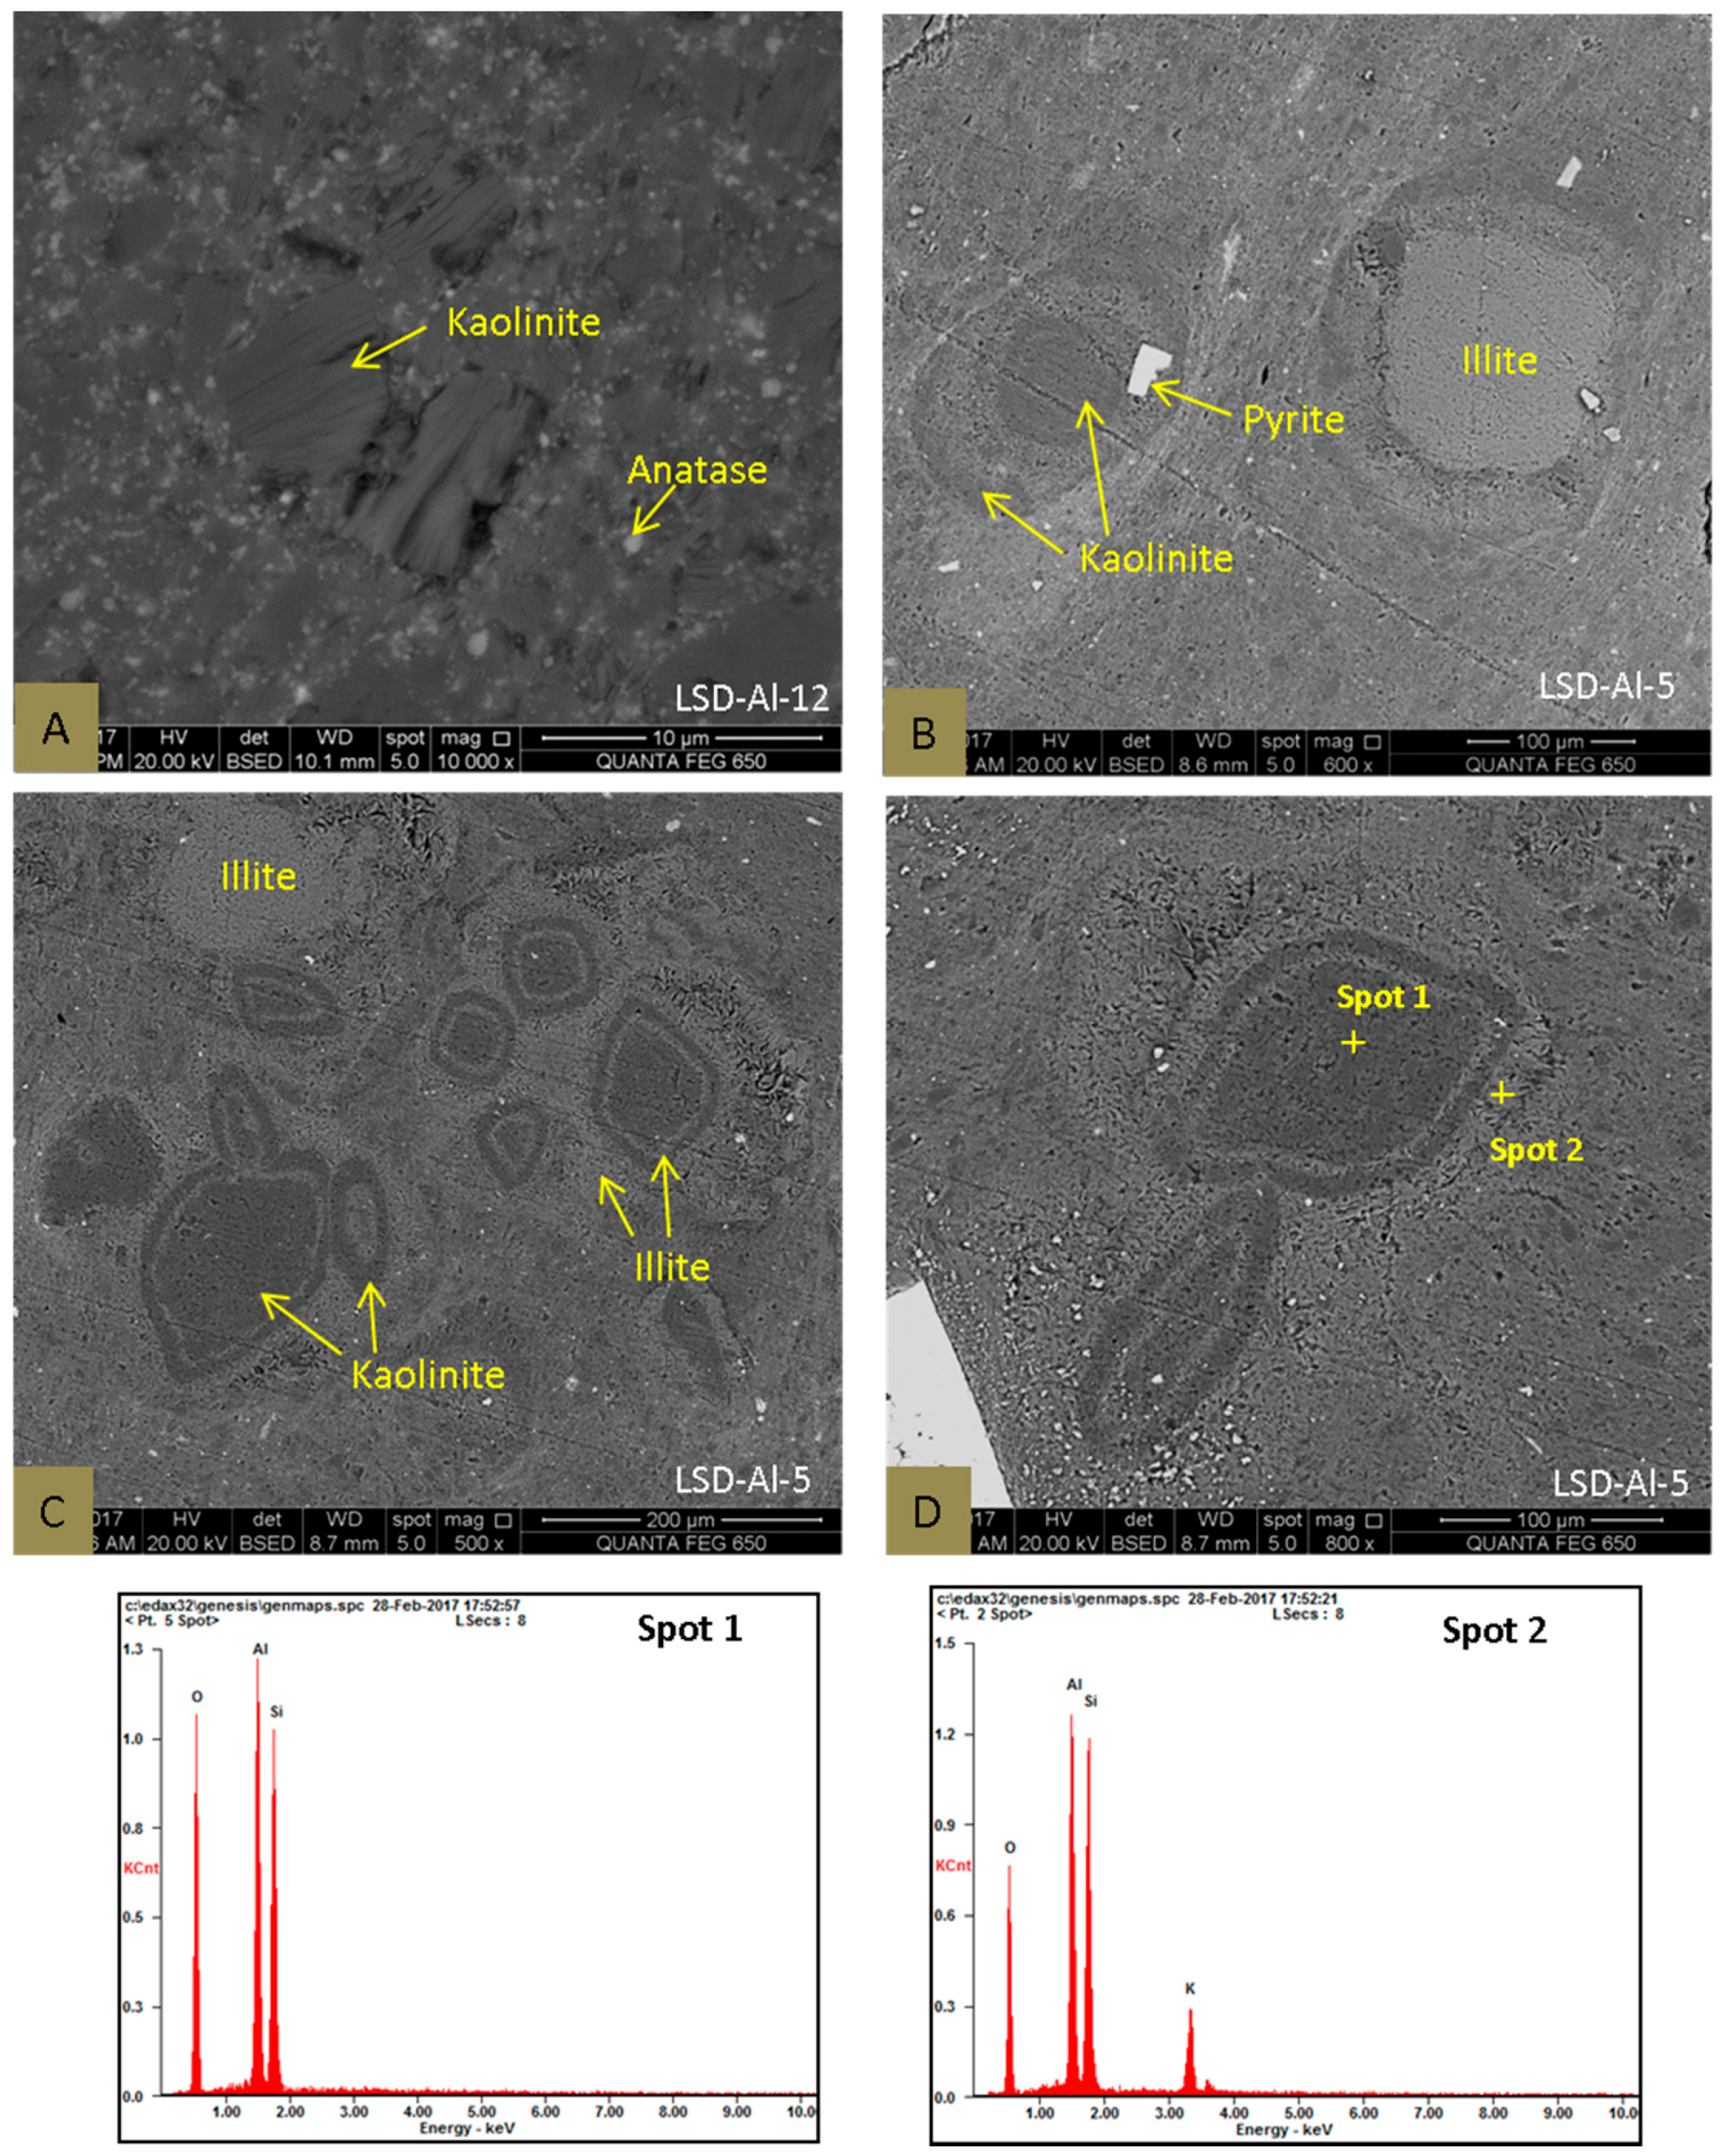
4.2. Minerals in the Samples

The mineral assemblage in the samples is dominated by kaolinite, varying proportions of illite and pyrite and small proportions of carbonates (calcite and ankerite), anatase, rutile, florencite, jarosite and bassanite. Figure 4 shows the XRD patterns of selected samples. Quartz is either below the detection limit or present only in a trace proportion. Figure 5 illustrates the vertical trends in abundance of different minerals in the tuff band. Vitroclastic texture is not evident in thin-sections, due to complete devitrification. Kaolinite and illite in the samples are products of devitrification and make up most of the rock groundmass. No other volcanogenic minerals (e.g., quartz, biotite or sanidine) were observed under the optical microscope or the SEM.

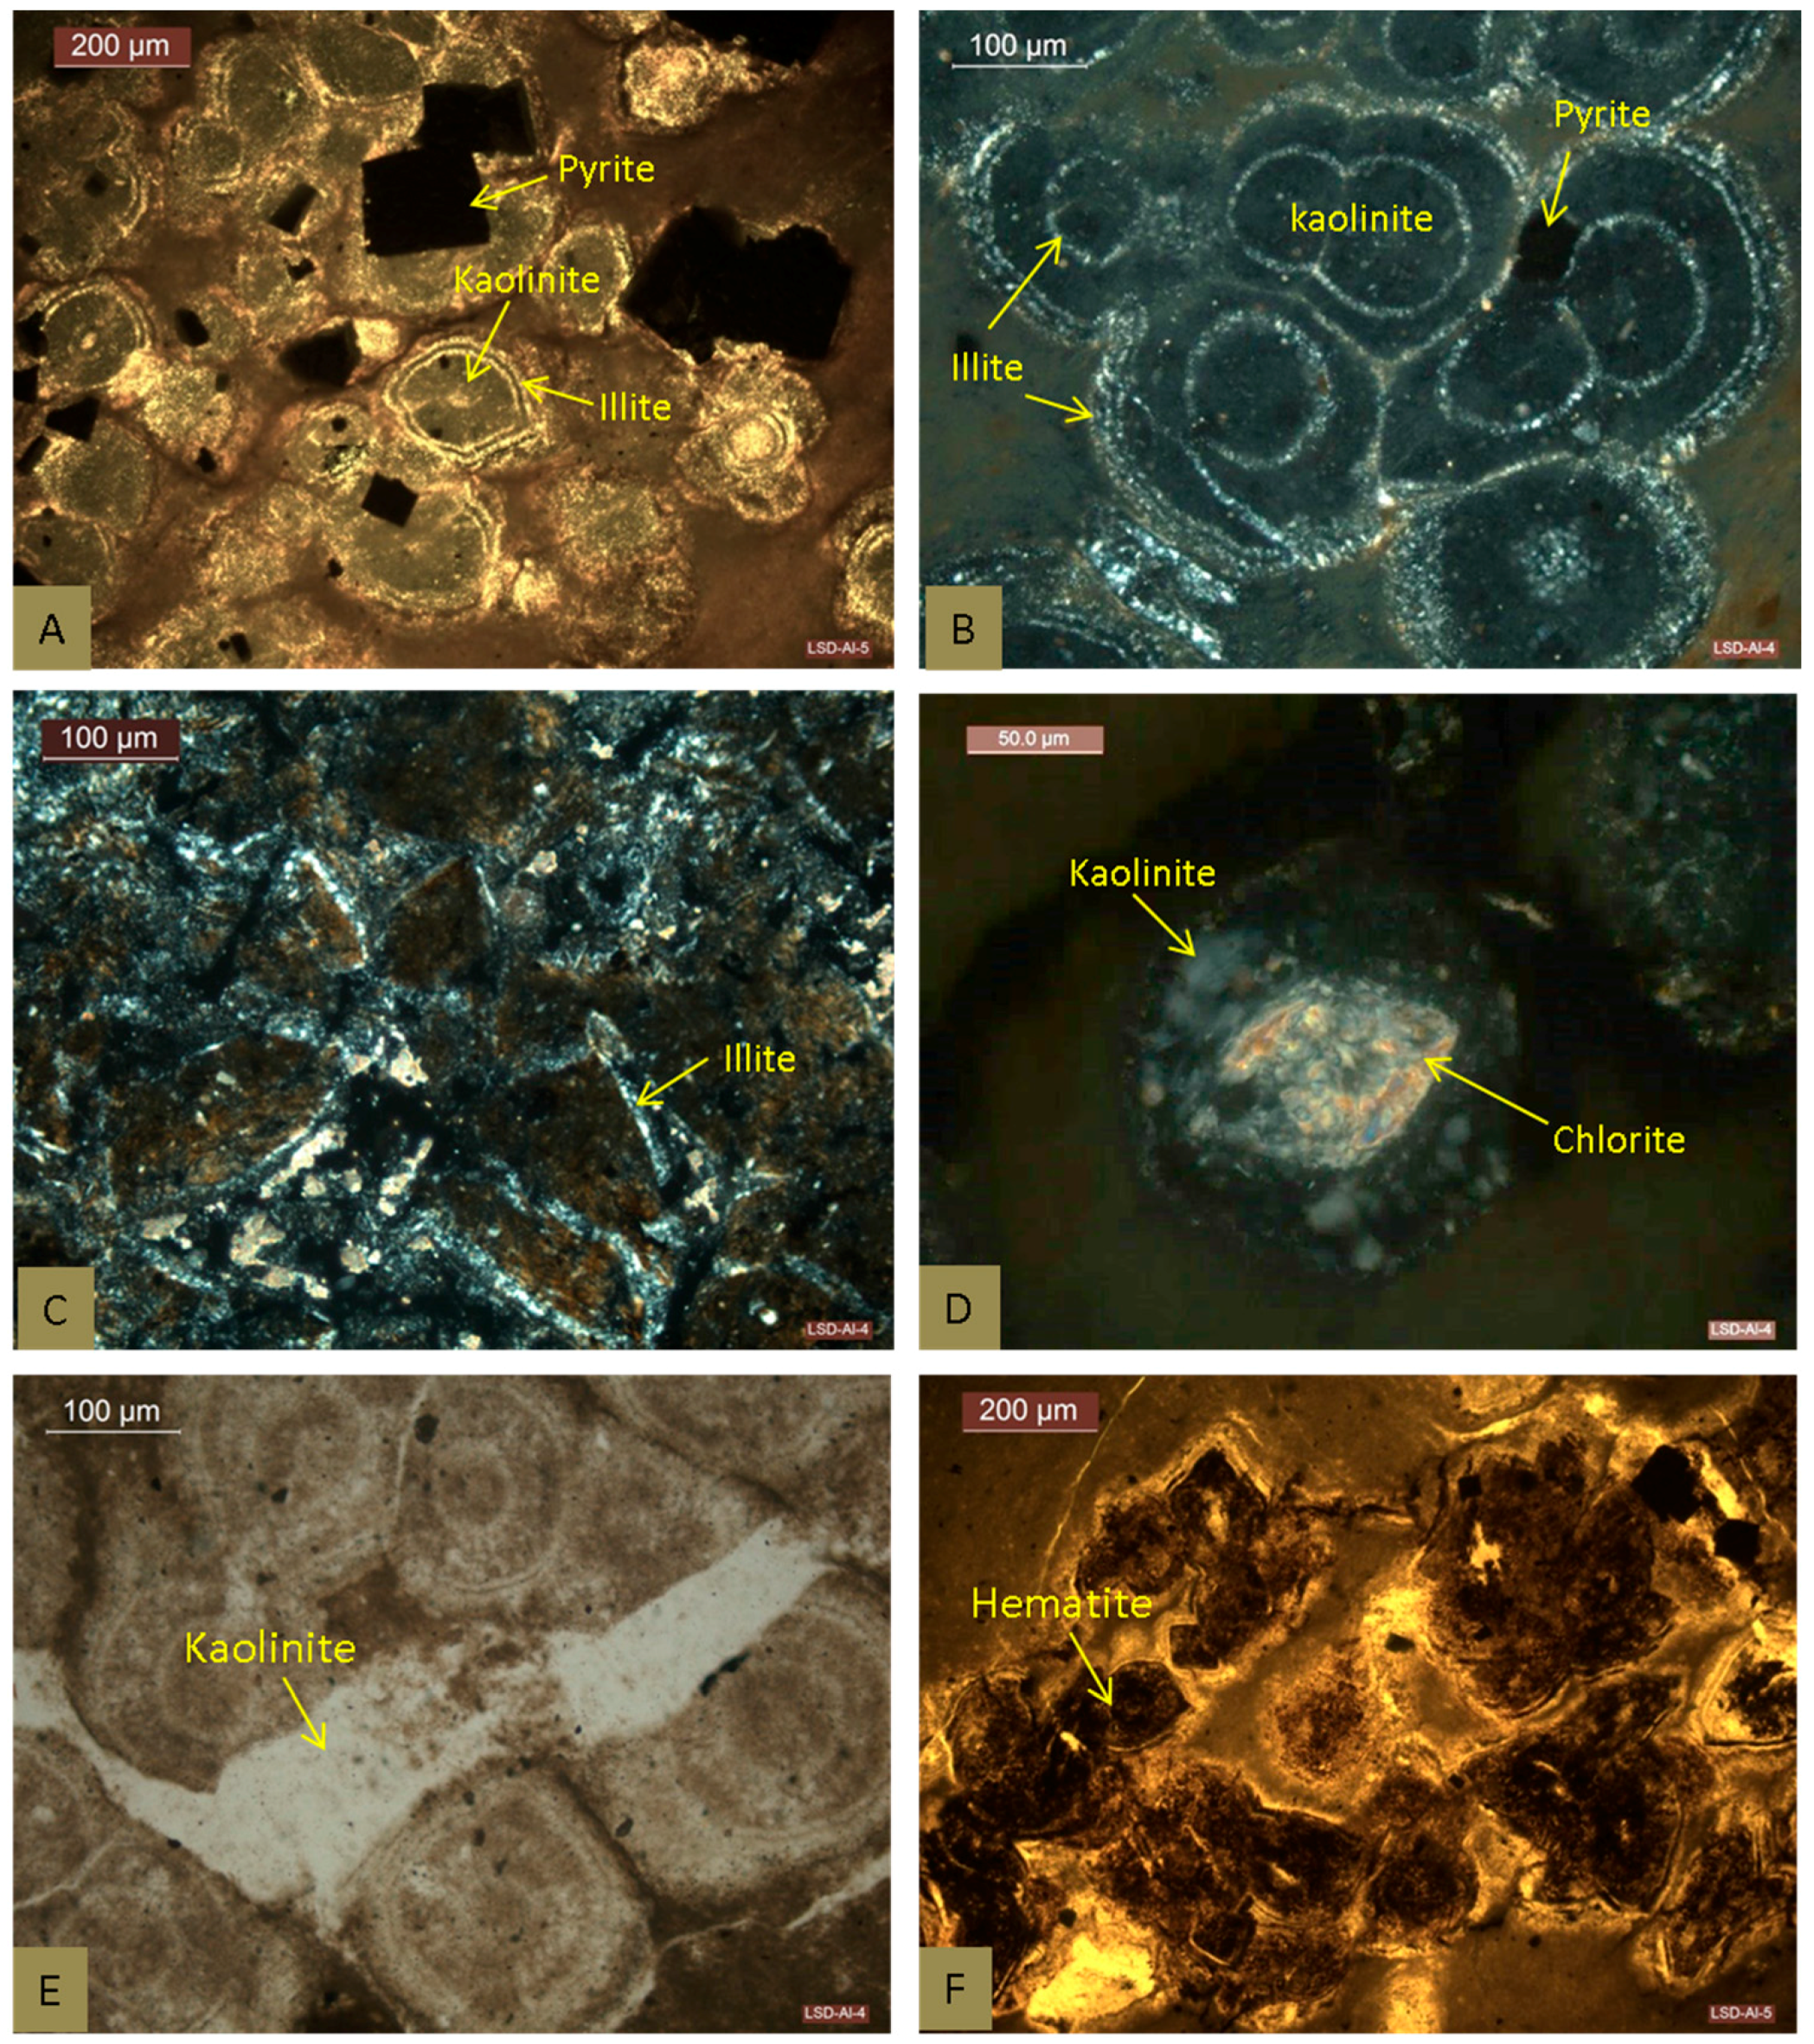
4.2.1. Clay Minerals
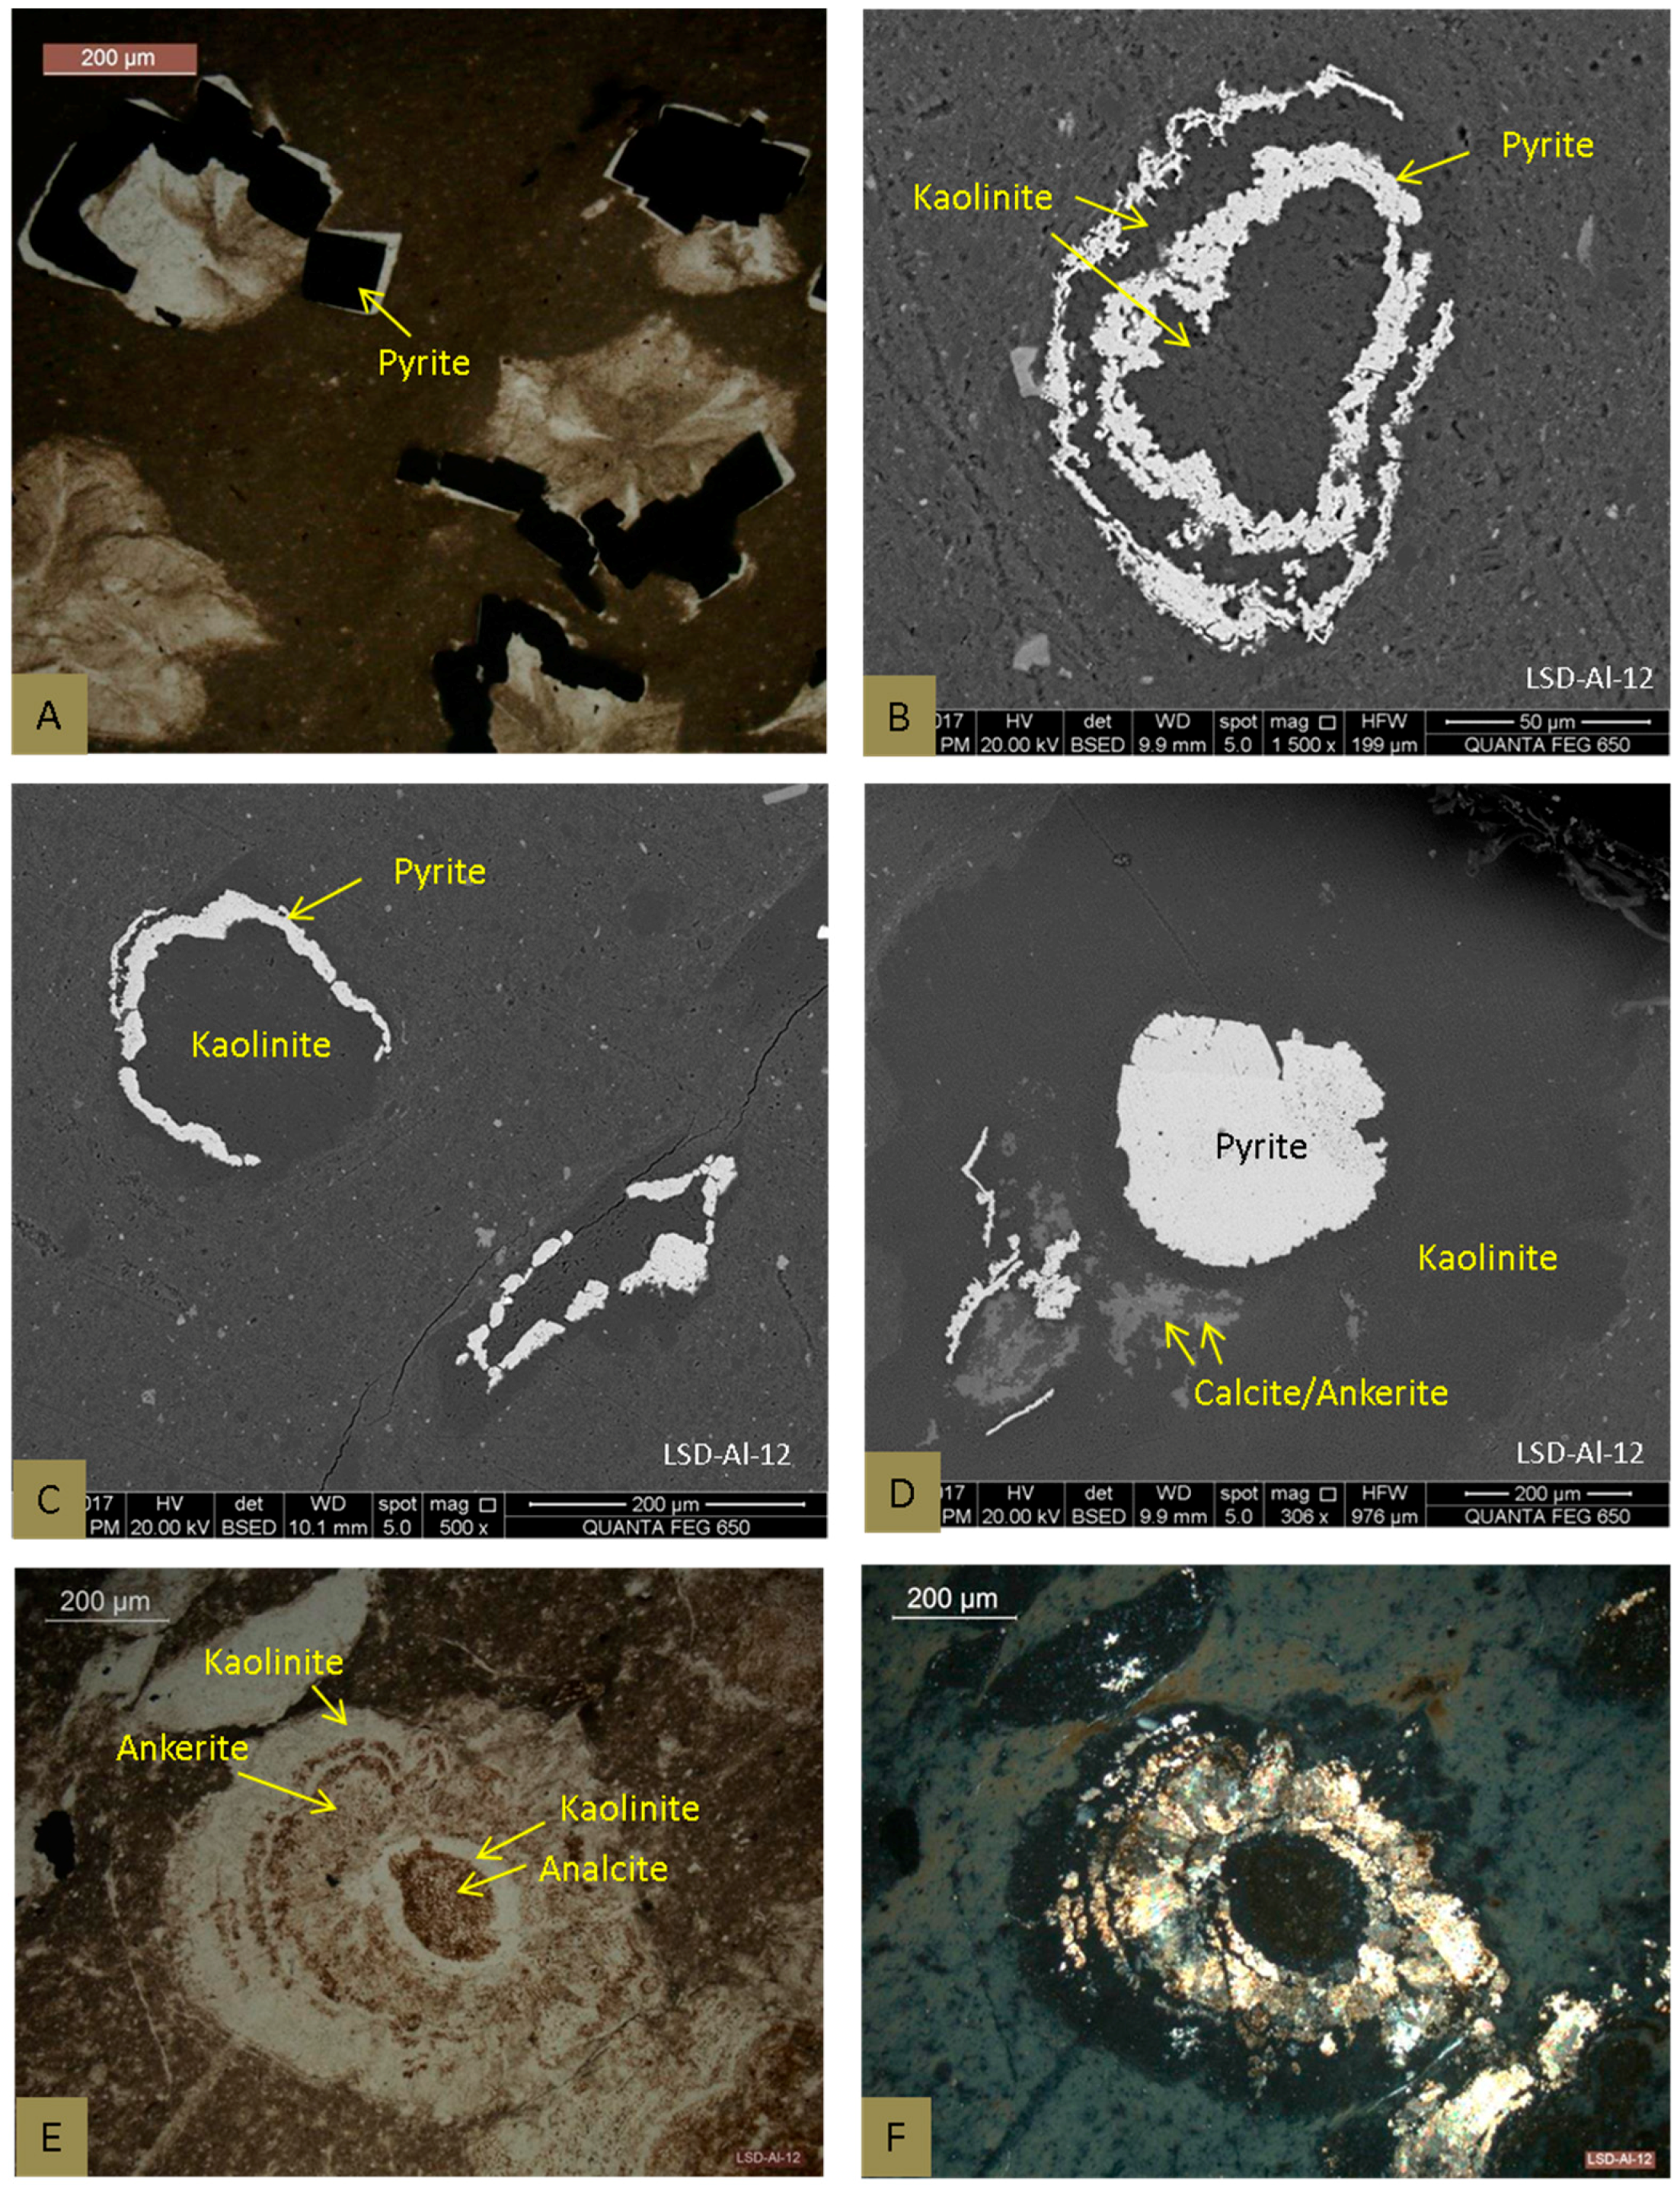
Kaolinite mainly occurs as groundmass (Figure 6 and Figure 7) and, to a lesser extent, as vermicular aggregates, which have probably formed after the biotite group (Figure 6A) and pumice clasts or micro-lapilli (chalazoidite) (Figure 6B–D). XRD patterns show a relatively poorly-ordered structure of the kaolinite in the samples, which reflects the fine poorly-crystallized kaolinite in the groundmass. Kaolinite veins (Figure 7E) also occur, indicating an epigenetic origin.
Illite occurs almost in all of the samples, but is relatively abundant in the samples from a few topmost samples of the profile. In those samples, kaolinite formed as a basic product of the alteration of micro-lapilli, while illite commonly accentuated their rims (Figure 7A,B). To a lesser extent, illite occurs as a core of the concretions (Figure 6B,C). Smectite is also observed under the optical microscope inside the illite-rimmed clasts of altered volcanic glass (Figure 7C).
Although sometimes being observed under the optical microscope, chlorite is generally below the detection limit of the quantitative XRD techniques except one sample (3). Chlorite occurs as a core of the concretions (Figure 7D) that formed probably after the original volcanic material.

4.2.2. Pyrite

Pyrite occurs in significant proportions in the upper and lower parts of the tuff section. Pyrite commonly occurs as euhedral crystals (Figure 8A) either in the groundmass or postdating early-formed concretions (Figure 8D). It also occurs as overgrowth on the clay concretions (Figure 8C,D) and as a nucleus of the surrounding clay minerals (Figure 8B). Some rounded pyrite might be replacement after some organics (Figure 8B).

4.2.3. Carbonate Minerals

Carbonate minerals, including calcite and ankerite, are present in all of the Lvshuidong tuffs, although in minor proportions. Carbonate minerals replacing the previously-formed concretions are common (Figure 8B,E,F).

4.2.4. Anatase and Rutile

Anatase and rutile persistently occur in all the tuff samples in relatively significant proportions, with the former being more abundant (up to 8.1%) than the latter (<0.6%). Under SEM, the grains of probably these Ti-bearing minerals, which are up to a few microns in size, are commonly disseminated in the clay groundmass. At the same time, they appear to be absent in the well-crystallized kaolinite aggregates (Figure 7A,C,D). The anatase precipitated in the cracks or voids of the clay groundmass, indicating that anatase has been formed earlier than the well-crystallized kaolinite.

4.2.5. Florencite and Other Minerals

Florencite is present in small proportions (<1%) in all of the tuff samples throughout the studied section. It may possibly have been overlooked during the microscopic examination due to its fine particle size and brightness similar to that of anatase in the SEM backscattering image.
Hematite is observed under the optical microscope, also as a replacement of pumice fragments (Figure 7F). Minor jarosite, generally lower than 1.5%, is present in some tuff samples, representing an oxidation product of pyrite [21,22].

4.3. Elements in the Samples

4.3.1. Concentrations of Selected Major and Trace Elements

Concentrations of rare earth elements and Y, as well as REY anomalies are listed in Table 3. The Al2O3/TiO2 ratio of the tuff samples ranges from 4–9.5, with an average value of 6.9. The Na2O/Al2O3 ratio of the samples varies from 0.003–0.007, being significantly higher in the lower and, especially, upper parts of the tuff section (Figure 9). This likely indicates that the ash was deposited in a continental environment influenced by marine or brackish waters. The Nb/Y ratio shows the opposite vertical trends through the tuff section to the Al2O3/TiO2 ratio (Figure 9). The Nb/Ta ratio shows little variation in the samples (Figure 9).
The average concentrations of TiO2 and P2O5 are 4.72% and 0.16%. They are higher than those in the tuff (3.82% and 0.055%), which is laterally correlated in the Zhongliangshan Coalfield [23].
Trace elements including V, Cr, Co, Ni and Cu are generally enriched in the studied samples, with the average concentrations of 431, 475, 47, 129 and 225 μg/g, respectively. These elements are comparable to the corresponding elements in the altered tuffs in the Zhongliangshan [23] and Guxu Coalfields [10] (Figure 1). These elements commonly are enriched in mafic rocks and generally indicate mafic composition of the original magma. Relative to the upper continental crust (UCC) [24], the samples are also enriched with high field strength elements including Nb, Ta, Zr, Hf and REY, which generally indicates an alkali chemical composition of the volcanic source material.
There is no obvious overall correlation between pyrite and chalcophile elements, such as Zn, Pb and Hg, in the studied samples. However, the concentrations of Zn are highly elevated in the two lowermost samples of the profile where pyrite is the most abundant. This may simply reflect wide variations in the concentrations of these elements in the pyrite in individual samples.

4.3.2. Modes of Occurrence of Critical Metals

The concentration of total REY is correlated with that of P2O5, with a correlation coefficient (r) of 0.97 (Figure 10A). This indicates that florencite is the main carrier of REY in the samples. Total REY is also correlated with the total clay minerals (r = 0.90) (Figure 10B), indicating that REY is not only associated with florencite, but also closely related to clay minerals. Seredin and Dai [25] showed that clay-absorbed REY may also exist in coal and coal-bearing sequences.
The concentrations of Nb and Zr are highly correlated with the proportion of anatase (R is 0.94 and 0.98, respectively), indicating that anatase is the main carrier of Nb and Zr in the studied rocks (Figure 10C,D). Rare metals such as Nb and REY might be released from the original volcanic material, while Nb might substitute Ti within the Nb-bearing ilmenite/anatase replacement during volcanic ash alteration. Meanwhile, strong correlation between Nb and Ta (Figure 10E) indicates that they have similar modes of occurrence. This is also similar to the case for Zr and Hf (Figure 10F). In addition, Nb, Ta, Zr, Hf and REY are associated not only with anatase, but also occur as absorbed ions on the clay minerals, with the latter being their main carrier [6]. In comparison, these critical metals have much higher concentrations in the altered alkaline felsic tuffs from SW China [6].

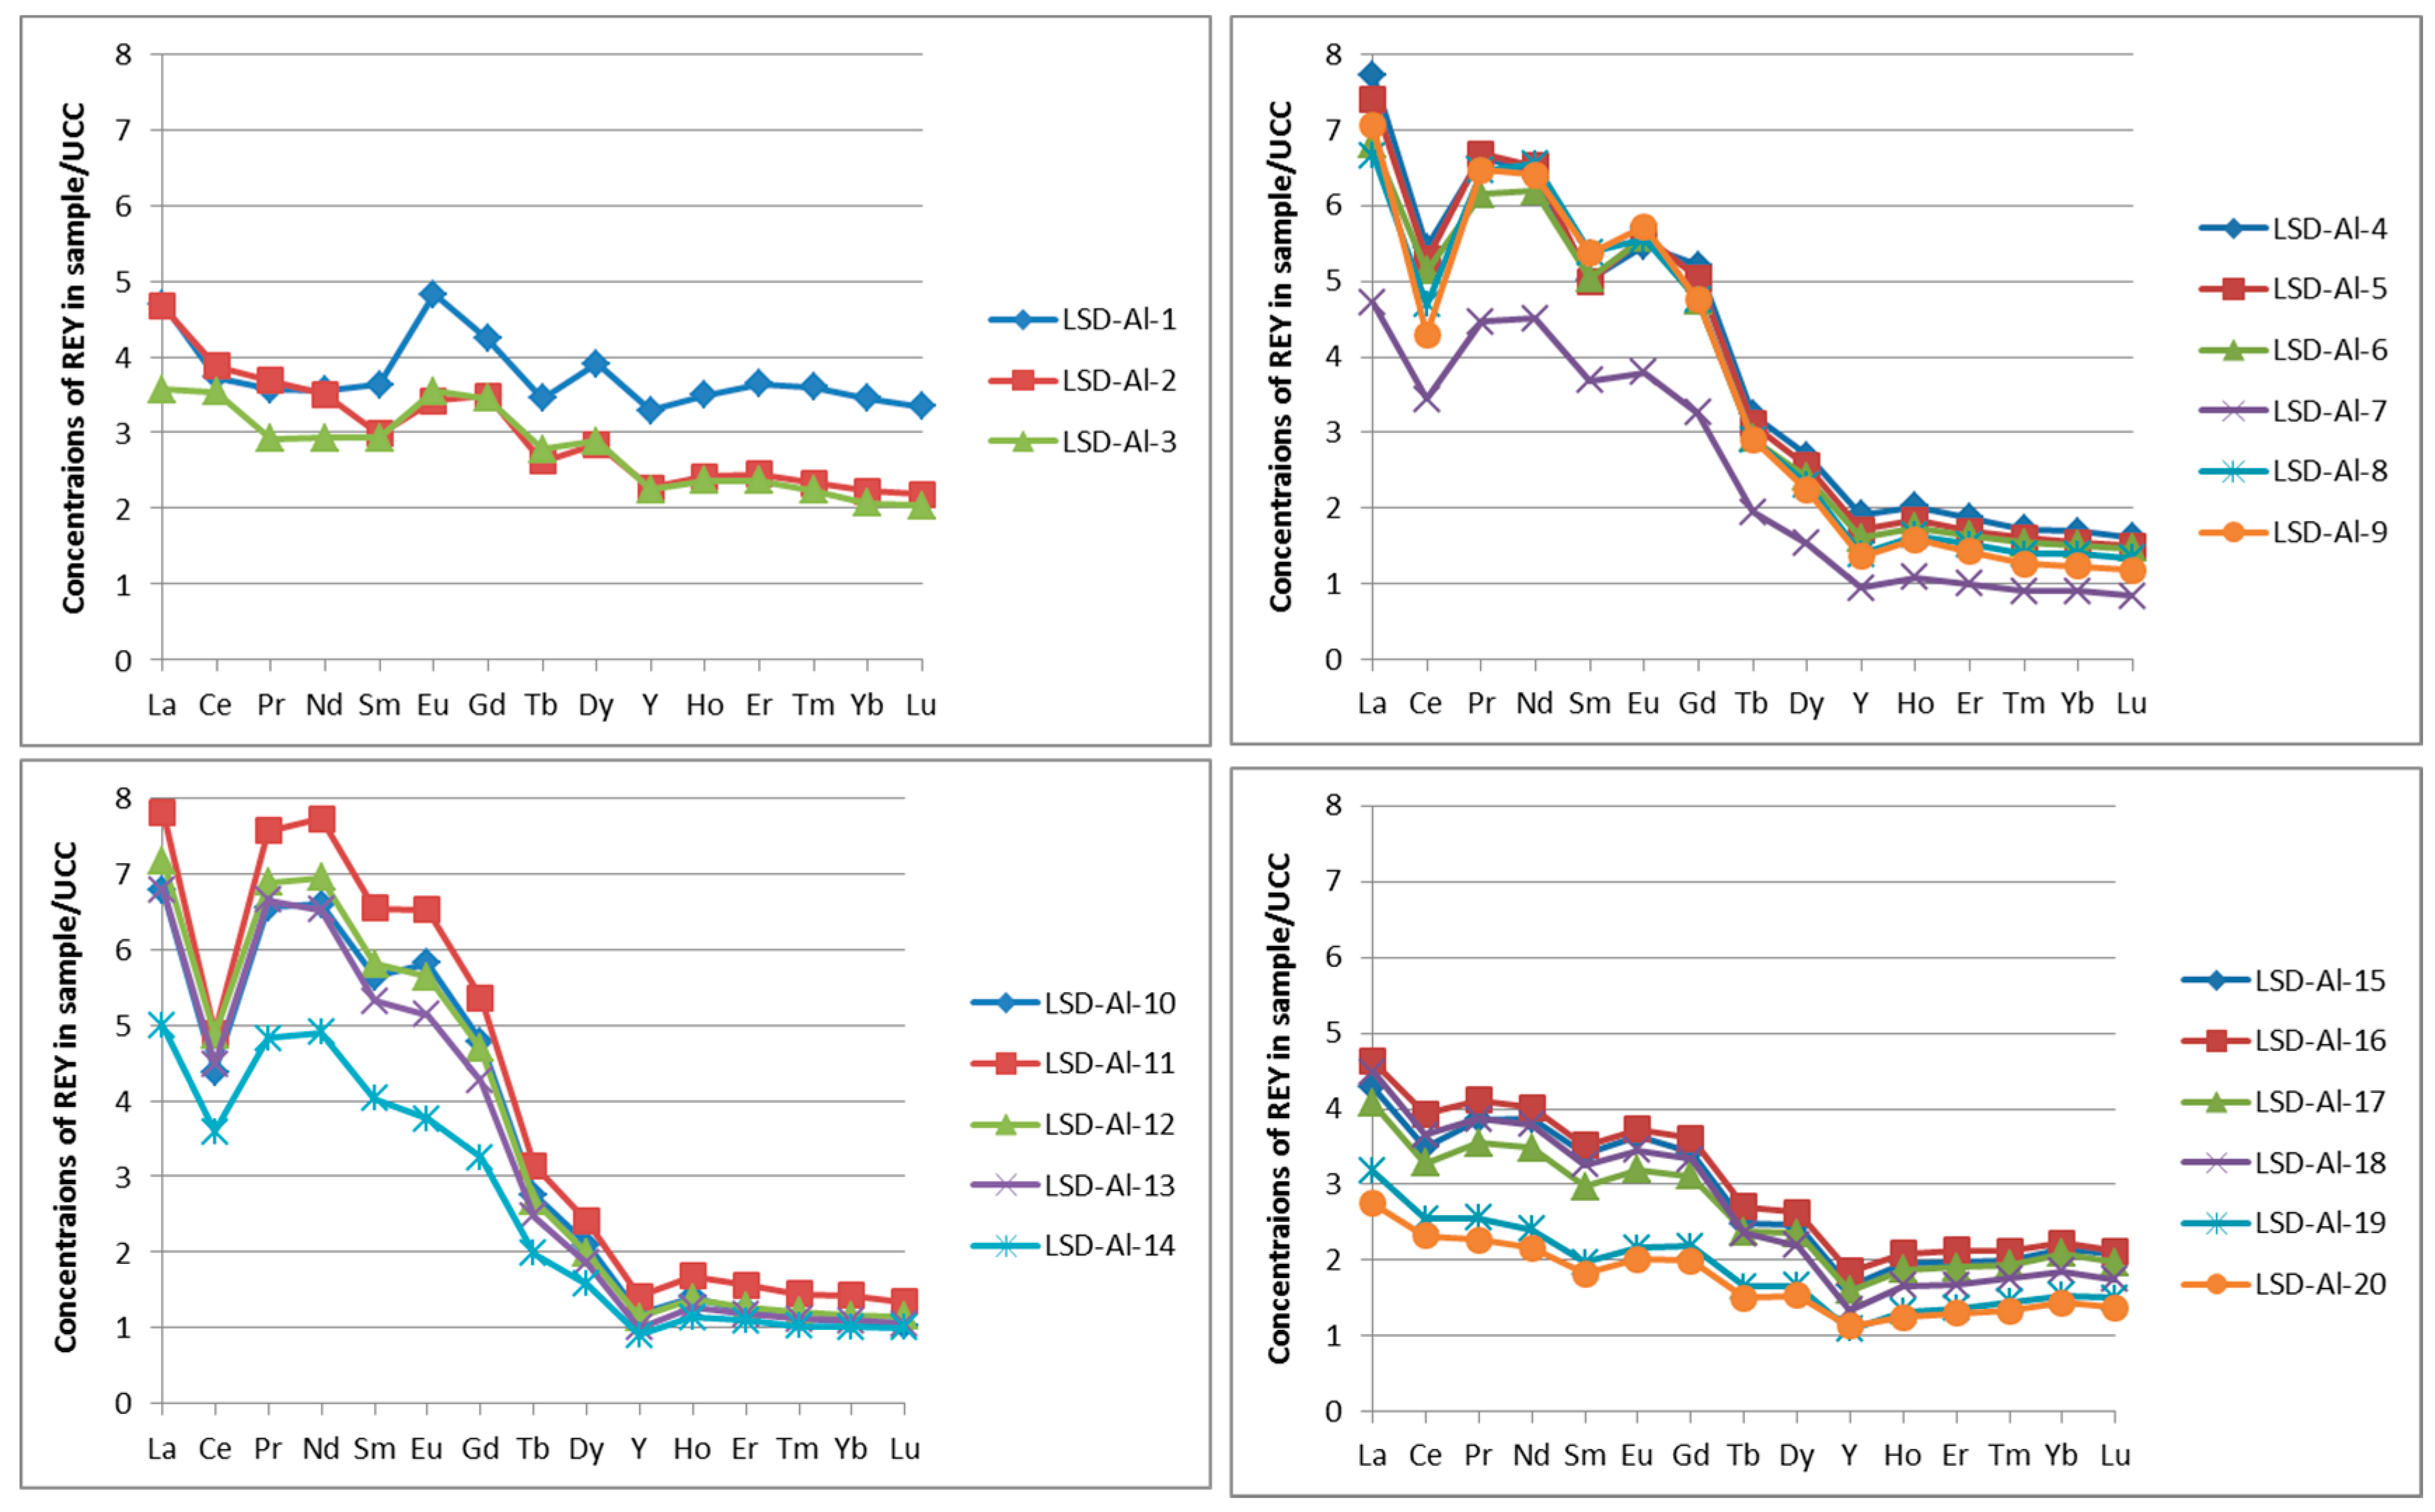
4.3.3. REY Distribution Patterns and Anomalies

The concentrations of REY are normalized to UCC, following the method and classification of Seredin and Dai [25], in order to obtain a more clear indication of the distribution patterns (Figure 11) and to evaluate the depositional and epigenetic processes. Seredin and Dai [25] classified the distribution of REY into three enrichment types, namely L-type (light REY enrichment type), M-type (medium REY enrichment type) and H-type (heavy REY enrichment type).
All of the studied samples are characterized by a light REY enrichment type and slightly positive Eu anomalies (EuN/EuN* of 1.09 on average) (Table 3). The positive Eu anomalies correspond well to a mafic composition of the parent magma [26]. With the exception of sample 3, all of the samples have a negative Ce anomaly.
The samples from the upper and lower parts of the profile have relatively flat REY distribution patterns ((La/Yb)N is 1.72 and 2.07 on average) and less significant Ce anomalies than those from a middle part of the profile ((La/Yb)N is 5.31 on average). Specifically, a weak Ce anomaly was observed for three topmost samples and six lowermost samples (Figure 11). Samples 4 to 14, however, have a relatively distinct Ce negative anomaly.
The characteristic REY distribution patterns of the Lvshuidong tuffs are different from those in the Moxinpo and Guxu Coalfields, SW China, although the tuffs from all three coalfields are laterally correlated. Both tuff samples from the Moxinpo and Guxu Coalfields mostly have positive Eu anomalies, also indicating the mafic composition of their tuffs [10,11]. With the exception of a weak positive anomaly for one sample, the Lvshuidong tuffs show negative Ce positive anomalies, although mafic tuff generally exhibits a positive Ce anomaly. Deposition in a marine environment may lead to a negative or very weak Ce anomaly [26]; although the REY concentrations in seawater are low and the combination mechanism of REY from seawater into peat is unknown. The interaction of volcanic ash and marine water probably has led to the leaching out of Ce from the original ash. Negative Ce anomalies are considered as an indication of a marine depositional environment [27,28]. Negative and weak Ce positive anomalies of the Lvshuidong tuffs probably indicate that the Lvshuidong tuffs have been influenced by marine water (Figure 9). However, the Guxu Tuffs that exhibits a positive Ce anomaly were deposited in a continental environment showing no influence by marine water.

5. Discussion

5.1. Formation of the Minerals

A previous study [9] suggested that the tuff immediately underlying the K1 coal seam in the Lvshuidong mine is mainly composed of kaolinite and siderite, and this is thought to indicate the deposition of the mafic volcanic ash mainly under non-marine or at least weakly-marine conditions. Although the tuff samples in the present study are also dominated by kaolinite in the middle and lower parts of the profile, illite is also abundant in a few topmost samples. Based on the SEM examination, the illite in the uppermost profile is of authigenic origin.
The clay minerals in the middle and lower parts of the argillized tuff bed in the present study are mainly kaolinite. This is consistent with the previous study that suggested a continental environment is the main depositional condition [9].
Altaner et al. [29] suggested that the illite/smectite (I/S) composition of K-bentonite was produced by the reaction of smectite in the original bentonite with K+ in the pore fluids, with the K being derived from the breakdown of K-bearing minerals (e.g., micas and K-feldspar) in the host rock. The HRTEM studies show the transformation of smectite to I/S by hydrothermal alteration [30]. In these cases, illite and I/S in altered volcanic ash are the result of illitization of previously-formed smectite, with a mixed layer illite/smectite (I/S) being an intermediate product.
Hower et al. [31] noted that the proportion of illite layers in I/S increases with increasing burial depth in shales of the Oligocene-Miocene sediments from the Gulf Coast of the U.S., due to burial metamorphism. However, the occurrence of illite in the uppermost samples of the present study has no relationship with burial depth. The presence of a significant amount of authigenic illite probably indicates significant marine influence on the uppermost profile, which is also indicated by a higher Na2O/Al2O3 ratio in the bulk rock compositions there (Figure 4 and Figure 8). What is more, illite is common in argillized tuffs deposited in a marine environment as a product of glass alteration. The alternating rims of kaolinite and illite identified in the uppermost section of the studied tuff (Figure 7A,B) possibly indicate the multiple change of chemical conditions from acidic (formation of kaolinite) to alkaline (formation of illite) during early diagenesis, with the K+ ions being supplied by marine water.
The tuff was deposited on the eroded limestone of the Maokou Formation and is overlain by the K1 coal seam of the Longtan Formation in the Huayingshan Coalfield. The Longtan formation was developed due to transgression probably during or after the main eruption phase of the Emeishan basalts in the Early Permian [3]. The marine water probably percolated to the upper part of original tuff bed during early diagenesis. The change in the influence of marine water may result in the formation of different clay minerals. A relatively alkaline environment at the top of the original tuff bed is in favor of the formation of illite. The formation of zeolite (analcite) and carbonates is also consistent with an alkaline environment.
Kaolinite and illite have been formed mainly from the devitrification of the volcanic glass. Based on the observation under SEM, kaolinite formed from phenocrysts mainly occurs as vermicular aggregates, while kaolinite making up the groundmass is relatively poorly crystallized. Chlorite and analcite are also alteration products of the volcanic glass shards. Chlorite has been reported in tuff from SW China as a replacement of kaolinite [9,32].
Based on the SEM data, hydrothermal alteration of ilmenite to anatase probably resulted in the crystallization of anatase and trace rutile in cracks or voids of the clay groundmass. The Ti-bearing mineral phases are associated with clay minerals in the groundmass, but are absent among the phenocryst-replacing clay minerals, based on the SEM observation (Figure 5 and Figure 6). This is probably because the alteration of the groundmass and phenocrysts occurred in different stages of diagenesis.
REE-phosphate and carbonate minerals such as florencite, rhabdophane and synchysite have been frequently reported in tuffaceous sediments, coals and associated strata from SW China and are attributed to hydrothermal alterations [6,9,10,23]. This is probably also the case for the florencite in the studied samples. Altered volcanic ash usually has relatively high concentrations of phosphorus, which occurs as P-bearing and/or REE-rich minerals, such as apatite, aluminophosphate or carbonate minerals. REE-bearing fluid activities are relatively common in Lopingian coal-bearing strata in SW China [6,9,10,23], which probably have led to the formation of florencite.
Pyrite in the samples commonly post-dates earlier-formed minerals (kaolinite, illite, carbonates), which also indicates its formation during a relatively late diagenetic stage.

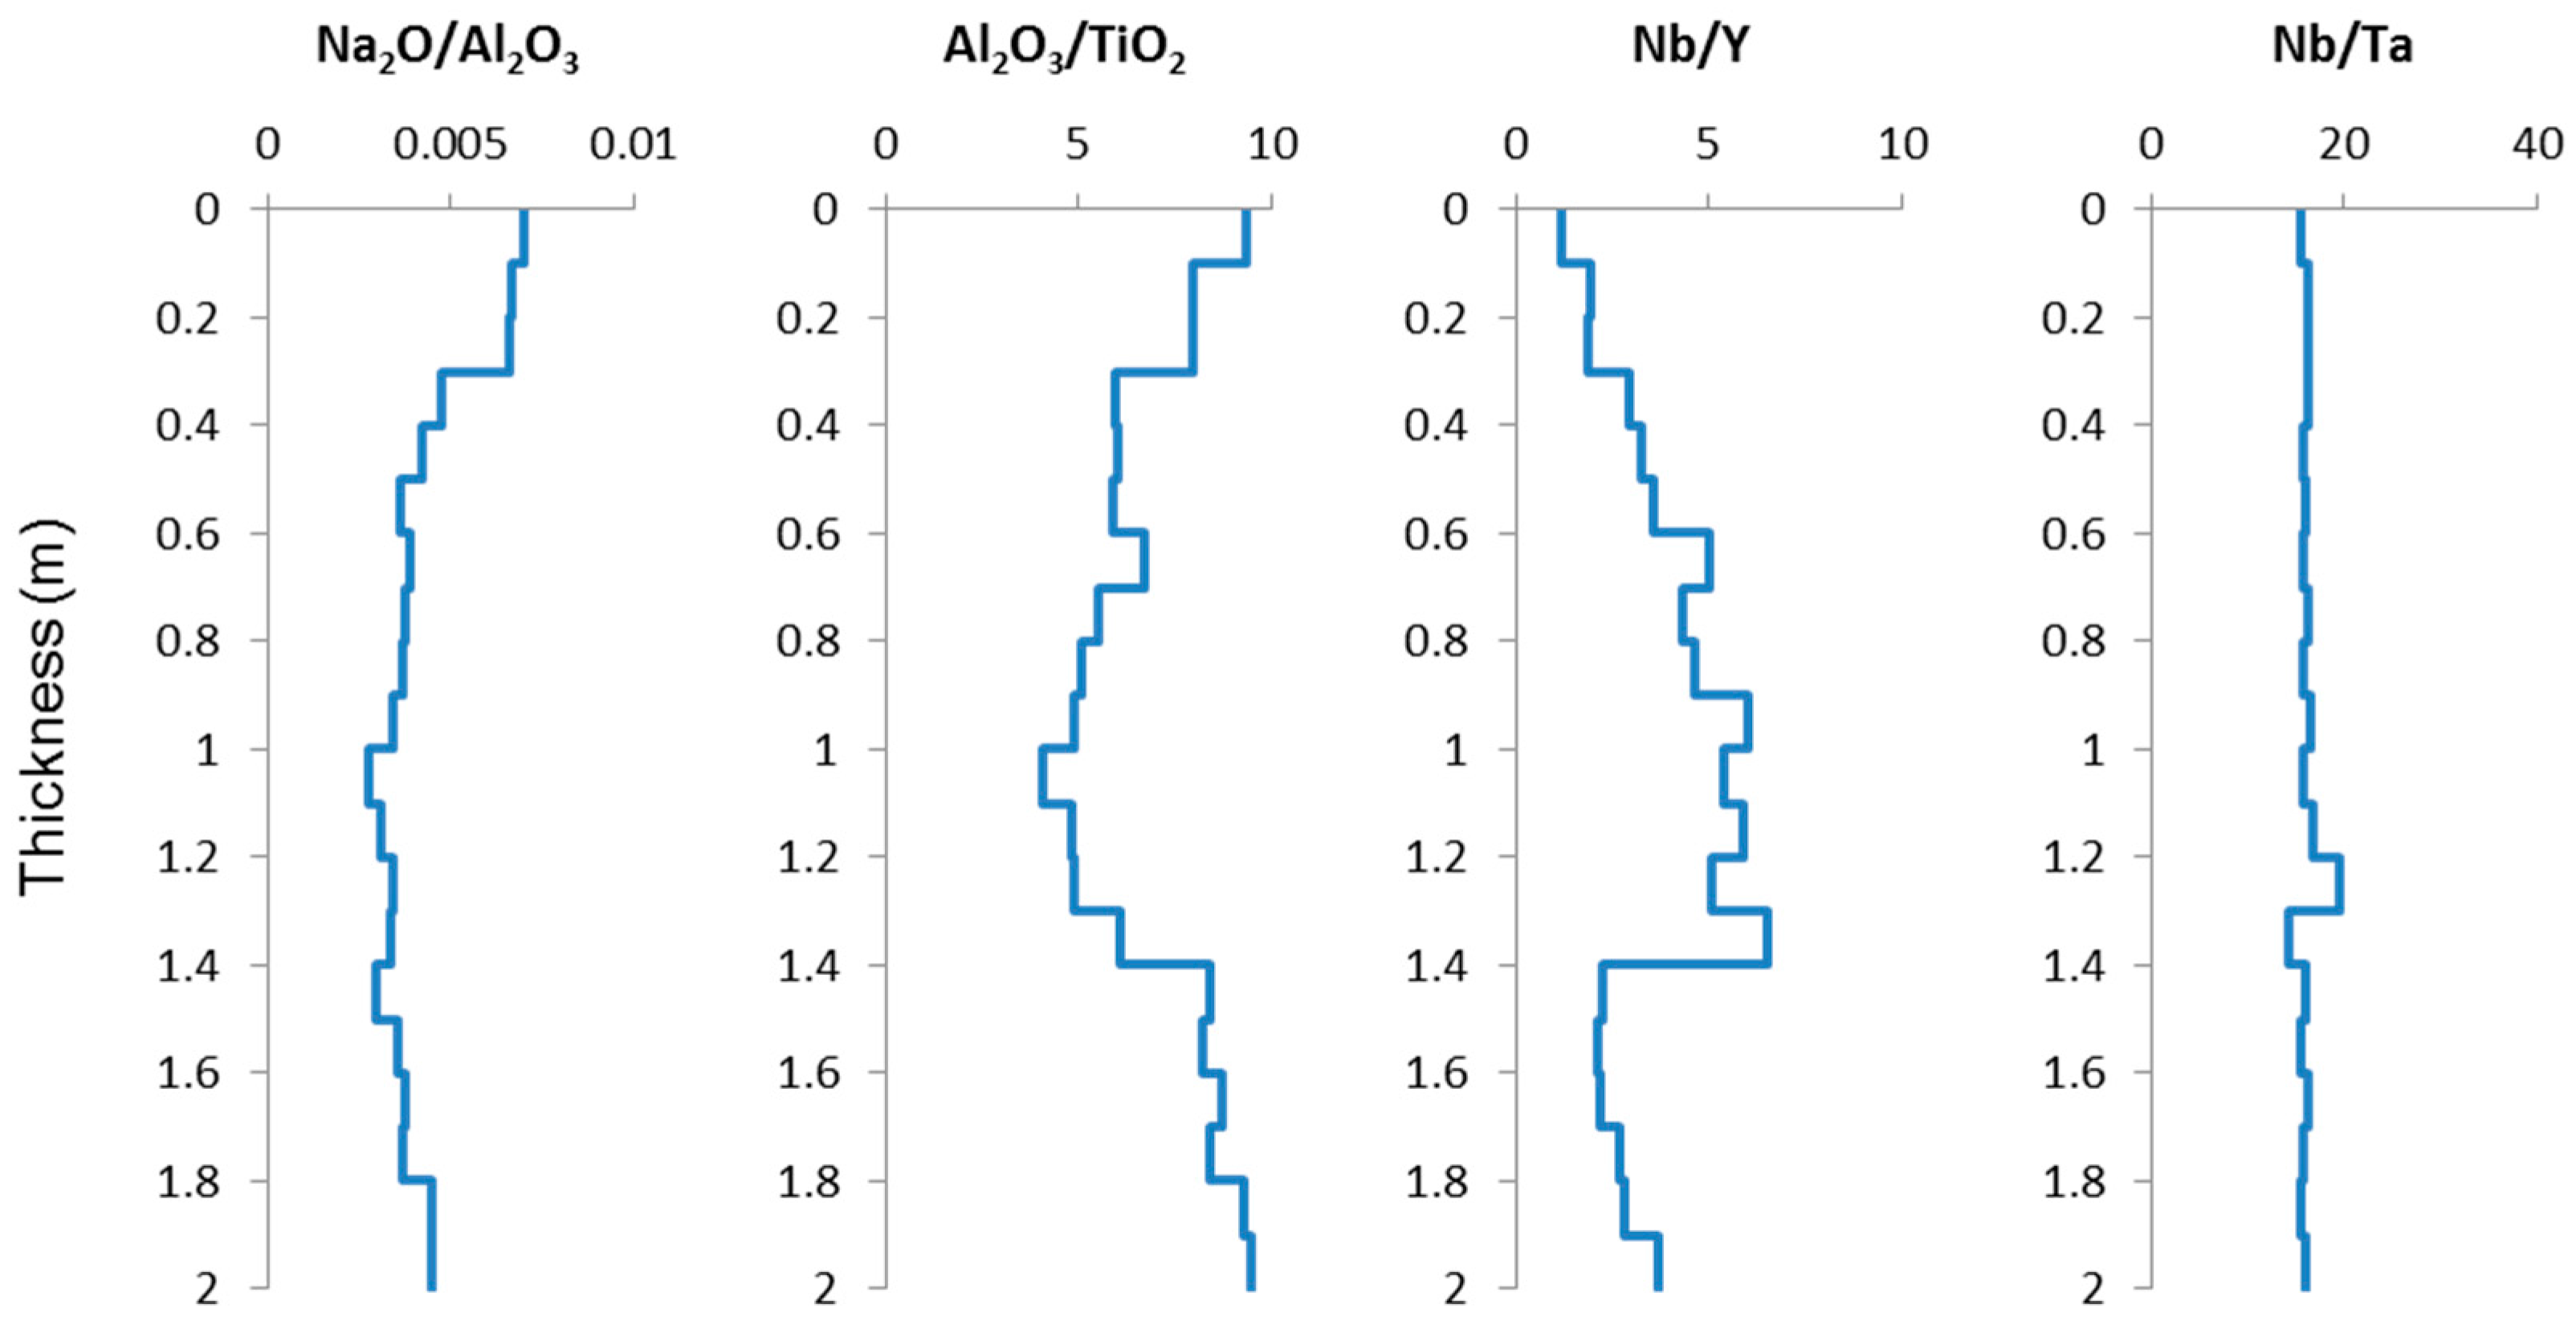
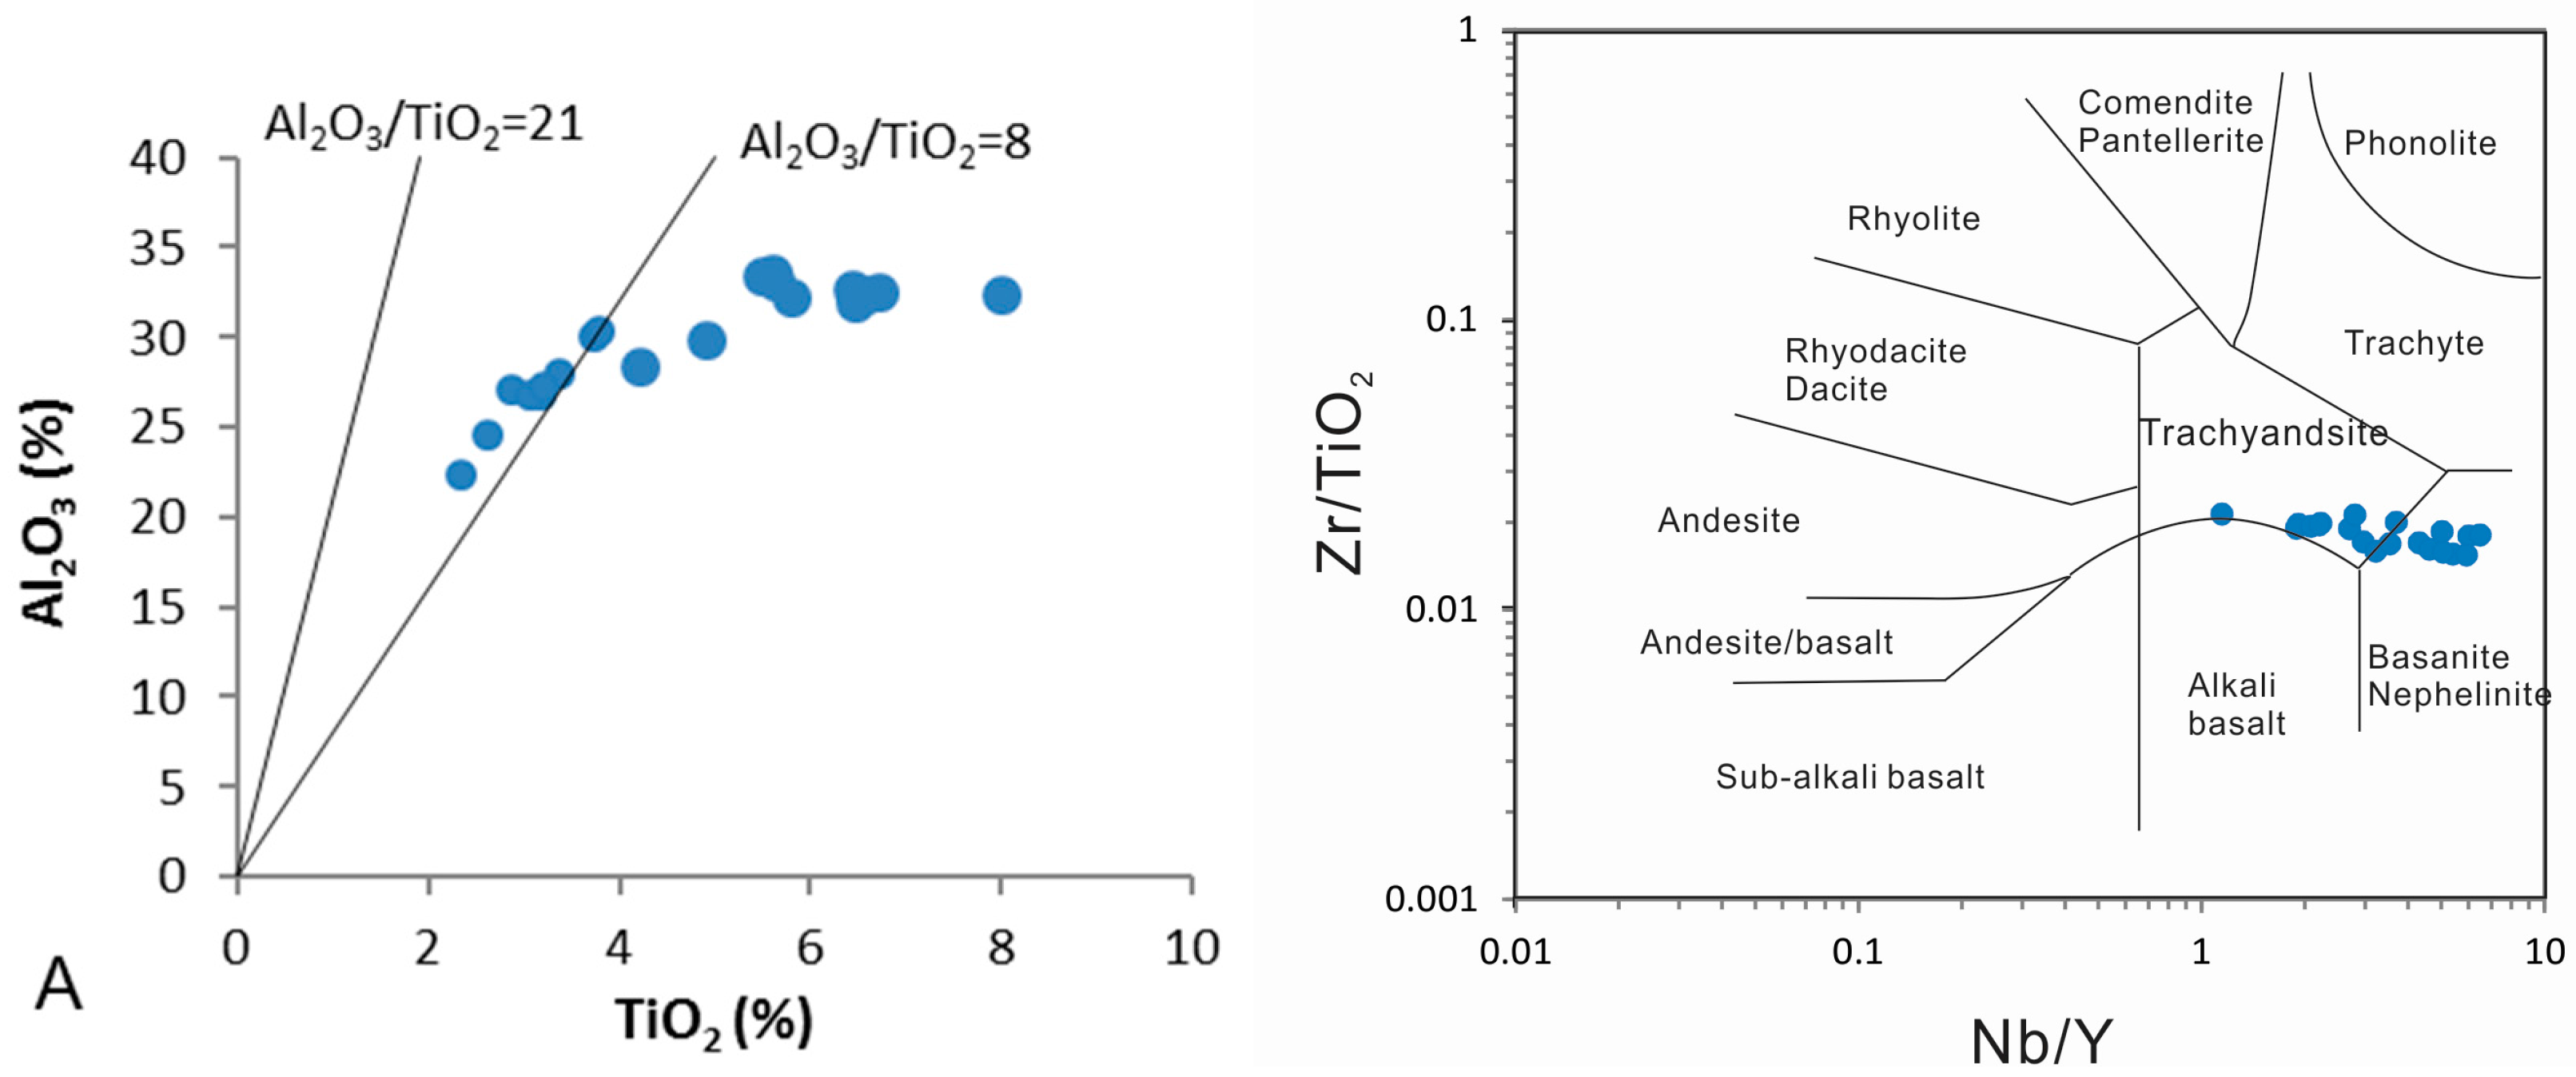
5.2. Chemical Composition of the Original Volcanic Ash

Immobile elements in altered volcanic ashes can be used as the provenance indicators. The relatively immobile elements in altered volcanic ashes are considered to be present as resistant mineral phases, such as ilmenite (Ti) and zircon (Zr and Hf), although ilmenite may be altered [33]. Not only the volcanogenic minerals, but immobile elements can also occur in diagenetic minerals such as kaolinite (Al) and anatase (Ti) [34]. Although smaller ions with high valence (high field strength elements) tend to be immobile, the mobility depends also on the pH, salinity and redox state of the water environment [35].
The ratio of Al2O3/TiO2 has been widely used as a useful provenance indicator for sedimentary rocks [36] or as an indicator of the possible volcanic component [37,38,39]. Typical Al2O3/TiO2 ratios are 3–8, 8–21 and 21–70 to indicate parent magmas of mafic, intermediate and felsic composition, respectively [36]. The Al2O3/TiO2 ratio of the samples in this study varies from 4.0–9.5, with an average value of 6.9. This tentatively indicates a mafic composition of the dominant magma source (Figure 12A). Part of the Al2O3/TiO2 ratio might be attributed to the incorporation of Ti in the aluminosilicate (e.g., kaolinite) structure. The intimate association of anatase and clay minerals indicates that kaolinite and anatase may have been co-precipitated or anatase crystallized shortly after formation of the kaolinite groundmass. The high proportions of TiO2 in the samples reflect high Ti contents in the original ash.
On the other hand, the ratio Al2O3/TiO2 significantly varies, with the highest values occurring in the upper and lower parts, which are twice that in the middle part of the profile (Figure 9). Although Ti is usually considered as immobile during the formation of tonsteins or bentonite [34,35], the mobility of Ti depends on the pH of the depositional environment. Although TiO2 is relatively immobile, the hydroxide (Ti(OH)4) is more soluble than Al2O3 at a slightly acid environment (pH of 5–6) [40]. The vertical variation in the TiO2 ratios probably suggests that TiO2 is more mobile relative to Al2O3. It is likely that Ti released from degradation of volcanic material (e.g., titanaugite and ilmenite) would initially be in hydroxide form and thus be relatively mobile under a moderately acid condition. The occurrence of volcanic components replaced by TiO2 in coal samples from SW China [41] also suggests that Ti can be introduced, or at least moved around, in solutions permeating through the peat/coal after deposition in a relatively acid environment, perhaps as a more soluble Ti(OH)4 component or as organo-metallic complexes.
The key parameters for claystones were also investigated using the magma source discrimination diagram of Winchester and Floyd [42] (Figure 12B). On this diagram, the tuff samples fall in the trachyandesite and basanite/nephelinite fields, indicating an alkaline composition of the volcanic ash.
As discussed by Kiipli et al. [35], Nb and Zr are immobile, and REE and Y are relatively mobile during alteration of volcanic ash to bentonite. REE and Y have also been noticed to be mobile in other studies [34]. In the present study, the Nb/Y ratio shows the opposite trends through the tuff section to the Al2O3/TiO2 ratio, which indicates that Y is probably more mobile than Nb. On the other hand, little variation of the Nb/Ta ratio probably indicates that Nb and Ta have similar immobility. The mobility of Y and Ti potentially makes the use of the discrimination diagram of Winchester and Floyd [42] (Figure 12B) less reliable as a provenance indicator. Nevertheless, the studied samples are broadly consistent with an alkaline mafic composition of the parent magma.

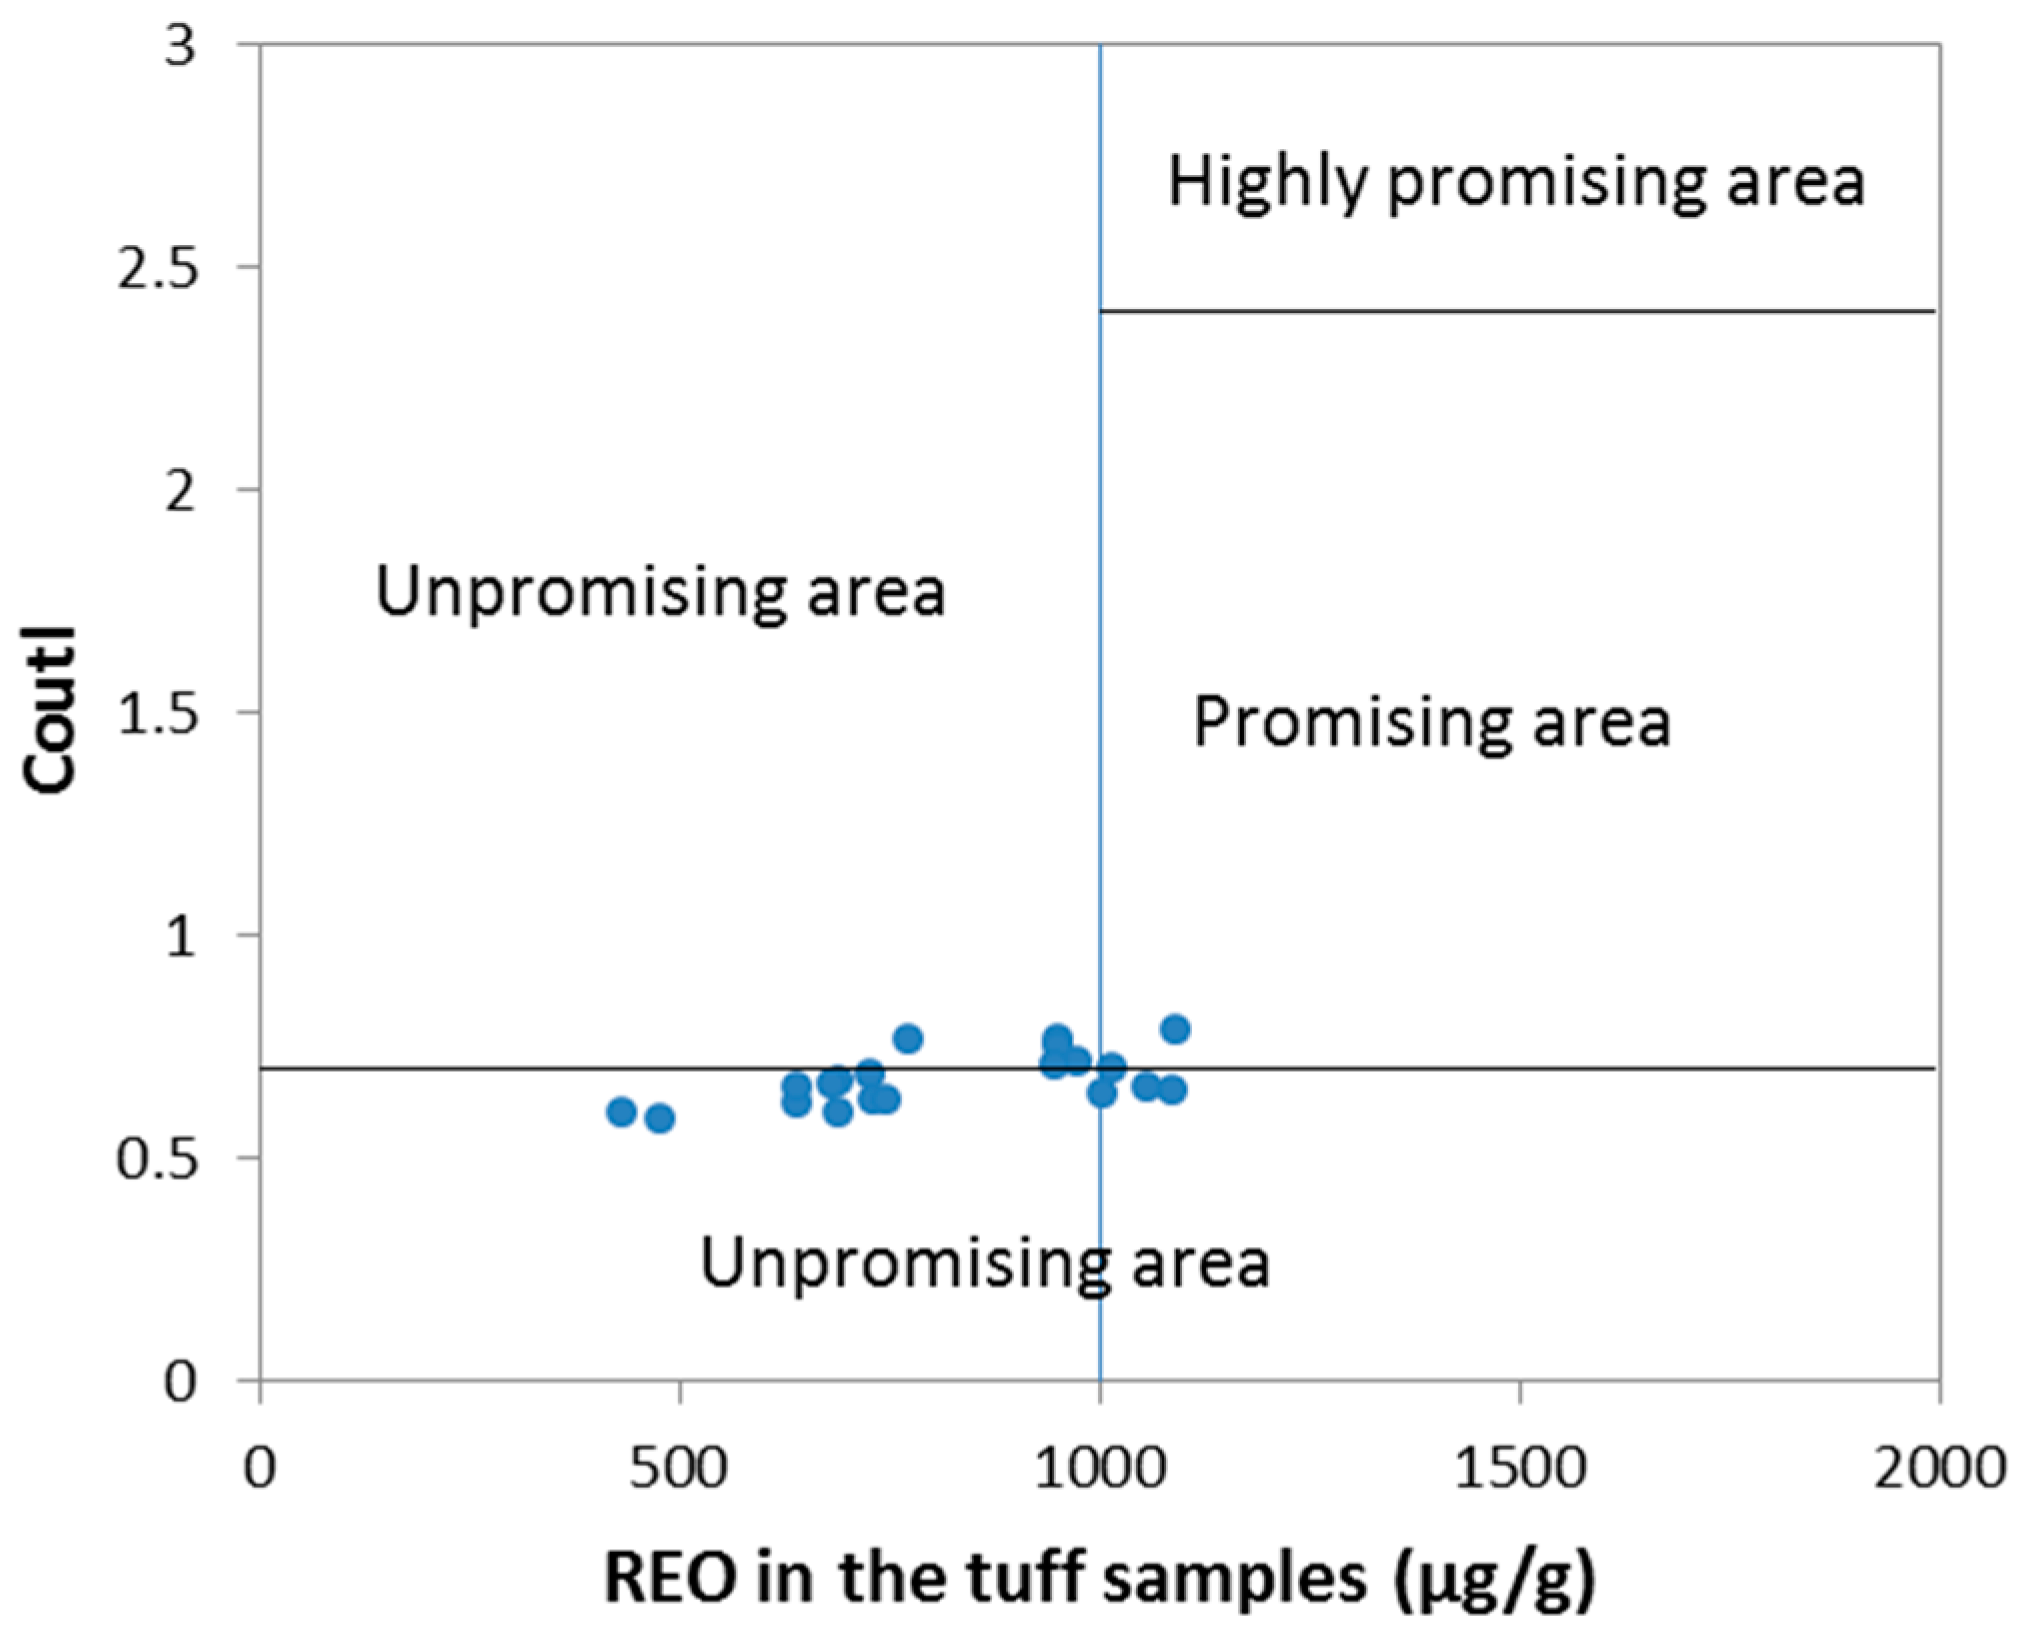
5.3. Potential Economic Significance of the Rare Metals in the Tuffs

The oxides of rare earth elements’ (REO) concentration in the tuff samples varies from 433–1090 μg/g, with an average of 816 μg/g (Table 3). Most samples fall within the unpromising area, with the total REO being between 500 and 1000 μg/g (Figure 13). Only samples from the middle part of the section are above or close to the typical REY cut-off-grade (0.1% REY2O3) in coal combustion wastes for by-product recovery.
The (Nb,Ta)2O5 of the Lvshuidong tuffs is 167 μg/g on average, which is also higher than that of marginal and industrial-grade Nb(Ta) ore deposits of weathered crust type (80–100 μg/g and 160–200 μg/g, respectively) (Specifications for Rare Metal Mineral Exploration, DZ/T 0203-2002, 2002). Although the abundance of REY2O3, (Nb,Ta)2O5 in the studied samples is relatively high, these elements are much lower than those in the Nb-Zr-REY-Ga-mineralized claystones in Yunnan Province, SW China [6]. The Nb-Zr-REY-Ga-mineralized claystones in the study of Zhao et al. [6] have formed from the alteration of alkaline felsic pyroclastics. This probably indicates that alkaline felsic ashes may have a higher potential as raw materials for these critical metals. This is probably caused by a higher ability of alkaline felsic altered tuff to adsorb the critical metals than tuffs of different types.

6. Conclusions

The clay fractions of the Lopingian argillized tuff bed from the Lvshuidong mine, Huayingshan Coalfield, SW China, are dominated by kaolinite and illite in a few topmost samples of the profile, but are dominated by kaolinite in its middle and lower parts. In the topmost samples, kaolinite and illite not only compose the groundmass, but also occur as alternating rims of clay concretions probably after micro-lapilli (chalazoidite) and volcanic glass. Kaolinite also occurs as vermicular aggregates, which have formed from the alteration of the original phenocrysts. Concentric rings of illite and kaolinite, pyrite and carbonates suggest alterative diagenetic conditions. Although the original volcanic ash has been deposited mainly in a continental environment, marine water may have percolated to the uppermost layers of the ash bed during early diagenesis. Based on the chemical and mineralogical characteristics, the argillized tuff samples have been derived from mafic volcanic ash, which is also consistent with the occurrence of significant authigenic anatase and rutile. The noticeable mobility of Ti, REE and Y potentially makes the use of discrimination diagrams such as that of Winchester and Floyd [42] less reliable as provenance indicators.
Samples of the present study have relatively high concentrations of critical metals including Nb, Ta, Zr, Hf and REY, which are comparable with their respective typical marginal and industrial grade. However, the concentrations of these elements are much lower than those in the alkaline felsic volcanic layers in SW China. This probably indicates that the latter may have a higher potential as raw materials for these critical metals. This is probably caused by a higher ability of alkaline felsic altered tuff to adsorb the critical metals than tuffs of different types.

Acknowledgments

This research was supported by the National Key Basic Research Program of China (No. 2014CB238900), the National Natural Science Foundation of China (No. 41672152), the 111 Project (No. B17042) and the Fundamental Research Funds for the Central Universities of China (2014QM01). The authors would like to thank Xibo Wang for his assistance in sample collection. Thanks are expressed to Colin Ward, Ian Graham and David French for their assistance in the revising of the manuscript. Thanks are also expressed to four anonymous reviewers, for their constructive comments and suggestions on the manuscript.

Author Contributions

Lei Zhao performed the petrographic and SEM examinations and Siroquant analysis, interpreted all of the data and constructed the paper. Qin Zhu, Shaohui Jia and Jianhua Zou collected the samples and performed the XRD, ICP-MS and XRF experiments. Shifeng Dai contributed to the design of the work, analyzed the data and constructed the paper. Victor P. Nechaev also provided some contributions to the data interpretation.

Conflicts of Interest

The authors declare no conflict of interest.

References

  1. Chung, S.-L.; Jahn, B.-M. Plume-lithosphere interaction in generation of the Emeishan flood basalts at the Permian-Triassic boundary. Geology 1995, 23, 889–892. [Google Scholar] [CrossRef]
  2. Xiao, L.; Xu, Y.G.; Mei, H.J.; Zheng, Y.F.; He, B.; Pirajno, F. Distinct mantle sources of low-Ti and high-Ti basalts from the western Emeishan large igneous province, SW China: Implications for plume–lithosphere interaction. Earth Planet. Sci. Lett. 2004, 228, 525–546. [Google Scholar] [CrossRef]
  3. He, B.; Xu, Y.-G.; Chung, S.-L.; Xiao, L.; Wang, Y. Sedimentary evidence for a rapid, kilometer-scale crustal doming prior to the eruption of the Emeishan flood basalts. Earth Planet. Sci. Lett. 2003, 213, 391–405. [Google Scholar] [CrossRef]
  4. Dai, S.; Wang, X.; Chen, W.; Li, D.; Chou, C.-L.; Zhou, Y.; Zhu, C.; Li, H.; Zhu, X.; Xing, Y.; et al. A high-pyrite semianthracite of late Permian age in the Songzao Coalfield, southwestern China: Mineralogical and geochemical relations with underlying mafic tuffs. Int. J. Coal Geol. 2010, 83, 430–445. [Google Scholar] [CrossRef]
  5. Kramer, W.; Weatherall, G.; Offler, R. Origin and correlation of tuffs in the Permian Newcastle and Wollombi Coal Measures, NSW, Australia, using chemical fingerprinting. Int. J. Coal Geol. 2001, 47, 115–135. [Google Scholar] [CrossRef]
  6. Zhao, L.; Dai, S.; Graham, I.T.; Li, X.; Liu, H.; Song, X.; Hower, J.C.; Zhou, Y. Cryptic sediment-hosted critical element mineralization from eastern Yunnan Province, southwestern China: Mineralogy, geochemistry, relationship to Emeishan alkaline magmatism and possible origin. Ore Geol. Rev. 2017, 80, 116–140. [Google Scholar] [CrossRef]
  7. Dai, S.; Zhou, Y.; Zhang, M.; Wang, X.; Wang, J.; Song, X.; Jiang, Y.; Luo, Y.; Song, Z.; Yang, Z.; et al. A new type of Nb(Ta)–Zr(Hf)–REE–Ga polymetallic deposit in the Late Permian coal-bearing strata, eastern Yunnan, southwestern China: Possible economic significance and genetic implications. Int. J. Coal Geol. 2010, 83, 55–63. [Google Scholar] [CrossRef]
  8. Hower, J.C.; Ruppert, L.F.; Eble, C.F. Lanthanide, yttrium, and zirconium anomalies in the Fire Clay coal bed, Eastern Kentucky. Int. J. Coal Geol. 1999, 39, 141–153. [Google Scholar] [CrossRef]
  9. Dai, S.; Luo, Y.; Seredin, V.V.; Ward, C.R.; Hower, J.C.; Zhao, L.; Liu, S.; Zhao, C.; Tian, H.; Zou, J. Revisiting the Late Permian coal from the Huayingshan, Sichuan, southwestern China: Enrichment and occurrence modes of minerals and trace elements. Int. J. Coal Geol. 2014, 122, 110–128. [Google Scholar] [CrossRef]
  10. Dai, S.; Liu, J.; Ward, C.R.; Hower, J.C.; French, D.; Jia, S.; Hood, M.M.; Garrison, T.M. Mineralogical and geochemical compositions of Late Permian coals and host rocks from the Guxu Coalfield, Sichuan Province, China, with emphasis on enrichment of rare metals. Int. J. Coal Geol. 2016, 166, 71–95. [Google Scholar] [CrossRef]
  11. Dai, S.; Xie, P.; Jia, S.; Ward, C.R.; Hower, J.C.; Yan, X.; French, D. Enrichment of U-Re-V-Cr-Se and rare earth elements in the Late Permian coals of the Moxinpo Coalfield, Chongqing, China: Genetic implications from geochemical and mineralogical data. Ore Geol. Rev. 2017, 80, 1–17. [Google Scholar] [CrossRef]
  12. Zhuang, X.; Su, S.; Xiao, M.; Li, J.; Alastuey, A.; Querol, X. Mineralogy and geochemistry of the Late Permian coals in the Huayingshan coal-bearing area, Sichuan Province, China. Int. J. Coal Geol. 2012, 94, 271–282. [Google Scholar] [CrossRef]
  13. China Coal Geology Bureau. Sedimentary Environments and Coal Accumulation of Late Permian Coal Formation in Western Guizhou, Southern Sichuan, and Eastern Yunnan, China; Chongqing University Press: Chongqing, China, 1996; p. 216.
  14. Taylor, J.C. Computer programs for standardless quantitative analysis of minerals using the full powder diffraction profile. Powder Diffr. 1991, 6, 2–9. [Google Scholar] [CrossRef]
  15. Ward, C.R.; Taylor, J.C.; Matulis, C.E.; Dale, L.S. Quantification of mineral matter in the argonne premium coals using interactive Rietveld-based X-ray diffraction. Int. J. Coal Geol. 2001, 46, 67–82. [Google Scholar] [CrossRef]
  16. Kelloway, S.J.; Ward, C.R.; Marjo, C.E.; Wainwright, I.E.; Cohen, D.R. Quantitative chemical profiling of coal using core-scanning X-ray fluorescence techniques. Int. J. Coal Geol. 2014, 128–129, 55–67. [Google Scholar] [CrossRef]
  17. Zhao, L.; Sun, J.; Guo, W.; Wang, P.; Ji, D. Mineralogy of the Pennsylvanian coal seam in the Datanhao mine, Daqingshan Coalfield, Inner Mongolia, China: Genetic implications for mineral matter in coal deposited in an intermontane basin. Int. J. Coal Geol. 2016, 167, 201–214. [Google Scholar] [CrossRef]
  18. Dai, S.; Wang, X.; Zhou, Y.; Hower, J.C.; Li, D.; Chen, W.; Zhu, X.; Zou, J. Chemical and mineralogical compositions of silicic, mafic, and alkali tonsteins in the Late Permian coals from the Songzao Coalfield, Chongqing, southwest China. Chem. Geol. 2011, 282, 29–44. [Google Scholar] [CrossRef]
  19. Ward, C.R.; Spears, D.A.; Booth, C.A.; Staton, I.; Gurba, L.W. Mineral matter and trace elements in coals of the Gunnedah Basin, New South Wales, Australia. Int. J. Coal Geol. 1999, 40, 281–308. [Google Scholar] [CrossRef]
  20. Zhao, L.; Ward, C.R.; French, D.; Graham, I.T. Mineralogical composition of Late Permian coal seams in the Songzao Coalfield, southwestern China. Int. J. Coal Geol. 2013, 116–117, 208–226. [Google Scholar] [CrossRef]
  21. Ward, C.R. Analysis and significance of mineral matter in coal seams. Int. J. Coal Geol. 2002, 50, 135–168. [Google Scholar] [CrossRef]
  22. Ward, C.R. Analysis, origin and significance of mineral matter in coal: An updated review. Int. J. Coal Geol. 2016, 165, 1–27. [Google Scholar] [CrossRef]
  23. Zou, J.; Tian, H.; Li, T. Geochemistry and mineralogy of tuff in Zhongliangshan mine, Chongqing, southwestern China. Minerals 2016, 6, 47. [Google Scholar] [CrossRef]
  24. Taylor, S.R.; McLennan, S.M. The Continental Crust: Its Composition and Evolution; Blackwell: Oxford, UK, 1985; p. 312. [Google Scholar]
  25. Seredin, V.V.; Dai, S. Coal deposits as potential alternative sources for lanthanidesand yttrium. Int. J. Coal Geol. 2012, 94, 67–93. [Google Scholar] [CrossRef]
  26. Dai, S.; Graham, I.T.; Ward, C.R. A review of anomalous rare earth elements and yttrium in coal. Int. J. Coal Geol. 2016, 159, 82–95. [Google Scholar] [CrossRef]
  27. Murray, R.W.; Buchholtz, T.; Brink, M.R.; Jones, D.L.; Gerlach, D.C.; Russ, G.P. Rare earth elements as indicators of different marine depositional environments in chert and shale. Geology 1990, 18, 268–272. [Google Scholar] [CrossRef]
  28. Alibo, D.; Nozaki, Y. Rare earth elements in seawater: Particle association, shalenormalization, and Ce oxidation. Geochim. Cosmochim. Acta 1999, 63, 363–372. [Google Scholar] [CrossRef]
  29. Altaner, S.P.; Hower, J.; Whitney, G.; Aronson, J.L. Model for K-bentonite formation: Evidence from zoned K-bentonites in the disturbed belt, Montana. Geology 1984, 12, 412–415. [Google Scholar] [CrossRef]
  30. Amouric, M.; Olives, J. Illitization of smectite as seen by high-resolution transmission electron microscopy. Eur. J. Mineral. 1991, 3, 831–835. [Google Scholar] [CrossRef]
  31. Hower, J.; Eslinger, E.V.; Hower, M.E.; Perry, E.A. Mechanism of burial metamorphism of argillaceous sediment: 1. Mineralogical and chemical evidence. Geol. Soc. Am. Bull. 1976, 87, 725–737. [Google Scholar] [CrossRef]
  32. Zhao, L.; Dai, S.; Graham, I.; Wang, P. Clay mineralogy of coal-hosted Nb-Zr-REE-Ga mineralized beds from Late Permian strata, eastern Yunnan, SW China: Implications for paleotemperature and origin of the micro-quartz. Minerals 2016, 6, 45. [Google Scholar] [CrossRef]
  33. Bohor, B.F.; Triplehorn, D.M. Tonsteins: Altered Volcanic-Ash Layers in Coal-Bearing Sequences; Special Paper; Geological Society of America: Boulder, CO, USA, 1993; Volume 285, p. 40. [Google Scholar]
  34. Zielinski, R.A. Element mobility during alteration of silicic ash to kaolinite-a study of tonstein. Sedimentology 1985, 32, 567–579. [Google Scholar] [CrossRef]
  35. Kiipli, T.; Hints, R.; Kallaste, T.; Verš, E.; Voolma, M. Immobile and mobile elements during the transition of volcanic ash to bentonite—An example from the Early Palaeozoic sedimentary section of the Baltic Basin. Sediment. Geol. 2017, 347, 148–159. [Google Scholar] [CrossRef]
  36. Hayashi, K.-I.; Fujisawa, H.; Holland, H.D.; Ohmoto, H. Geochemistry of ~1.9 Ga sedimentary rocks from northeastern Labrador, Canada. Geochim. Cosmochim. Acta 1997, 61, 4115–4137. [Google Scholar] [CrossRef]
  37. Price, N.B.; Duff, P.M.D. Mineralogy and chemistry of tonsteins from Carboniferous sequences in Great Britain. Sedimentology 1969, 13, 45–69. [Google Scholar] [CrossRef]
  38. Spears, D.A.; Rice, C.M. An Upper Carboniferous tonstein of volcanic origin. Sedimentology 1973, 20, 281–294. [Google Scholar] [CrossRef]
  39. Spears, D.A.; Kanaris-Sotiriou, R. Titanium in some Carboniferous sediments from Great Britain. Geochim. Cosmochim. Acta 1976, 40, 345–351. [Google Scholar] [CrossRef]
  40. Loughnan, F.C. Chemical Weathering of the Silicate Minerals; American Elsevier Pub. Co.: Atlanta, GA, USA, 1969. [Google Scholar]
  41. Zhao, L.; Ward, C.; French, D.; Graham, I. Major and trace element geochemistry of coals and intra-seam claystones from the Songzao Coalfield, SW China. Minerals 2015, 5, 870–893. [Google Scholar] [CrossRef]
  42. Winchester, J.A.; Floyd, P.A. Geochemical discrimination of different magma series and their differentiation products using immobile elements. Chem. Geol. 1977, 20, 325–343. [Google Scholar] [CrossRef]
Figure 1. Provinces in SW China (A) and the location and tectonic map of the Huayingshan Coalfield (B), modified from Dai et al. [9].
Minerals 07 00092 g001
Figure 2. Sedimentary sequences at the Huayingshan Coalfield, SW China, modified from Dai et al. [9].
Minerals 07 00092 g002
Figure 3. Comparison between proportions of major element oxides in tuff samples from the Lvshuidong mine, inferred from Siroquant and determined by XRF. The diagonal line represents equality in each plot. Relevant trend lines and correlation coefficients (r), obtained from linear regression analysis, are also shown in each case.
Minerals 07 00092 g003
Figure 4. XRD patterns showing minerals identified in sample 3 (upper) and 18 (lower). Cl = chlorite; I = illite; K = kaolinite; F = florencite; A = anatase; C = calcite; R = rutile; P = pyrite; J = jarosite.
Minerals 07 00092 g004
Figure 5. Column sections showing vertical variations in major minerals (wt %) in the studied tuff samples.
Minerals 07 00092 g005
Figure 6. SEM backscattering images of the clay minerals. (A) Vermicular aggregates of kaolinite, in a kaolinite groundmass of sample 12. Small white anatase particles disseminated in the groundmass. (BD) Associations of kaolinite and illite in sample 5. The spectra of Spots 1 and 2 are the EDS data for kaolinite and illite in (D).
Minerals 07 00092 g006
Figure 7. Optical photomicrographs of minerals in the samples. (A,B) Crossed polarized light (XPL) images of kaolinite with multiple illite rims, probably after micro-lapilli (chalazoidite), in samples 5 and 4, respectively; (C) XPL image of illite-rimmed clay mineral, probably after fragments of pumice and glass shards in sample 4; (D) XPL image of kaolinite and chlorite probably after a bubbled volcanic glass in sample 4; (E) Plane polarized light (PPL) image of kaolinite vein cutting through clay concretions in sample 4; (F) XPL image of Illite and possible hematite after volcanic glass in sample 5.
Minerals 07 00092 g007
Figure 8. Images of minerals in the sample 12. (A) PPL image of pyrite overprint clay concretions; (B) SEM backscattering image of pyrite surrounded by kaolinite and carbonate minerals; (C,D) SEM backscattering images of kaolinite with pyrite rim(s); (E) PPL image of concretion consisting of analcite, kaolinite and ankerite; (F) XPL image of (E).
Minerals 07 00092 g008
Figure 9. Column sections showing vertical variations in the ratios of selected elements in the studied tuff samples.
Minerals 07 00092 g009
Figure 10. Relationship between concentrations of selected elements and minerals in the samples. (A) Total REY against P2O5; (B) Total REY against total clay minerals; (C) Niobium against anatase; (D) Zirconium against anatase; (E) Tantalum against niobium; (F) Hafnium against zirconium. Relevant trend lines and correlation coefficients (r), obtained from linear regression analysis, are also shown in each case.
Minerals 07 00092 g010
Figure 11. Distribution patterns of REY in the Lvshuidong tuff samples. REY are normalized to upper continental crust (UCC) [24].
Minerals 07 00092 g011
Figure 12. Plots of elements in the studied samples from the Lvshuidong Coalfield. (A) Relations between Al2O3 and TiO2. (B) Diagram showing Zr/TiO2 vs. Nb/Y ratios using the magma source discrimination diagram of Winchester and Floyd [42].
Minerals 07 00092 g012
Figure 13. Evaluation of REY in the studied samples in the Lvshuidong mine. Coutl = [(Nd + Eu + Tb + Dy + Er + Y)/ΣREY]/[(Ce + Ho + Tm + Yb + Lu)/ΣREY].
Minerals 07 00092 g013
Table 1. Mineralogy of the samples from the Lvshuidong mine by XRD and Siroquant (wt %; the thickness of each bench is 10 cm).
SampleQuartzKaoliniteIlliteChloritePyriteCalciteAnkeriteHematiteAnalciteAnataseRutileFlorenciteJarositeBassanite
1-42.525.7-25.60.3--0.63.7-0.71-
2-41.742-10.71---4.1-0.5--
30.334.442.43.814.2----4.4-0.40.1-
4-57.134.7-1.40.1--0.55.5-0.6--
5-63.527.7-2.90.1---5-0.8--
6-797.6-5.1--1.3-5.70.60.9--
7-70.26-15.20.5-1.3-5.20.20.80.5-
8-79.66.3-5.30.4-1.1-6.10.50.7--
9-80.95.4-4.7-0.31.2-6.20.50.7--
10-78.73.7-7.10.6-1.3-7.30.40.8--
11-81.64.3-3.40.5-0.8-8.10.60.8--
12-81.25.4-3.80.41.2--6.90.50.7--
130.1814.3-4.80.40.61-6.60.40.7--
140.1764.7-11.1--0.9-5.50.60.60.5-
15-65.54-23.70.6---3.60.20.51.10.8
160.371.2--20.81.3---4.20.60.61.1-
17-63.53.5-27.70.7---3.7-0.40.6-
18-67.6--25.30.5---4.20.50.61.1-
19-58.44.3-31.60.5---3.50.30.50.9-
200.247.26.8-39.60.3---3.6-0.30.71.1
Table 2. Concentrations of major element oxides (%) and trace elements (μg/g, Hg in ng/g) in the studied samples.
SampleLOISiO2TiO2Al2O3Fe2O3MgOCaOMnONa2OK2OP2O5TotalLiBeFScVCrCoNiCuZn
116.732.42.927.016.20.350.250.020.192.990.1482.59944.979623298267771546222
213.837.13.829.98.80.370.790.050.23.550.1384.513484.9718253913026811319730
313.736.73.830.39.90.370.110.0030.23.940.1385.422314.563722348252376722133
411.842.25.633.51.90.260.150.0050.163.140.2187.218265.762521562746326734635
512.641.15.533.33.50.210.10.0030.142.420.2186.416285.858019355629387252016
613.939.95.633.14.60.160.190.0040.121.270.2185.114205.856619595520511034940
718.431.84.228.314.60.180.350.050.110.710.1580.59684.6401114514686011016393
814.638.65.832.15.80.210.370.050.120.970.284.310735.6511175835686510613073
914.639.16.532.64.40.190.30.020.120.830.284.311315.952216514453100225276100
1016.038.36.531.84.30.170.340.020.110.690.1982.510005.34511458247396249265118
1114.039.28.032.43.60.150.390.020.090.610.2384.610295.4412196555126214731473
1214.139.36.732.43.90.230.680.040.10.770.2184.49515.1390194524714512325273
1314.538.96.632.44.40.180.350.020.110.70.283.99445.1380175943774813933870
1417.934.74.929.910.60.140.110.0030.10.690.1681.29274.3338145007102491243142
1520.429.63.226.817.90.130.460.010.080.430.1278.63653.24142031445325109208123
1619.330.83.427.916.30.140.410.010.10.480.1279.79463.64142632851032169205120
1720.429.33.126.718.60.140.290.010.10.430.178.88243.4390243075142817918571
1820.029.83.227.117.80.150.320.010.10.470.1279.16373.3429252814152914819670
1922.226.32.624.522.40.180.250.0050.110.490.0877.04432.93512125243618125173356
2023.523.72.422.225.50.190.540.010.10.660.0875.33702.2318192514321178147233
SampleGaGeRbSrYZrNbMoCdInSnSbCsBaHfTaHgTlPbBiThU
1432.538.773072614830.670.910.257.91.774.299175.41900.37301.57195.6
2513.731.524250738960.5910.559.51.783.759195.92020.17231.11162.7
3533.946.953450724940.380.960.758.80.63.578195.8650.191.63142.3
4463.835.5569429581250.521.230.5710.30.934.086257.7850.04130.97163.0
5412.723.2186388731220.021.170.692.10.363.851227.7840.04111.26163.0
6422.314.7543369481261.221.240.259.32.583.490257.92550.13131.94115.0
7373.410.0647217841050.811.40.369.03.583.0100216.62490.45191.05103.2
8473.110.9464319831330.851.550.3910.83.513.492258.11670.11161.09164.8
9493.29.83883010411400.731.720.513.53.743.395278.91580.08361.48163.1
10443.57.54292611621580.491.950.5113.32.972.9104299.61620.07281.53152.9
11513.75.52213112411700.881.880.6213.42.162.9583310.71180.06261.54193.6
12502.44.63252510341500.021.650.552.40.152.770278.91080.04230.86163.1
13504.05.22472210371120.531.580.4911.21.452.857275.71060.05181.1103.0
14434.08.1357208881300.711.830.6611.71.322.973249.01571.37291.23132.9
15312.06.848237628820.431.370.468.712.582175.12547.53282.11203.0
16351.97.851841657861.511.420.49.02.872.990185.51532.35801.51213.6
17321.87.343035600780.511.140.387.82.632.975164.81962.72941.58213.8
18331.77.749830609800.551.210.358.42.422.996165.12045.24672.88193.3
19281.77.932024555680.562.250.626.81.922.563144.41942.562740.68164.0
20271.28.433425469930.913.950.395.62.41.857125.81270.82660.61143.3
LOI = Loss on ignition.
Table 3. Rare earth elements and yttrium in the studied samples (μg/g).
SampleLaCePrNdSmEuGdTbDyYHoErTmYbLuEuN/EuN*CeN/CeN*(Y/Ho)N(La/Yb)NREO
14.703.733.573.563.644.834.243.453.913.293.503.643.613.453.341.350.900.941.36927
24.663.883.693.512.993.423.482.632.842.282.432.452.332.232.191.190.930.942.09880
33.573.542.922.942.933.553.452.782.882.252.362.372.242.072.031.231.090.951.72770
47.715.446.646.435.025.475.213.232.701.922.031.871.731.701.631.230.760.954.551304
57.415.286.686.525.005.595.043.112.551.721.851.701.611.551.501.280.750.934.791270
66.805.136.156.195.045.574.742.922.411.611.751.641.551.511.471.280.790.924.491206
74.713.444.464.503.693.803.271.951.540.951.091.000.910.900.841.220.750.875.21829
86.664.696.466.555.385.554.762.912.311.401.641.531.391.401.341.220.720.864.751170
97.054.306.476.405.375.724.762.912.241.371.591.431.271.241.191.250.640.865.681143
106.784.386.556.595.645.824.792.772.101.191.411.241.121.091.031.240.660.846.211141
117.814.897.567.736.546.525.363.142.411.421.691.571.451.431.341.200.640.845.451308
127.174.876.886.955.815.644.682.671.991.151.391.281.211.161.161.180.690.836.161219
136.794.486.646.525.325.144.272.471.861.001.281.181.121.101.061.170.670.796.171136
144.993.594.824.904.033.763.251.981.580.911.141.101.031.021.001.120.730.804.90876
154.283.503.853.863.403.653.422.482.461.661.961.982.002.152.091.180.860.851.99821
164.623.944.114.023.523.733.612.702.631.862.092.132.122.232.131.150.900.892.07895
174.073.293.553.492.983.193.112.382.361.601.881.901.942.091.971.150.860.851.95768
184.483.653.873.793.263.453.342.362.201.341.661.681.761.861.751.160.870.812.41826
193.182.542.562.411.982.162.191.661.661.091.331.371.451.531.501.150.890.822.08572
202.752.332.272.161.832.011.991.501.531.141.251.301.331.451.381.170.930.911.91520
REO, sum of oxides of rare earth elements and yttrium; subscript N indicates values normalized by the average REY content of upper continental crust [24]. EuN/EuN* = EuN/(0.67SmN + 0.33TbN); CeN/CeN* = 2CeN/(LaN + PrN).

