Correlation of Hydrocarbon Reservoir Sandstones Using Heavy Mineral Provenance Signatures: Examples from the North Sea and Adjacent Areas

1
HM Research Associates Ltd., Giddanmu, St Ishmaels, Pembrokeshire SA62 3TJ, UK
2
CASP, University of Cambridge, Madingley Rise, Cambridge CB3 0UD, UK
3
HM Research Norway A/S, Furuveien 7A, 4025 Stavanger, Norway
*
Author to whom correspondence should be addressed.
Minerals 2018, 8(12), 564; https://doi.org/10.3390/min8120564
Submission received: 18 October 2018
/
Revised: 21 November 2018
/
Accepted: 24 November 2018
/
Published: 3 December 2018
(This article belongs to the Special Issue Heavy Minerals: Methods & Case Histories)
Abstract
:Correlation of hydrocarbon reservoir sandstones is one of the most important economic applications for heavy mineral analysis. In this paper, we review the fundamental principles required for establishing correlation frameworks using heavy mineral data, and illustrate the applications of a wide variety of heavy mineral techniques using a number of case studies from hydrocarbon reservoirs in the North Sea and adjacent areas. The examples cover Triassic red-bed successions in the central North Sea and west of Shetland, which have been subdivided and correlated using provenance-sensitive ratio data and mineral morphologies; Middle Jurassic paralic sandstones in the northern North Sea, correlated using garnet geochemistry; Upper Jurassic deep water sandstones in the northern North Sea, discriminated using rutile geochemistry and detrital zircon age data; and the “real-time” application of the technique at well site in Devonian-Carboniferous fluvio-lacustrine sandstones of the Clair Field, west of Shetland.
1. Introduction
One of the most important practical economic applications of heavy mineral analysis is the correlation of sandstones that host reserves of oil and gas. Correlation is one of the key components required to build a petroleum reservoir model, because it places fundamental constraints on the understanding of the reservoir architecture. Correlation of reservoir sandstones is therefore crucial for optimising recovery of our ever-decreasing supply of hydrocarbons. Biostratigraphy, integrated with seismic and geophysical log interpretation, remains the principal tool for oilfield correlation [1]. However, there are many situations where biostratigraphic data lack sufficient resolution, for example due to unfavourable depositional conditions (such as non-marine or paralic settings or very rapid sedimentation in marine environments) or deep burial alteration causing degradation of the biostratigraphic signal.
In such cases, alternative methods are required [2,3]. In broad terms, three distinct approaches have been followed: sequence stratigraphic methods (such as core- and outcrop-based sedimentological criteria, geophysical log correlation, and seismic reflection data); direct or indirect dating (such as radiometric dating, magnetostratigraphy, and seawater 87Sr/86Sr analysis), and provenance-based analytical techniques. Heavy mineral correlation belongs to the third of these categories. It is one of a family of provenance-based tools that also includes chemostratigraphy [4,5], Sm-Nd isotope stratigraphy [6,7] and clay mineral stratigraphy [8,9].
2. Background
The successful application of any provenance-based correlation method depends on the presence of changes in sediment provenance or transport history during deposition of the succession in question. These changes are reflected in the mineralogy and geochemistry of the sediment, and can therefore be detected by one or more of the various analytical techniques. The main problem with provenance-based methods is that a number of other processes capable of affecting bulk mineralogy and geochemistry operate during the sedimentary cycle ([10] and references therein). These processes are:
- weathering at source, prior to incorporation in the transport system
- mechanical breakdown during transport
- weathering during periods of alluvial storage on the floodplain
- hydraulic processes during transport and final deposition
- diagenesis during deep burial
- weathering at outcrop
These processes can partially or totally mask the variations caused by changes in provenance, and reliable provenance-based correlations therefore crucially depend on filtering out the effects of these overprinting factors. The most important factors that bias the provenance signal are hydrodynamic processes during transport and deposition and diagenesis during deep burial [10,11]. Weathering is also an important control in some instances, but mechanical abrasion is not believed to be of great importance in most circumstances [10,12].
Heavy mineral analysis is especially well-placed to identify changes in provenance in clastic successions. This is (i) because of the long history of research into the controls on assemblage compositions, and (ii) because the knowledge gained has enabled recognition of parameters that either minimise the effects, or are entirely independent of, these factors. In addition, the method is especially well suited to application in the hydrocarbon industry because it deals with individual particles that constitute the sample, rather than the attributes of bulk samples. Consequently, data can be generated equally well from ditch cuttings (by far the most common sample type available) as from cores and sidewall cores, because the effects of components added to the drilling mud system (such as mud-weighting agents) can be eliminated.
3. History of Application
Almost immediately after it was recognised that heavy mineral assemblages provide important constraints on the provenance of sand and sandstone, e.g., [13,14,15], applications to the petroleum industry became commonplace. Examples of this early work includes studies by Reed [16] and Reed and Bailey [17] on the Tertiary of California; by Hedberg [18] on the Tertiary of the Maracaibo Basin, Venezuela; by Edson [19] on the Paleozoic of the mid-continental US; and by Bornhauser [20] and Cogen [21] on the Tertiary of the US Gulf Coast. The work by Reed [16] and Reed and Bailey [17] showed that high-resolution correlation is possible using a variety of heavy minerals, principally amphibole, pyroxene, epidote, zircon, and titanite. Hedberg [18] showed that heavy mineral data accurately identified an unconformity surface on the basis of the distribution of andalusite, sillimanite, kyanite, staurolite, garnet, apatite, and chloritoid, and that this surface could be traced for at least 35 km. Edson [19], by contrast, considered that correlation is possible even using the relatively impoverished heavy mineral suites found in Ordovician and Carboniferous sandstones of the mid-continental US. Bornhauser [20] and Cogen [21] demonstrated the existence of variations in amphibole, epidote, kyanite, and staurolite in the Tertiary of the US Gulf Coast, and used these to construct a series of heavy mineral zones. Key observations from the work of Cogen [21] were that (i) heavy mineral assemblages become less diverse with increasing burial depth, and (ii) the boundaries between the heavy mineral zones cross-cut stratigraphic boundaries.
Even at this early stage, warning signs concerning the instability of several detrital heavy minerals had started appearing, e.g., [22,23]. A key period in the application of heavy minerals to correlation issues was the early 1940’s, with the virtually simultaneous publication of four papers that all demonstrated the extensive nature of heavy mineral dissolution in the subsurface [24,25,26,27]. This coincided with the observation that heavy mineral zonal boundaries cross-cut stratigraphic boundaries in the Tertiary of the US Gulf Coast [21], implying that heavy mineral stratigraphy may be suspect. Consequently, from this point onwards, applications of heavy minerals for stratigraphic purposes declined markedly, and very few papers on this topic appeared in the literature for several decades, a significant exception being the work of Feo-Codecido [28].
Interest in the application of heavy mineral analysis for hydrocarbon reservoir stratigraphy was rekindled during the 1980’s. This was partly because of the increased understanding of heavy mineral behaviour during diagenesis in the subsurface e.g., [29,30,31,32], which led to the recognition of which minerals, and which mineral parameters, could be regarded as reliable provenance indicators in highly diagenetically-modified sandstones [33,34]. Concurrently, developments in microbeam analytical techniques had started to enable major element geochemical characterisation of stable or ultrastable heavy mineral components, such as garnet [35] and tourmaline [36]. At the same time, textural studies of individual stable heavy mineral components, notably apatite, tourmaline, and zircon, showed that variations in these parameters could be used for correlation purposes in biostratigraphically-barren hydrocarbon-bearing reservoir successions of the UK, such as the Devonian [37] and the Triassic [34,38]. More recently, continued developments in analytical techniques have increased the scope for the application of single-grain geochemistry for evaluation of changes in provenance, including trace element data from diagenetically-stable phases such as apatite and rutile e.g., [39,40], and U-Pb isotopic data from ultrastable phases such as zircon [41,42]. As a result, there is now a wide range of heavy mineral analytical methods available for correlation purposes. In this paper, we demonstrate the application of a variety of heavy mineral approaches to a number of different hydrocarbon reservoir successions in the North Sea and adjacent areas (Figure 1).
4. Correlation Using Conventional Heavy Mineral Assemblages: Strathmore Field, West of Shetland
Most Triassic sandstones in and around the British Isles were deposited in fluvial and aeolian environments under arid to semi-arid conditions [43]. Red-bed facies are therefore widespread and biostratigraphic controls are generally scarce. This is the situation in the Strathmore Field, which lies in the East Solan Basin, west of Shetland (Figure 1), and which hosts hydrocarbons in the Triassic [44]. Correlation of the Triassic succession in the Strathmore Field therefore has important economic implications. The Triassic, which is up to 1000 m thick, comprises two sand-rich formations, the Otter Bank Formation overlain by the Foula Formation (Figure 2). The Otter Bank Formation is underlain by the Otter Bank Shale Formation, dated as Griesbachian (basal Induan) on the basis of a distinctive palynological assemblage [44,45].
The Otter Bank Formation consists of braided sandy fluvial deposits overlain by interbedded fluvial and aeolian sabkha deposits. A very sparse palynological assemblage suggests an Early Triassic age [45], with palaeomagnetic data suggesting deposition in the Diererian-Smithian (mid Early Triassic). The Foula Formation comprises interbedded fluvial and aeolian sabkha deposits overlain by wholly fluvial deposits higher in the succession. Palynological constraints are poor but suggest that deposition began in the Ladinian and extended into the Carnian, and palaeomagnetic data are also consistent with a Ladinian age [45].
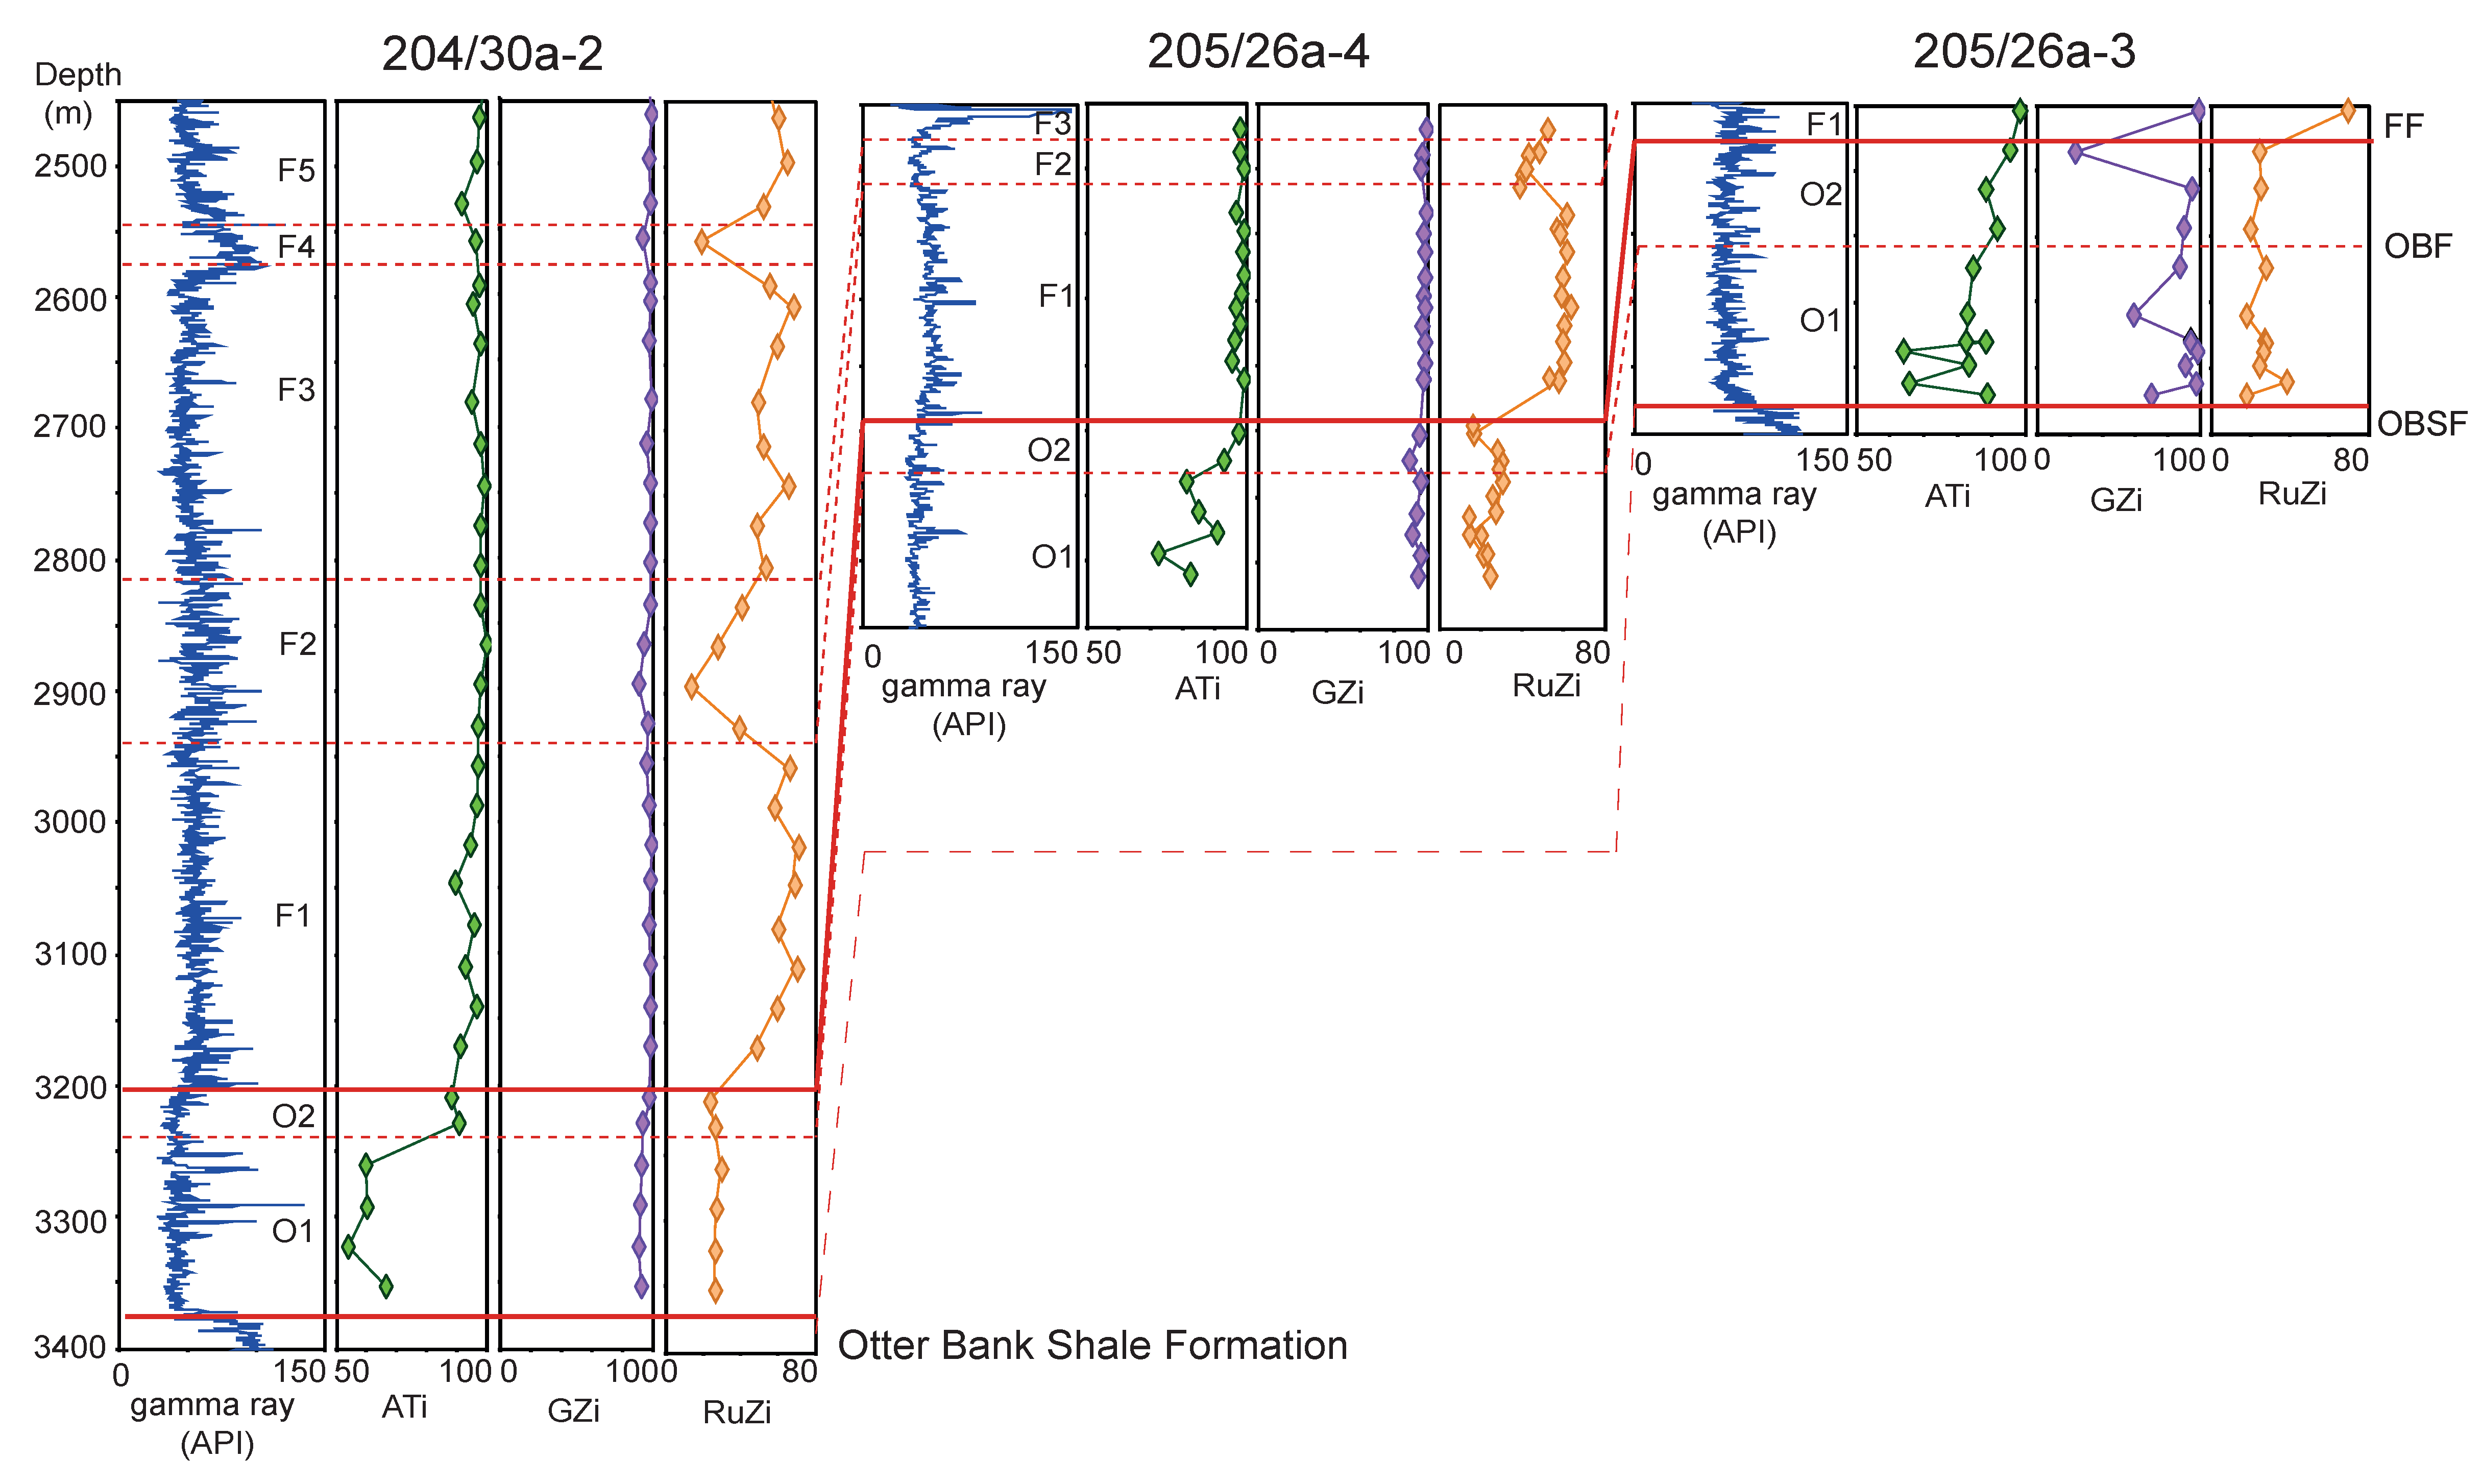
Morton et al. [49] showed that the Triassic succession in three wells (204/30a-2, 205/26a-3, and 205/26a-4) from the Strathmore Field can be subdivided and correlated using conventional heavy mineral data (i.e., data collected by optical analysis using the petrographic microscope). The correlation depends on variations in three key provenance-sensitive ratio parameters, apatite:tourmaline (ATi), garnet:zircon (GZi), and rutile:zircon (RuZi), as defined by Morton and Hallsworth [33].
The heavy mineral assemblages in sandstones from 205/26a-3 and 205/26a-4 were characterised exclusively using core material. However, only three short cores were taken in 204/30a-2, and the heavy mineral stratigraphy for this well was mainly constructed using data from ditch cuttings.
In all three wells, the lower part of the succession has relatively low RuZi (ca. 20–30), but this rises to ca. 60 coincident with the boundary between the Otter Bank Formation and the Foula Formation as defined by a change on the gamma ray log (Figure 3). The increase in RuZi is mirrored by GZi, although the rise is less dramatic. Provenance-sensitive heavy mineral data therefore enable subdivision of the succession into heavy mineral unit O (below) and heavy mineral unit F (above).
These units can be further subdivided, principally using ATi and RuZi. ATi is consistently high in the Foula Formation but an upward-increasing trend in ATi defines a two-fold subdivision of the Otter Bank Formation into subunits O2 and O1 (Figure 3). Most of the Foula Formation has high RuZi, but two thin zones in 204/30a-2 have lower values (Figure 3). Variations in RuZi therefore enable subdivision of Unit F into five subunits, three with high RuZi (F1, F3, and F5) and two intervening intervals with low RuZi (F2 and F4). The two subunits with low RuZi are also characterised by slightly lower GZi. The lower of the two low-RuZi subunits (F2) can also be traced into the cored well 205/26a-4.
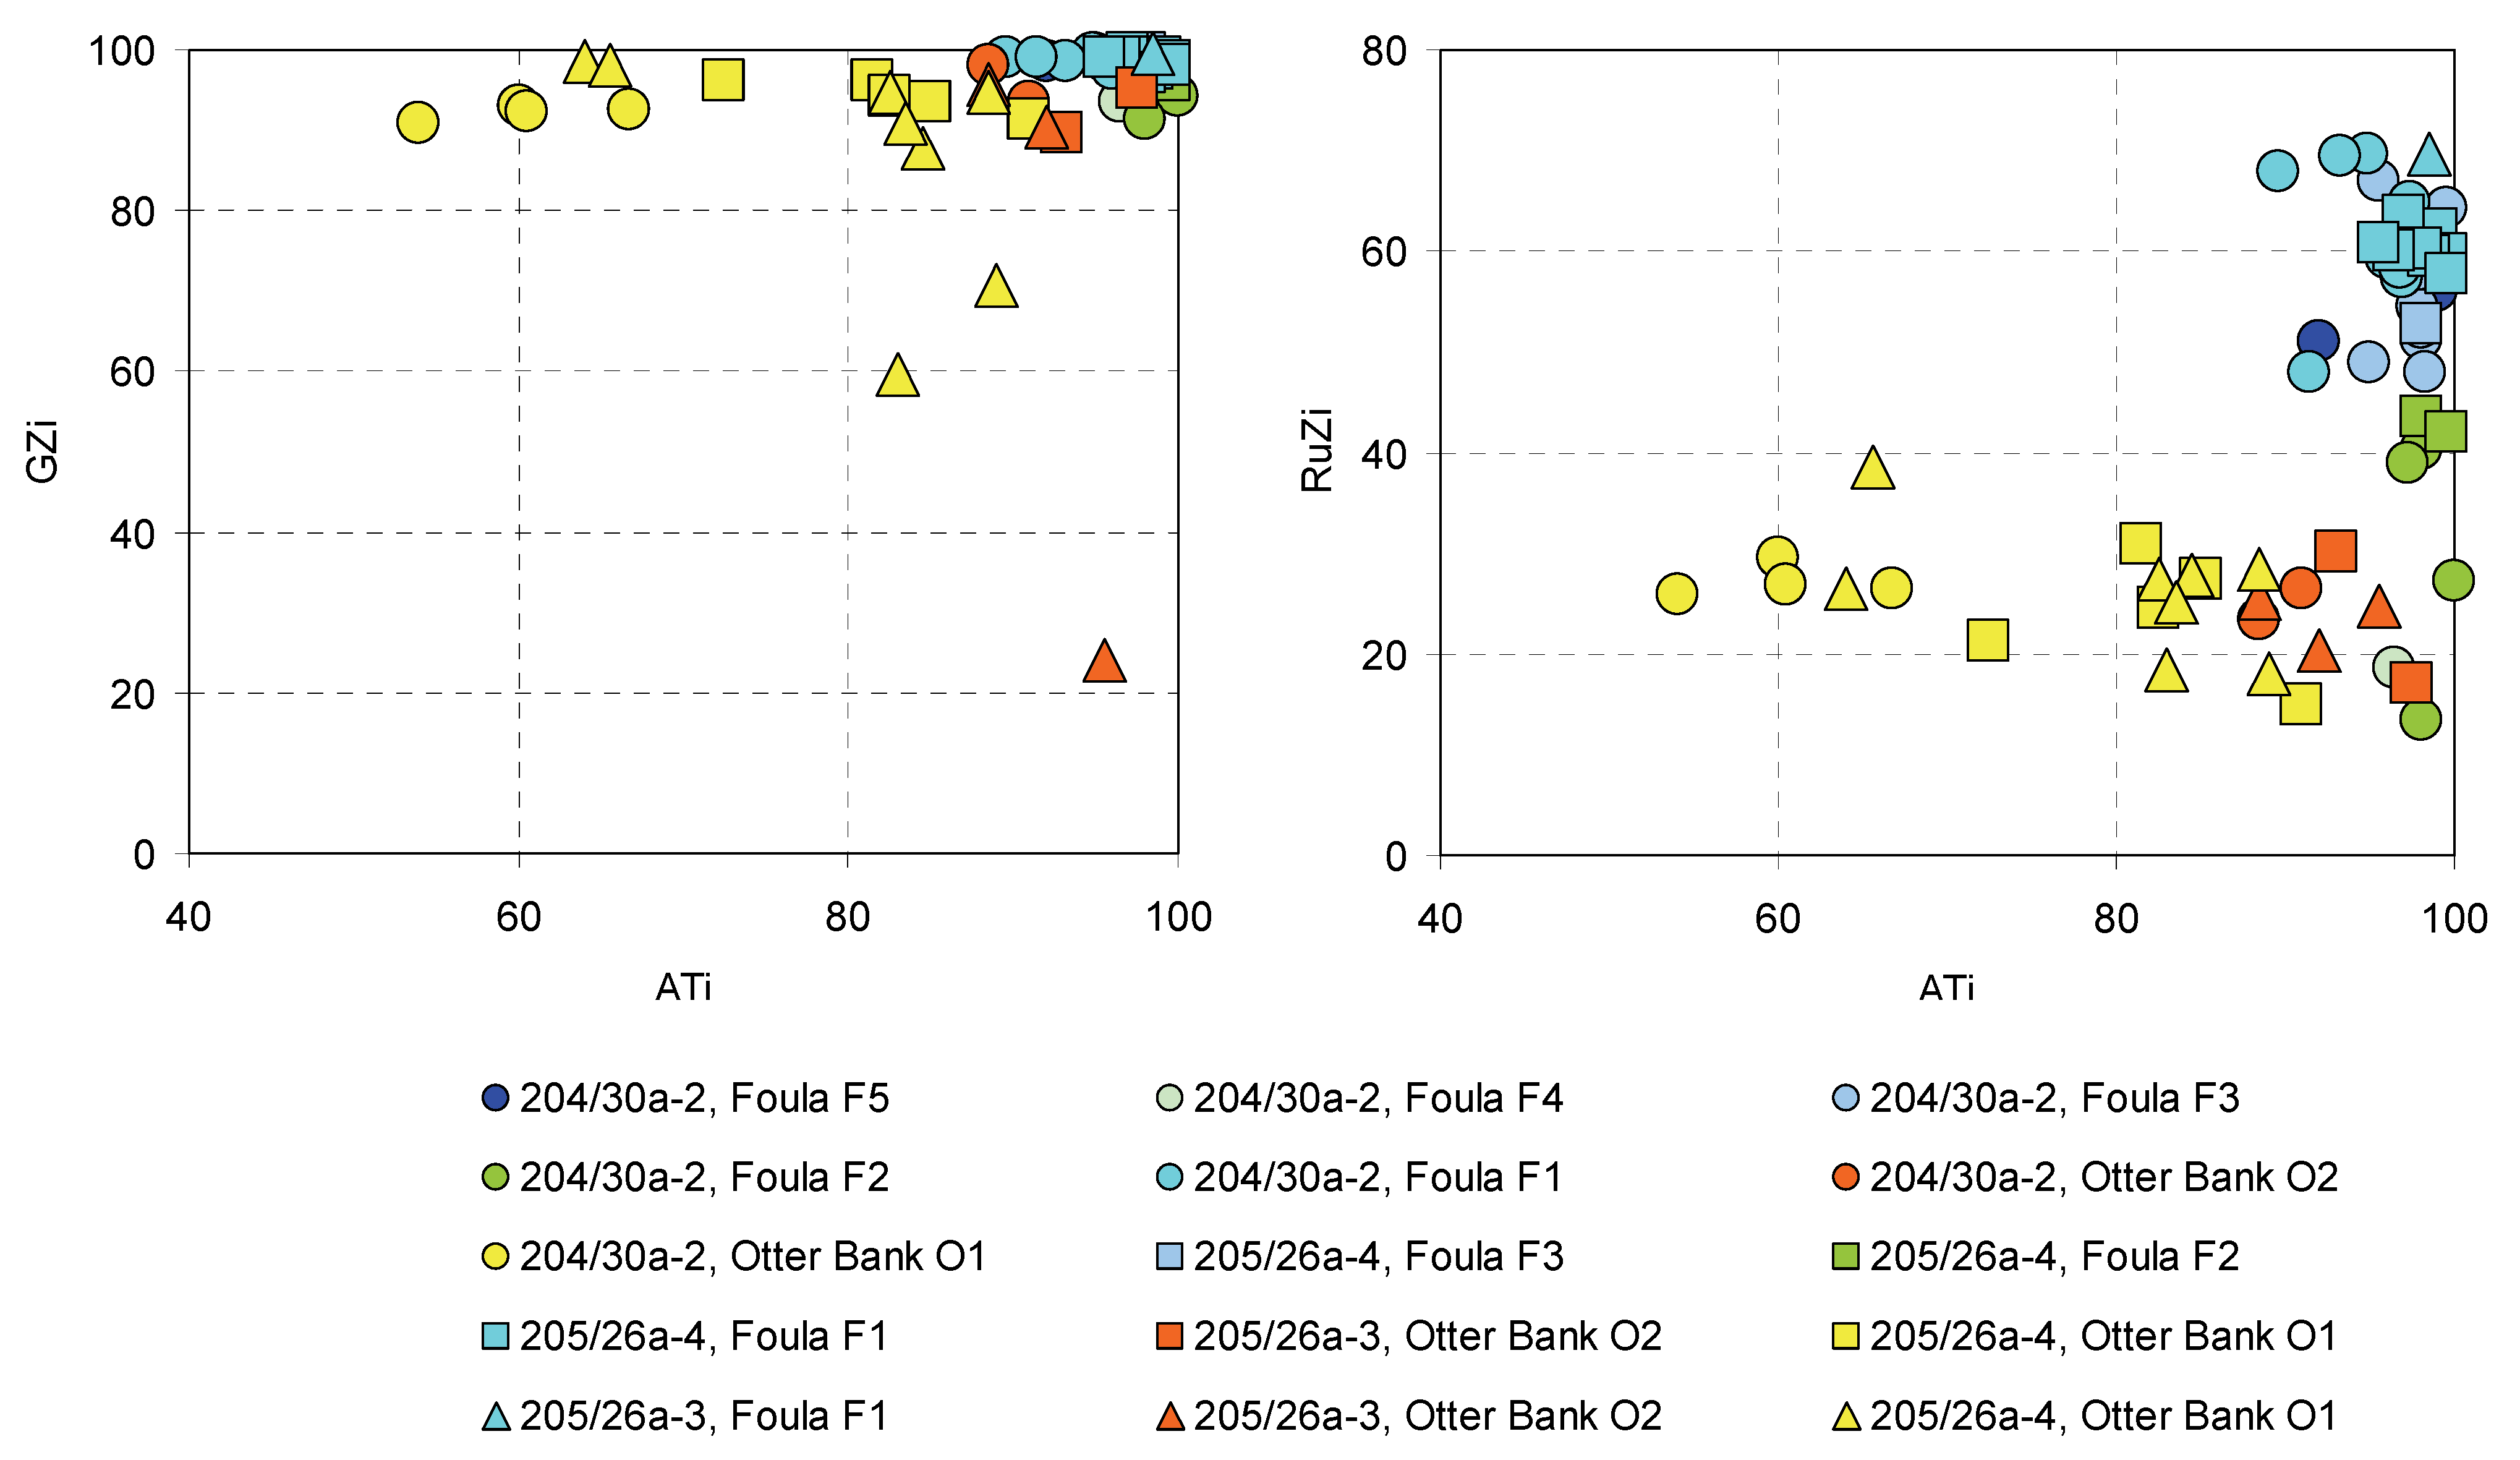
In summary, variations in RuZi, GZi, and ATi enabled the establishment of a high-resolution stratigraphic framework for the Triassic of the Strathmore Field, with correlations between the three analysed wells being clearly evident (Figure 3). The clear distinction between the units and subunits is also manifested by cross-plots of the ratio parameters (Figure 4). Foula Formation samples form well-defined clusters, with very high ATi and GZi and generally high RuZi. Otter Bank samples show greater variation, but display little overlap with the Foula Formation. They have uniformly low RuZi, and have generally lower ATi and GZi than the Foula Formation. The only area of overlap concerns subunit F2, subunit F4 and unit O, since all three intervals have similar RuZi, GZi, and ATi values (Figure 4). Further support for changes in provenance in the Triassic of the Strathmore Field are given by garnet geochemical and zircon U-Pb data [49], but the conventional heavy mineral data nevertheless provide a stand-alone correlation framework.
The Strathmore Field correlation study enabled a comparison between data acquired from core and ditch cuttings. Core data can be regarded as reliable since their position within the well is accurately known and they are generally uncontaminated or otherwise altered during the drilling process. Ditch cuttings samples, however, represent material composited across a range of depths (dependent on the sampling frequency), are subject to contamination by downhole caving and drilling mud additives, and are also subject to modification owing to the mechanical action of the drill bit.
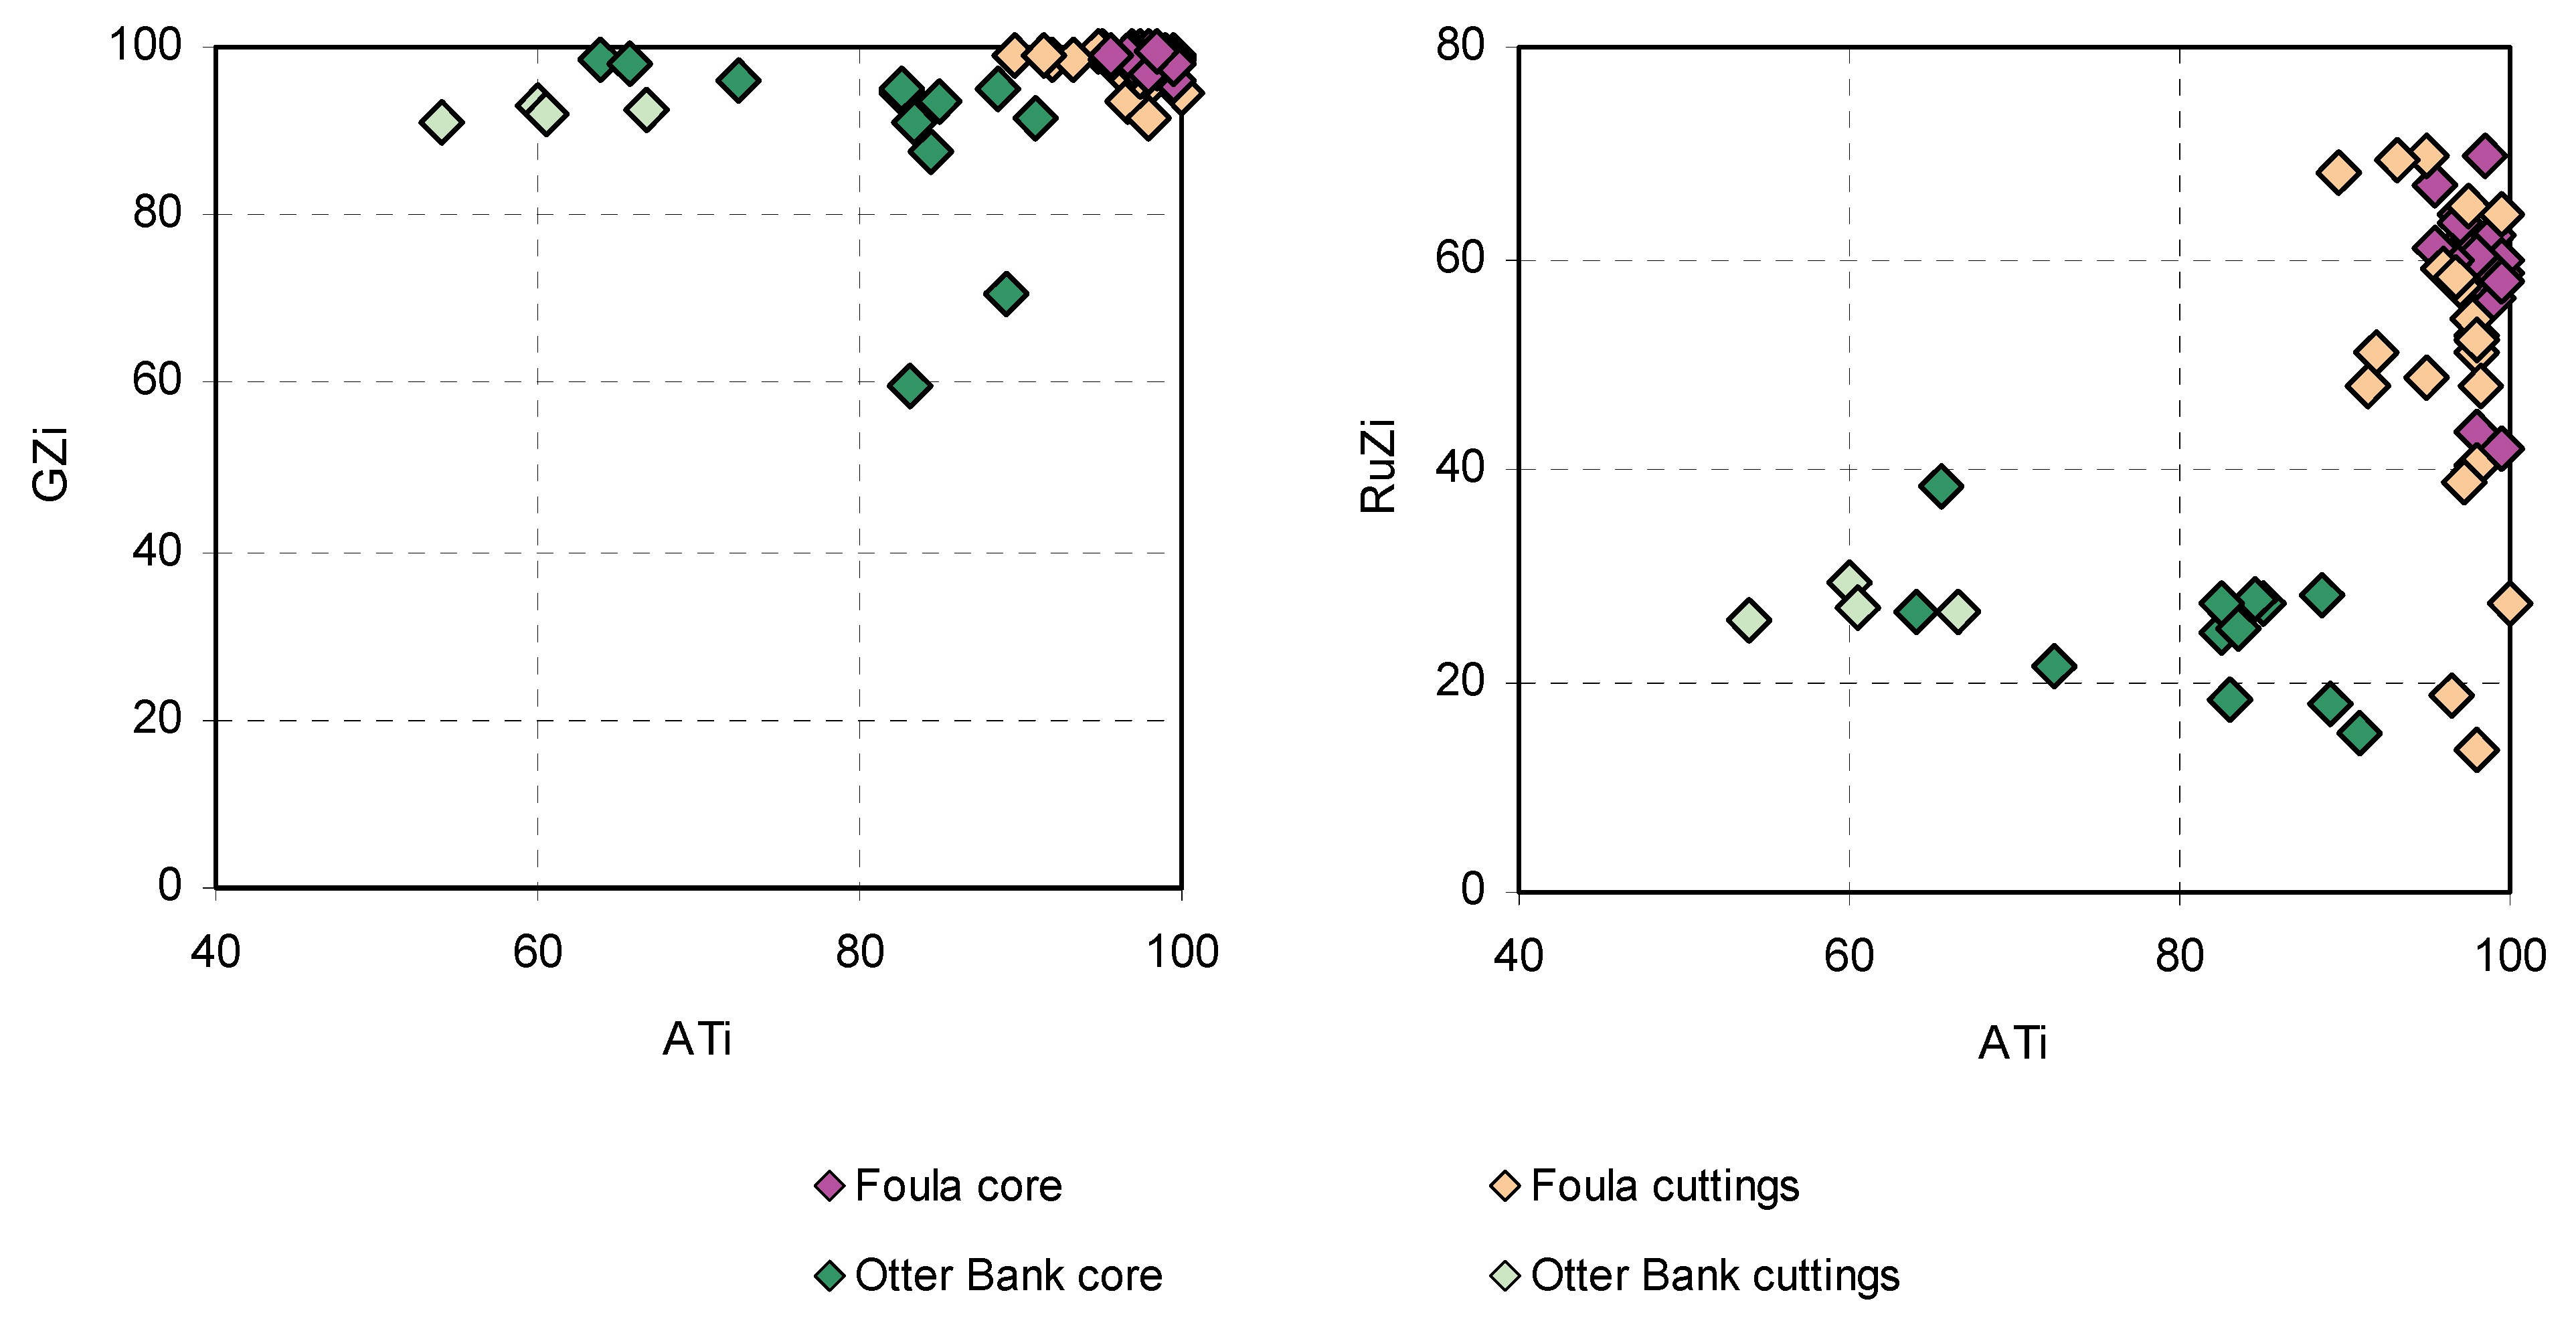
There is evidence for contamination of ditch cuttings samples in the Triassic of Strathmore. Core samples contain virtually no epidote, calcic amphibole, or clinopyroxene, but in the cuttings, these minerals form up to 4.0%, 2.5%, and 0.5% of the assemblages [49]. The presence of minor amounts of these minerals is likely to be due either to caving of lithologies from higher in the well bore, or to their inherent presence as contaminants in the drilling mud system. The deviation in assemblage composition between core and cuttings illustrates the problems that can be associated with interpretation of heavy mineral data from ditch cuttings, and shows the advantages of using provenance-sensitive ratios to characterise sandstones that might be subject to contamination because of the drilling process. Provenance-sensitive ratios show little difference between core and ditch cuttings (Figure 4), the only deviation being that some cuttings samples in the Otter Bank Formation of 204/30a-2 have marginally lower ATi than Otter Bank core samples. This is due to the susceptibility of apatite to mechanical loss compared with the other heavy minerals because of its lower hardness, causing it to be preferentially lost through the grinding action of the drill bit [10].
5. Correlation Using Heavy Mineral Morphology: Culzean Field Area, Central North Sea
The Triassic Skagerrak Formation, which hosts hydrocarbons in a number of fields in the central North Sea, has historically proved difficult to subdivide and correlate on biostratigraphic grounds. The Skagerrak Formation is interpreted to be a dryland terminal fluvial system, including arid terminal splay-like sheet flood deposits and more humid channel-confined and associated floodplain deposits [50]. The generally unfavourable red-bed lithologies, coupled with very deep burial, are responsible for the scarcity of palynological data over most of the region. Palynological data recovery is better in the southeastern part of the region (Quadrant 30), which enabled Goldsmith et al. [46,47] to subdivide the Skagerrak Formation into the Judy, Joanne, and Josephine Sandstone Members and intervening Julius, Jonathan, and Joshua Mudstone Members, and to assign stratigraphic ages to these members (Figure 2). However, recovery of age-diagnostic palynological floras has proved more elusive towards the northwest (Quadrant 22), and consequently heavy mineral stratigraphic studies have been conducted in this area in order to provide a correlation framework. These studies revealed that the assemblages are typically restricted in diversity [34,51], owing to extensive diagenetic modification of the detrital heavy mineral suite during deep burial. Mange-Rajetzky [34] noted that the monotonous nature of the assemblages precludes stratigraphic subdivision and correlation at heavy mineral species level, but observed the existence of distinct stratigraphic patterns in heavy mineral morphology (Figure 5), which she used to establish a semi-regional correlation framework. The initial work by Mange-Rajetzky [34] has been recently extended into the newly-discovered Culzean Field (Figure 1) and adjacent wells [48]. The Culzean discovery well (22/25a-9Z) is especially significant because it yielded relatively rich and age-diagnostic palynoflora assemblages, enabling the heavy mineral stratigraphy in the Quadrant 22 area to be tied into the biostratigraphically-based subdivision of the Skagerrak Formation into the various sandstone and mudstone members defined in wells from Quadrant 30 [46,47].
Mange-Rajetzky [34] used variations in morphology of apatite, tourmaline, and zircon in the template well 22/24b-5Z (Figure 5) to establish three main zones (SB, M, and A), with further subdivision of zone M into four subzones (q, d, c, and b). The study by Mouritzen et al. [48] concentrated on apatite morphology, since this phase is by far the most abundant component of the heavy mineral assemblages. Variations in the apatite roundness index (ARi) faithfully match the zones and subzones identified by Mange-Rajetzky [34] in well 22/24b-5Z (Figure 6). Another parameter that proved useful is zircon:apatite (ZAi), which is very low at the base of the succession but shows distinct increases higher in the stratigraphy. However, this parameter is heavily influenced by hydrodynamic conditions at the time of deposition, since it compares the relative abundance of apatite and zircon, which have contrasting densities (zircon being considerably denser than apatite). The overall upward increase in this parameter reflects the general upward-coarsening of the Triassic succession. Therefore, while variations in this parameter are stratigraphically useful on a local scale, they are unlikely to be applicable regionally. The reproducibility of the ARi and ZAi trends between the Marnock Field well 22/24b-5Z and the Culzean Field well 22/25a-9Z is illustrated in Figure 6. The consistency of these patterns enabled Mouritzen et al. [48] to define 6 heavy mineral zones, and by integrating the biostratigraphic information they were able to identify which of the key mudstone marker horizons found in Quadrant 30 [46,47] are present in the Quadrant 22 area.
The integrated heavy mineral and biostratigraphic correlation of the Skagerrak Formation in Quadrant 22 demonstrates that the majority of the reservoir succession in the Culzean wells is equivalent to the Joanne Sandstone Member and the overlying Jonathan Mudstone Member (Figure 7). The presence of the underlying Julius Mudstone Member and Judy Sandstone Member is proved by penetrations in the discovery well 22/25a-9Z (which also extends down into the top of the Marnock Mudstone) and in 22/25a-11. The wells from Egret (22/24d-10) and Heron (22/30a-6) yielded the same heavy mineral stratigraphy (Jonathan Mudstone Member, Joanne Sandstone Member and Julius Mudstone Member). By contrast, the successions in wells further to the northwest are largely assigned to the Judy Sandstone Member together with the underlying Marnock Mudstone and Smith Bank Formation. Younger Skagerrak units (Julius Mudstone Member and the lower part of the Joanne Sandstone Member) were identified in only two cases (22/24b-5Z and 22/24b-7).
In previous correlations of the Skagerrak Formation [50,52], the Egret and Heron wells (22/24d-10 and 22/30a-6) are considered to be directly correlative with Marnock and Skua wells (22/24b-5Z and 22/24b-7), with the reservoir succession being correlated with the Judy Sandstone Member. The Mouritzen et al. [48] correlation offers a different interpretation, whereby the successions in Egret and Heron are interpreted as equivalent to the Joanne Sandstone Member, whereas the Marnock and Skua wells contain both Judy and Joanne sandstones. The new correlation therefore indicates significant modification to the understanding of Triassic stratigraphy in Quadrant 22, and in particular that the Joanne Sandstone Member and Jonathan Mudstone Member are more widely distributed than was previously recognised.
6. Correlation Using Garnet Geochemistry: Oseberg Field, Northern North Sea
The potential value of single-grain major element geochemistry of detrital garnet populations for discriminating sandstones supplied by different transport systems, and for identifying sediment source areas, was first demonstrated by Morton [35]. This paper was followed not long afterwards by the first application of garnet geochemistry in hydrocarbon reservoir subdivision and correlation [53]. The oilfield concerned is Oseberg (Figure 1), where hydrocarbons are hosted by the Middle Jurassic Brent Group, comprising (from base to top) the Oseberg, Rannoch, Etive, Ness, and Tarbert formations [54,55]. The Oseberg Formation, which is the main reservoir, represents a local fan delta that prograded from east to west. The Rannoch-Etive, Ness, and Tarbert formations respectively represent the delta front-shoreline, delta plain, and abandonment phase of the Brent delta that migrated northwards across the Oseberg Field. When planning production strategy, it is crucial that the understanding of sandstone distribution is maximised, so that sand body geometry and channel orientation, which control permeability anisotropy, can be evaluated.
Three wells were used in the garnet stratigraphy study, 30/6-7, 30/6-9, and 30/6-10A [53,58]. Garnet populations in the Brent Group of these Oseberg Field wells show considerable heterogeneity (Figure 8), with representation of varying numbers of Type A (low-Ca, high-Mg), Type B (low-Mg, variable-Ca), and Type C (high-Mg, high-Ca) types as defined by Mange and Morton [57]. Type C garnets dominate throughout the Oseberg, Rannoch, and Etive formations, with the base of the Ness being marked by a major reduction in this garnet type and by a concurrent increase in Types B and A. The Ness Formation has garnet assemblages dominated by Type B with generally subordinate Type A, and the overlying Tarbert Formation has assemblages consistently dominated by Type A with subordinate Types B and C (Figure 8).
This case study therefore demonstrates the existence of laterally-consistent differences in garnet provenance in the Oseberg-Etive, Ness, and Tarbert intervals across the Oseberg Field, showing that the garnet geochemical method is a useful guide to stratigraphy at formation level. Possibly the most important outcome, however, is the identification of a change in garnet geochemistry between samples M and L, within what appears to be a massive sand development in the lower part of the 30/6-9 well (Figure 8). The garnet assemblages in samples I, J, K, and L are dominated by Type C garnets, consistent with a stratigraphic location within the Oseberg Formation. The overlying samples from the sand body (M and N), however, have assemblages dominated by Types B and A, corresponding to a stratigraphic position within the Ness. This observation indicates that the Etive, Ness, and top part of the Oseberg formations in 30/6-9 were eroded by a channel sand at the base of the Ness. The identification of a Ness channel sand in direct contact with the Oseberg fan-delta sands has important implications for production geology, since the two have markedly different geometries and, by association, permeability anisotropies.
A major challenge identified by Johnsen et al. [55] is to map the more isolated fluvial channel sandstones of the Ness Formation, which account for about 25% of the oil in place but only 10% of the reserves. The garnet data offer some important insights into the relationships between the Ness sandstones in the three analysed wells. For example, it is evident that some of the sand bodies are complex, since they have internal variations in garnet provenance characteristics. This is illustrated by samples Y and Z, from 30/6-10A, which have contrasting garnet assemblages, one dominated by Type B and the other by much higher contents of Type A. The garnet data therefore indicate that the samples are from different channel sands and that the analysed sand body is composite, with a sand-on-sand contact. By contrast, other sand bodies have uniform mineralogy: for example, samples T, U, V, and W in 30/6-10A, which were taken at relatively close spacing within a sand-rich interval, show virtually no difference in garnet assemblage compositions. Although intra-well correlations cannot be unequivocally assigned, the garnet data can be used to suggest likely correlations and to rule out other possibilities. For example, the sand body sampled at point G in 30/6-7 could correlate with that at point Y in 30/6-10A, since both garnet assemblages almost exclusively comprise Type B garnets. By contrast, the basal Ness sand body in 30/6-7 (sample E) cannot correlate with the basal Ness in 30/6-10A (samples T, U, V, and W) since the two samples have markedly different proportions of Type A garnets.
7. Correlation Using Rutile Geochemistry and Zircon Geochronology: Magnus Field, Northern North Sea
Deep-water basin floor fan sandstones assigned to the Magnus Sandstone Member (Kimmeridgian-Volgian) and the underlying Ptarmigan Sandstone Member (Oxfordian-Kimmeridgian) form the reservoir for the Magnus oilfield in the northern North Sea (Figure 1 and Figure 9). Since a high-resolution biostratigraphic correlation framework exists for the reservoir succession [59], alternative correlation schemes have not been considered a priority. However, there is no consensus of opinion on the source area for the Magnus sandstones. Fraser et al. [60] state that they were derived from an uplifted part of the Margareta Spur to the north of the Magnus Field, and De’Ath and Schuyleman [61] indicate the sandstones were introduced by a submarine fan system from the NW. The Ptarmigan Sandstone Member is believed to represent the initial products of the submarine fan system that subsequently led to deposition of the Magnus Sandstone Member [61]. Heavy mineral data have been acquired from three wells in and adjacent to the Magnus Field (211/7-1, 211/8-1 and 211/12-1, Figure 1), and in this example we consider the value of these data for reservoir subdivision and correlation.
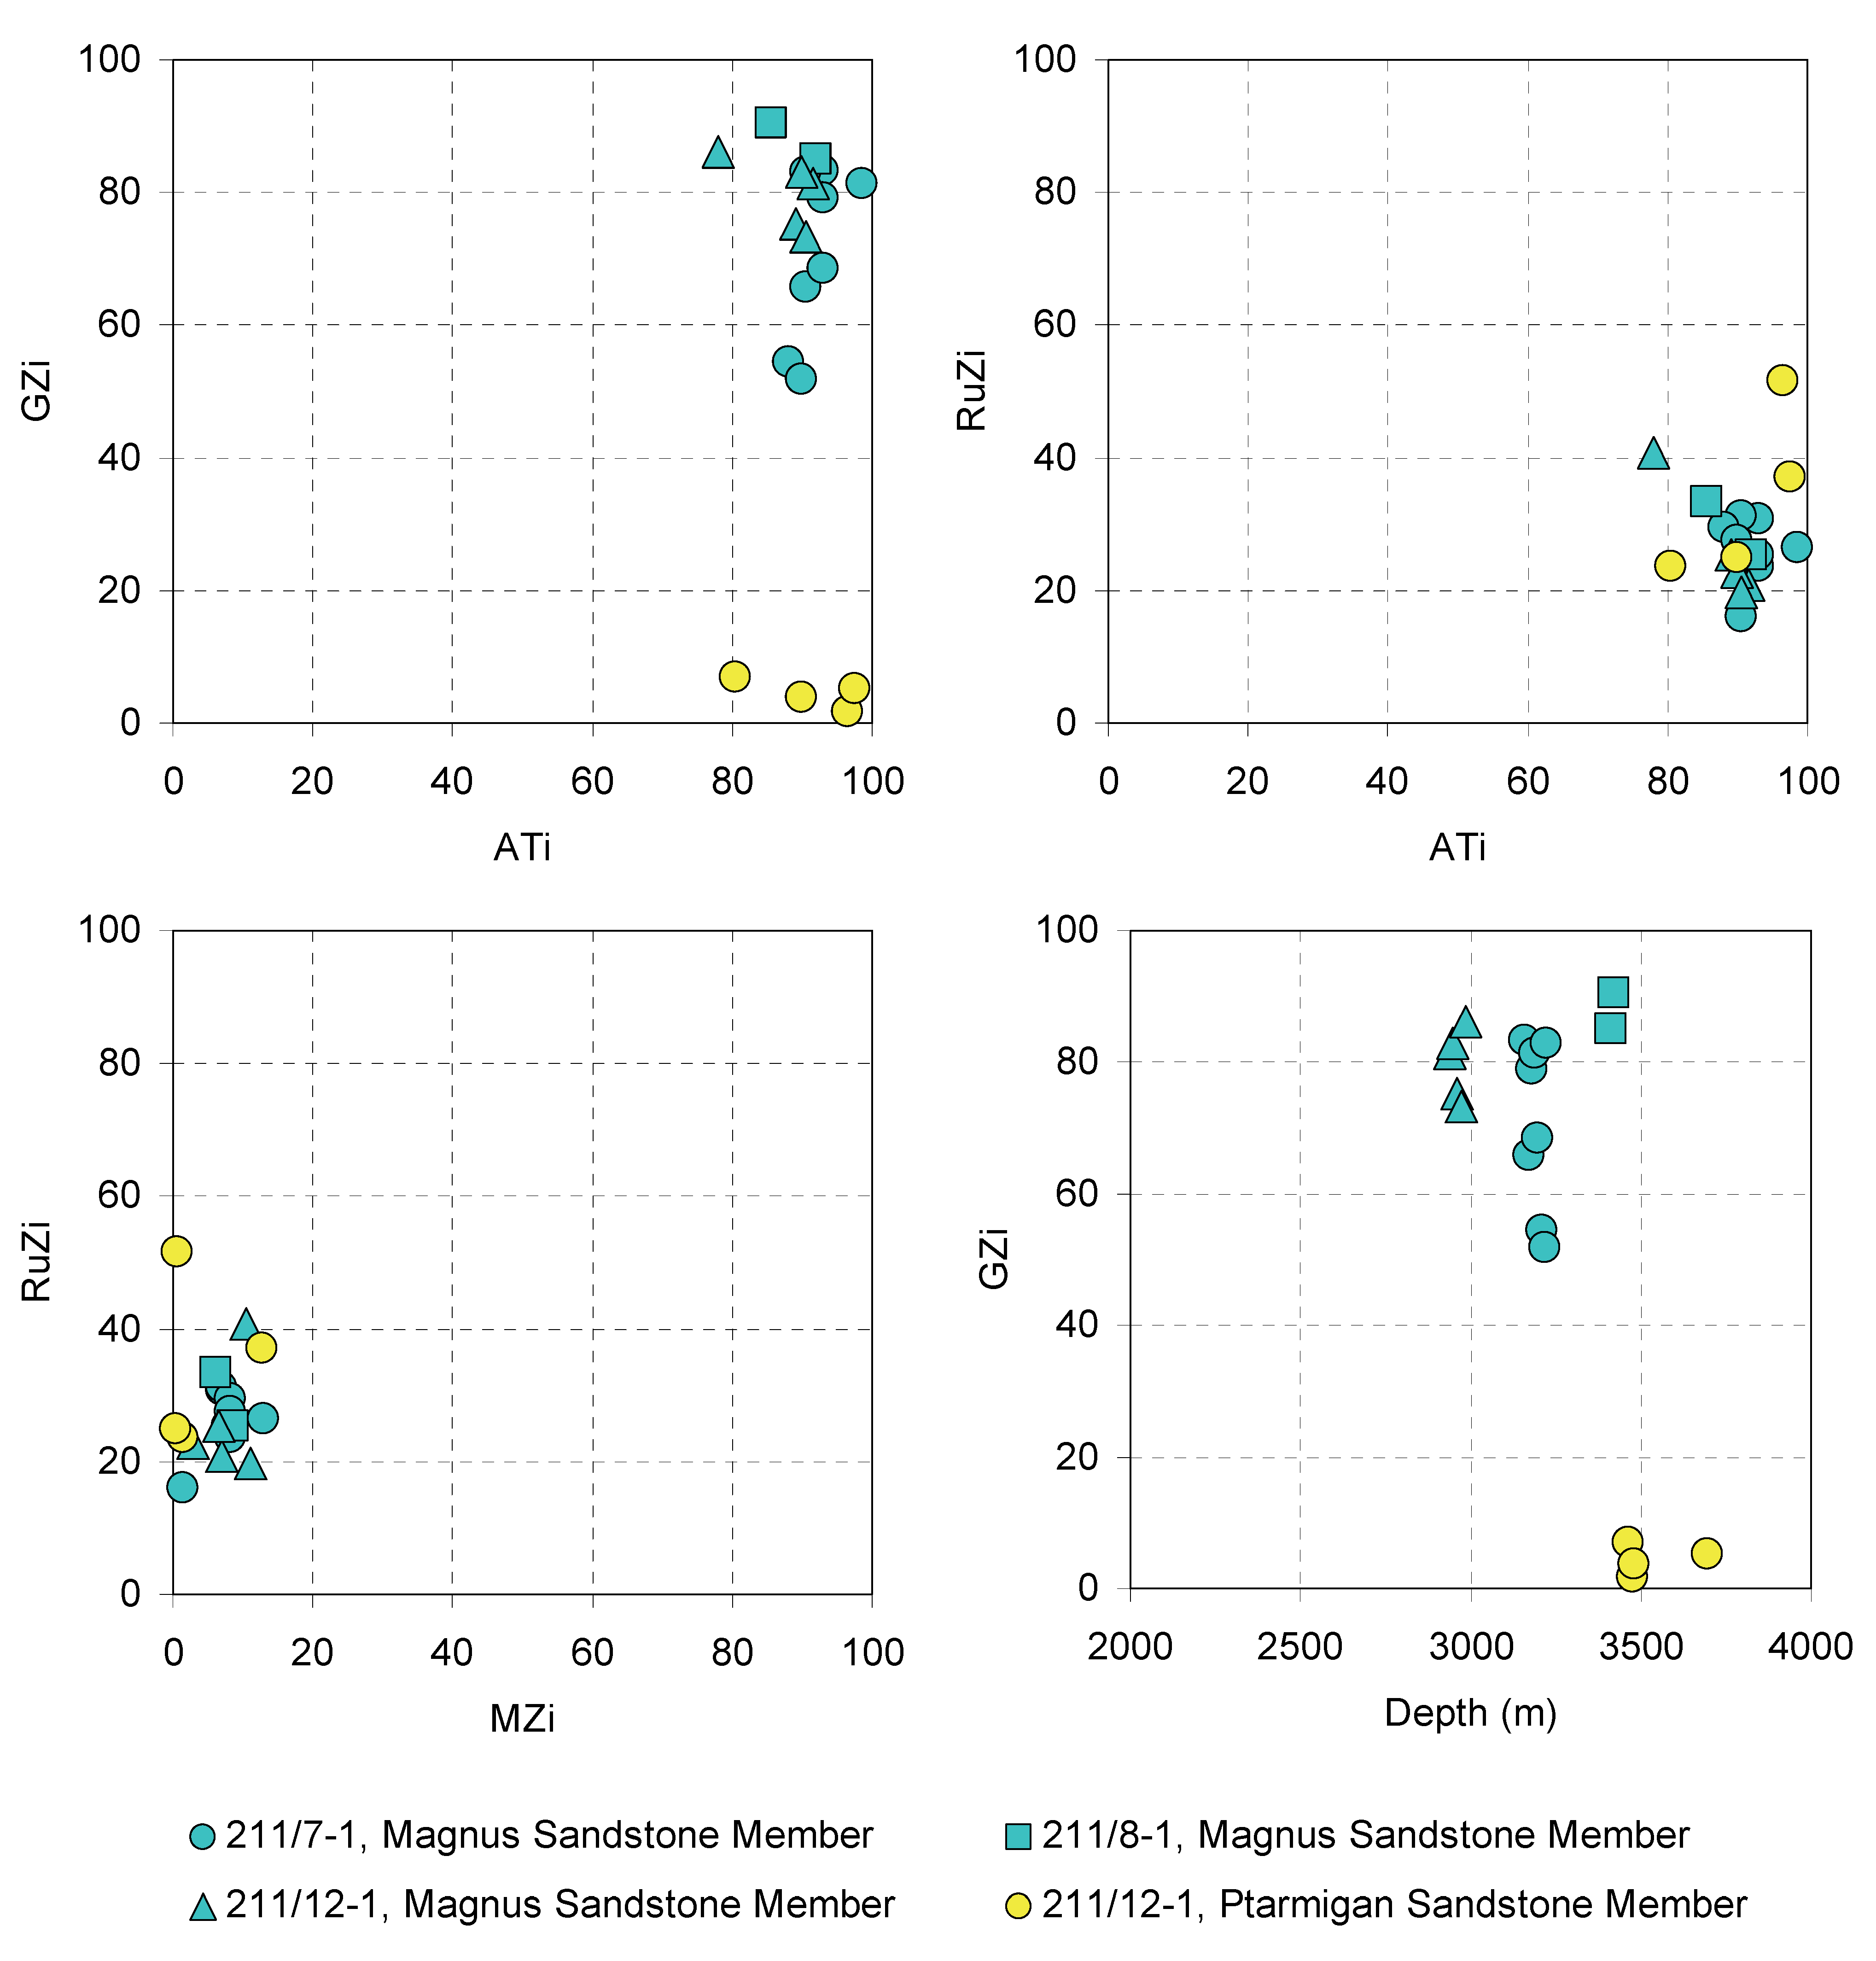
The heavy mineral suites are low in diversity, typical for North Sea sandstones buried to in excess of 2900 m. Four minerals (apatite, garnet, rutile, and zircon) account for 93.0–99.5% (mean 96.7%) of the assemblages, with anatase, monazite, and tourmaline being present consistently but in minor amounts. Other phases (notably chrome spinel and chloritoid) are found in minor amounts and in only a small number of samples. Provenance-sensitive heavy mineral ratios show comparatively little variation both within and between the two sandstone members (Figure 10).
The only parameter to display significant variations is GZi, but the range shown by this parameter is clearly related to burial depth (Figure 10). Therefore, the observed variations in GZi are attributable to garnet dissolution during diagenesis, and the parameter cannot be regarded as a reliable indicator of provenance characteristics. The evidence for advanced garnet dissolution also precludes the use of garnet geochemistry as a provenance or correlation tool, since increasing garnet dissolution leads to biasing of garnet geochemical populations due to the relative instability of Ca-rich garnets compared with Ca-poor garnets ([10] and references therein). There are only two subtle hints of a difference in provenance within the conventional heavy mineral data set. First, the Ptarmigan Sandstone Member has very slightly higher chrome spinel:zircon index (CZi) values (0.5–4.3%) compared with the Magnus Sandstone Member (0.0–0.5%). Second, chloritoid is present in very small proportions (0.5%) in two of the four Ptarmigan Sandstone samples, but was not found in any of the 15 Magnus Sandstone samples. Using such scanty data to propose a difference in provenance and to subdivide the reservoir succession would be hazardous.
Despite the lack of clear evidence for any differences in provenance in the conventional data set, there are major differences in both rutile trace element geochemistry and detrital zircon geochronology. Rutile data (Figure 11) show that metapelites were the main rutile source for the Magnus Sandstone Member, with 84–92% of rutiles having metapelitic signatures. Furthermore, the Magnus Sandstone contains abundant granulite-facies rutiles, which form 39–51% of the populations. By contrast, metamafic rutiles are significantly more abundant in the Ptarmigan Sandstone, forming 45% of the assemblages, and granulite-facies grains are much less abundant (10–13%). Differentiation of the two sandstone members is reinforced by the zircon age data, which show that the Magnus and Ptarmigan units have markedly different spectra (Figure 12). The three analysed Magnus samples have bimodal populations, with a well-defined Early Paleozoic group (59–62% of zircons with <10% discordance) and a broader Neoarchaean group (27–35%), and only minor representation of the intervening Proterozoic (3–16%). The Ptarmigan population, by contrast, almost entirely comprises Proterozoic zircons (95%), with hardly any Early Paleozoic or Archaean zircons (4% and 1%, respectively). This example shows the potential for using rutile trace element and zircon geochronology data for reservoir subdivision and correlation in the absence of any clear evidence from basic heavy mineral data and where application of garnet geochemistry is not possible due to burial diagenesis.
The rutile and zircon data provide some constraints on the provenance of these enigmatic sandstones. The source of the Magnus Sandstone Member can be reconstructed as comprising high-grade metasedimentary rocks at upper amphibolite and granulite facies, as indicated by the garnet-rich heavy mineral assemblages and rutile geochemical data. The zircon data indicate the source area was heavily affected by the Early Paleozoic Caledonian orogenic cycle. The Early Paleozoic zircons fall in the 410–490 Ma range, corresponding to the age of late tectonic granites, the alkali suite and late granites in northern Scotland [65], and to the Grampian and Scandian orogenic events [66]. The older, predominantly Archaean, ages are interpreted as reflecting the detrital zircon populations in the metasedimentary source rocks. Similar bimodal zircon populations, in association with heavy mineral assemblages indicating derivation from high-grade metasedimentary rocks, have been found elsewhere in the northern North Sea, such as the Late Triassic-Early Jurassic Statfjord Formation in the Brent Field [41]. The Early Carboniferous Upper Clair Group in the Clair Field (Figure 1), on the western side of the Shetland Platform, also has a bimodal zircon population with Early Paleozoic and Neoarchaean groups in association with garnet- and staurolite-rich heavy mineral suites evidently of metasedimentary provenance, although in this case the Early Paleozoic group is less common than the Neoarchaean [67]. The occurrence of metasedimentary-sourced sandstones with comparable zircon age spectra in sandstones located both to the east and west of the Shetland Platform suggests the source lay on the intervening platform area, although derivation from the north, as suggested by Fraser et al. [60], cannot be ruled out. The contrast in rutile data and zircon age spectra in the Ptarmigan sandstone compared with the Magnus sandstone indicates the two units have a different provenance. The Ptarmigan zircon data can be matched with a Shetland Isles provenance, in particular with the Dalradian metasediments that outcrop on the islands. The largest zircon peak in the Ptarmigan spectrum (920–990 Ma) is broadly equivalent to the timing of metamorphism of the Dalradian at 938 ± 8 Ma [68], and the second largest group (c. 1450–1700 Ma) is also common as a detrital component in the Shetland Dalradian [69]. The presence of chloritoid and chrome spinel is also suggestive of a source on the Shetland Isles, since both minerals are characteristic of this area. Chrome spinel is a major component of the Unst ophiolite [70], and chloritoid is abundant in modern stream sediments from this area [58].
8. Application of Heavy Mineral Stratigraphy at the Well Site: Clair Field, West of Shetland
One of the most exciting applications of heavy mineral stratigraphy for the hydrocarbons industry sector is its ‘real-time’ use for geosteering of high angle wells. This application is a logical extension of the technique given the established correlative value of heavy mineral analysis in post-well studies. High-angle (horizontal or near-horizontal) wells are commonly used to exploit hydrocarbon reserves, since a large number of high-angle wells can be drilled from a single location. Successful exploitation generally depends on ensuring the well bore remains in the productive parts of the reservoir (the so-called ‘pay zone’). Geosteering involves the use of geological parameters to alter the trajectory of wells during drilling to ensure the well bore remains within the pay zone, and requires continual monitoring of the geology during drilling operations. This is normally achieved using a combination of cuttings description by the wellsite geologist, geophysical logging while drilling (LWD), and high-resolution biostratigraphy. However, in reservoirs with insufficient biostratigraphic control, heavy mineral analysis can play an important role. Heavy mineral stratigraphy has been carried out at the well site in a number of fields on the UK continental shelf, such as Ross and Hannay [71].
However, the most important application to date has been on the Clair Field, west of Shetland (Figure 1), where the technique was first pioneered in the 1990’s [72]. The reservoir succession in the Clair Field consists of fractured Devonian to Carboniferous fluvio-lacustrine clastic sediments, and is largely barren of microfossils and palynomorphs owing to the adverse depositional environment. Initial heavy mineral work demonstrated the important potential role for heavy minerals to establish a stratigraphic framework for the Clair Field [37].
As discussed earlier in this paper, the basic prerequisite for all successful heavy mineral correlation schemes is that there were variations in provenance and transport history during deposition of the reservoir succession. For application at the well site, it is also crucial that the parameters used in the scheme can be determined from ditch cuttings, since production wells are rarely cored. Furthermore, the variations must be laterally extensive across the area under development, and finally, it must be possible to acquire the data in a timely fashion in order to be able to influence drilling decisions.
The first step in the process involved creation of a correlation scheme based on meaningful geological criteria. The fully cored well 206/8-8 (Figure 13) was used for this purpose. Variations in a number of key parameters enable subdivision of the succession into two major lithostratigraphic units, the Lower Clair Group and the Upper Clair Group [37,73]. The Lower Clair Group has been further subdivided into Units I–VI, with the Upper Clair Group comprising Units VII–X. Some of these units have been further subdivided on the basis of internal trends in one or more of the parameters.
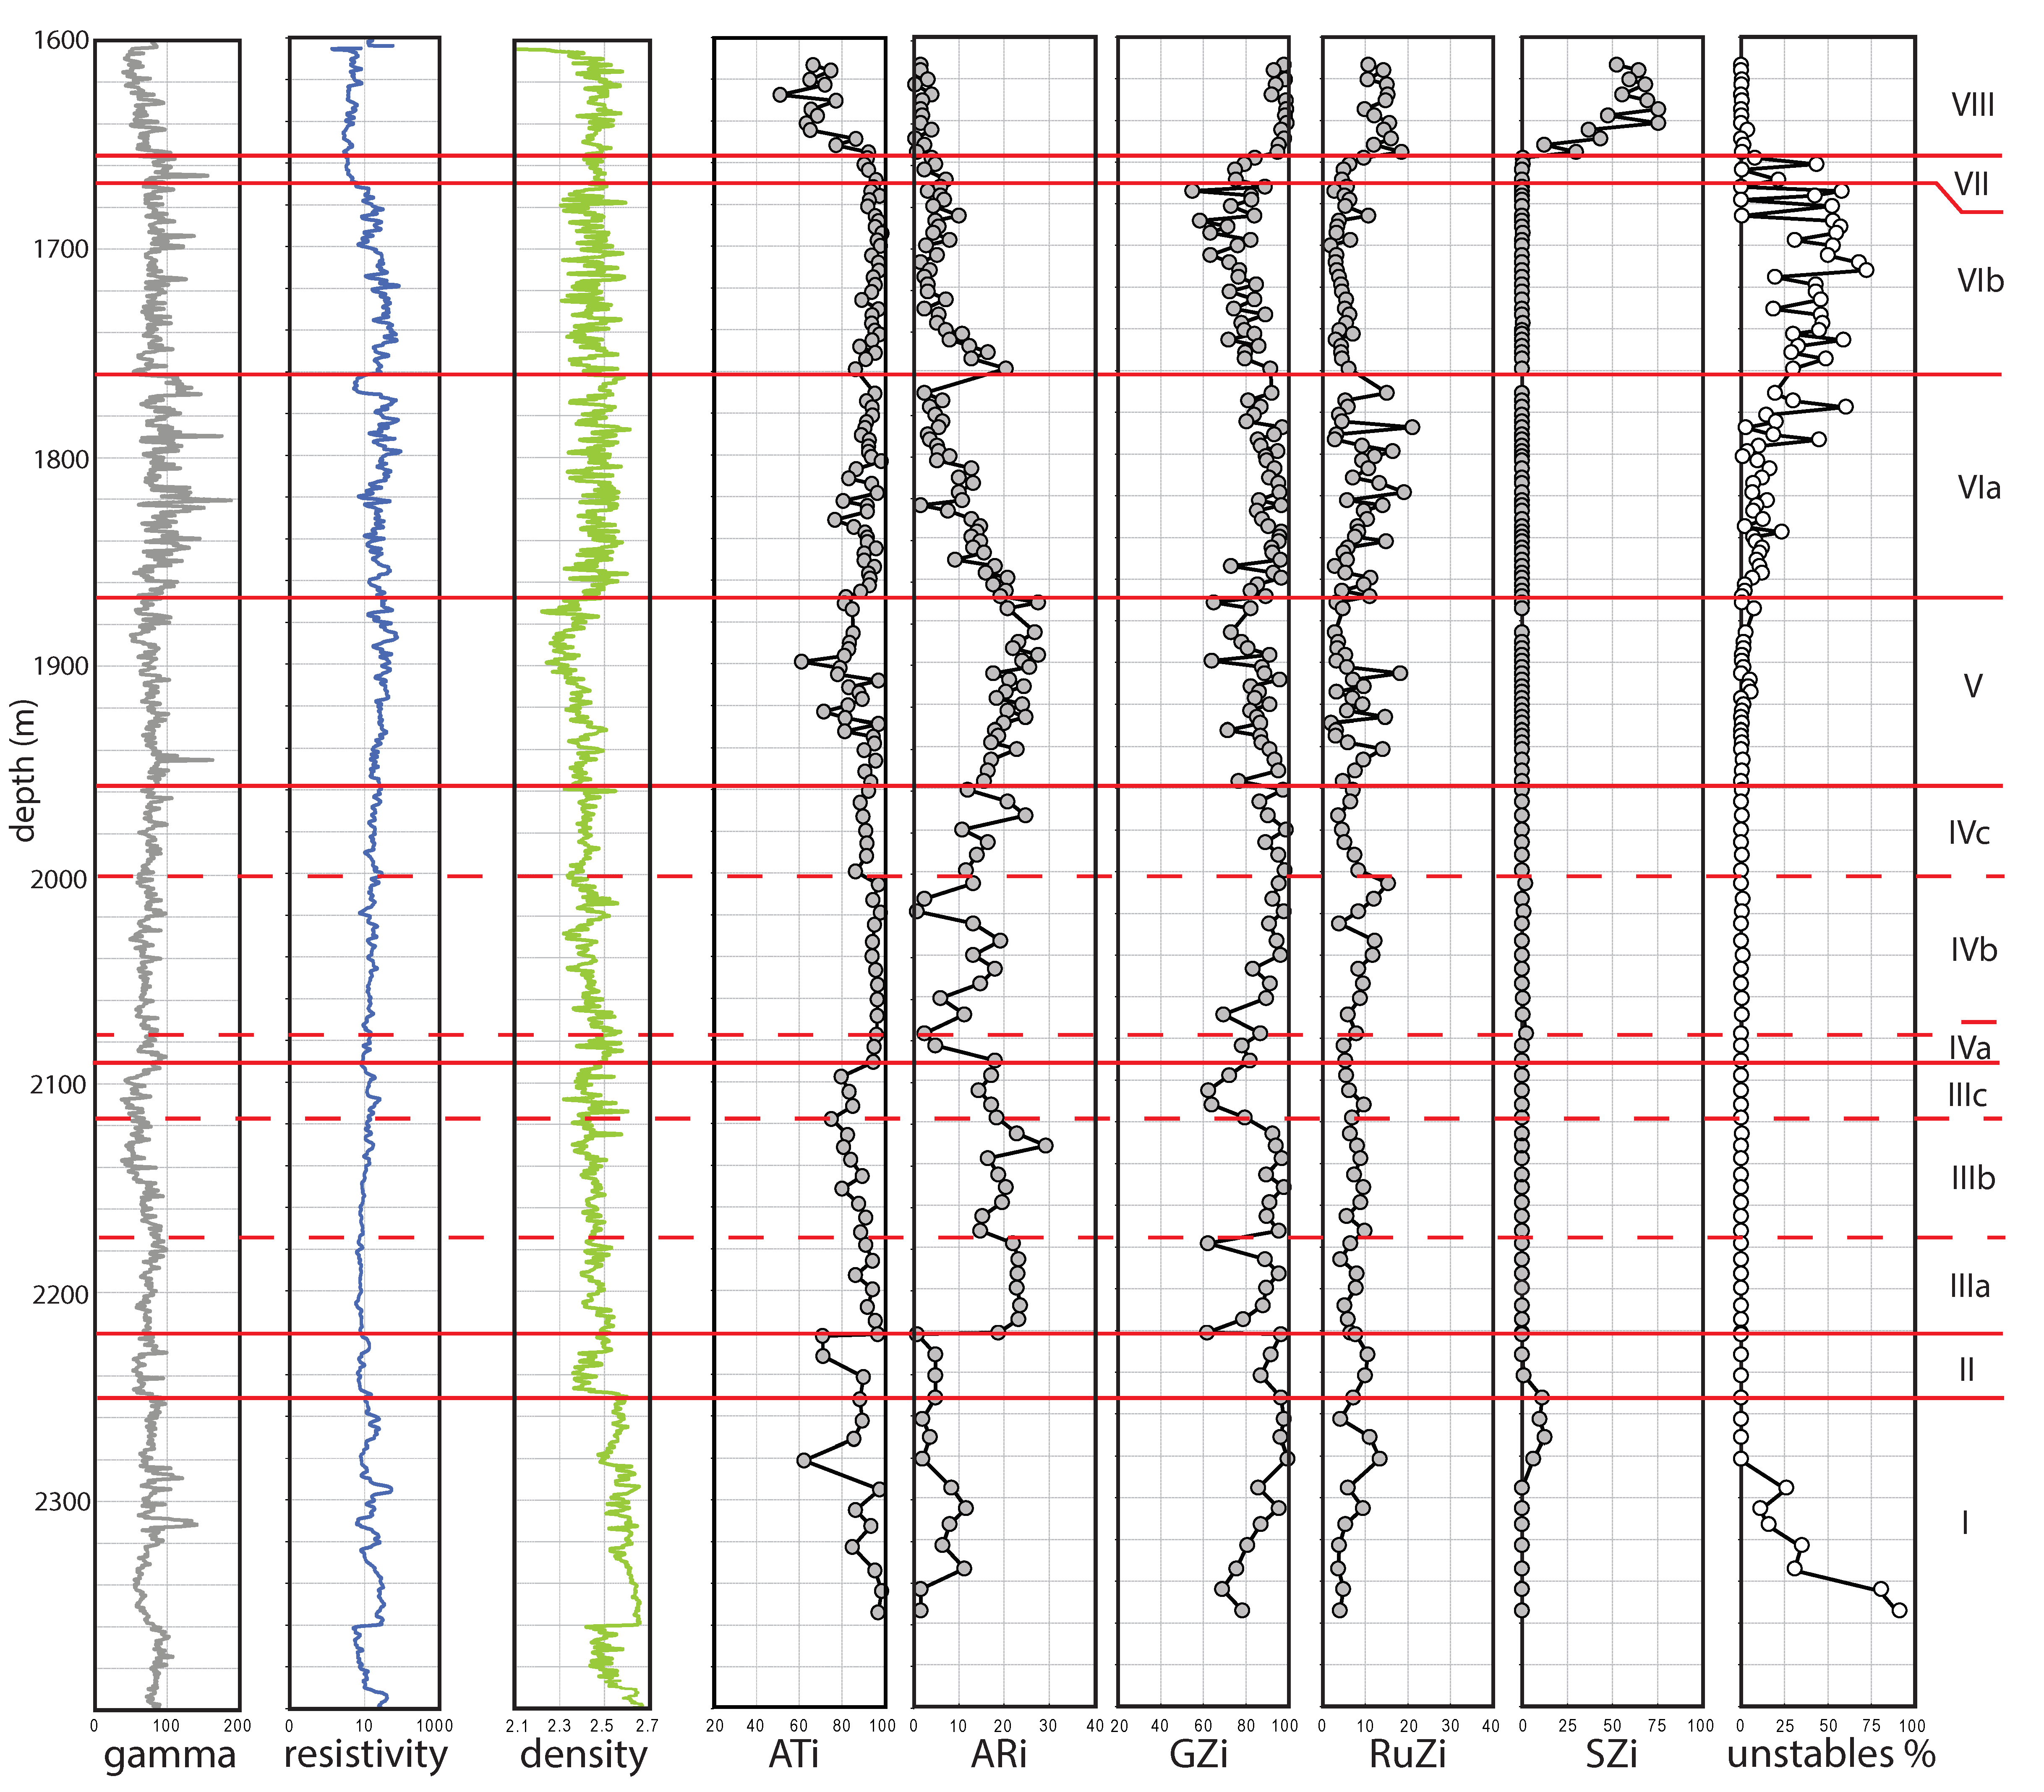
The criteria used in the Clair Field correlation scheme are the apatite:tourmaline index (ATi), apatite roundness index (ARi), garnet:zircon index (GZi), rutile:zircon index (RuZi), and staurolite:zircon index (SZi), as defined by Morton and Hallsworth [33], Morton et al. [72], and Morton et al. [73]. In addition, the abundance of the unstable minerals epidote and titanite, and the associated unstables:tourmaline index (UTi), have proved useful locally in parts of the field. Variations in these parameters are due to a combination of provenance, transport history, and diagenetic factors. Provenance variations result from the interplay between an axial sediment transport system and sediment of local derivation from an adjacent basement high, together with longer-term variations in sediment composition supplied by the axial system and a fundamental shift in provenance at the Lower Clair Group–Upper Clair Group boundary [37,73,74]. The highest ARi values are found in Units III and V (Figure 13), which display the greatest aeolian influences in the succession. Unit III shows evidence for wind modification in the form of sand flats [75] and Unit V contains wind ripple laminated sandstones [37]. Variations in ARi therefore reflect the extent of aeolian transport. Hence, variations in ATi, ARi, GZi, RuZi, and SZi all have geological significance. Variations in abundance of the unstable minerals epidote and titanite (and UTi) are partly controlled by stratigraphy, with their presence in Unit VI and absence in Unit V (Figure 13) being related to the difference in reservoir quality between the two [73,74]. However, differences in burial depth means that variations in abundance of unstable minerals and UTi are not consistent across the field, and these parameters therefore have only local correlative value.
Having established the existence of a high-resolution heavy mineral stratigraphic breakdown of the 206/8-8 succession, the next step was to demonstrate that the same events can be seen in an uncored well where only ditch cuttings samples are available. This was successfully tested using well 206/8-9Y, which is located immediately adjacent to the cored well 206/8-8 [73]. All the events seen in the cored well proved to be readily identifiable in the uncored well [73], with a slight blurring of some of the boundaries owing to the inevitable contamination associated with the drilling mud system. With this successful outcome, further work established that the same events can be seen in other parts of the field, indicating that the stratigraphic framework can be applied across the entire area [73].
The final step in the feasibility study was to undertake a pilot study at the well site in order to determine whether it was possible to acquire data quickly enough for the information to be useful in decision making. During the pilot studies on wells 206/8-10Z and 206/8-11Z, heavy mineral data were acquired in less than 2 h from receipt of sample, and owing to the relatively slow penetration rates associated with Clair drilling, heavy mineral information was generally acquired ahead of the LWD [72,74]. In consequence, heavy mineral stratigraphic analysis has been undertaken on a real-time basis at the well site for virtually all appraisal and development wells since production drilling first started in 2005 [74].
Heavy mineral data have been used in the decision-making process in a variety of situations, including picking of casing and coring points, whether to maintain or alter well trajectory, and when to terminate drilling. Some of the formation tops have only subtle geophysical log expressions, and since heavy mineral data establish trends and predict formation changes before they are encountered, they are critical in aiding geosteering decisions. Heavy mineral analysis has also been used to monitor stratigraphy and to pick formation tops when logging tools have failed, allowing drilling to continue and thereby avoiding the need to change the bottom-hole assembly. In this paper, we review the study of well 206/8-A16, originally discussed in the paper by Morton and Milne [74] on the application of heavy mineral stratigraphy to Clair Field appraisal and development wells drilled since 2005.
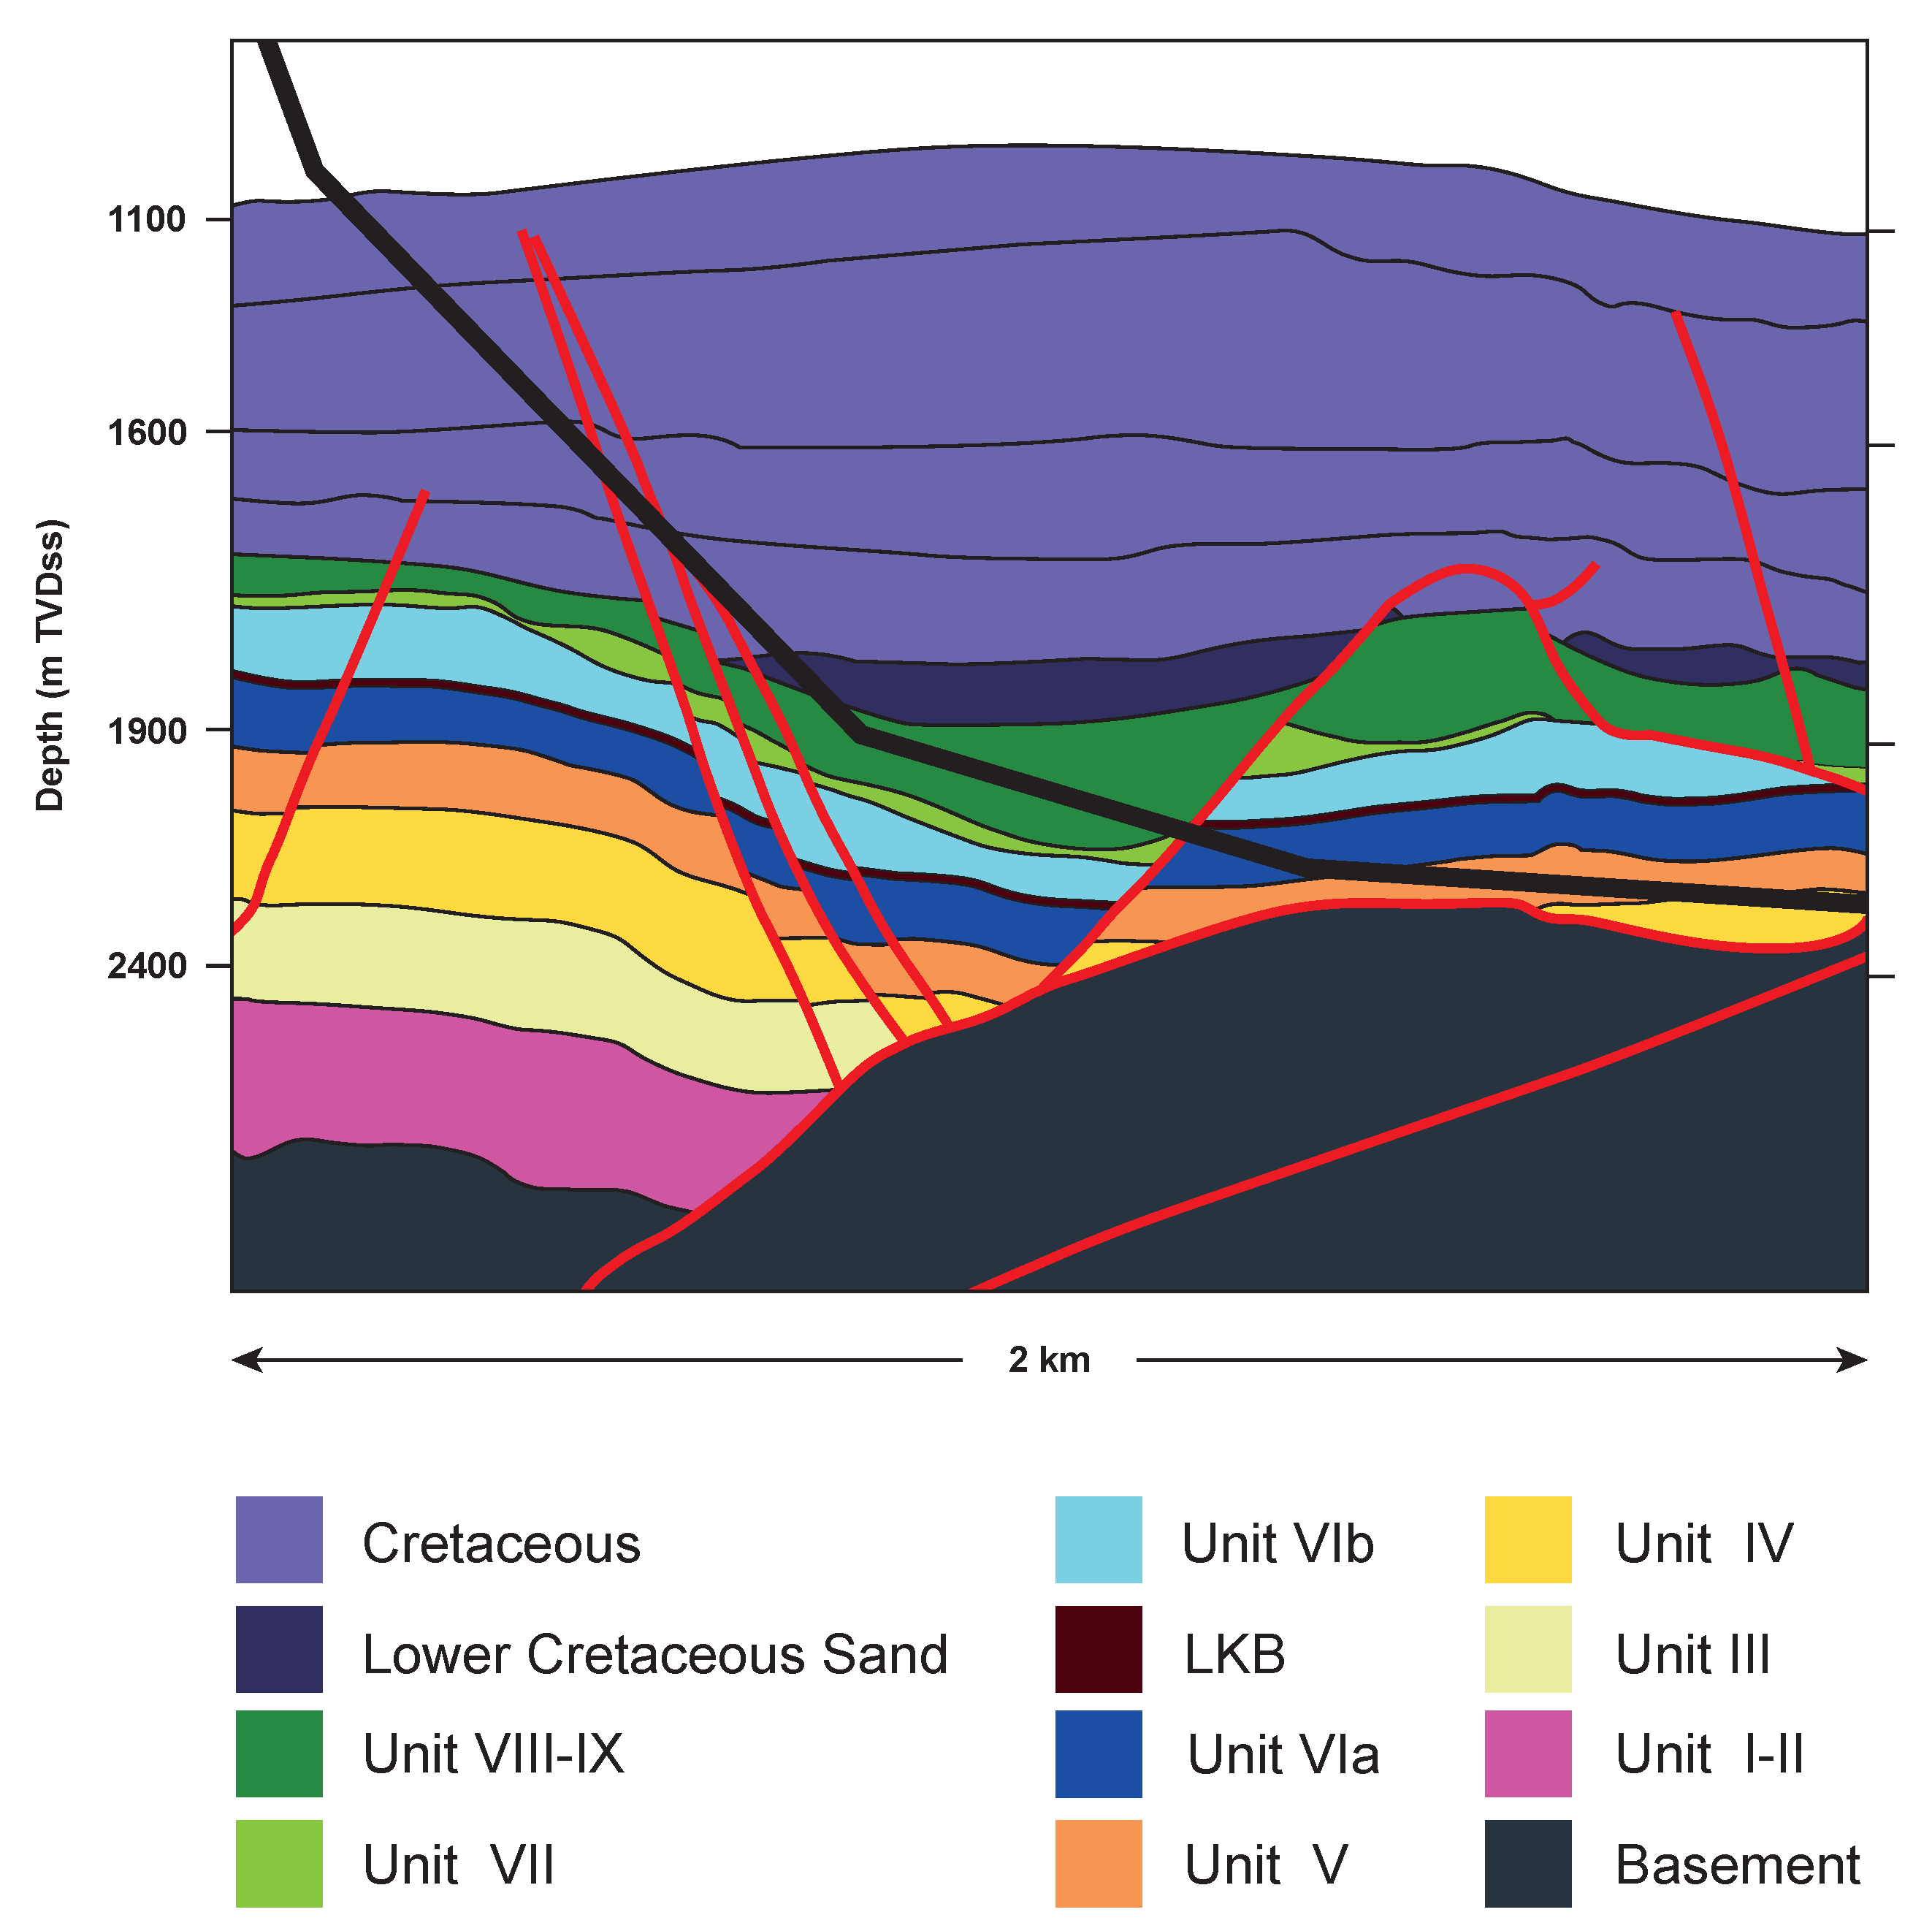
Well 206/8-A16 was drilled into a fault terrace close to a major fault that separates two large-scale structural blocks (Core and Ridge areas) of the Clair Field [74]. Seismic resolution is poor in the area because of extensive faulting, leading to considerable uncertainty concerning the predicted pre-drill stratigraphy. Another pre-drill uncertainty was the possibility that the extensive faulting might be associated with widespread mineralisation, and this might affect log responses. For a number of reasons, therefore, wellsite heavy mineral analysis was considered to be critical in understanding the stratigraphy while drilling, as well as helping to pick the casing point in the uppermost part of Unit VI.
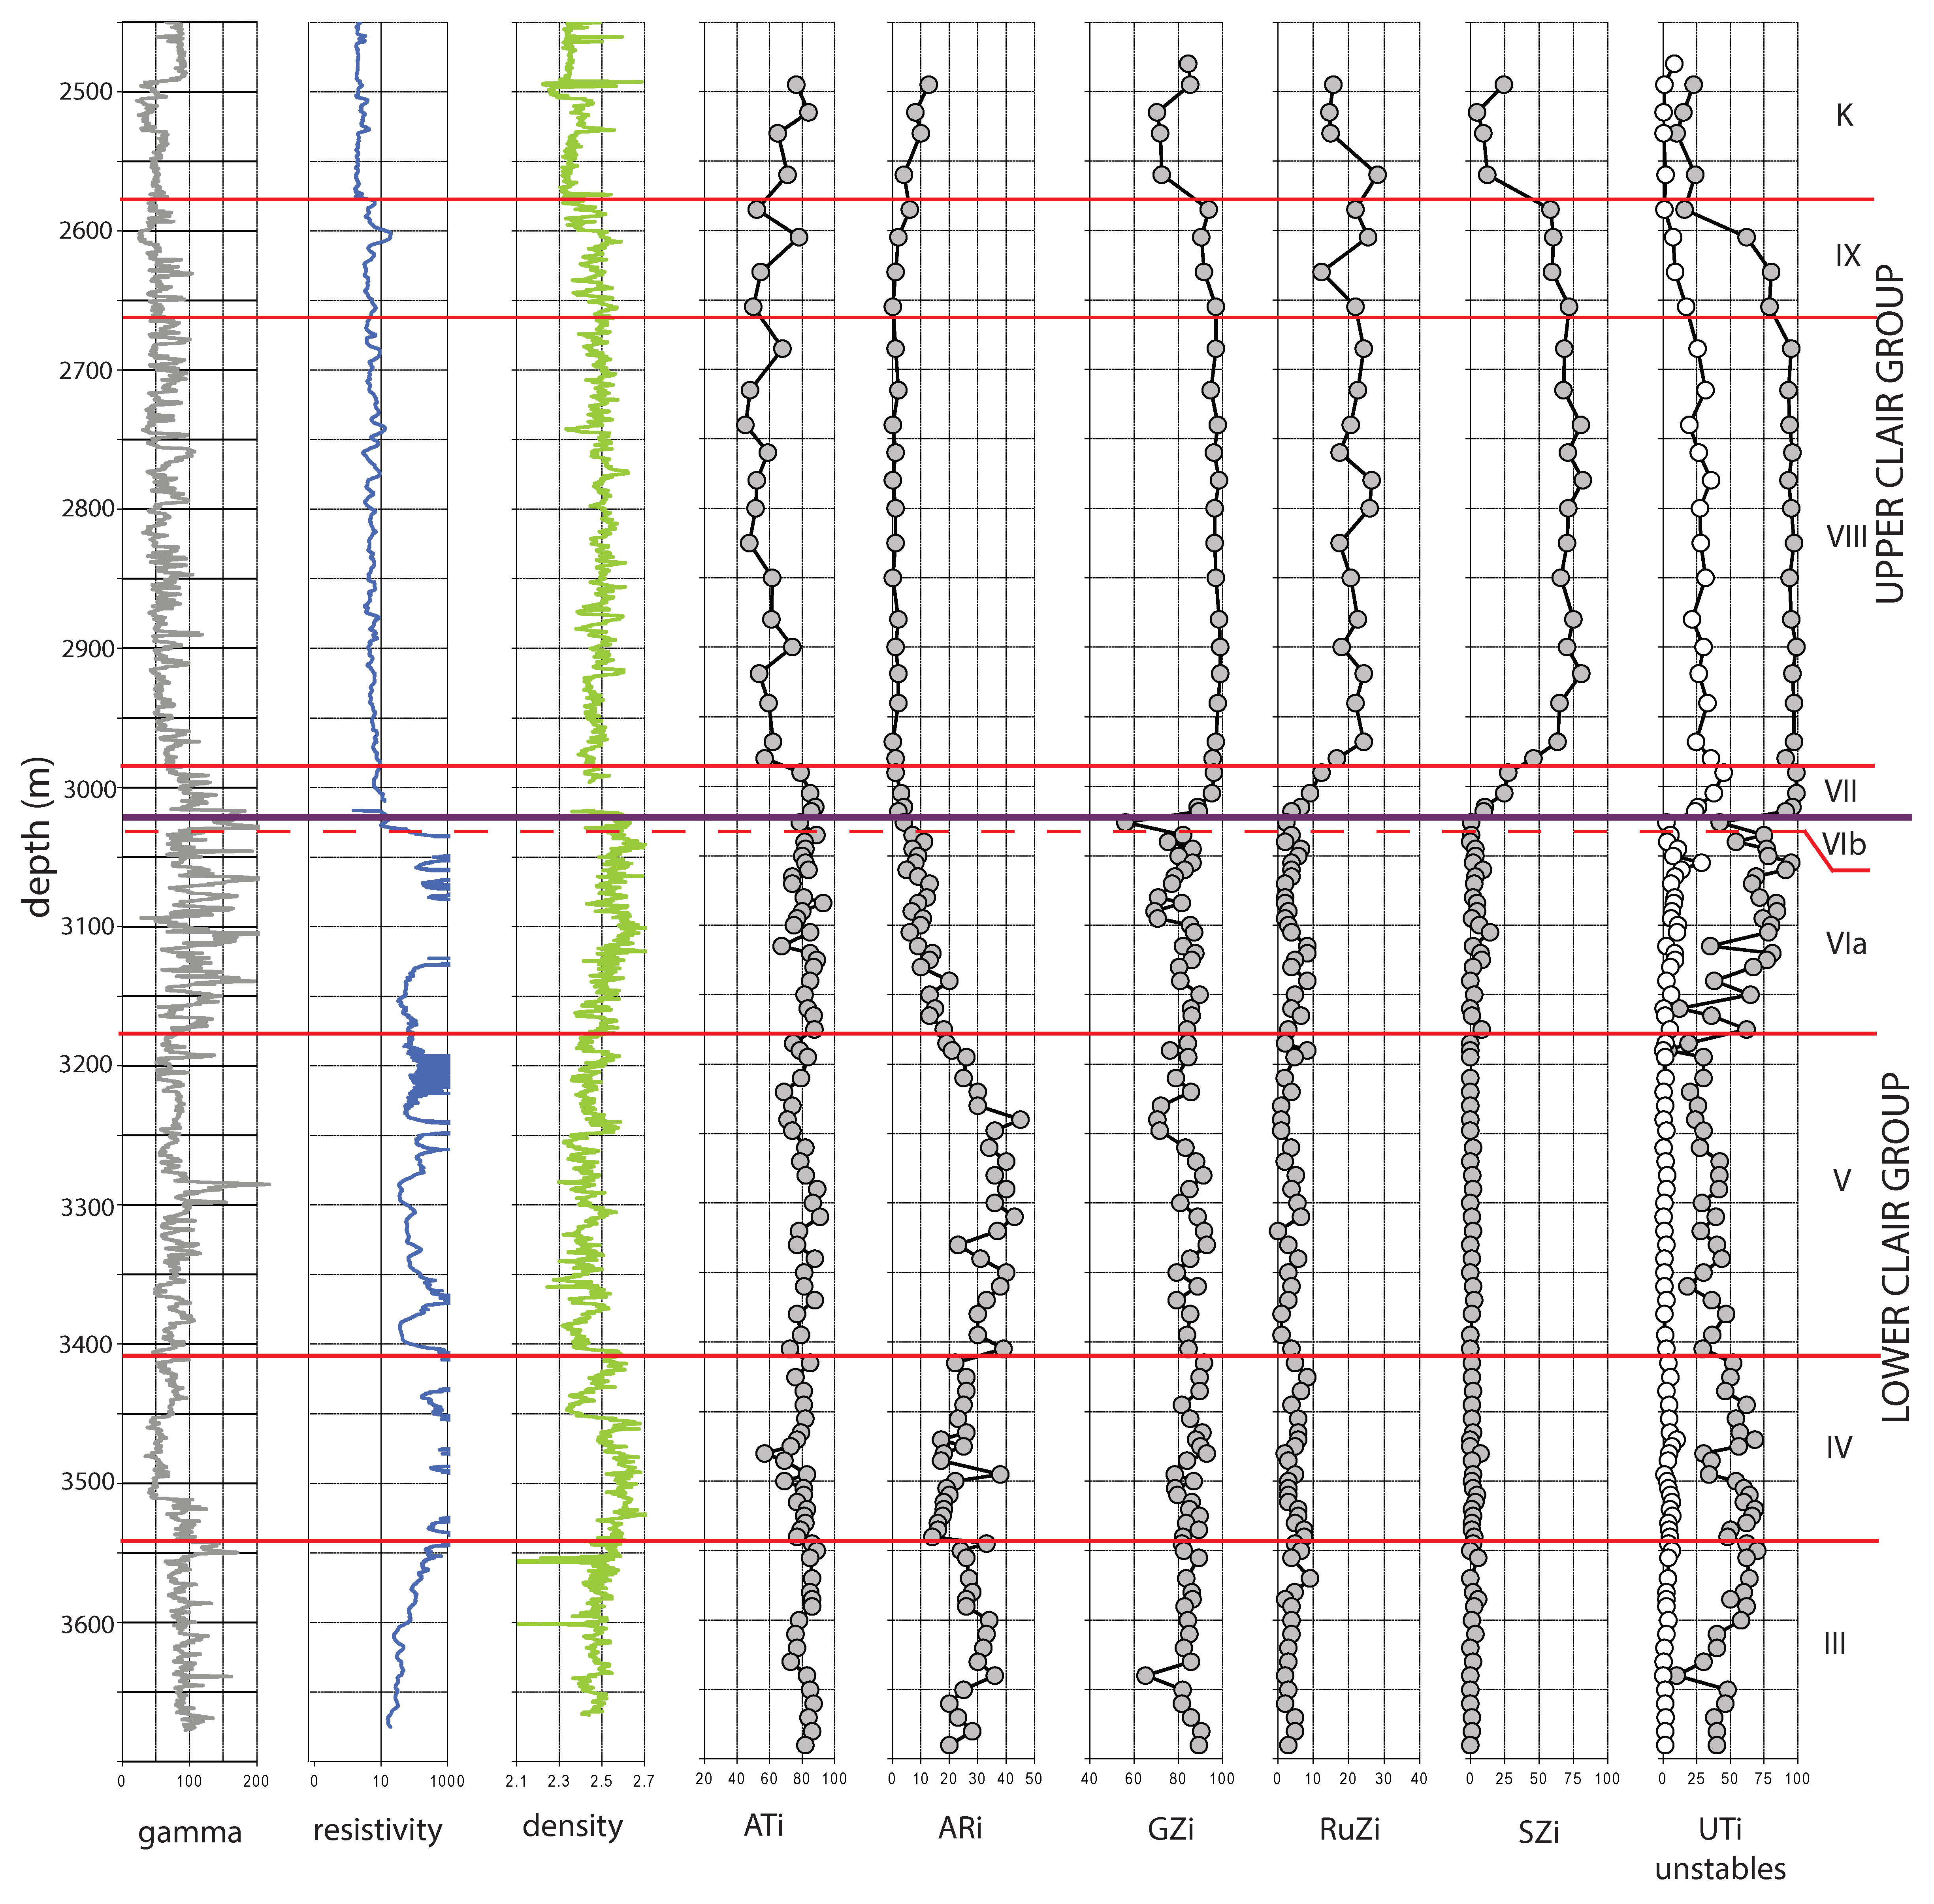
The heavy mineral stratigraphy of the well and the interpreted well track are shown in Figure 14 and Figure 15, respectively. The stratigraphy encountered in the shallower parts of the succession was essentially as predicted. A basal Cretaceous sandstone with relatively high GZi, high RuZi, and low SZi overlies the Upper Clair Group Unit IX identified on the basis of very high GZi and SZi. The subsequent increase in unstable mineral abundances and UTi values marks the top of Upper Clair Group Unit VIII. Entry into Unit VII was diagnosed by decreasing GZi, SZi, and RuZi and an increase in ATi. There was an LWD tool failure during drilling in Unit VII, but because heavy mineral stratigraphic analysis was available at well site, there was no need to make a three-day trip to change the bottom-hole assembly, and the 95/8 inch casing was successfully set at the top of Lower Clair Group Unit VIb.
Almost immediately after drilling commenced on the 8½ inch hole section, the predicted complexity in Lower Clair Group stratigraphy became apparent. The first sample analysed had Unit VIb characteristics as expected, but this was followed immediately by a sharp increase in GZi suggesting entry into Unit VIa. The anomalously short penetration of Unit VIb was interpreted as the result of faulting, a view supported by the influx of abundant fracture-fill mineral phases (notably pyrite). The abundance of fracture-fill minerals persisted for a considerable distance along hole, indicating that the well track was following an extensively mineralised fault corridor. The mineralisation led to anomalous geophysical log responses, notably much higher resistivity than normal (compare Figure 14 with the typical Clair Field log responses in Figure 13). This caused serious complications in interpretation of the LWD data, thereby increasing the reliance on heavy minerals for diagnosing stratigraphy in the well. Anomalous log responses persisted through Unit VIa, Unit V and the relatively thin Unit IV, but the entry into Unit III was associated with a return to more typical log responses and a reduction in mineralisation (Figure 14), suggesting the well exited the strongly faulted zone at this point.
9. Concluding Remarks
Correlation of hydrocarbon reservoir sandstones is one of the most important practical applications for heavy mineral analysis. Successful correlation schemes depend on recognition of changes in sediment provenance and transport history in the interval under investigation. Heavy mineral assemblages are uniquely placed to identify such changes since they are highly sensitive indicators of provenance, but care must be taken to ensure that heavy mineral variations are not related to differences in hydrodynamic conditions at the time of deposition, or to deep burial diagenesis. A wide variety of parameters are available to identify changes in provenance and to create correlation frameworks, including provenance-sensitive heavy mineral ratio data, mineral morphologies, major element mineral chemistry, trace element mineral chemistry, and single-grain dating, notably of zircon. This paper illustrates the application of all these techniques in the North Sea and adjacent areas, where the majority of such work has been undertaken. Nevertheless, the potential for applications elsewhere is obvious, as demonstrated by work on such disparate areas as the Middle East [76,77], Myanmar [78], Papua New Guinea [79], and Trinidad [80,81].
Although the technique is most widely applied in reservoirs with poor biostratigraphic control, it has important applications in all clastic reservoirs because it provides information on the actual reservoir, rather than the bounding mudstones: in this sense, it effectively correlates reservoir volumes [11]. Furthermore, although not the primary aim of heavy mineral correlation studies, continued applications within sedimentary basins generate a large data base that can be used to constrain sediment provenance, transport, and dispersal patterns and entry points [11].
Author Contributions
Writing-original draft preparation by A.M., revision by P.M., and editing by A.M. and P.M. Figures—A.M. and P.M.
Funding
This review article received no external funding.
Acknowledgments
We are grateful to GdF Suez E&P Ltd. for allowing release of the rutile and zircon data information discussed herein, and to the reviewers for their helpful comments on a previous version of this paper.
Conflicts of Interest
The authors declare no conflicts of interest.
References
- Jones, R.W.; Simmons, M.D. (Eds.) Biostratigraphy in Production and Development Geology; Geological Society, Special Publication: London, UK, 1999; p. 152. [Google Scholar]
- Dunay, R.E.; Hailwood, E.A. (Eds.) Non-Biostratigraphical Methods of Dating and Correlation; Geological Society, Special Publication: London, UK, 1995; p. 89. [Google Scholar]
- Ratcliffe, K.T.; Zaitlin, B.A. (Eds.) Application of Modern Stratigraphic Techniques: Theory and Case Histories; SEPM Special Publication: Broken Arrow, OK, USA, 2010; p. 94. [Google Scholar]
- Pearce, T.J.; Besly, B.M.; Wray, D.S.; Wright, D.K. Chemostratigraphy: A method to improve interwell correlation in barren sequences—A case study using onshore Duckmantian/Stephanian sequences (West Midlands, U.K.). Sediment. Geol. 1999, 124, 197–220. [Google Scholar] [CrossRef]
- Ratcliffe, K.T.; Wilson, A.; Payenberg, T.; Rittersbacher, A.; Hildred, G.V.; Flint, S.S. Ground truthing chemostratigraphic correlations in fluvial systems. Bull. Am. Assoc. Pet. Geol. 2015, 99, 155–180. [Google Scholar]
- Mearns, E.W.; Knarud, R.; Raestad, N.; Stanley, K.O.; Stockbridge, C.P. Samarium-neodymium isotope stratigraphy of the Lunde and Statfjord Formations of Snorre oil field, northern North Sea. J. Geol. Soc. 1989, 146, 217–228. [Google Scholar] [CrossRef]
- Dalland, A.; Mearns, E.W.; McBride, J.J. The application of samarium-neodymium (Sm-Nd) provenance ages to correlation of biostratigraphically barren strata: A case study of the Statfjord Formation in the Gullfaks oilfield, Norwegian North Sea. In Non-Biostratigraphical Methods of Dating and Correlation; Dunay, R.E., Hailwood, E.A., Eds.; Geological Society, Special Publications: London, UK, 1995; Volume 89, pp. 201–222. [Google Scholar]
- Jeans, C.V. Clay mineral stratigraphy in Palaeozoic and Mesozoic red bed facies, onshore and offshore UK. In Non-Biostratigraphical Methods of Dating and Correlation; Dunay, R.E., Hailwood, E.A., Eds.; Geological Society of London Special Publications: London, UK, 1995; Volume 89, pp. 31–55. [Google Scholar]
- Pay, M.D.; Astin, T.R.; Parker, A. Clay mineral distribution in the Devonian-Carboniferous sandstones of the Clair Field, west of Shetland, and its significance for reservoir quality. Clay Miner. 2000, 35, 151–162. [Google Scholar] [CrossRef]
- Morton, A.C. Value of heavy minerals in sediments and sedimentary rocks for provenance, transport history and stratigraphic correlation. In Quantitative Mineralogy and Microanalysis of Sediments and Sedimentary Rocks; Mineralogical Association of Canada Short Course Series; Sylvester, P., Ed.; Mineralogical Association of Canada: Québec, QC, Canada, 2012; Volume 42, pp. 133–165. [Google Scholar]
- Hurst, A.; Morton, A. Provenance models: The role of sandstone mineral-chemical stratigraphy. In Sediment Provenance Studies in Hydrocarbon Exploration and Production; Scott, R.A., Smyth, H., Morton, A., Richardson, N., Eds.; Geological Society of London, Special Publications: London, UK, 2014; Volume 386, pp. 7–26. [Google Scholar]
- Garzanti, E.; Andò, S.; Vezzoli, G.; Lustrino, M.; Boni, M.; Vermeesch, P. Petrology of the Namib Sand Sea: Long-distance transport and compositional variability in the wind-displaced Orange Delta. Earth-Sci. Rev. 2012, 112, 173–189. [Google Scholar] [CrossRef]
- Artini, E. Intorno alla composizione mineralogica delle sabbie di alcuni fiumi del Veneto, con applicazione ai terreni di transporto. Riv. Miner. Cristal. Ital. 1898, 19, 33–94. (In Italian) [Google Scholar]
- Thomas, H.H. A contribution to the petrography of the New Red Sandstone in the west of England. Q. J. Geol. Soc. Lond. 1909, 65, 229–244. [Google Scholar] [CrossRef]
- Gilligan, A. The petrography of the Millstone Grit of Yorkshire. Q. J. Geol. Soc. Lond. 1920, 75, 251–293. [Google Scholar] [CrossRef]
- Reed, R.D. Role of heavy minerals in the Coalinga Tertiary formations. Econ. Geol. 1924, 19, 730–749. [Google Scholar] [CrossRef]
- Reed, R.D.; Bailey, J.P. Subsurface correlation by means of heavy minerals. Bull. Am. Assoc. Pet. Geol. 1927, 11, 359–368. [Google Scholar]
- Hedberg, H.D. Some aspects of sedimentary petrography in relation to stratigraphy in the Bolivar Coast fields of the Maracaibo Basin, Venezuela. J. Paleontol. 1928, 2, 32–42. [Google Scholar]
- Edson, F.C. Heavy minerals as a guide in stratigraphic studies. Am. Mineral. 1932, 17, 429–436. [Google Scholar]
- Bornhauser, M. Heavy mineral associations in Quaternary and late Tertiary sediments of the Gulf Coast of Louisiana and Texas. J. Sediment. Petrol. 1940, 10, 125–135. [Google Scholar] [CrossRef]
- Cogen, W.M. Heavy-mineral zones of Louisiana and Texas Gulf coast sediments. Bull. Am. Assoc. Pet. Geol. 1940, 24, 2069–2101. [Google Scholar]
- Edelman, C.H.; Doeglas, D.J. Reliktstructuren detritischer pyroxene und amphibole. Tschermaks Mineral. Petrogr. Mitteil. 1932, 42, 482–490. (In German) [Google Scholar]
- Edelman, C.H.; Doeglas, D.J. Über umwandlungserscheinungen an detritischem staurolith und anderen mineralien. Tschermaks Mineral. Petrogr. Mitteil. 1934, 44, 225–234. (In German) [Google Scholar] [CrossRef]
- Bramlette, M.N. The stability of minerals in sandstone. J. Sediment. Petrol. 1941, 11, 32–36. [Google Scholar] [CrossRef]
- Pettijohn, F.J. Persistence of heavy minerals and geologic age. J. Geol. 1941, 49, 610–625. [Google Scholar] [CrossRef]
- Smithson, F. The alteration of detrital minerals in the Mesozoic rocks of Yorkshire. Geol. Mag. 1941, 78, 97–112. [Google Scholar] [CrossRef]
- Boswell, P.G.H. The stability of minerals in sedimentary rocks (Presidential Address). Q. J. Geol. Soc. Lond. 1942, 97, lvi–lxxv. [Google Scholar]
- Feo-Codecido, G. Heavy mineral techniques and their application to Venezuelan stratigraphy. Bull. Am. Assoc. Pet. Geol. 1956, 40, 984–1000. [Google Scholar]
- Morton, A.C. Stability of detrital heavy minerals in Tertiary sandstones of the North Sea Basin. Clay Miner. 1984, 19, 287–308. [Google Scholar] [CrossRef]
- Milliken, K.L. Loss of provenance information through subsurface diagenesis in Plio-Pleistocene sediments, northern Gulf of Mexico. J. Sediment. Petrol. 1988, 58, 992–1002. [Google Scholar]
- Milliken, K.L.; Mack, L.E. Subsurface dissolution of heavy minerals, Frio Formation sandstones of the ancestral Rio Grande Province, South Texas. Sediment. Geol. 1990, 68, 187–199. [Google Scholar] [CrossRef]
- Mange, M.A.; Maurer, H.F.W. Heavy Minerals in Colour; Chapman and Hall: London, UK, 1992; p. 147. [Google Scholar]
- Morton, A.C.; Hallsworth, C.R. Identifying provenance-specific features of detrital heavy mineral assemblages in sandstones. Sediment. Geol. 1994, 90, 241–256. [Google Scholar] [CrossRef]
- Mange-Rajetzky, M.A. Subdivision and correlation of monotonous sandstone sequences using high resolution heavy mineral analysis, a case study: The Triassic of the Central Graben. In Non-Biostratigraphical Methods of Dating and Correlation; Dunay, R.E., Hailwood, E.A., Eds.; Geological Society of London Special Publications: London, UK, 1995; Volume 89, pp. 23–30. [Google Scholar]
- Morton, A.C. A new approach to provenance studies: Electron microprobe analysis of detrital garnets from Middle Jurassic sandstones of the northern North Sea. Sedimentology 1985, 32, 553–566. [Google Scholar] [CrossRef]
- Henry, D.J.; Guidotti, C.V. Tourmaline as a petrogenetic indicator mineral: An example from the staurolite-grade metapelites of NW Maine. Am. Mineral. 1985, 70, 1–15. [Google Scholar]
- Allen, P.A.; Mange-Rajetzky, M.A. Sedimentary evolution of the Devonian-Carboniferous Clair Field, offshore northwestern UK: Impact of changing provenance. Mar. Pet. Geol. 1992, 9, 29–52. [Google Scholar] [CrossRef]
- Mange, M.; Turner, P.; Ince, D.; Pugh, J.; Wright, D. A new perspective on the zonation and correlation of barren strata: An integrated heavy mineral and palaeomagnetic study of the Sherwood Sandstone Group, East Irish Sea Basin and surrounding areas. J. Pet. Geol. 1999, 22, 325–348. [Google Scholar] [CrossRef]
- Morton, A.C.; Yaxley, G. Detrital apatite geochemistry and its application in provenance studies. In Sediment Provenance and Petrogenesis: Perspectives from Petrography and Geochemistry; Special Paper; Arribas, J., Critelli, S., Johnsson, M.J., Eds.; Geological Society of America: Boulder, CO, USA, 2007; Volume 420, pp. 319–344. [Google Scholar]
- Zack, T.; von Eynatten, H.; Kronz, A. Rutile geochemistry and its potential use in quantitative provenance studies. Sediment. Geol. 2004, 171, 37–58. [Google Scholar] [CrossRef]
- Morton, A.C.; Claoué-Long, J.; Berge, C. Factors influencing heavy mineral suites in the Statfjord Formation, Brent Field, North Sea: Constraints provided by SHRIMP U-Pb dating of detrital zircons. J. Geol. Soc. Lond. 1996, 153, 911–929. [Google Scholar]
- Blum, M.D.; Milliken, K.T.; Pecha, M.A.; Snedden, J.W.; Frederick, B.C.; Galloway, W.E. Detrital-zircon records of Cenomanian, Paleocene, and Oligocene Gulf of Mexico drainage integration and sediment routing: Implications for scales of basin-floor fans. Geosphere 2017, 13, 1–37. [Google Scholar] [CrossRef]
- Fisher, M.J.; Mudge, D.C. Triassic. In Petroleum Geology of the North Sea: Basic Concepts and Recent Advances; Glennie, K.W., Ed.; Blackwell Science Ltd.: Oxford, UK, 1998; pp. 212–244. [Google Scholar]
- Herries, R.; Poddubiuk, R.; Wilcockson, P. Solan, Strathmore and the back basin play, west of Shetland. In Petroleum Geology of Northwest Europe: Proceedings of the 5th Conference; Fleet, A.J., Boldy, S.A.R., Eds.; Geological Society: London, UK, 1999; pp. 693–712. [Google Scholar]
- Swiecicki, T.; Wilcockson, P.; Canham, A.; Whelan, G.; Homann, H. Dating, correlation and stratigraphy of the Triassic sediments in the West Shetlands area. In Permian and Triassic Rifting in Northwest Europe; Boldy, S.A.R., Ed.; Geological Society, Special Publications: London, UK, 1995; Volume 91, pp. 57–85. [Google Scholar]
- Goldsmith, P.J.; Hudson, G.; Van Veen, P. Triassic. In The Millenium Atlas: Petroleum Geology of the Central and Northern North Sea; Evans, D., Graham, C., Armour, A., Bathurst, P., Eds.; Geological Society: London, UK, 2003; pp. 105–127. [Google Scholar]
- Goldsmith, P.J.; Rich, B.; Standring, J. Triassic correlation and stratigraphy in the southern Central Graben, UK North Sea. In Permian and Triassic Rifting in Northwest Europe; Boldy, S.A.R., Ed.; Geological Society, Special Publications: London, UK, 1995; Volume 91, pp. 123–143. [Google Scholar]
- Mouritzen, C.; Farris, M.A.; Morton, A.; Matthews, S. Integrated Triassic stratigraphy of the greater Culzean area, UK central North Sea. Pet. Geosci. 2017, 24, 197–207. [Google Scholar] [CrossRef]
- Morton, A.C.; Herries, R.; Fanning, C.M. Correlation of Triassic sandstones in the Strathmore Field, west of Shetland, using heavy mineral provenance signatures. In Heavy Minerals in Use, Developments in Sedimentology; Mange, M., Wright, D.T., Eds.; Elsevier: Amsterdam, The Netherlands, 2007; Volume 58, pp. 1037–1072. [Google Scholar]
- McKie, T.; Jolley, S.J.; Kristensen, M.B. Stratigraphic and structural compartmentalization of dryland fluvial reservoirs: Triassic Heron Cluster, Central North Sea. In Reservoir Compartmentalization; Jolley, S.J., Fisher, Q.J., Ainsworth, R.B., Vrolijk, P.J., Delisle, S., Eds.; Geological Society, Special Publications: London, UK, 2010; Volume 347, pp. 165–198. [Google Scholar]
- Jeans, C.V.; Reed, S.J.B.; Xing, M. Heavy mineral stratigraphy in the UK Trias: Western Approaches, onshore England and the Central North Sea. In Petroleum Geology of Northern Europe: Proceedings of the 4th Conference; Parker, J.R., Ed.; Geological Society: London, UK, 1993; pp. 609–624. [Google Scholar]
- McKie, T.; Audretsch, P. Depositional and structural controls on Triassicreservoir performance in the Heron Cluster, ETAP, Central North Sea. In Petroleum Geology: North-West Europe and Global Perspectives–Proceedings of the 6th Petroleum Geology Conference; Doré, A.G., Vining, B.A., Eds.; Geological Society: London, UK, 2005; pp. 285–298. [Google Scholar]
- Hurst, A.R.; Morton, A.C. An application of heavy-mineral analysis to lithostratigraphy and reservoir modelling in the Oseberg Field, northern North Sea. Mar. Pet. Geol. 1988, 5, 157–169. [Google Scholar] [CrossRef]
- Graue, E.; Helland-Hansen, W.; Johnsen, J.; Lømo, L.; Nøttvedt, A.; Rønning, K.; Ryseth, A.; Steel, R.J. Advance and retreat of Brent delta system, Norwegian North Sea. In Petroleum Geology of North West Europe; Brooks, J., Glennie, K.W., Eds.; Graham and Trotman: London, UK, 1987; pp. 915–937. [Google Scholar]
- Johnsen, J.R.; Rutledal, H.; Nilsen, D.E. Jurassic Reservoirs Field Examples from the Oseberg and Troll Fields: Horda Platform Area; Norwegian Petroleum Society Special Publications; Elsevier: Amsterdam, The Netherlands, 1995; Volume 4, pp. 199–234. [Google Scholar]
- Morton, A.C.; Hallsworth, C.R.; Chalton, B. Garnet compositions in Scottish and Norwegian basement terrains: A framework for interpretation of North Sea sandstone provenance. Mar. Pet. Geol. 2004, 21, 393–410. [Google Scholar] [CrossRef]
- Mange, M.A.; Morton, A.C. Geochemistry of heavy minerals. In Heavy Minerals in Use, Developments in Sedimentology; Mange, M., Wright, D.T., Eds.; Elsevier: Amsterdam, The Netherlands, 2007; Volume 58, pp. 345–391. [Google Scholar]
- Morton, A.C.; Stiberg, J.P.; Hurst, A.; Qvale, H. Use of heavy minerals in lithostratigraphic correlation, with examples from the Brent sandstones of the northern North Sea. In Correlation in Hydrocarbon Exploration; Collinson, J., Ed.; Graham and Trotman: London, UK, 1989; pp. 217–230. [Google Scholar]
- Morris, P.H.; Payne, S.N.J.; Richards, D.P.J. Micropalaeontological biostratigraphy of the Magnus Sandstone Member (Kimmeridgian-Early Volgian), Magnus Field, UK North Sea. In Biostratigraphy in Production and Development Geology; Jones, R.W., Simmons, M.D., Eds.; Geological Society, Special Publications: London, UK, 1999; Volume 152, pp. 55–73. [Google Scholar]
- Fraser, S.; Robinson, A.M.; Johnson, H.D.; Underhill, J.R.; Kadolsky, D.G.A.; Connell, R.; Johannessen, P.; Ravnås, R. Upper Jurassic. In The Millenium Atlas: Petroleum Geology of the Central and Northern North Sea; Evans, D., Graham, C., Armour, A., Bathurst, P., Eds.; Geological Society: London, UK, 2003; pp. 157–189. [Google Scholar]
- De’ath, N.G.; Schuyleman, S.F. The geology of the Magnus oilfield. In Petroleum Geology of the Continental Shelf of Northwest Europe; Illing, L.V., Hobson, G.D., Eds.; Heyden: London, UK, 1981; pp. 342–351. [Google Scholar]
- Shepherd, M. The Magnus Field, Blocks 211/7a, 12a, UK North Sea. In United Kingdom Oil and Gas Fields, 25 Years Commemorative Volume; Abbotts, I.L., Ed.; Geological Society, Memoir: London, UK, 1991; Volume 14, pp. 153–157. [Google Scholar]
- Meinhold, G.; Anders, B.; Kostopoulos, D.; Reischmann, T. Rutile chemistry and thermometry as provenance indicator: An example from Chios Island, Greece. Sediment. Geol. 2008, 203, 98–111. [Google Scholar] [CrossRef]
- Watson, E.B.; Wark, D.A.; Thomas, J.B. Crystallization thermometers for zircon and rutile. Contrib. Miner. Petrol. 2006, 151, 413–433. [Google Scholar] [CrossRef]
- Stephenson, D. Introduction. In Caledonian Igneous Rocks of Great Britain; Geological Conservation Review Series; Stephenson, D., Bevins, R.E., Millward, D., Stone, P., Parsons, I., Highton, A.J., Wadsworth, W.J., Eds.; Joint Nature Conservation Committee: Peterborough, UK, 2000; Volume 17, pp. 3–26. [Google Scholar]
- Chew, D.M.; Strachan, R.A. The Laurentian Caledonides of Scotland and Ireland. In New Perspectives on the Caledonides of Scandinavia and Related Areas; Corfu, F., Gasser, D., Chew, D.M., Eds.; Geological Society, Special Publications: London, UK, 2014; Volume 390, pp. 45–91. [Google Scholar]
- Schmidt, A.S.; Morton, A.C.; Nichols, G.J.; Fanning, C.M. Interplay of proximal and distal sources in Devonian-Carboniferous sandstones of the Clair Basin, West of Shetland, revealed by detrital zircon U-Pb ages. J. Geol. Soc. Lond. 2012, 169, 691–702. [Google Scholar] [CrossRef]
- Cutts, K.A.; Hand, M.; Kelsey, D.E.; Wade, B.; Strachan, R.A.; Clark, C.; Netting, A. Evidence for 930 Ma metamorphism in the Shetland Islands, Scottish Caledonides: Implications for Neoproterozoic tectonics in the Laurentian-Baltica sector of Rodinia. J. Geol. Soc. Lond. 2009, 166, 1033–1047. [Google Scholar] [CrossRef]
- Strachan, R.A.; Prave, A.R.; Kirkland, C.L.; Storey, C.D. U-Pb detrital zircon geochronology of the Dalradian Supergroup, Shetland Islands, Scotland: Implications for regional correlations and Neoproterozoic–Palaeozoic basin development. J. Geol. Soc. Lond. 2013, 170, 905–916. [Google Scholar] [CrossRef]
- Prichard, H.M.; Lord, R.A. The Shetland Ophiolite: Evidence for a supra-subduction zone origin and implications for platinum-group element mineralization. In Mineral Deposits within the European Community; Boissonnas, L., Omenetto, P., Eds.; Springer: Berlin, Germany, 1988; pp. 289–302. [Google Scholar]
- Morton, A.C. The role of heavy mineral analysis during drilling of high angle wells. In Heavy Minerals in Use, Developments in Sedimentology; Mange, M., Wright, D.T., Eds.; Elsevier: Amsterdam, The Netherlands, 2007; Volume 58, pp. 1123–1142. [Google Scholar]
- Morton, A.C.; Spicer, P.J.; Ewen, D.F. Geosteering of high-angle wells using heavy mineral analysis: The Clair Field, West of Shetland. In Horizontal Wells: Focus on the Reservoir; Carr, T.R., Mason, E.P., Feazel, C.T., Eds.; American Association of Petroleum Geologists, Methods in Exploration: Tulsa, OK, USA, 2003; Volume 14, pp. 249–260. [Google Scholar]
- Morton, A.C.; Hallsworth, C.R.; Kunka, J.; Laws, E.; Payne, S.; Walder, D. Heavy mineral stratigraphy of the Clair Group (Devonian) in the Clair Field, west of Shetland, UK. In Application of Modern Stratigraphic Techniques: Theory and Case Histories; Ratcliffe, K.T., Zaitlin, B.A., Eds.; SEPM Special Publication: Broken Arrow, OK, USA, 2010; Volume 94, pp. 183–199. [Google Scholar]
- Morton, A.; Milne, A. Heavy mineral stratigraphic analysis on the Clair Field, UK West of Shetlands—A unique real-time solution for redbed correlation while drilling. Pet. Geosci. 2012, 18, 115–127. [Google Scholar] [CrossRef]
- Nichols, G.J. Sedimentary evolution of the Lower Clair Group, Devonian, west of Shetland: Climate and sediment supply controls on fluvial, aeolian and lacustrine deposition. In Petroleum Geology: North-West Europe and Global Perspectives—Proceedings of the 6th Petroleum Geology Conference; Doré, A.G., Vining, B., Eds.; Geological Society: London, UK, 2005; pp. 957–967. [Google Scholar]
- Knox, R.W.O.B.; Cocker, J.D.; Filatoff, J. Heavy mineral stratigraphy of the Unayzah Formation and Basal Khuff Clastics (Carboniferous to Permian) of Central Saudi Arabia. GeoArabia 2010, 15, 17–80. [Google Scholar]
- Knox, R.W.O.B.; Franks, S.G.; Cocker, J.D. Stratigraphic evolution of heavy-mineral provenance signatures in the sandstones of the Wajid Group (Cambrian to Permian), southwestern Saudi Arabia. GeoArabia 2007, 12, 65–96. [Google Scholar]
- Naing, T.T.; Bussien, D.A.; Winkler, W.H.; Nold, M.; von Quadt, A. Provenance study on Eocene–Miocene sandstones of the Rakhine Coastal Belt, Indo-Burman Ranges of Myanmar: Geodynamic implications. In Sediment Provenance Studies in Hydrocarbon Exploration and Production; Scott, R.A., Smyth, H.R., Morton, A.C., Richardson, N., Eds.; Geological Society, Special Publications: London, UK, 2014; Volume 386, pp. 195–216. [Google Scholar]
- Morton, A.C.; Humphreys, B.; Manggal, G.; Fanning, C.M. Provenance and correlation of Upper Jurassic and Lower Cretaceous reservoir sandstones in Papua New Guinea using heavy mineral analysis. In Petroleum Exploration and Development in Papua New Guinea: Proceedings of the Fourth PNG Petroleum Convention; Buchanan, P.G., Grainge, A.M., Thornton, R.C.N., Eds.; PNG Chamber of Mines and Petroleum: Port Moresby, Papua New Guinea, 2000; pp. 187–203. [Google Scholar]
- Pindell, J.; Kennan, L.; Wright, D.; Erikson, J. Clastic domains of sandstones in central/eastern Venezuela, Trinidad, and Barbados: Heavy mineral and tectonic constraints on provenance and palaeogeography. In the Origin and Evolution of the Caribbean Plate; James, K., Lorente, M.A., Pindell, J., Eds.; Geological Society, Special Publications: London, UK, 2009; Volume 328, pp. 743–797. [Google Scholar]
- Vincent, H.; Wach, G. The detrital record of Cretaceous to Pliocene sandstones across the NE South American margin. J. Geol. Soc. Lond. 2017, 174, 434–452. [Google Scholar] [CrossRef]
Figure 1.
Location map of the North Sea and west of Shetland areas showing the oil and gas fields discussed in this paper. Numbers are the UK and Norwegian quadrants.
Figure 1.
Location map of the North Sea and west of Shetland areas showing the oil and gas fields discussed in this paper. Numbers are the UK and Norwegian quadrants.

Figure 2.
Triassic stratigraphy of the central North Sea and Strathmore Field areas, adapted from Goldsmith et al. [46,47], Swiecicki et al. [45], Herries et al. [44], and Mouritzen et al. [48].

Figure 3.
Correlation of the Triassic in Strathmore Fields wells 204/30a-2, 205/26a-3, and 205/26a-4 using heavy mineral provenance-sensitive ratio signatures. For well locations, see Figure 1. FF = Foula Formation, OBF = Otter Bank Formation, OSBF = Otter Bank Shale Formation
Figure 3.
Correlation of the Triassic in Strathmore Fields wells 204/30a-2, 205/26a-3, and 205/26a-4 using heavy mineral provenance-sensitive ratio signatures. For well locations, see Figure 1. FF = Foula Formation, OBF = Otter Bank Formation, OSBF = Otter Bank Shale Formation

Figure 4.
Crossplots of the provenance-sensitive heavy mineral ratios ATi, GZi, and RuZi showing (upper) discrimination of Foula and Otter Bank sandstones, and (lower) slight deviation in ATi between data from cores and ditch cuttings.
Figure 4.
Crossplots of the provenance-sensitive heavy mineral ratios ATi, GZi, and RuZi showing (upper) discrimination of Foula and Otter Bank sandstones, and (lower) slight deviation in ATi between data from cores and ditch cuttings.


Figure 5.
Stratigraphic subdivision of the Triassic Skagerrak Formation of well 22/24a-5Z (see Figure 1) using morphological variations of tourmaline, zircon, and apatite [34]. Note that the conventional heavy mineral data from the same interval show no systematic variation.

Figure 6.
Heavy mineral zonation of the Triassic Skagerrak Formation in Marnock Field well 22/24a-5 and Culzean Field well 22/25a-9Z using apatite roundness index (ARi) and zircon:apatite index (ZAi), after Mouritzen et al. [48]. For 22/24b-5Z, note the correspondence between the Mouritzen et al. zonation [48] and the earlier subdivision by Mange-Rajetzky [34], as shown in Figure 5.

Figure 7.
Semi-regional correlation of the Triassic in UK quadrant 22, central North Sea, using variations in apatite morphology [48]. For well locations, see Figure 1.

Figure 8.
Stratigraphic breakdown and correlation of the Brent Group in Oseberg Fields well 30/6-7, 30/6-9, and 30/6-10A using garnet geochemical signatures. AL = almandine, SP = spessartine, GR = grossular, PYR = pyrope. Garnet fields A, B, and C are as defined by Morton et al. [56] and Mange and Morton [57]. Yellow = sandstone, grey = mudstone, black = coal.

Figure 9.
Stratigraphy of the reservoir interval in the Magnus Field, northern North Sea [59,60,62]. Yellow = sandstone, grey = mudstone, black = high-gamma (organic-rich) mudstone.

Figure 10.
Provenance-sensitive heavy mineral ratios for the Magnus Sandstone and Ptarmigan Sandstone members in the Magnus Field (see Figure 1). Note that there is no clear discrimination between the two sandstones in terms of ATi, RuZi, and MZi values. GZi is much lower in the Ptarmigan sandstone but this unit is more deeply buried and the lower GZi is likely to be a function of greater diagenetic modification.

Figure 11.
Discrimination of Magnus and Ptarmigan sandstones using rutile trace element geochemistry. Magnus rutile populations are dominated by metapelitic types and include a high proportion that formed in high-grade granulite facies conditions, whereas Ptarmigan sandstones have much higher proportions of metamafic types and lack evidence for high-grade metamorphism. Categorisation of metamafic and metapelitic rutiles uses Cr and Nb contents as defined by Meinhold et al. [63]. Crystallisation temperatures were determined using Zr contents following Watson et al. [64].

Figure 12.
Probability-density plots of detrital zircon ages in three Magnus Sandstone Member samples (211/7-1, 3197.0 m; 211/8-1, 3418.1 m; 211/12-1, 2938.2 m) and one Ptarmigan Sandstone Member sample (211/12-1, 3482.0 m), confirming the rutile geochemical evidence for a difference in provenance. ‘n’ is number of zircons with <10% discordance in the total zircon population.

Figure 13.
Heavy mineral stratigraphic framework for the Devonian-Carboniferous Clair Group reservoir succession in the Clair field, west of Shetland (Figure 1), illustrated using the fully cored well 206/8-8. Stratigraphic units (I, II, etc.) were originally defined by Allen and Mange-Rajetzky [37] and subsequently revised by Morton et al. [73] and Morton and Milne [74].

Figure 14.
Variations in heavy mineral parameters acquired at the well site during drilling of the high-angle well 206/8-A16, Clair Field, west of Shetland, together with the interpreted stratigraphy. Note the highly anomalous resistivity log responses in units IV, V, and VIa, caused by extensive mineralisation. Well location is shown in Figure 1 and the geological interpretation along the well track is shown in Figure 15.


© 2018 by the authors. Licensee MDPI, Basel, Switzerland. This article is an open access article distributed under the terms and conditions of the Creative Commons Attribution (CC BY) license (http://creativecommons.org/licenses/by/4.0/).
Share and Cite
MDPI and ACS Style
Morton, A.; McGill, P. Correlation of Hydrocarbon Reservoir Sandstones Using Heavy Mineral Provenance Signatures: Examples from the North Sea and Adjacent Areas. Minerals 2018, 8, 564. https://doi.org/10.3390/min8120564
AMA Style
Morton A, McGill P. Correlation of Hydrocarbon Reservoir Sandstones Using Heavy Mineral Provenance Signatures: Examples from the North Sea and Adjacent Areas. Minerals. 2018; 8(12):564. https://doi.org/10.3390/min8120564
Chicago/Turabian StyleMorton, Andrew, and Paula McGill. 2018. "Correlation of Hydrocarbon Reservoir Sandstones Using Heavy Mineral Provenance Signatures: Examples from the North Sea and Adjacent Areas" Minerals 8, no. 12: 564. https://doi.org/10.3390/min8120564
Note that from the first issue of 2016, this journal uses article numbers instead of page numbers. See further details here.