1. Introduction
Quartz is a very common gangue mineral in hydrothermal metallic ore veins [
1]. Though gangue minerals are defined as “non-valuable” [
2], quartz can preserve information about physicochemical conditions of a vein genesis that can be valuable in order to understand mineral deposit formations [
3].
Despite the rather simple structure of hydrothermal quartz (SiO
4 tetrahedrons), it often contains point defects, line defects, and three-dimensional defects. Such structural defects reflect changes in conditions during different geological processes such as primary crystallization, metamorphism, changes in crystallization temperatures, alterations, secondary dissolution-precipitation, etc. [
1,
3,
4,
5,
6].
Defects in quartz crystal structure are considered activators of cathodoluminescence (CL) [
7,
8]. CL phenomena can be described as the emission of photons of characteristic wavelengths evoked by “bombarding” the material with an accelerated beam of high-energy electrons [
7,
8,
9]. These emissions can be captured by a CL detector, providing an image of the structure of the analysed material unobservable by any other method. When CL is combined with other analytical methods such as, e.g., the analysis of chemical composition, stable isotopes, or fluid inclusions, the obtained data can clarify issues of the material’s origin [
10,
11,
12]. At least five characteristic emission bands of different wavelengths in quartz and their activation centres have been described [
13,
14,
15,
16].
According to Rusk [
3], hydrothermal quartz displays more variable CL textures than other types of quartz due to many different geological processes that occur during the genesis of hydrothermal veins and mineral deposits. Thanks to CL, it is possible to detect and study different generations of hydrothermal quartz and their mutual relationship or relation to ore mineralization. Thus, CL analyses are frequently utilized in mineral deposit studies [
17,
18,
19,
20].
Mokrsko, with its ~100 t of gold resources (~3.2 Moz), ranks among the largest gold deposits in Europe [
21]. Despite extensive exploration [
21,
22] and several scientific studies [
23,
24,
25], the origin of the deposit is still not fully understood. There are several types of gold-bearing hydrothermal quartz veins crystallized under different temperature and pressure conditions [
22,
23].
This paper aims to identify individual quartz growth generations, its succession, and mutual relationship using a high-resolution CL imaging of up to 1 cm diagonally large sectors of quartz veins accompanied by the analysis of CL emission spectra. The geochemistry of trace elements in hydrothermal quartz veins was also studied by low detection limit laser ablation inductively coupled plasma mass spectrometry (LA-ICP-MS) analyses. Detailed mapping of CL textures of hydrothermal quartz and its trace elements chemistry will provide insight into the structure and composition of veins at the gold deposit. Such information will help to better understand the quartz vein genesis at the Mokrsko gold deposit.
2. Mokrsko Gold Deposit
2.1. Geological Setting
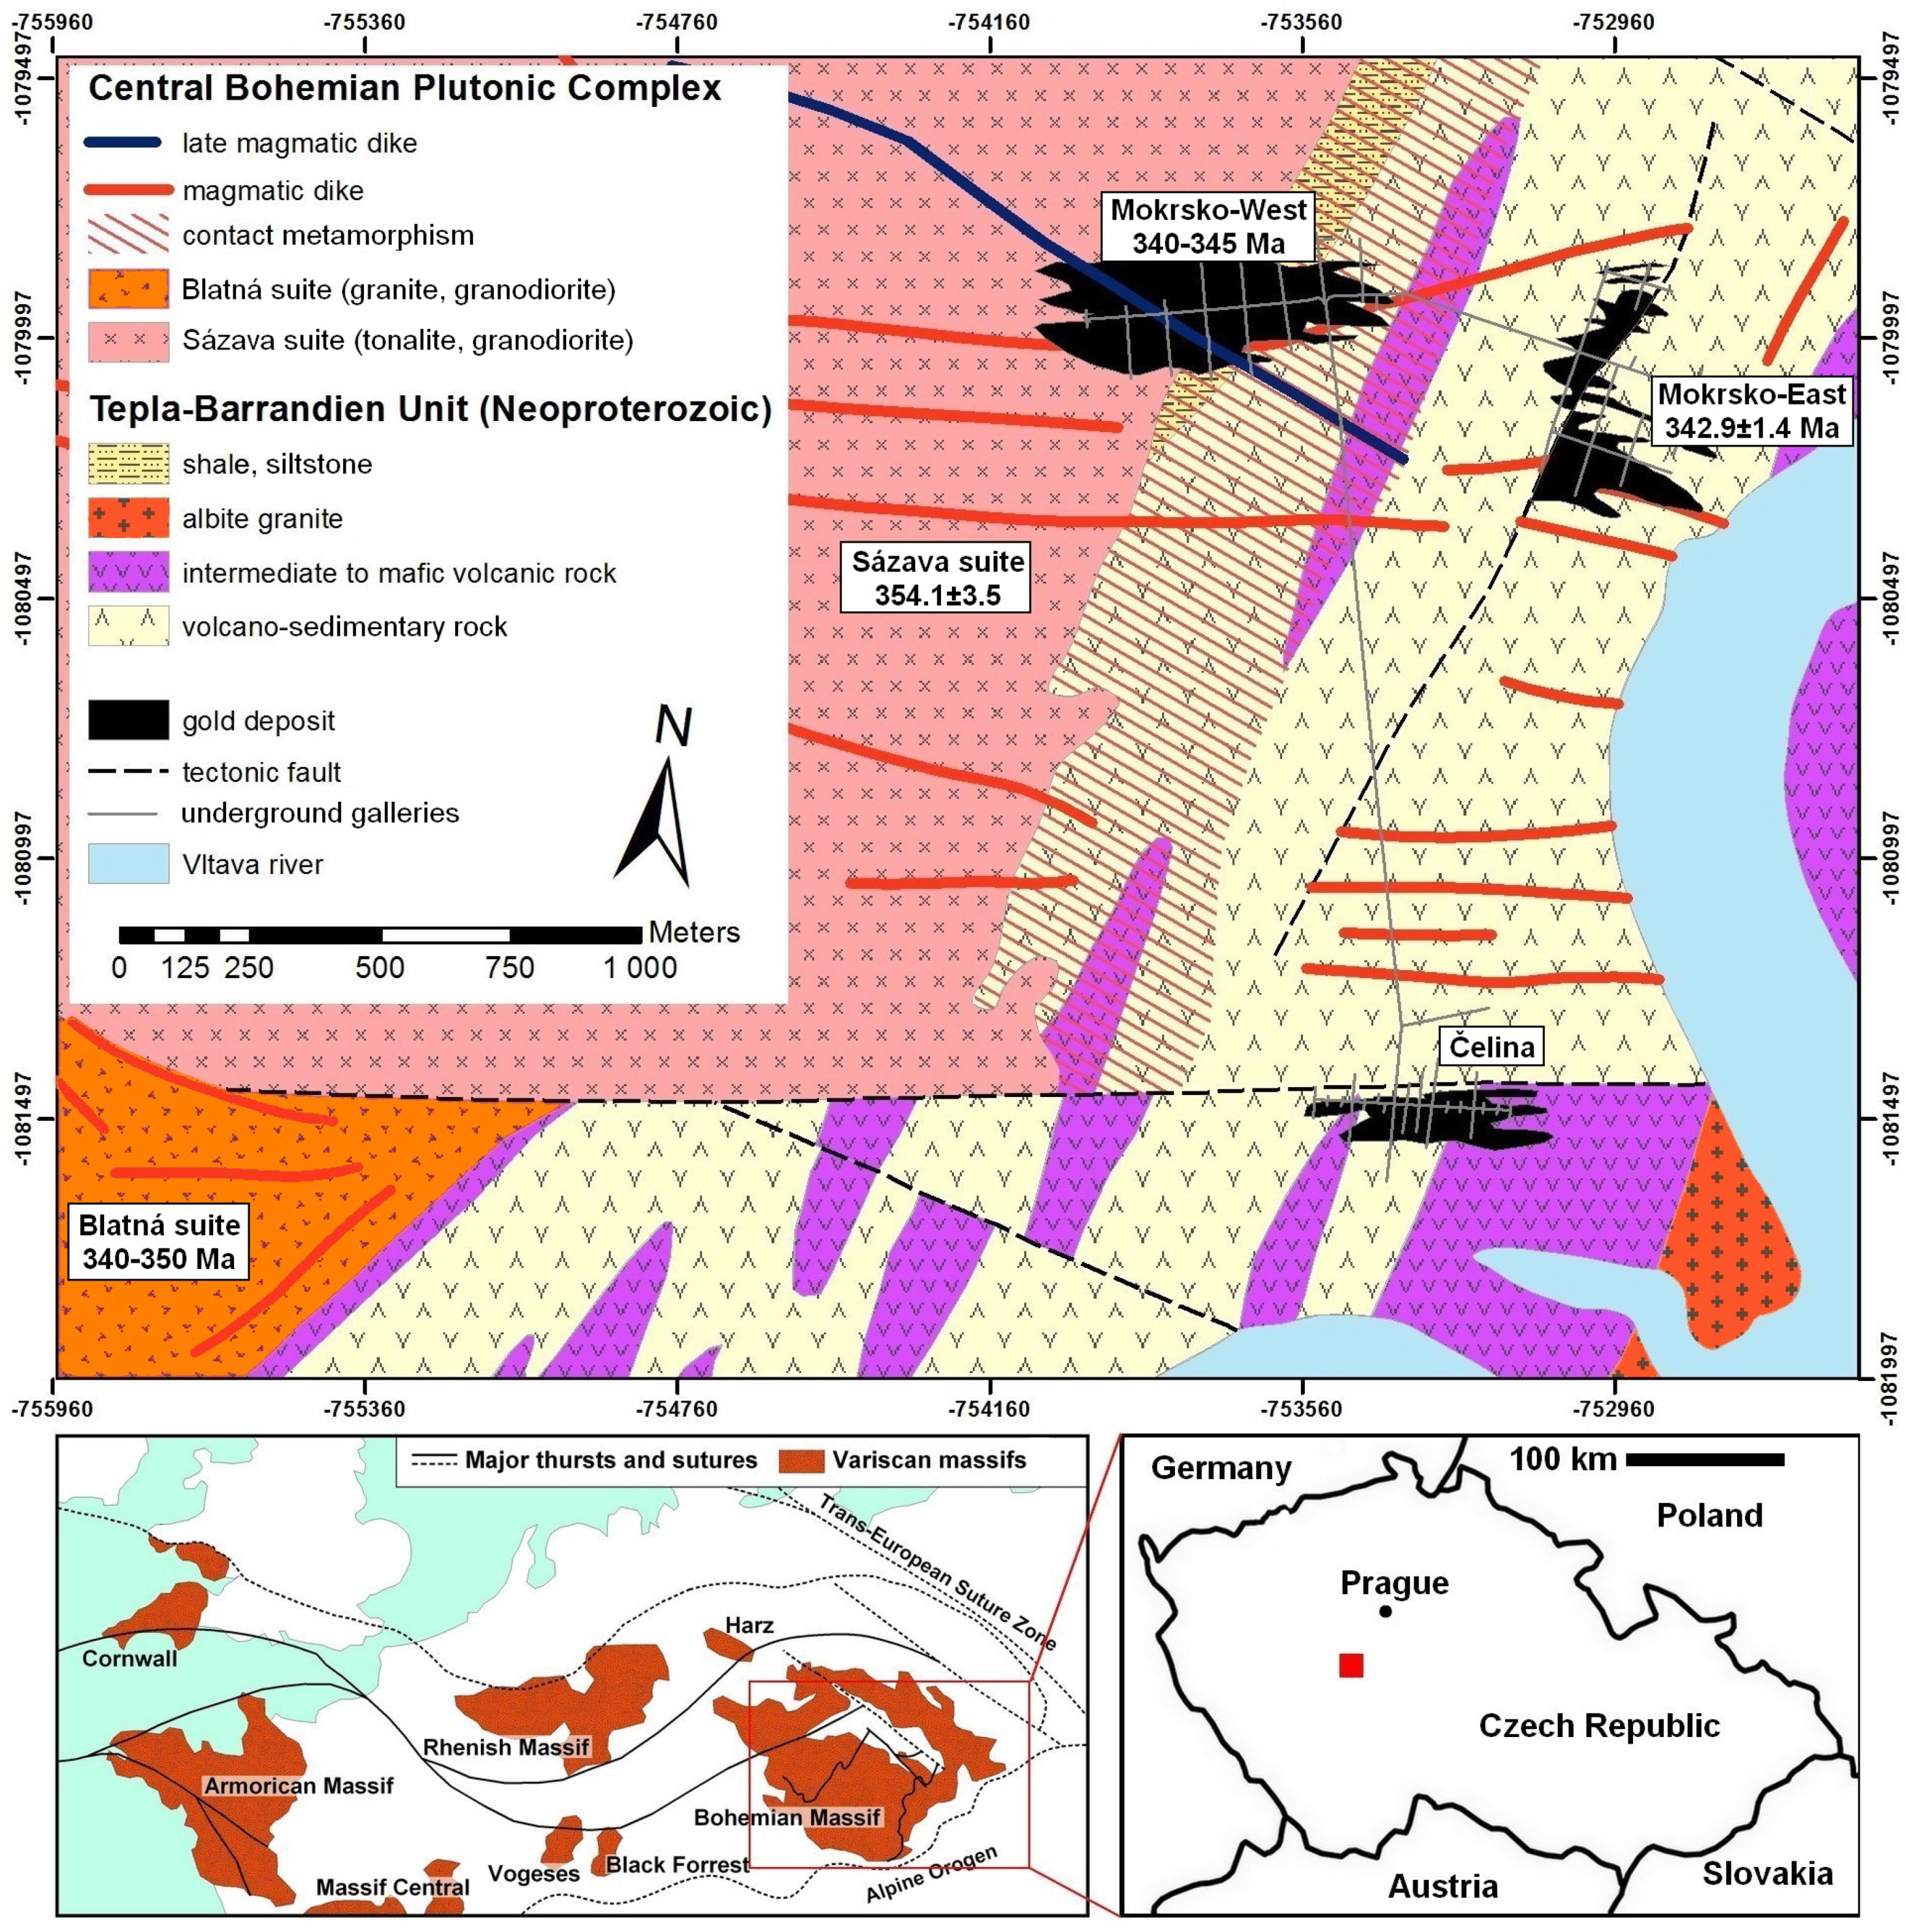
The main gold metallogenetic phases in the Bohemian Massif, including the formation of the Mokrsko gold deposit, were temporally and spatially connected with the Variscan orogeny [
26,
27], which formed the main tectonic units in Western and Central Europe during the Carboniferous time (
Figure 1, [
28]). Many of the gold deposits in the Bohemian Massif were formed in conjunction with a large granitoid mass of the Variscan Central Bohemian Plutonic Complex (~360–330 Ma [
29,
30]).
Two of three main ore bodies of the Mokrsko gold deposit, the Čelina and the Mokrsko-East deposits (
Figure 1), are hosted by volcanic rocks of acidic to basic composition belonging to the Jílové Belt, part of the Neoproterozoic Teplá–Barrandian Unit [
31,
32]. Toward the west, the Jílové Belt was affected by contact metamorphism caused by the emplacement of the Sázava suite. The Variscan Sázava suite (
Figure 1) is composed mostly of calc-alkaline biotite-amphibole tonalite, granodiorite, and quartz diorite. This contact zone hosts the largest ore body of the ore district—the Mokrsko-West deposit (
Figure 1). U–Pb zircon radiometric dating of the Sázava suite gave 354.1 ± 3.5 Ma [
30]. The other Variscan intrusive suite in the vicinity of the ore district is the Blatná suite, the largest suite of the Central Bohemian Plutonic Complex. The Blatná suite is characterised by high-potassic calc-alkaline biotite granodiorite and granite [
33]. The Blatná suite is slightly younger then the Sázava suite; U–Pb zircon radiometric dating has yielded crystallization ages from 340 to 350 Ma [
29,
33,
34]. Re–Os radiometric dating of molybdenite from hydrothermal quartz veins in the gold deposit gave ages from 340 to 345 Ma [
27,
35].
Both intrusive suites are distinct in regional tectonic setting as well as in magma origin. The Sázava suite is a geochemically rather primitive intrusion with magma originated from a depleted mantle wedge [
30,
33] that was emplaced in the upper crustal Teplá–Barrandian Unit during regional shortening/transpression [
36]. Differently, the Blatná suite represents a geochemically more evolved intrusion that originated from the mixing between acidic (granodioritic) magma and a basic component derived from a moderately enriched mantle source [
33]. The tectonic setting is also different with the Blatná suite, indicating emplacement during the switch from transpression to the onset of exhumation of the middle to lower-crustal Moldanubian Unit [
37].
2.2. Characteristics of the Mokrsko Gold Deposit
Quartz veins of all three ore bodies (
Figure 1) were emplaced in a fissure system that formed in an east-west direction due to the north-south extension in both the Jílové Belt and the Central Bohemian Plutonic Complex. The extension allowed the emplacement of both sub-vertical up to one-meter thick quartz veins and a sheeted veinlet system [
22]. Morávek et al. [
21], Boiron et al. [
23], Zachariáš et al. [
24] and Zachariáš [
25] divided the mineralization into three phases based on fluid inclusions, stable O-isotope composition, as well as mineralogical composition and vein structure.
Zachariáš et al. [
24] marked the earliest phase as the quartz stage consisting of massive quartz mineralization accompanied by minor sulphide mineralization. Morávek et al. [
22] reported the pressure and temperature conditions of ~270 MPa and 450 °C for this early stage. Zachariáš et al. [
24] calculated the P–T window for early quartz veins within the range of 450–550 °C and 250–400 MPa.
The distinctive mineralizing event of the Mokrsko gold deposit—the formation of a sheeted veinlet system—took place during the second phase, the quartz-sulphide stage, according to Zachariáš et al. [
24]. The veins are 0.1 mm to 50 mm wide and their frequency is highest in the western part of the Mokrsko-West deposit, with up to more than one hundred veins per meter [
21,
22]. According to Zachariáš et al. [
24], most of the quartz gangue, as well as sulphides, was precipitated during this phase. Arsenopyrite is the most common gold-bearing sulphide at Mokrsko-West and Mokrsko-East, whereas pyrite and pyrrhotine prevail at the Čelina deposit [
22]. For this phase, Zachariáš [
24] estimated temperatures of ~395 °C to ~475 °C based on arsenopyrite thermometry. Boiron et al. [
23] described this phase as the early ore stage and presented a fluid inclusion homogenization temperature of 300–380 °C and pressure of 170–270 MPa. The sheeted veinlet system is developed only at the Mokrsko-West deposit. It is missing on both the Čelina and the Mokrsko-East deposits which makes it difficult to distinguish between the different generations of veins for these two deposits [
25].
The last phase is the precipitation of quartz; ore minerals with significant gold content, calcite, and chlorite in irregular micro-fissures developed in older quartz veins [
21,
23]. Morávek et al. [
22], Boiron et al. [
23] and Zachariáš et al. [
24] concluded that both temperature and pressure were continuously decreasing toward this late mineralization phase, with temperatures in the range of 200–300 °C.
Results from studies conducted during exploration presented by Morávek et al. [
21], Morávek [
22], and detailed fluid inclusion analyses conducted by Boiron et al. [
23] suggested a hydrothermal-metamorphic origin of gold-bearing quartz veins nowadays classified as orogenic gold deposits, for example Groves et al. [
38] and Goldfarb et al. [
39]. Both Morávek et al. [
21] and Boiron et al. [
23] assumed a very limited input of magmatic fluids. In their point of view, intrusion plays the role of a heat source, causing fluid circulation, rather than the role of the main source of fluids.
Zachariáš et al. [
24] describe the features typical for orogenic gold deposits and for so-called intrusive-related gold systems, which include, especially, the presence of a sheeted veinlet system. According Hart and Goldfarb [
40] and Hart [
41] these two deposit models are difficult to distinguish because they have many common features, such as low-salinity CO
2 fluids; Au accompanied with W, Bi, and Te; and also temporal and/or spatial relationship to intrusion. Such features are present also at the Mokrsko gold deposit [
22,
23,
24].
3. Samples and Analytical Methods
Sampling was done in situ from quartz veins and veinlets at the Mokrsko gold deposit. Five samples come from a one-meter wide sub-vertical vein from the Čelina deposit and eight samples from different places at the Mokrsko-West deposit. Mokrsko-East is inaccessible, eight samples were obtained from archives of the Czech Geological Survey and from the personal collection of Petr Morávek.
Polished and carbon-coated thin sections that were 30 µm and 100 µm thick were used for CL and LA-ICP-MS.
The most representative samples, demonstrating relationships between individual CL textures well, were chosen for the acquisition of high-resolution coloured CL images of up to one centimetre diagonally large sectors of thin sections. One CL image for Čelina, two images for Mokrsko-East and three images for Mokrsko-West. High-resolution CL images were obtained using a scanning electron microscope (SEM) TESCAN MIRA3 (TESCAN ORSAY HOLDING a.s., Brno, Czech Republic) with a field emission electron source. The system is equipped with a rainbow colour CL detector using a compact polymethyl methacrylate light guide, transparent in the range of 350 to 650 nm. The working distance was 20 mm; the accelerating voltage and current were set to 25 kV and 6 nA, respectively. Scanning speed ranged from 32 to 1000 ms/pixel, depending on the CL emissivity of the imaged area. Backscatter electron (BSE) images were obtained under identical conditions but with higher scanning speeds.
Selected samples based on high-resolution CL images were subjected to additional CL analyses and measuring of CL emission spectra using a “hot cathode” CL microscope HC1-LM (LUMIC, Bochum, Germany) [
42] operated at 14 kV accelerating voltage and a current of 0.2 mA (current density of about 10 µA/mm
2). Luminescence images were captured “on-line” during CL operations using a Peltier cooled digital video-camera (OLYMPUS DP72). CL spectra in wavelengths ranging from 380 to 1000 nm were recorded with an Acton Research SP-2356 digital triple-grating spectrograph with a Princeton Spec-10 CCD detector attached to the CL microscope by a silica-glass fibre guide.
CL emission spectra were measured under standardized conditions with wavelength calibration by a Hg-halogen lamp, spot width 30 µm, and a measuring time of 5 s. For characterization of the transient CL behaviour of the hydrothermal quartz samples, two representative CL spectra were taken. The first initially and the second after 180 s of electron irradiation.
Trace elements analyses were conducted on the selected samples with high-resolution CL images. We performed 69 analyses at different places in the sample from the up-to-one-meter thick quartz vein at the Čelina deposit, 55 analyses on the two samples from the Mokrsko-East deposit, and 60 analyses on the three samples from the Mokrsko-West deposit. Analyses were done by LA-ICP-MS with the setup consisting of a NewWave Research UP213 laser ablation system emitting a wavelength of 213 nm coupled to an Agilent 7500ce (Agilent Technologies, Hachioji, Japan) quadrupole ICP-MS. The analyses of quartz were performed by using a laser beam diameter of 65 μm, a repetition rate of 10 Hz, laser beam fluence of 8 J/cm−2, and duration of ablation of 60 s. The ablated material was carried out by helium (1.0 L/min). Prior to the ICP-MS, argon (0.6 L/min) was admixed into the helium flow. The certified reference material NIST612 was used for quantification purposes. The isotope 28Si was utilized as an internal standard for suppressing different ablation rates between NIST612 and the quartz samples.
Al, Li, Ti, Ge, Ga Na, K, Ca, Ge, Ga, Fe, and As were chosen for analyses according to their common presence in quartz [
1,
6,
12]. Na, K, and Ca, as well as Fe and As, are elements which are preferably concentrated in fluid and mineral microinclusions in quartz vein deposits with sulphides [
1,
6,
12]. To minimalize the risk of contamination by microinclusions, the measured signal was continuously observed. Ablation spots with signals showing order-scale deviations against the prevailing quartz composition were omitted and assumed to be affected by inclusions. Secondly, the analyses with Na > 800 ppm, K > 800 ppm, Ca > 500 ppm, Fe > 200 ppm, and As > 100 ppm were excluded from the dataset; these threshold values were set based on the average abundance of the trace elements in hydrothermal quartz [
1,
3,
6,
12,
18].
Laser ablation craters 65 μm wide and similarly deep did not allow for the clear measurement of individual quartz growth generations because CL analyses show only the surface of the sample and some quartz generations formed zones only a few μm wide, especially in young microfissure-forming quartz. Therefore, laser ablation spots were measured with the same samples with high-resolution CL images, but we were unable to target individual quartz growth generations defined by CL analyses.
4. Results
4.1. Cathodoluminescence Textures and CL Spectral Analyses
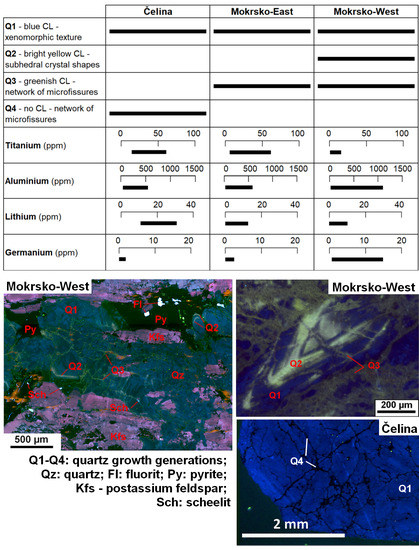
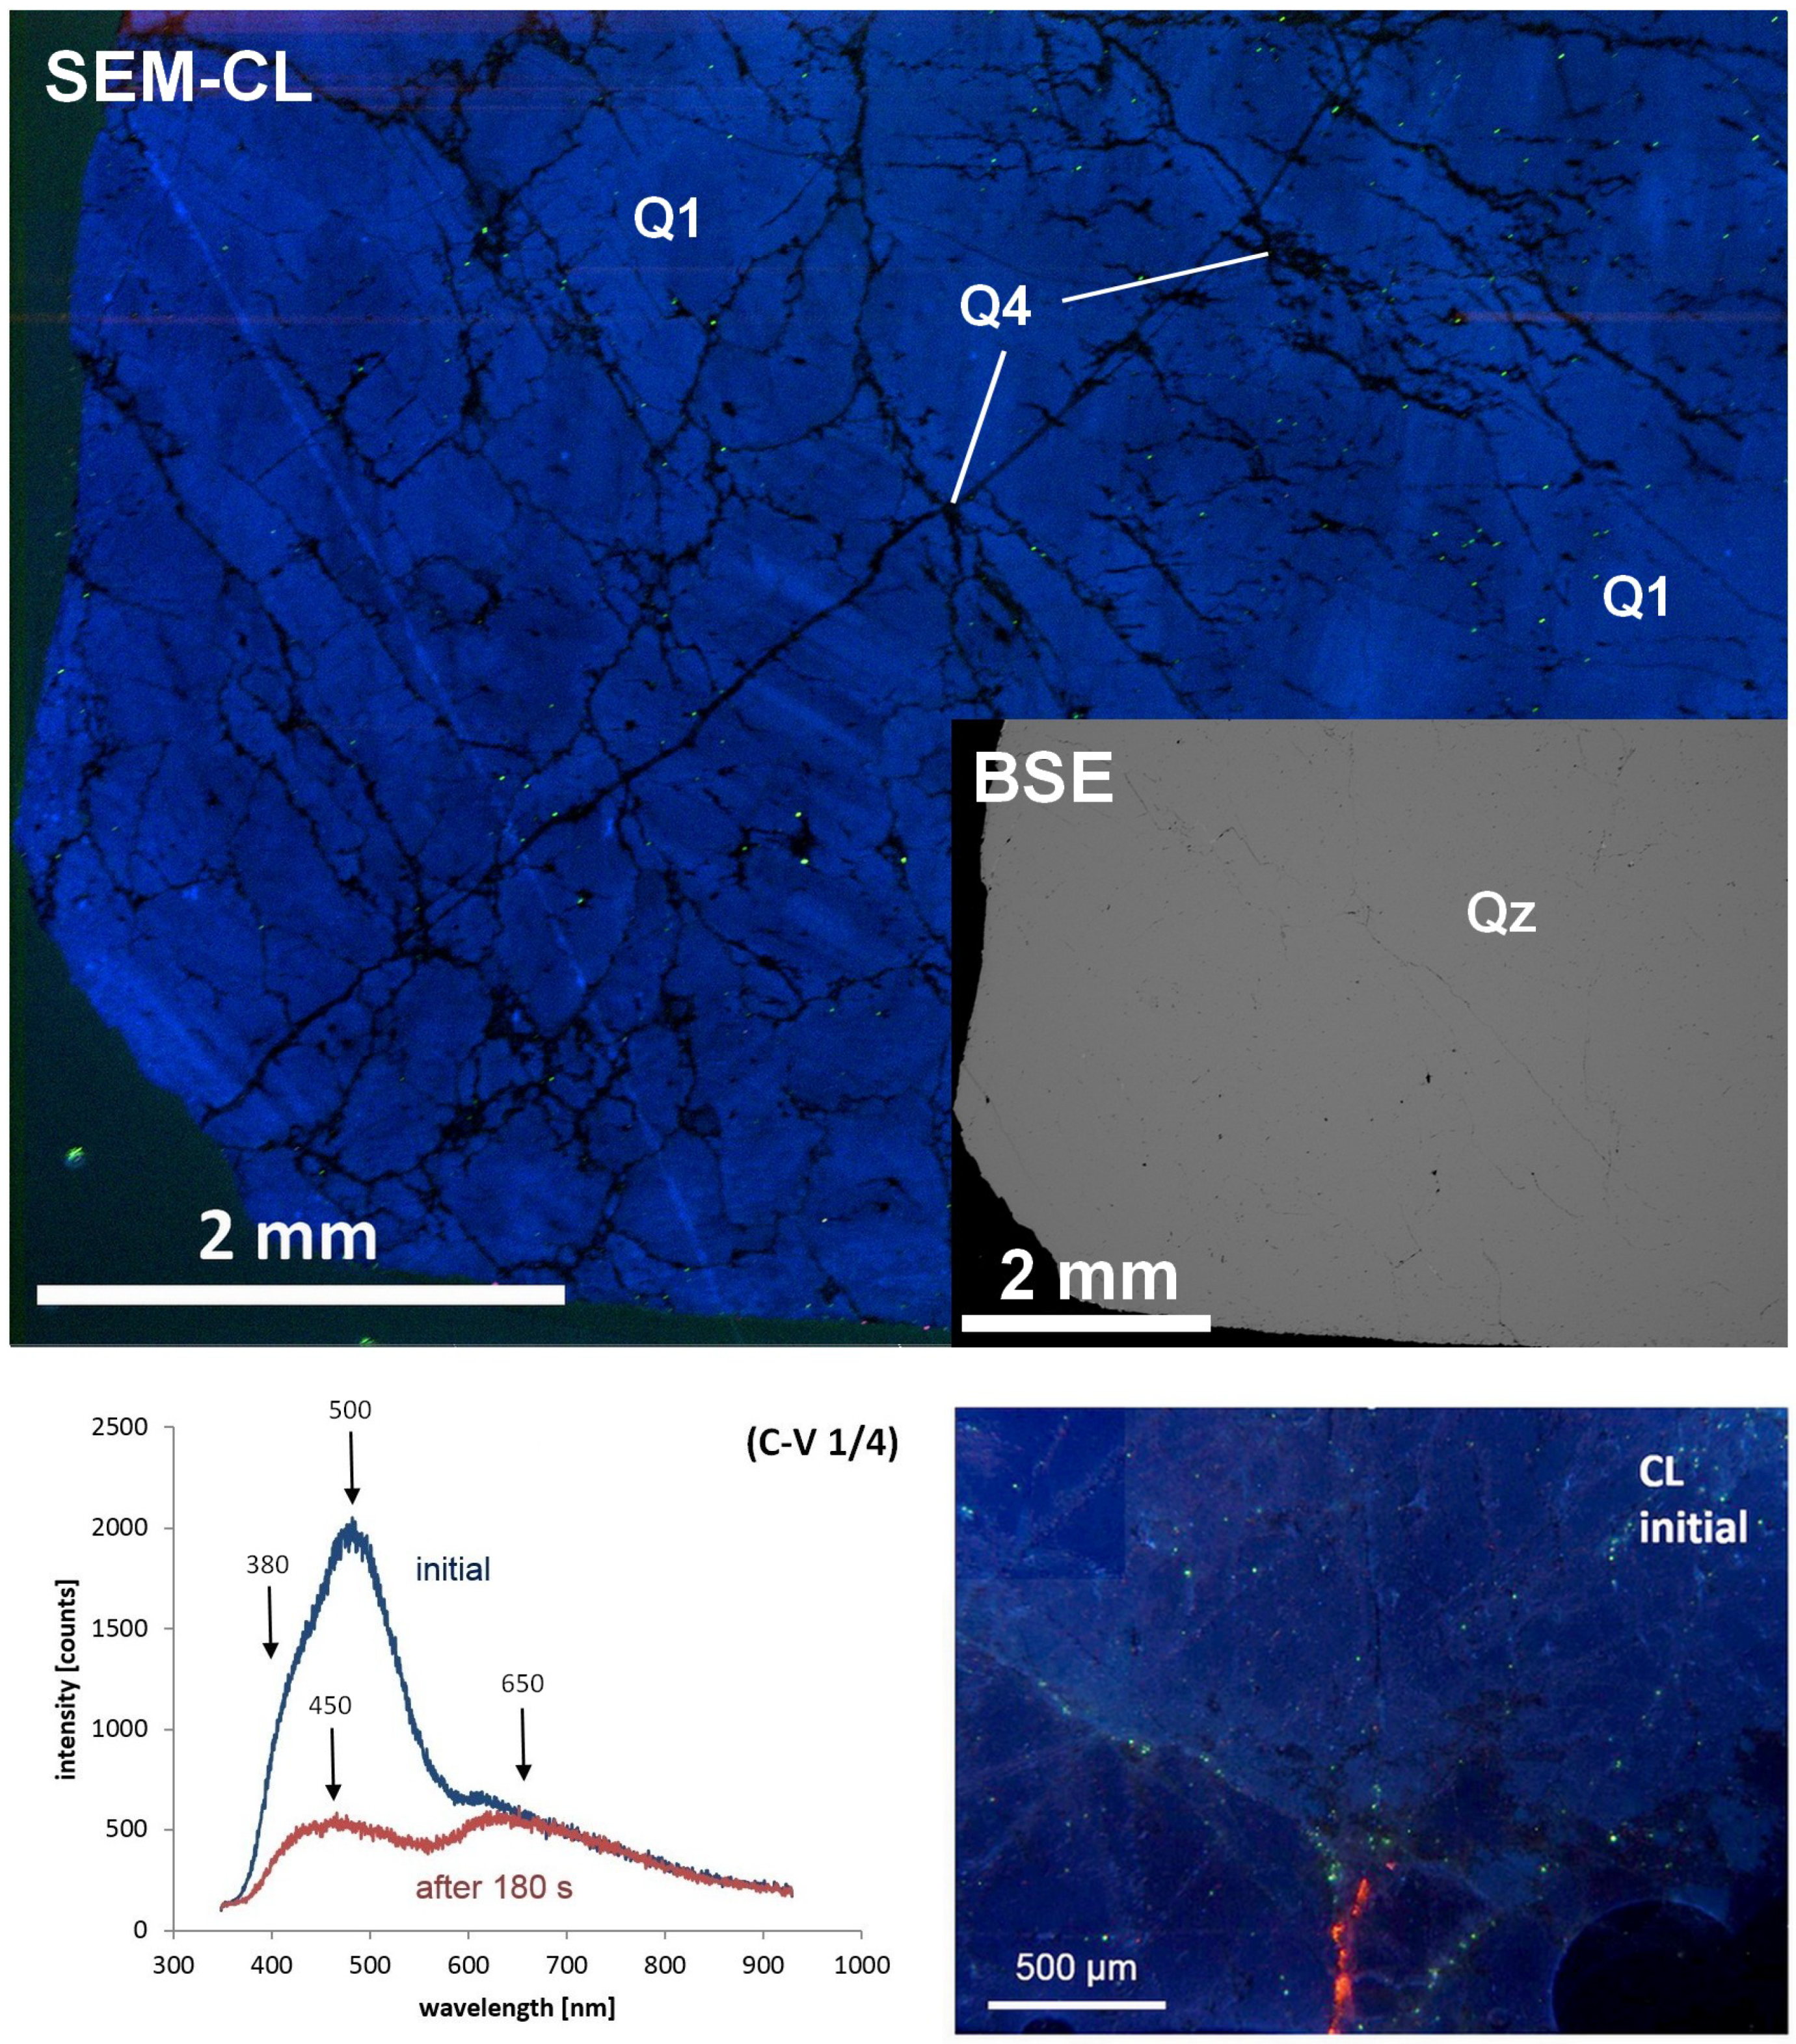
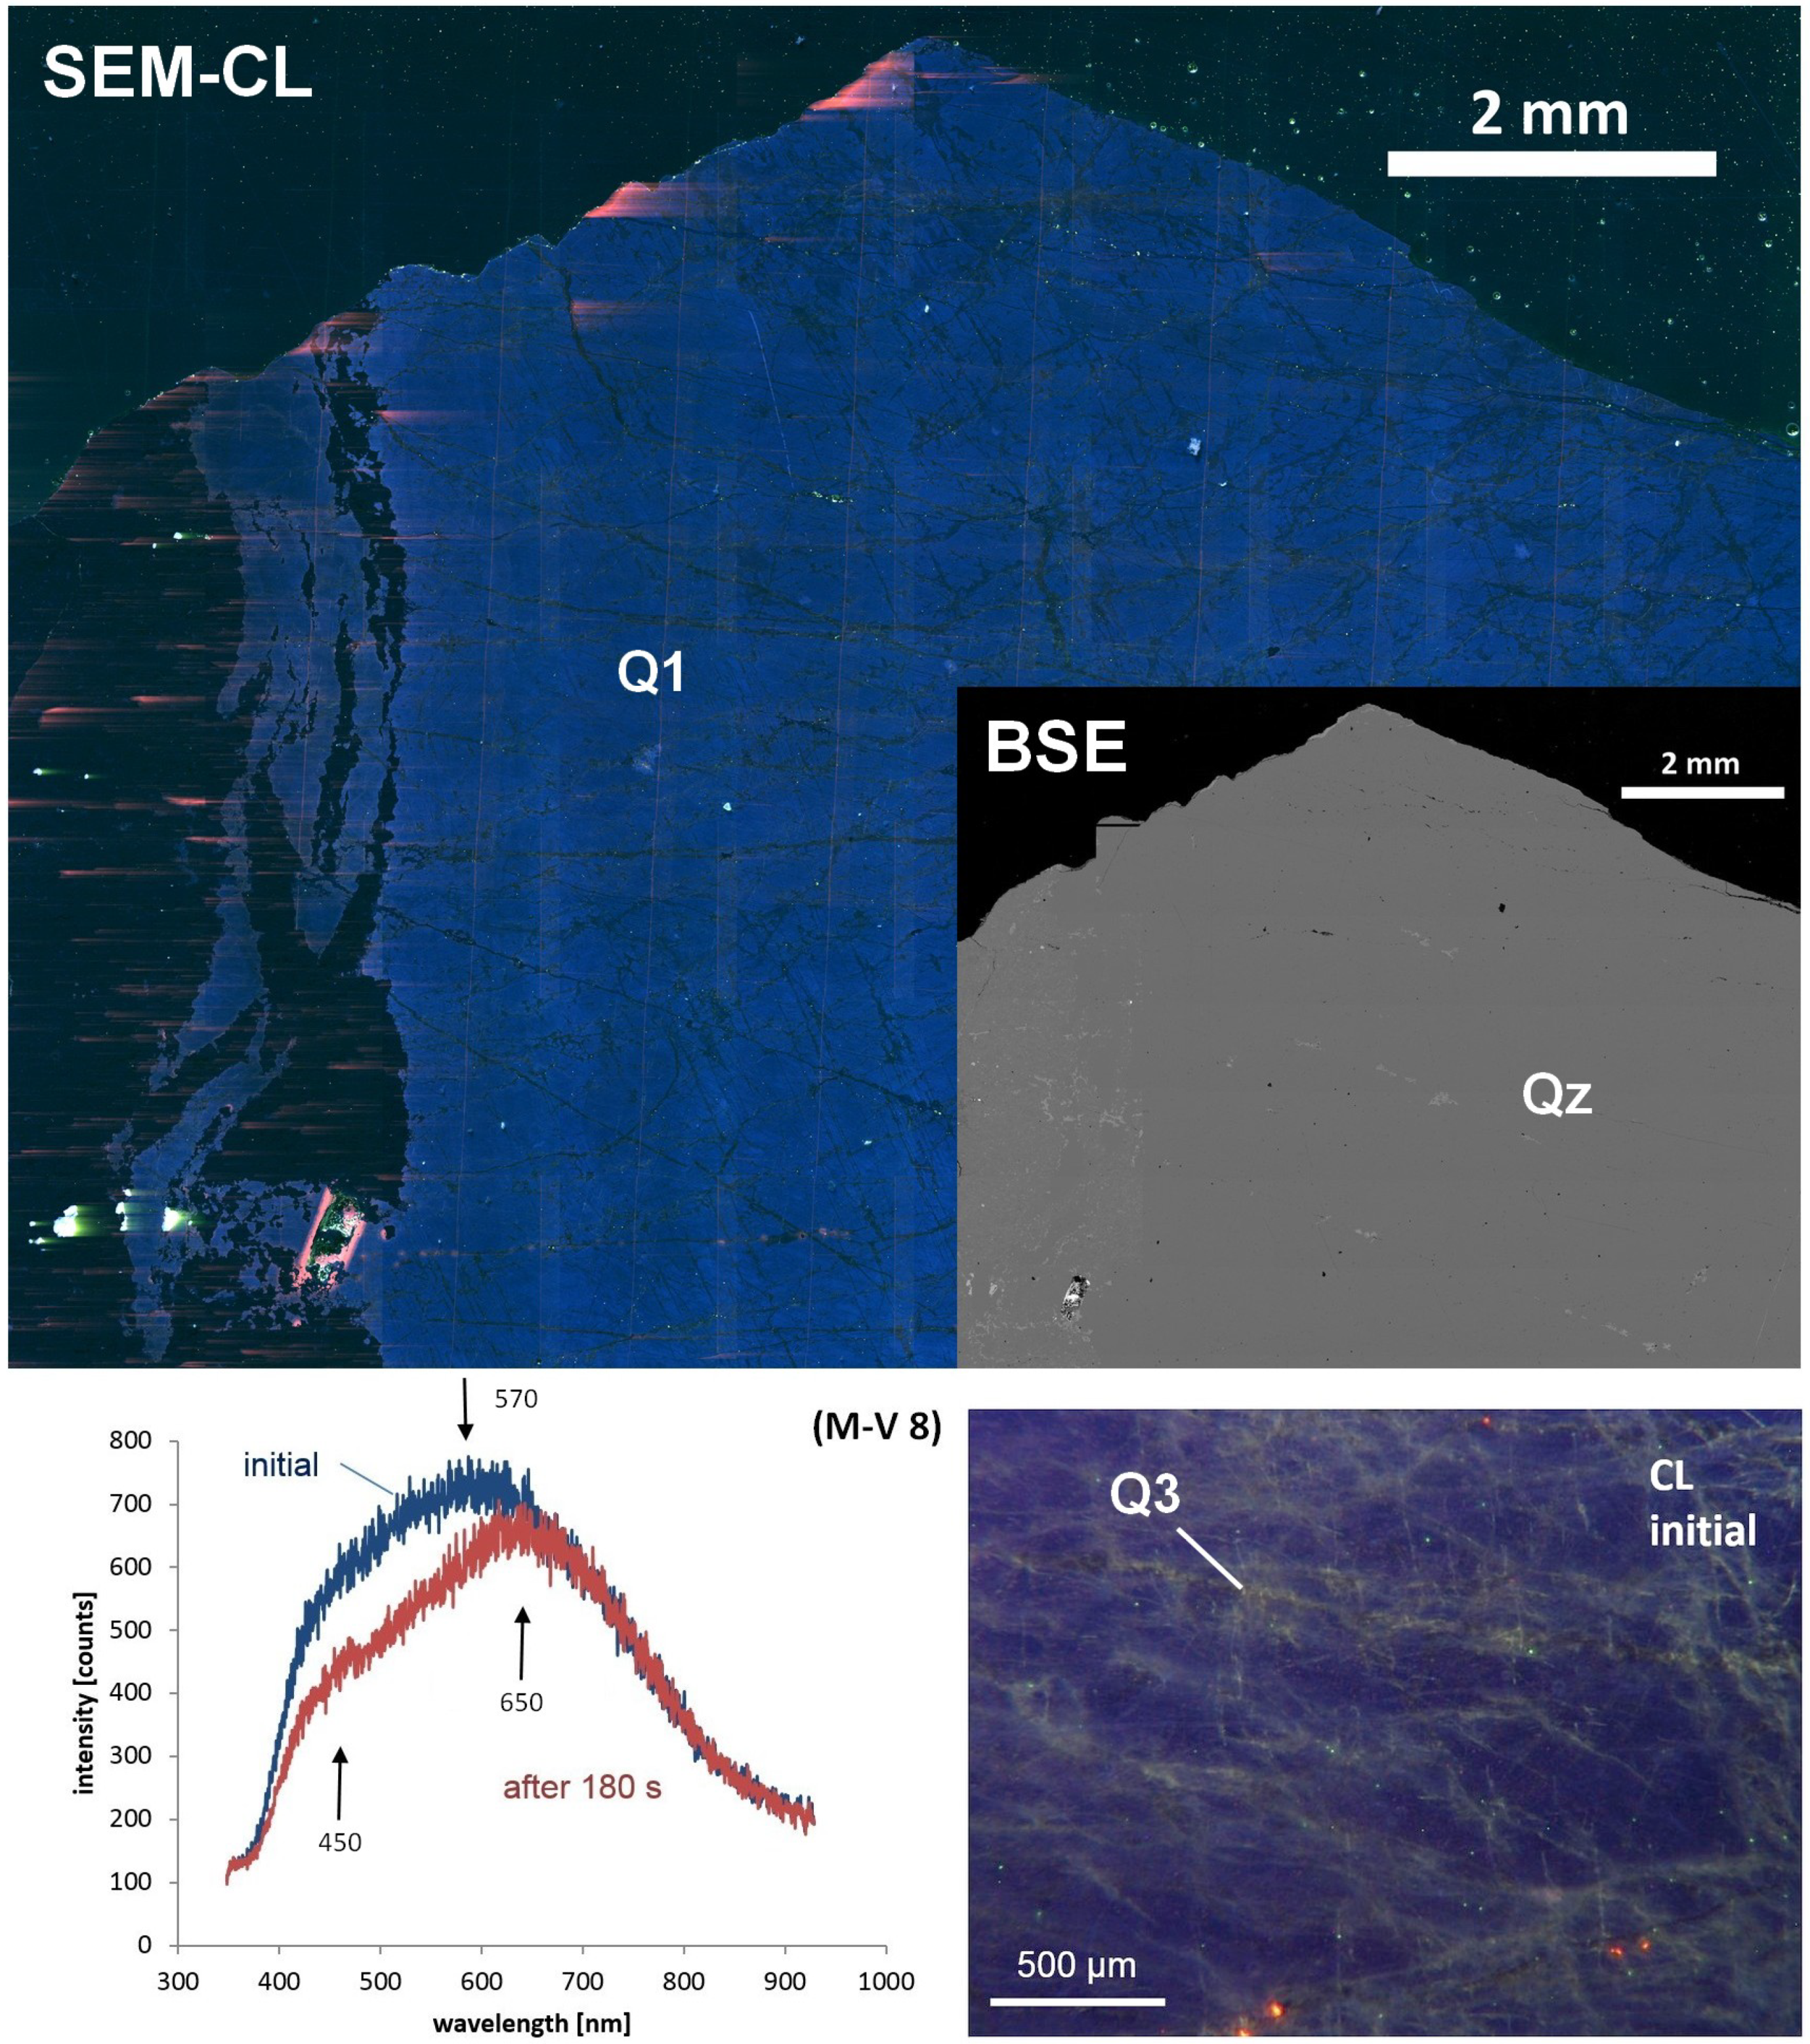
The Čelina deposit shows a rather homogenous to slightly mottled blue CL texture of Q1 (
Figure 2). The spectral analysis reveals two initial emission bands. One, only visible as a shoulder at ca. 380 nm and the second at ca. 500 nm (
Figure 2) that had strongly decreased after 180 s of electron irradiation. Two additional emission bands were detected at ca. 450 and 650 nm in the spectra, particularly after 180 s of electron irradiation. The secondary quartz growth generation at Čelina, Q4 precipitated in the microfissures formed during a brittle tectonic phase. This quartz is seen black in the SEM-CL image (
Figure 2).
Mokrsko-East is predominated by blue CL quartz Q1 (
Figure 3), although it is less homogeneous than at the Čelina deposit. Q1 is intersected by younger quartz which precipitated in microfissures. The fissure quartz Q3 (
Figure 3) is developed in a dense network of irregular veins, penetrating older blue CL quartz Q1. Different from the fissure quartz at Čelina, Q3 has a yellow to greenish CL colour.
Due to a dense network of quartz Q3 fissures, the emission spectra represent a mixture of two quartz growth generations with distinct CL colours—blue Q1 and yellow to greenish Q3. The broad emission band consists of at least three bands at ca. 450 nm, 570 nm, and 650 nm (
Figure 3).
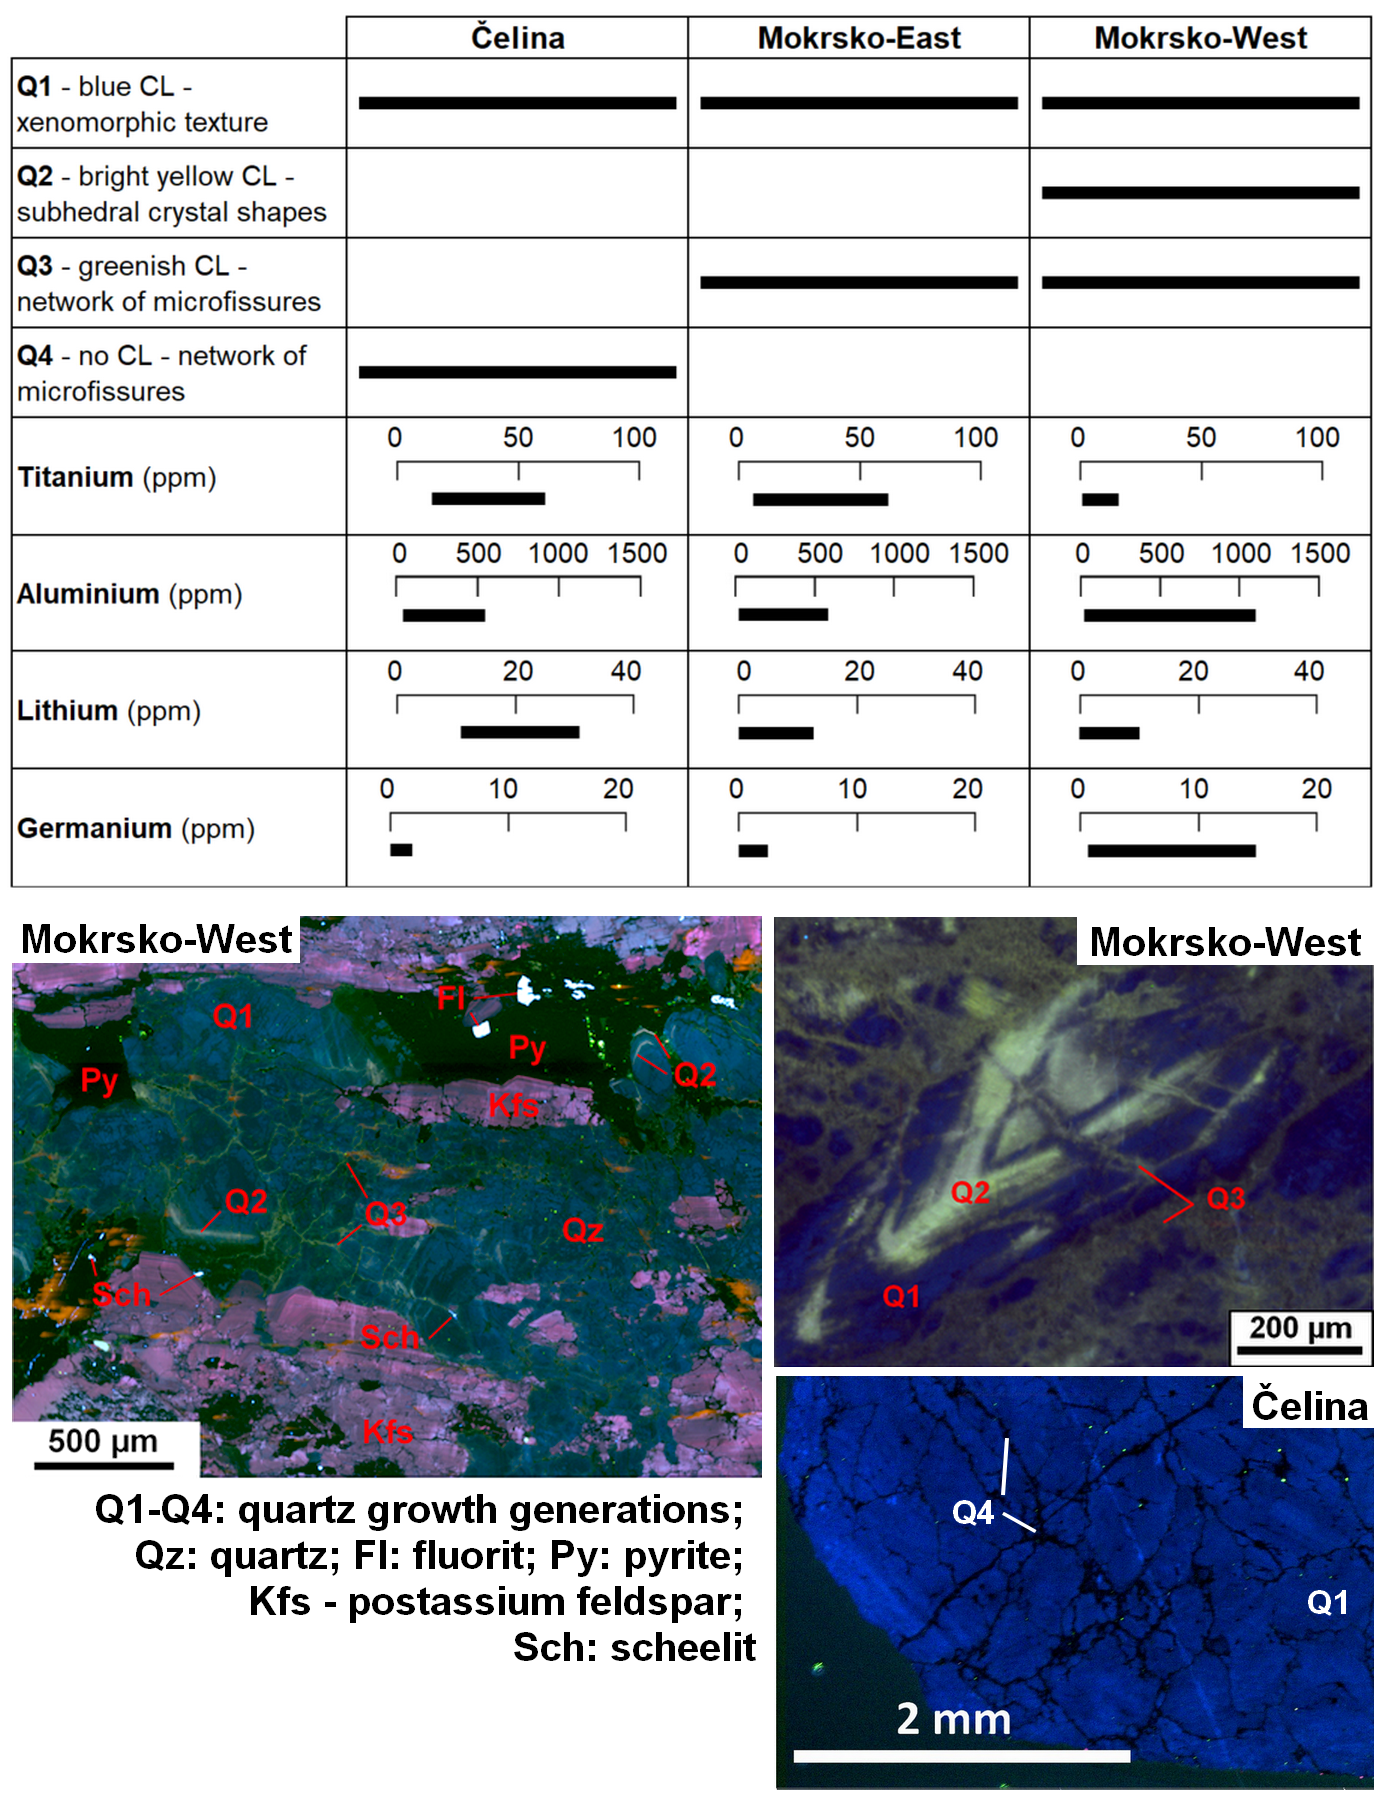
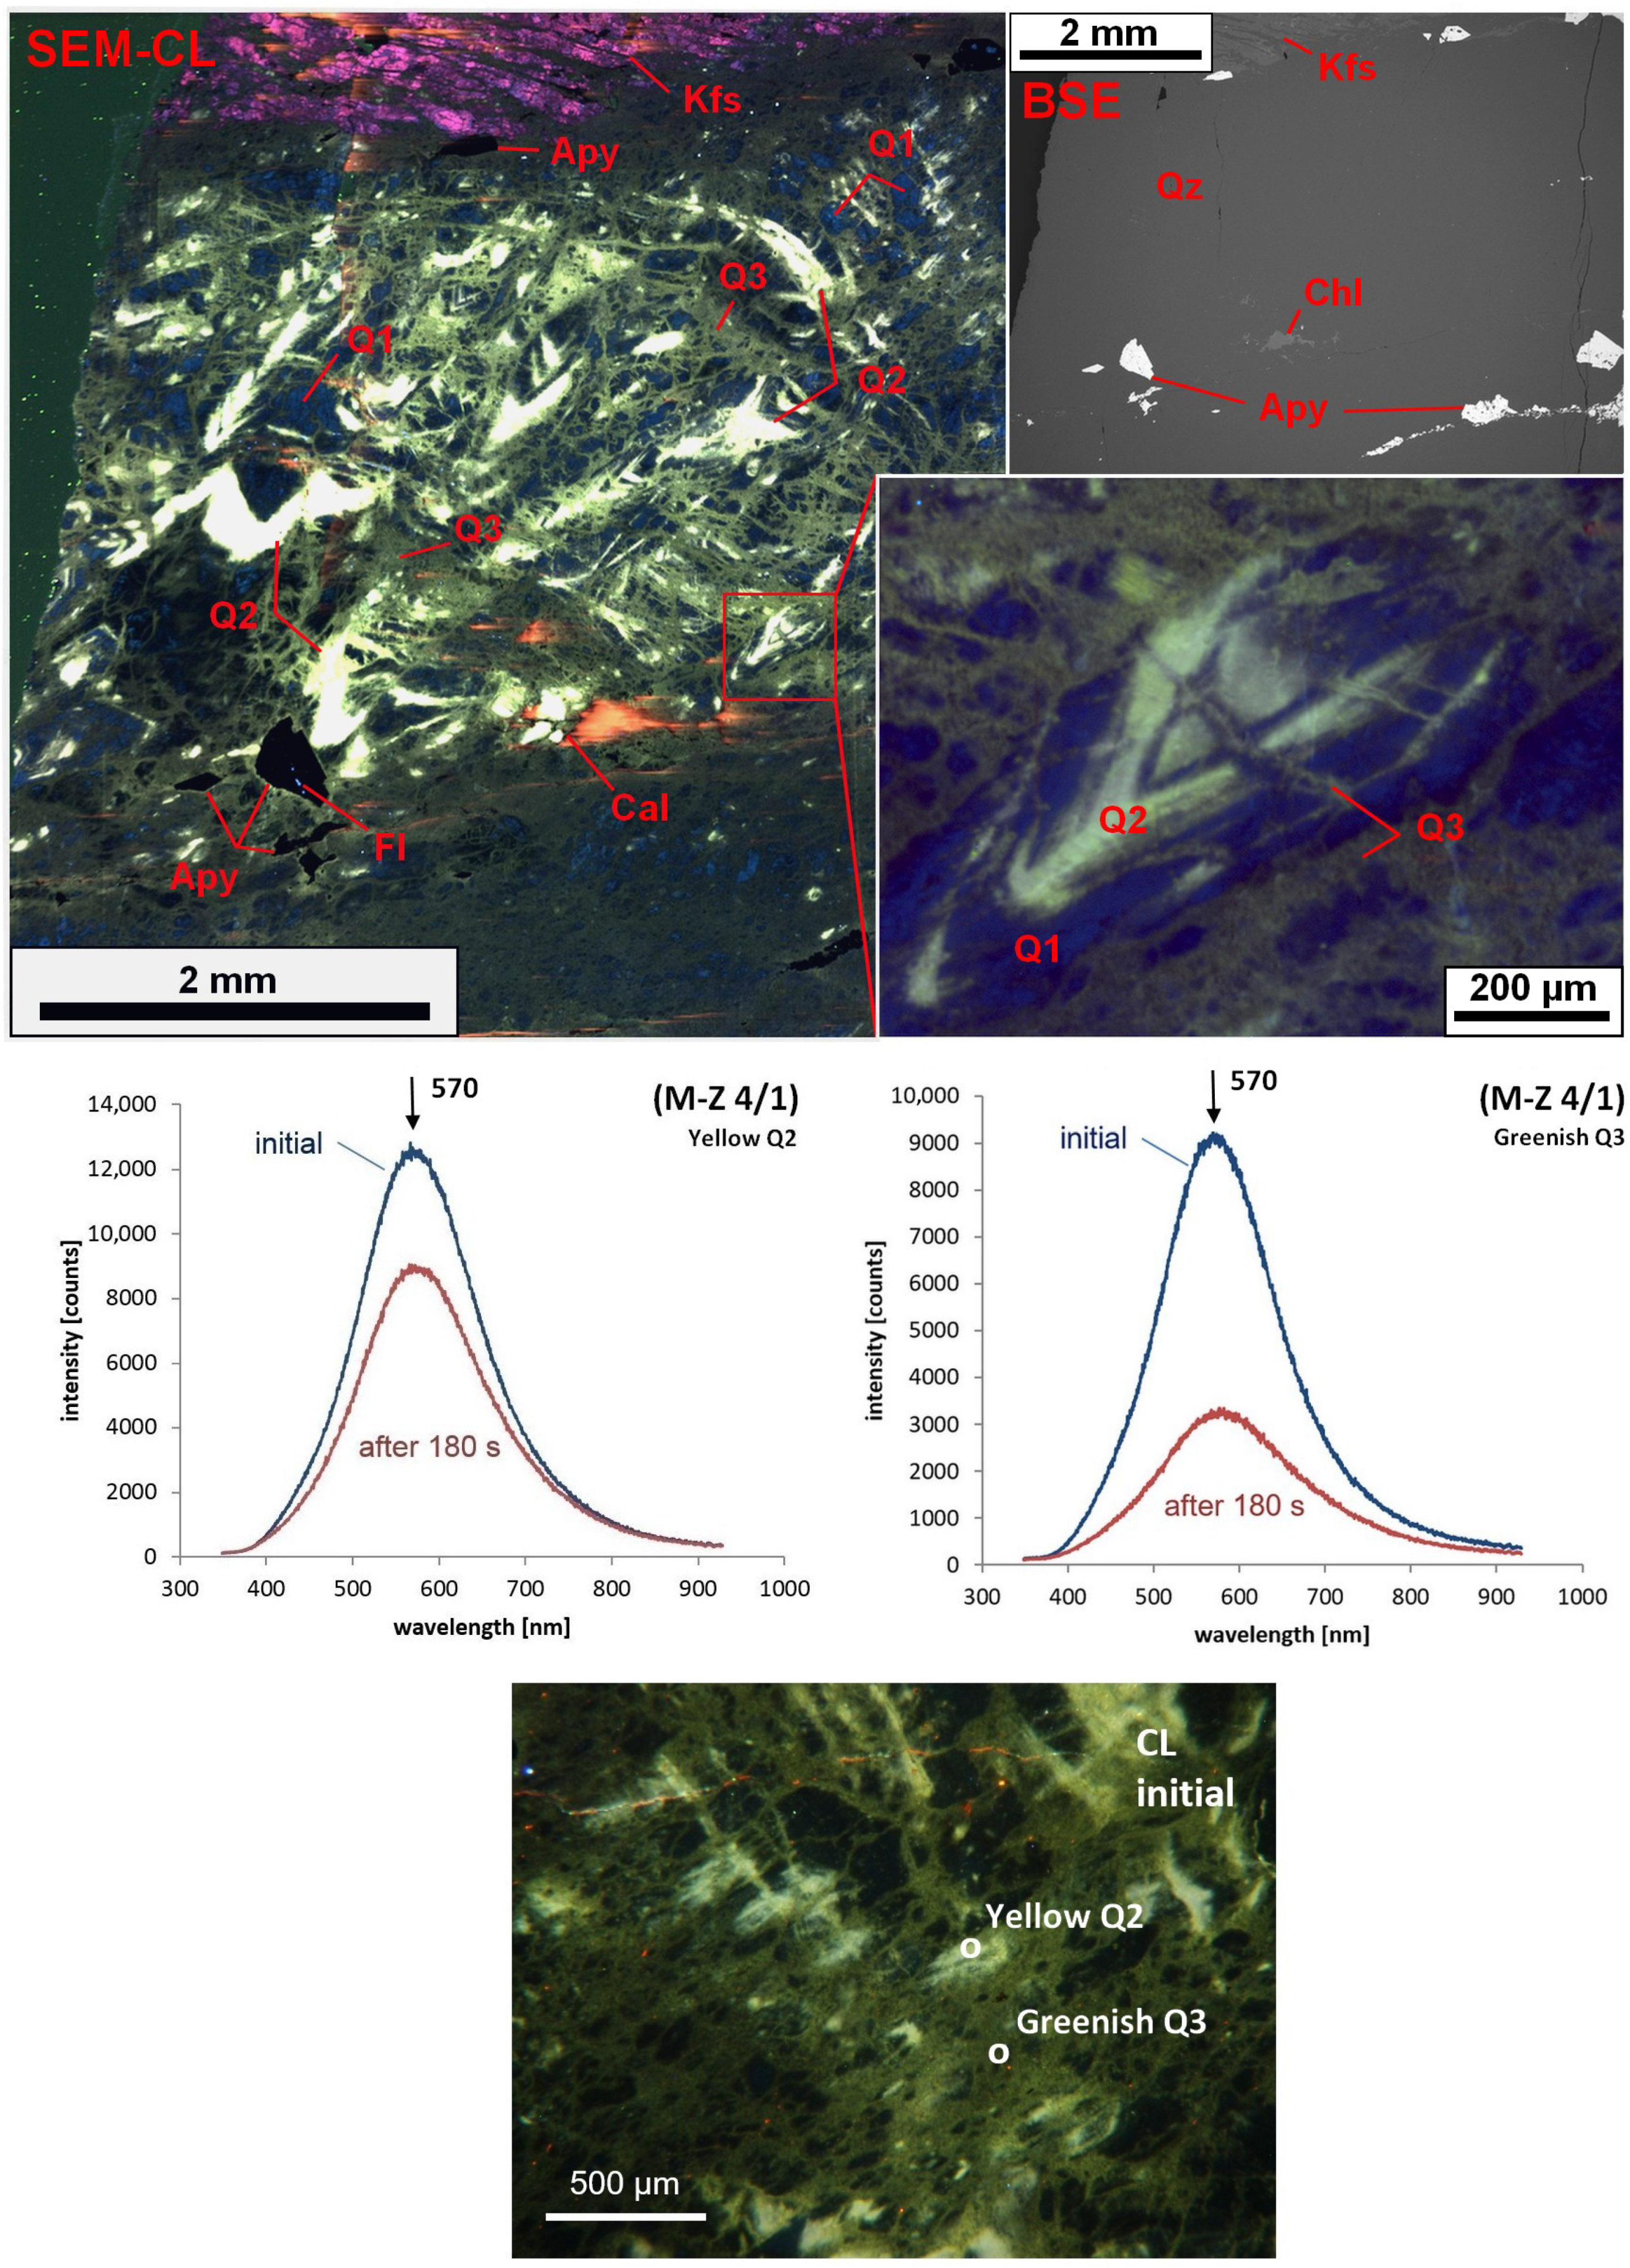
At the Mokrsko-West deposit, CL reveals that both older thick quartz veins and younger sheeted veinlet system consist of at least three quartz growth generations (
Figure 4 and
Figure 5). The oldest quartz growth generation is Q1 with blue CL, which is predominant also at the Mokrsko-West deposit (
Figure 5). Blue CL Q1 is overgrown by younger Q2 (observed only at Mokrsko-West) and was penetrated by the youngest Q3.
The Q2 quartz generation with bright yellow CL typically exhibits preserved subhedral shapes and growth zones, although in some cases, it has irregular shapes. The bright yellow CL shows a broad emission band with a maximum at ca. 570 nm (
Figure 4).
The Q3 quartz growth generation with greenish CL developed as a dense network or cobweb of irregular veinlets (
Figure 4). This quartz fills the microfissures (
Figure 5), which cut both the previous quartz generations (
Figure 4). The greenish CL quartz produced spectra similar to the yellow CL Q2, only with significantly lower intensity compared to Q2, resulting in a less intense CL shade.
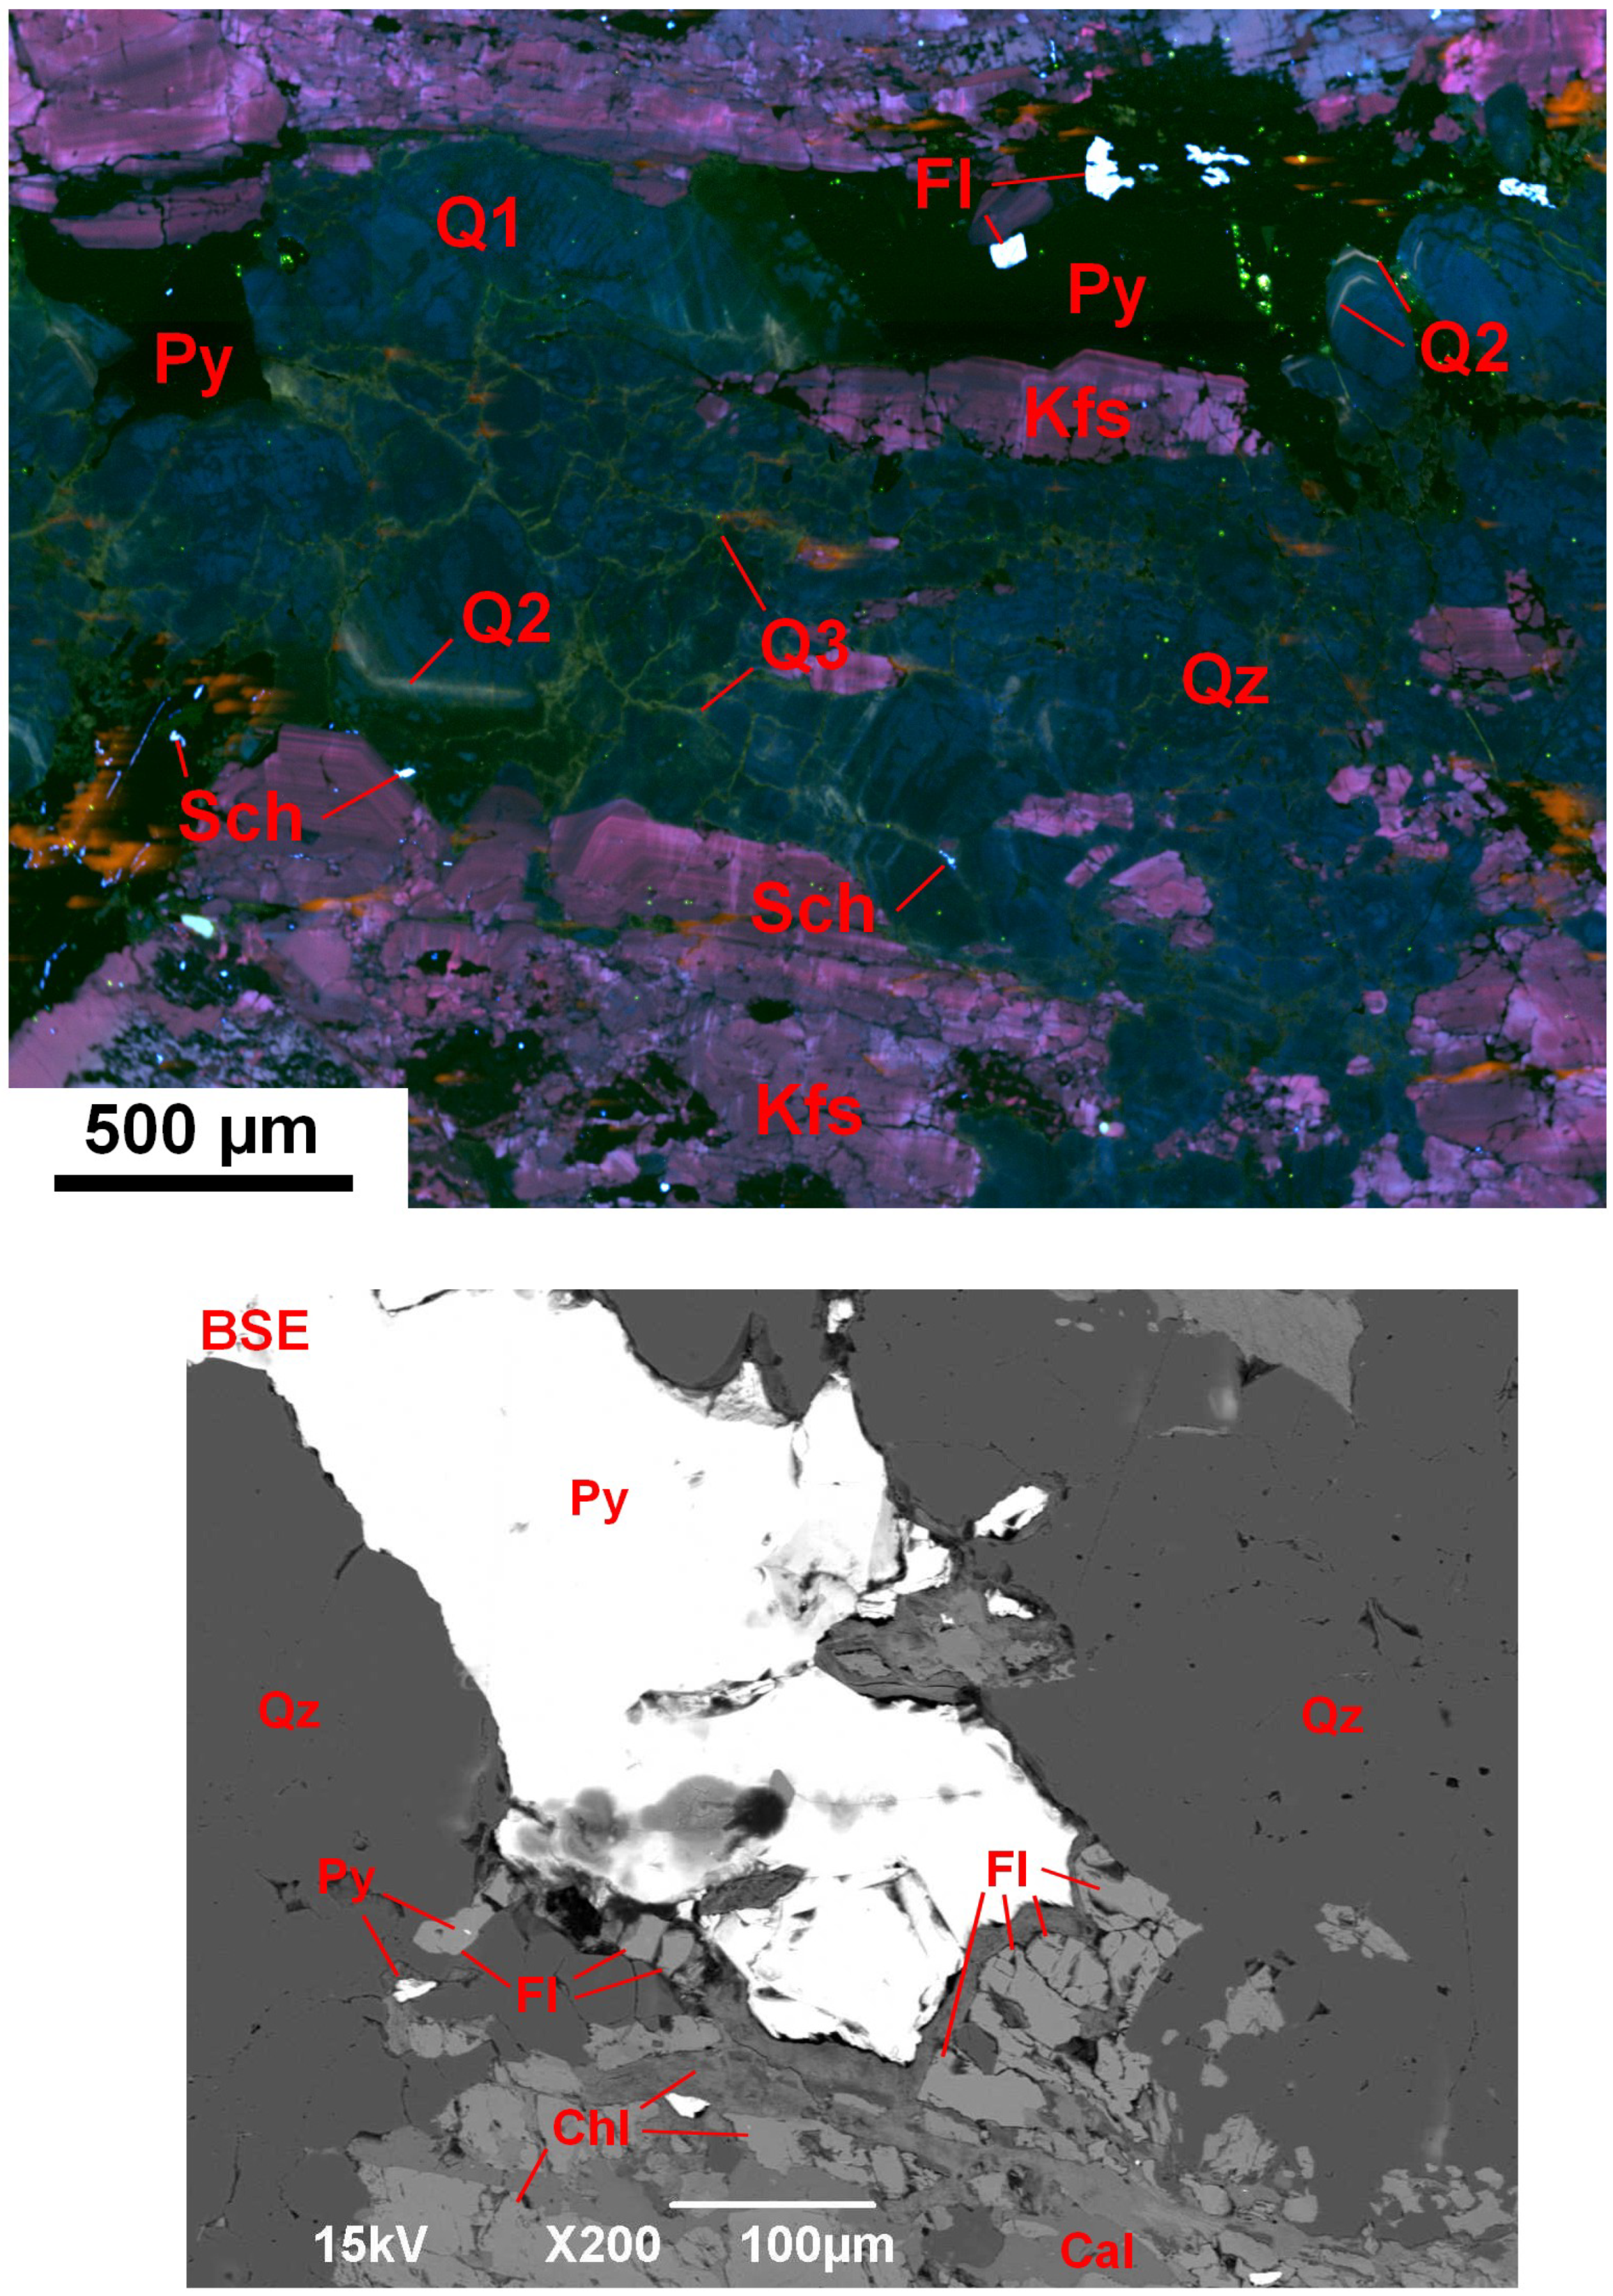
SEM-CL imaging reveals a systematic presence of up to 50 µm large grains of fluorite with a strong CL effect (
Figure 5). The common occurrence of fluorite at Mokrsko-West was usually not recorded by previous studies. In many cases, fluorite overgrows or is present as inclusions in sulphides (
Figure 4 and
Figure 5).
The Q1 and Q2 growth generations, as well as the youngest Q3, do not penetrate gold-bearing arsenopyrite (
Figure 4) or pyrite (
Figure 5).
4.2. Trace Element Analyses
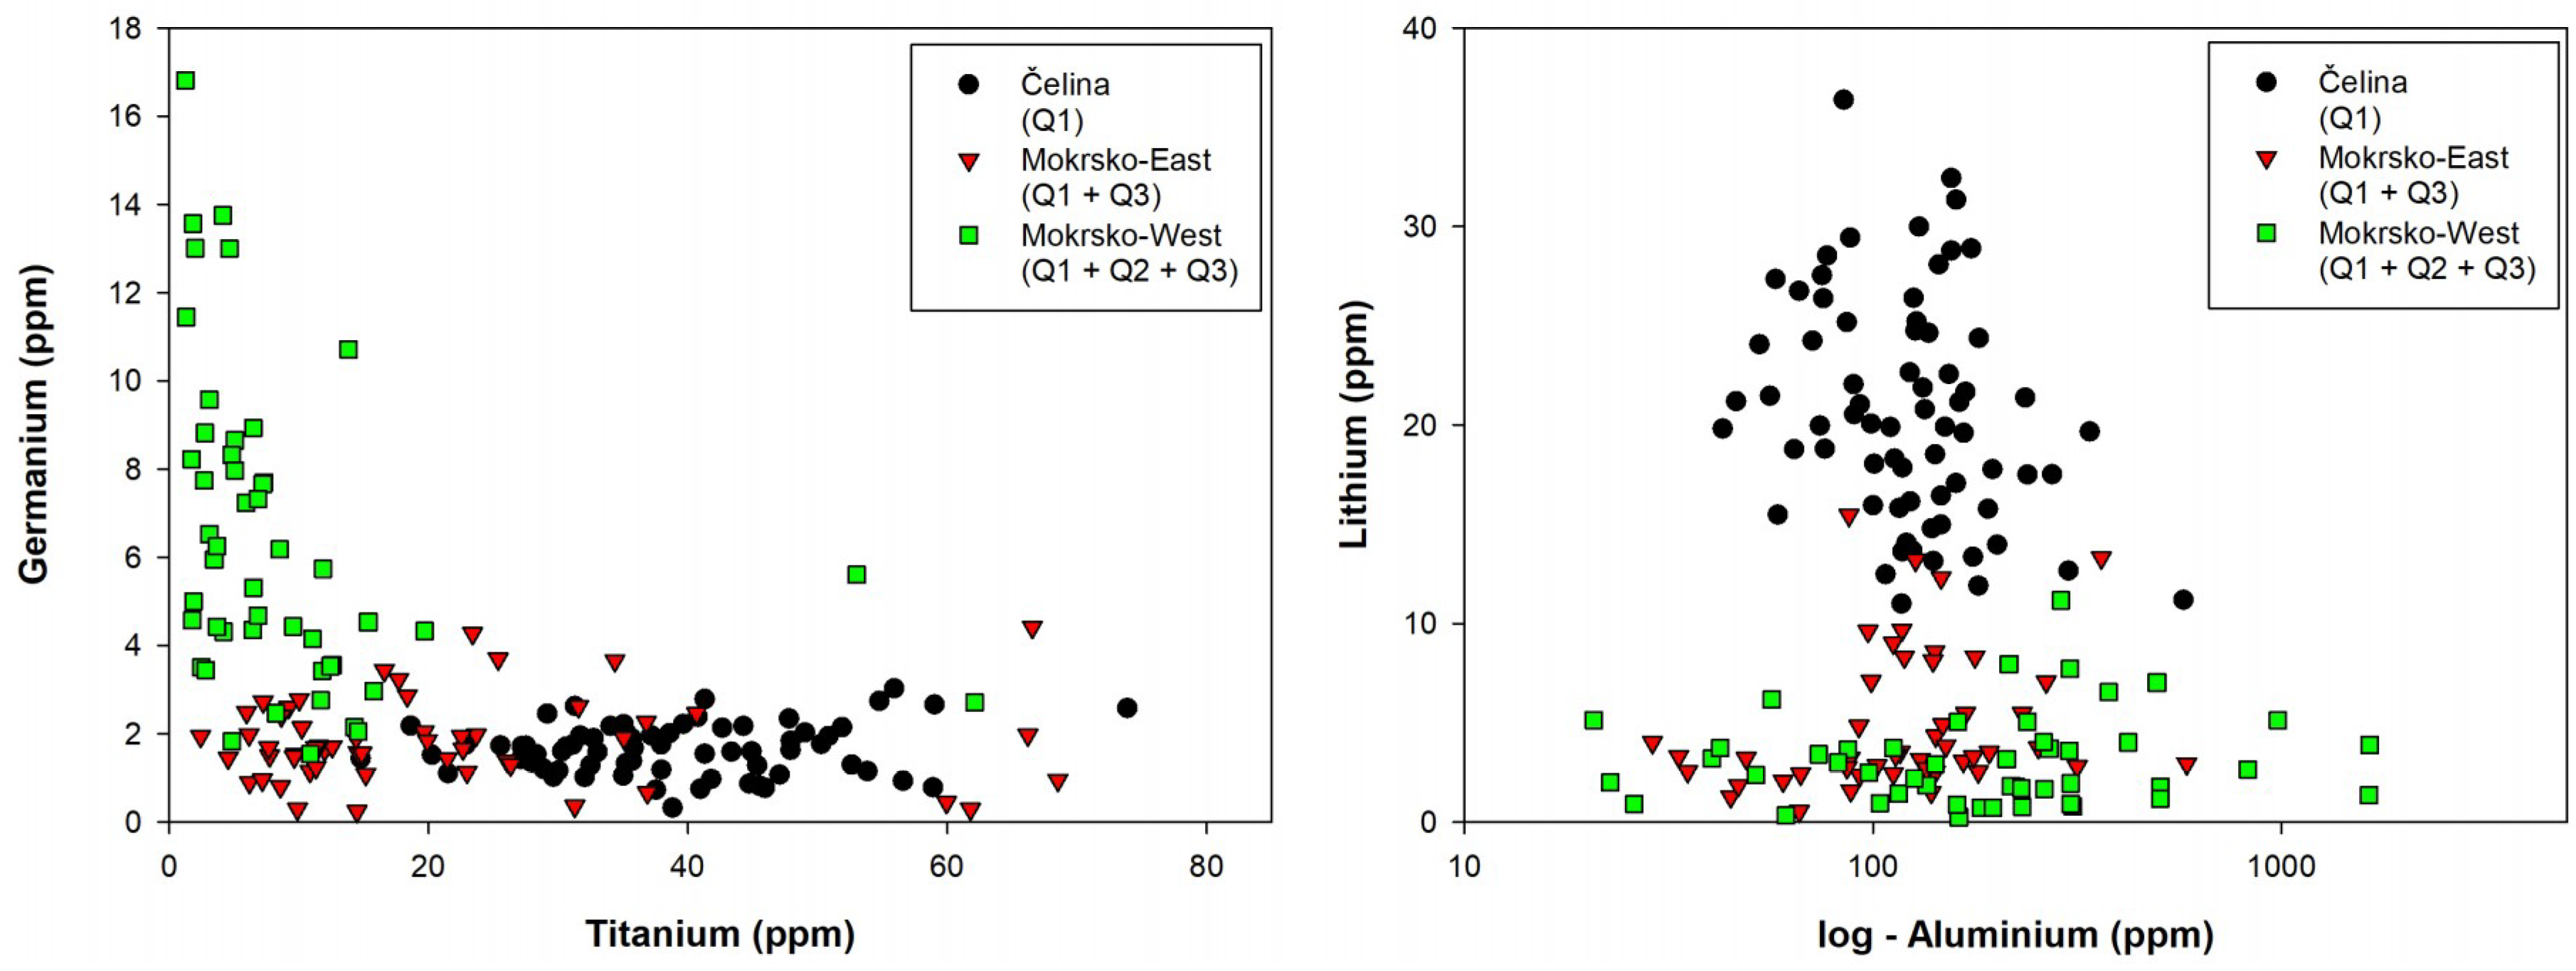
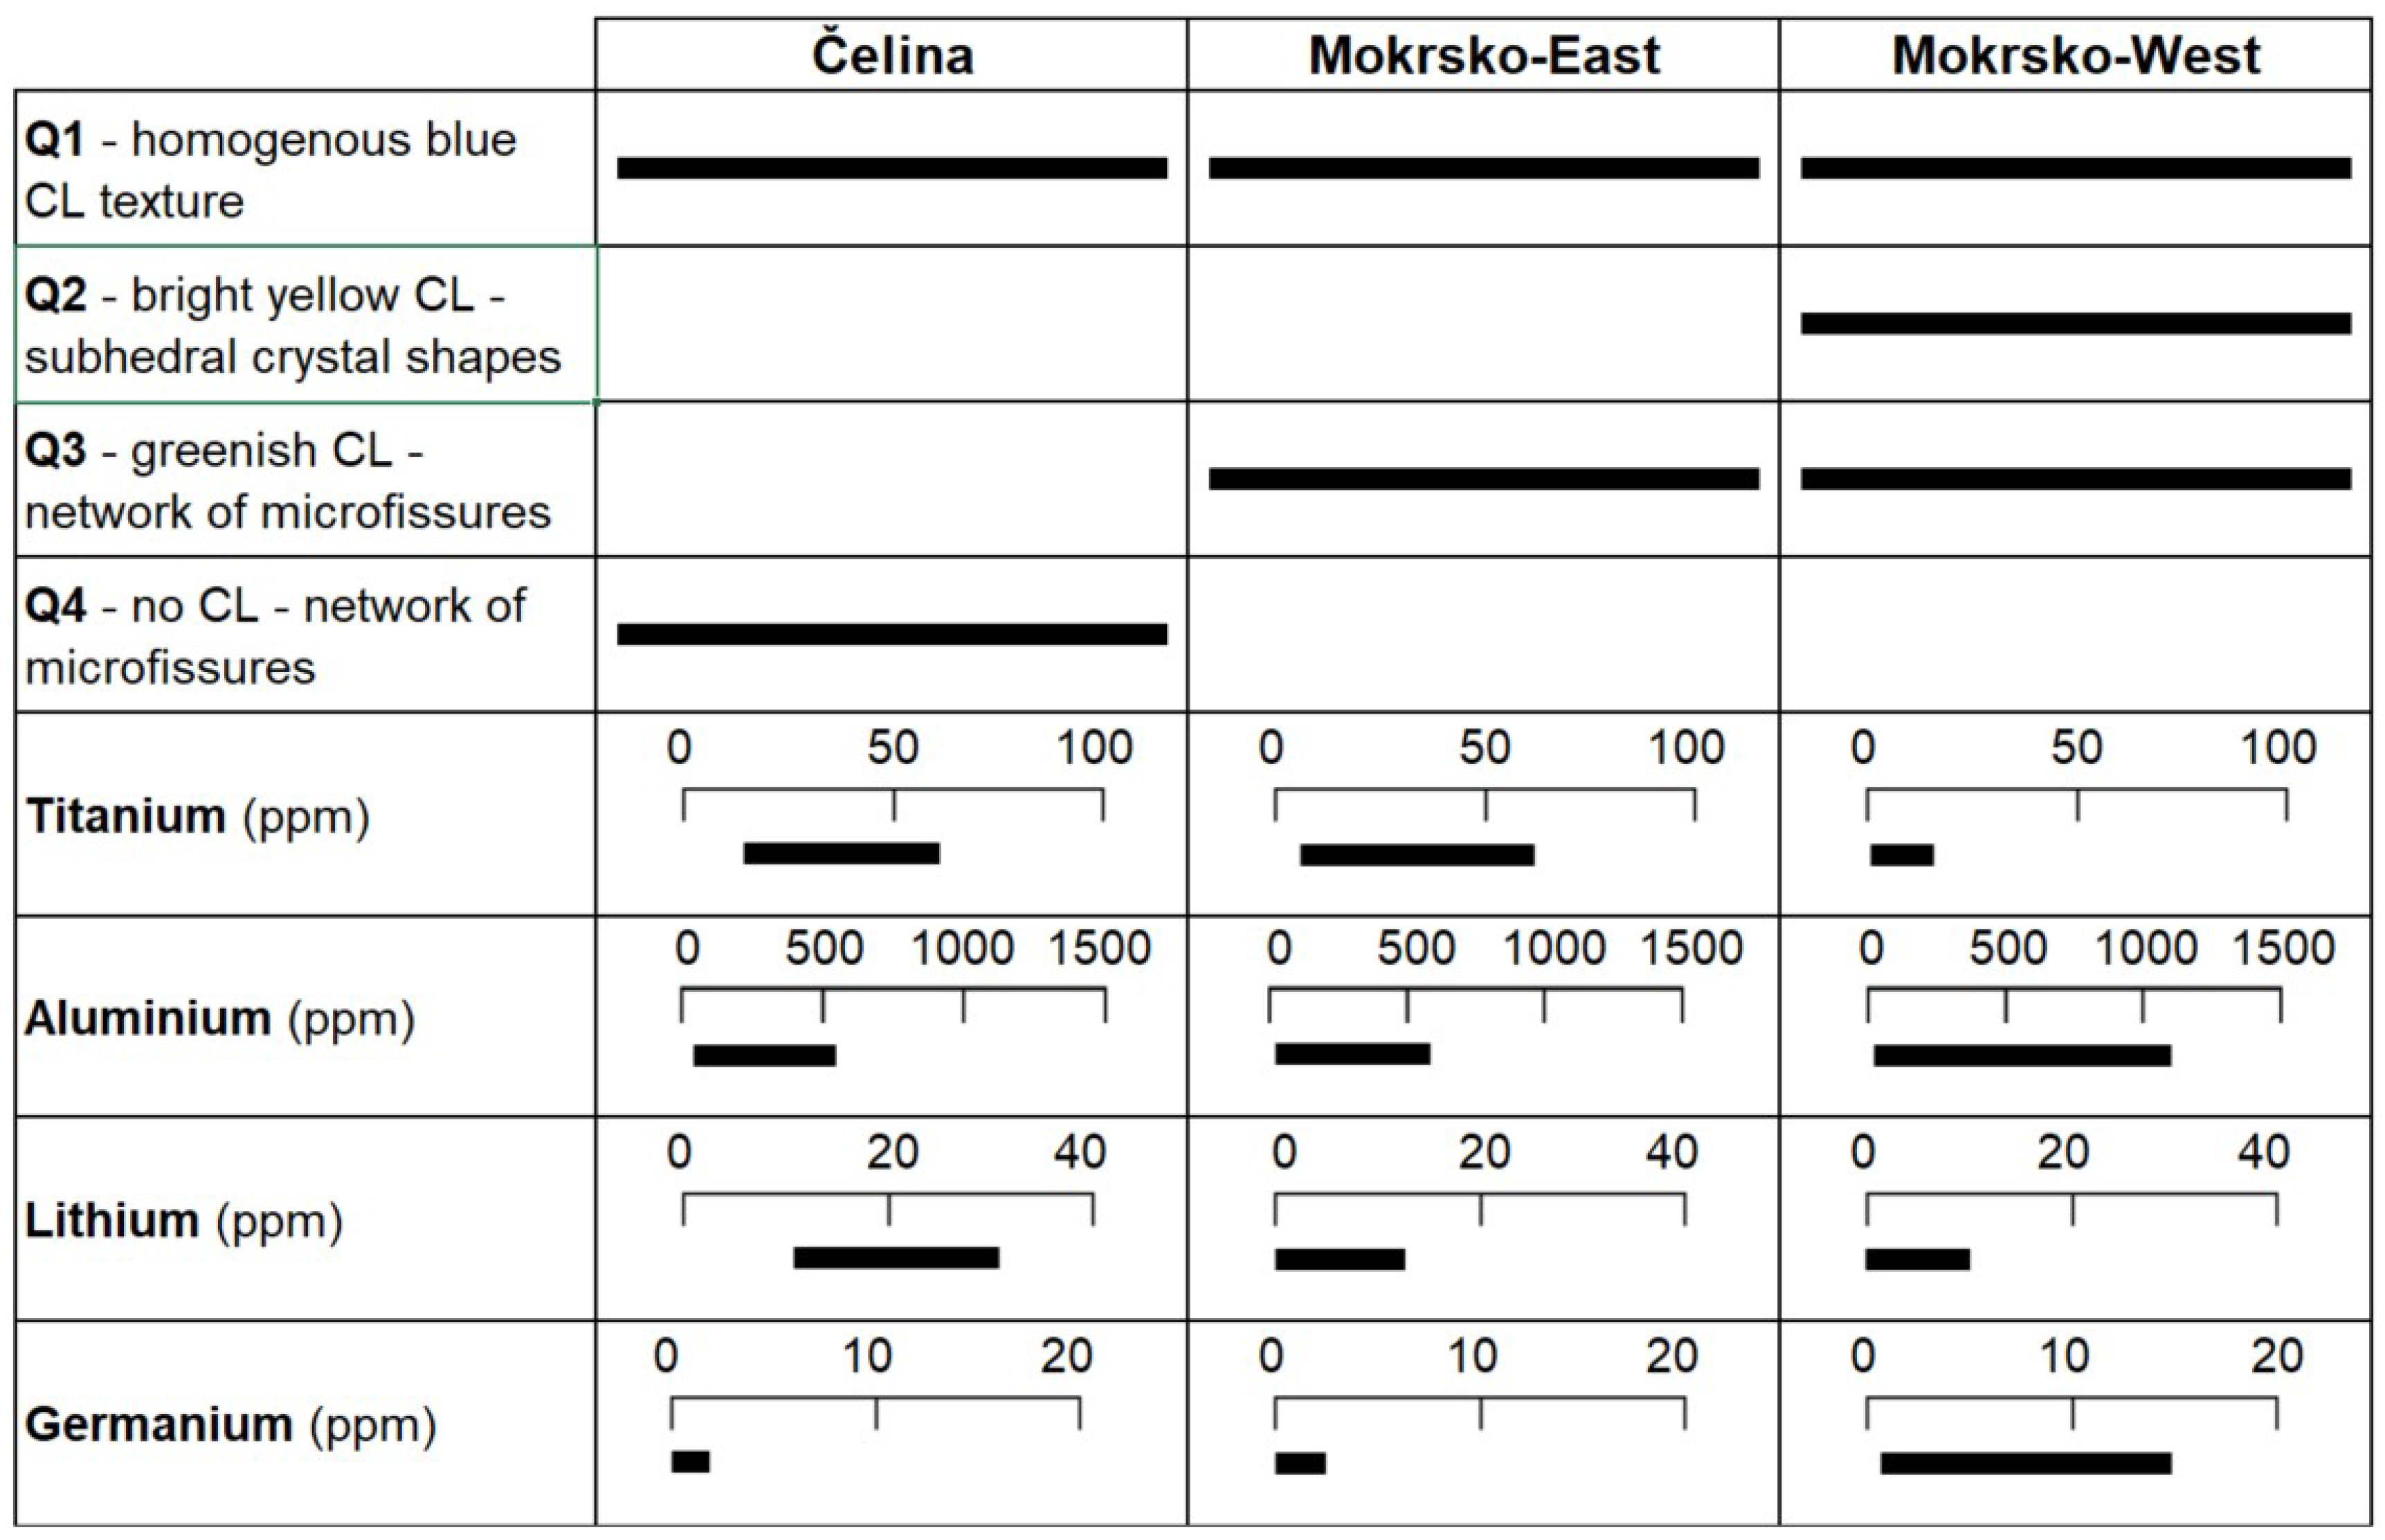
The Čelina deposit quartz has aluminium concentrations from tens to several hundred ppm. The values exceeding 200 ppm are very rare (
Figure 6). The titanium concentration is 15 to 74 ppm, with 20–50 ppm being most common. The concentrations of lithium, which reached values from 11 to 36 ppm, are distinct. The concentrations of germanium are low at the Čelina deposit with values up to a maximum of 3 ppm (
Figure 6). The microfissures of late Q4 at the Čelina deposit do not develop such dense network as compared to the microfissures of Q3 at Mokrsko-East and Mokrsko-West. This allowed us to avoid hitting the microfissures during the LA-ICP-MS analysis to obtain the trace element composition of Q1.
At Mokrsko-East, the concentration of aluminium, titanium, and germanium are similar to the Čelina deposit (
Figure 7). The aluminium concentration is 16 ppm to several hundred ppm and titanium is from 2 to 69 ppm, however, in contrast to Čelina, the predominant values are lower, mostly ranging from 2 to 20 ppm. Germanium was relatively depleted at the Mokrsko-East deposit, with values mostly of a few ppm. The lithium concentration was also relatively depleted as compared to the Čelina deposit with concentrations only exceptionally exceeding 10 ppm.
Mokrsko-West is similar to Mokrsko-East in low lithium concentration with maximum values of 11 ppm. Titanium only exceptionally exceeds 15 ppm and germanium is high, mostly with concentrations of 2–14 ppm (
Figure 6). The aluminium concentrations have a much larger range than at the other deposits with 20 to several hundreds of ppm and with a few analyses exceeding 1000 ppm (
Figure 7).
The concentration of gallium, a common pair to germanium, was depleted at all three deposits; values are in many cases below the limit of detection (72% measurements at Čelina, 75% at Mokrsko-East, and 39% at Mokrsko-West). Additionally, the values of iron and arsenic are very low with maxima of a few ppm or, in many cases, below the detection limit at the Čelina and the Mokrsko-East deposits. The iron and arsenic concentrations at the Mokrsko-West deposit are from 3 to threshold values of 200 ppm and 2–64 ppm, respectively. The other measured elements (Na, K, and Ca) did not show any distinctive variations between the different deposits and concentrations are from below the detection limit up to the threshold values (
Table S2).
5. Discussion
CL emission spectra of homogenously blue CL Q1, measured at the Čelina deposit, are characteristic for hydrothermal quartz [
12,
13] and for quartz from pegmatites [
15]. The CL activation centre of these two emission bands is assumed to be a substitution of Si
4+, the most commonly trivalent aluminium accompanied by monovalent compensation ion, with Li
+ being the most common [
7,
10,
12,
13]. High aluminium concentrations in quartz at all three deposits suggest that this element is the main substituent for Si
4+. Elevated lithium concentrations at the Čelina deposit might suggest lithium as a compensation ion to aluminium. On the other hand, the very low lithium concentrations at both Mokrsko-East and Mokrsko-West do not support this substitution mechanism. A different element will be contributed to the charge balancing of trivalent aluminium. It could possibly be H
+, which has been proven to exist in this role [
43], but a different analytical method (infrared spectroscopy) is needed for the analyses of the hydrogen concentration.
Distinctive emission spectra of Q2 and Q3, which had overgrown and penetrated Q1 at Mokrsko-East and Mokrsko-West, have a different origin. The dense penetration of Q1 caused the mixing of spectra of individual quartz generations as is most pronounced in mixed emission spectra obtained at Mokrsko-East. Similarly, the dense penetration of Q1 combined with the relatively large (65 µm) spot size of the LA-ICP-MS analysis also indicates that the geochemical composition of Q1 is locally mixed with those of Q2 and Q3 at Mokrsko-East and Mokrsko-West.
Only at the Čelina deposit, where Q1 is not densely penetrated by other quartz generations, is it possible to link the geochemical signature of hydrothermal quartz to blue CL Q1. The analysed hydrothermal quartz vein at Čelina can be considered as a product of an early quartz stage, for which the crystallization temperature in the range of 450–500 °C has been described [
21,
24]. The relatively high temperature seems to match with the elevated titanium concentrations at the Čelina deposit. Many authors, e.g., Wark and Watson [
44] Thomas et al. [
45] or Huang and Audétat [
46] have suggested that the titanium concentration is controlled by the quartz crystallization temperature. The titanium concentration in quartz at Čelina of >20 ppm is in accordance with the datasets of Rusk et al. [
47] from different deposits relating titanium concentrations above 10 ppm to crystallization temperatures above 400 °C.
Subhedral shapes of yellow CL Q2 and late microfissures of yellow-greenish CL Q3 with an emission band at 570 nm can be related to the fast crystallization at temperatures below 250 °C [
16]. This agrees with temperature estimation of 200–300 °C, suggested for late quartz developed in the irregular microfissures at Mokrsko-West [
21,
23,
24].
We assume that the measured geochemical signature of quartz from Mokrsko-West and Mokrsko-East is, in most cases, composed of more than one quartz growth generation because the microfissures of Q3 strongly penetrate the older quartz generations and the laser ablation beam was unable to avoid it. In spite of that, the very low titanium concentrations at Mokrsko-West are in accordance with the mineral deposits database of Rusk et al. [
47], that is, in assigning concentrations of titanium under 10 ppm to crystallization temperatures below 350 °C.
The elevated concentration of germanium in the hydrothermal quartz points to a different origin of at least one quartz growth generation at Mokrsko-West. The enrichment of germanium in quartz is typical for late stages of magmatic fractionation of granitic melts [
48,
49], indicating a possible magmatic origin of the Ge-enriched quartz phase at Mokrsko-West. Breiter et al. [
48] also described the relative increase of germanium concentration from the early to late intrusive suites of the Central Bohemian Plutonic Complex, which suggests an affiliation of the Ge-enriched quartz phase to late magmatic processes.
Gold-bearing sulphides unaffected by quartz generations suggest later or simultaneous crystallization with the latest quartz generation. Fluorite, which often overgrows sulphides, is also related to late mineralization. The presence of fluorite can possibly support a late magmatic derivation of the assemblage as fluorine is another element typical for late crystallization stages of evolved granitic rocks [
50,
51].
On the other hand, the homogeneous to slightly mottled texture of the oldest blue CL Q1 that is visible at all three deposits, is very common in hydrothermal quartz from orogenic gold deposits with fluids of metamorphic origin [
3,
52]. This is in accordance with studies of Morávek et al. [
21] and Boiron et al. [
23] suggesting a hydrothermal-metamorphic origin of the quartz veins. However, the CL textures of partly preserved growth zones of Q2, later the “spiderweb” textures of Q3 and Q4, are more typical for porphyry deposits [
17,
52]. This suggests a magmatic influence of the hydrothermal system. Moreover, steep hydrothermal quartz veins formed in the east-west trending tectonic zone with an extensive regime [
22], are a characteristic tectonic setting of the intrusion-related deposits [
38,
41] in contrast to orogenic gold, where there is the typically compressional strain [
39,
40].
The Sázava suite was emplaced during the compressional (shortening) and transpressional regime [
36], whereas the emplacement of the Blatná suite indicates a switch from transpression to the onset of exhumation of the crustal unit, which led to the formation of extensional shear zones [
37]. Dating of the molybdenite at Mokrsko-West [
35] and Mokrsko-East [
27] shows ages from 340 to 345 Ma, which is about 10 Ma younger than the zircon crystallization ages of Sázava suite—the host rock of the Mokrsko-West deposit. However, it is possible that the Blatná suite, which is younger (340–350 Ma [
33,
34]) than the Sázava suite, extends to larger depths under the Sázava suite and the gold deposits.
Another indicator of the prolonged presence of magmatic processes during the origin of the mineral deposits are several pre-ore mineralization granitic porphyry dikes at Mokrsko-West and Mokrsko-East and also presence of one mafic lamprophyre dike at the Mokrsko-West deposit, which postdates the ore mineralization [
22].
6. Conclusions
Hydrothermal quartz veins at the Mokrsko-West, Mokrsko-East, and Čelina deposit have distinctive CL textures and spectra, as well as trace element compositions, which allow us to distinguish the quartz veins from each deposit. Four different quartz growth generations were characterized based on SEM-CL mapping of hydrothermal quartz veins.
High concentrations of titanium in early phases, represented by the homogenous blue CL Q1 at Čelina deposit, correspond to high-T stages identified by previous studies using other methods. This supports the titanium concentration in quartz being a good indicator of the relative crystallization temperature in one system, where decreasing temperature can be correlated with lowering titanium concentration in hydrothermal quartz.
Mokrsko-East looks similar to Čelina, but the microfissures formed during the brittle tectonic phase were precipitated by quartz with different signatures. Microfissures at Čelina were filled by Q4 which had no CL effect, whereas yellow to greenish CL Q3 precipitated at Mokrsko-East. The presence of Q3 and the more frequent values of titanium below 20 ppm links Mokrsko-East to the processes which took place at the Mokrsko-West deposit.
Despite the mixing of the geochemical signatures of three quartz growth generations at Mokrsko-West, the overall depleted titanium concentration, as well as the presence of low-temperature yellow CL Q2, are consistent with the decrease of the crystallization temperature in the late mineralization stages. Hydrothermal quartz at Mokrsko-West shows an enrichment in germanium and the presence of yellow Q2, which distinguishes it from the other two deposits, suggesting a different source of late quartz growth generations.
The enrichment of germanium in hydrothermal quartz, as well as the presence of fluorite, indicate a magmatic source as they are both characteristics of the late stages of the magmatic differentiation of granitic melts. The affiliation of late quartz growth generations to magmatic processes is further supported by the temporal relationship to the intrusion of the Blatná suite, the presence of the sheeted veinlet system, and the observed CL textures of Q2, Q3, and Q4, which are typical for gold deposits related to intrusion.
Supplementary Materials
The following are available online at
https://www.mdpi.com/2075-163X/8/8/335/s1, Table S1: Table of trace elements analyses (Al, Ti, Li, Ge) from all three deposits; Table S2: Table of other measured trace elements (Na, K, Fe, As) from all three deposits.
Author Contributions
V.W. is the main author of the paper; J.L. evaluated the data, was consulted for the results, and supervised the main author. M.D. performed the high-resolution CL imaging in the laboratories at TESCAN ORSAY HOLDING, was consulted for the results, and contributed to the Samples and Analytical Methods chapter; J.G. conducted and described the results from hot-cathode CL imaging and CL emission spectroscopy analyses. His contributions also appear in the Samples and Analytical Methods chapter, as well as in the Results and Discussion chapter.
Funding
The research was supported by project Geodyn2018 (MUNI/A/1088/2017).
Acknowledgments
Research was supported by the project MUNI/A/1088/2017. Special thanks belong to the TESCAN ORSAY HOLDING for cooperation in large-scale SEM-CL imaging. We are grateful to Peter Morávek for consultation, guidance at the Mokrsko gold deposit, and for providing samples from the inaccessible Mokrsko-East deposit. We are very thankful to Carita Augustsson and two anonymous reviewers for their comments and suggestions which substantially improved the paper. I would like also to express my thanks to Jan Cempírek for useful consultations.
Conflicts of Interest
The authors declare no conflict of interest. The founding sponsors had no role in the design of the study; in the collection, analyses, or interpretation of data; in the writing of the manuscript, and in the decision to publish the results.
References
- Götze, J. Chemistry, textures and physical properties of quartz—Geological interpretation and technical application. Mineral. Mag. 2009, 73, 645–671. [Google Scholar] [CrossRef]
- Fairbanks, E.E. Gangue minerals. In The Encyclopedia of Mineralogy; Frye, K., Ed.; Hutchinson Ross Pub. Co.: Stroudsburg, PA, USA, 1981; p. 163. [Google Scholar]
- Rusk, B. Quartz cathodoluminescence: Textures, Trace Elements, and Geological Applications. In Cathodoluminescence and its Application to Geoscience; Coulson, I.M., Ed.; Mineralogical Association of Canada: Québec City, QC, Canada, 2014; pp. 127–141. ISBN 978-0-921294-55-9. [Google Scholar]
- Götte, T.; Ramseyer, K. Trace Element Characteristics, Luminescence Properties and Real Structure of Quartz. In Quartz: Deposits, Mineralogy and Analytics; Götze, J., Möckel, R., Eds.; Springer: Berlin/Heidelberg, Germany, 2012; pp. 256–285. [Google Scholar]
- Weil, J.A. A review of the EPR spectroscopy of the point defects in a-quartz: The decade 1982–1992. In Physics and Chemistry of SiO2 and the Si-SiO2 Interface 2; Deal, B.E., Helms, C.R., Eds.; Plenum Press: New York, NY, USA, 1993; pp. 131–144. ISBN 978-1-4899-0776-9. [Google Scholar]
- Gerler, J. Geochemische Untersuchungen an hydrothermalen, metamorphen, granitischen und pegmatitischen Quarzen und deren Flüssigkeitseinschlüssen. Ph.D. Thesis, Göttingen University, Göttingen, Germany, 1990. [Google Scholar]
- Götze, J.; Plötze, M.; Habermann, D. Origin, spectral characteristics and practical applications of the cathodoluminescence (CL) of quartz—A review. Mineral. Pet. 2001, 71, 225–250. [Google Scholar] [CrossRef]
- Henry, D. Cathodoluminescence Theory. The Science Education Research Centre at Carleton College. 2012. Available online: https://serc.carleton.edu/research_education/geochemsheets/CLTheory.html (accessed on 1 December 2017).
- Mason, R. The Physics and Chemistry of Cathodoluminescence. In Cathodoluminescence and its Application to Geoscience; Coulson, I.M., Ed.; Mineralogical Association of Canada: Québec City, QC, Canada, 2014; pp. 1–10. ISBN 978-0-921294-55-9. [Google Scholar]
- Botis, S.; Nokhrin, S.M.; Pan, Y.; Xu, Y.; Bonli, T.; Sopuck, V. Natural Radiation-Induced Damage in Quartz. I. Correlations between Cathodoluminence Colors and Paramagnetic Defects. Can. Mineral. 2005, 43, 1565–1580. [Google Scholar] [CrossRef]
- Jourdan, A.L.; Vennemann, T.W.; Mullis, J.; Ramseyer, K. Oxygen isotope sector zoning in natural hydrothermal quartz. Mineral. Mag. 2009, 73, 615–632. [Google Scholar] [CrossRef] [Green Version]
- Götze, J.; Plötze, M.; Graupner, T.; Hallbauer, D.K.; Bray, C.J. Trace element incorporation into quartz: A combined study by ICP-MS, electron spin resonance, cathodoluminescence, capillary ion analysis, and gas chromatography. Geochim. Cosmochim. Acta 2004, 68, 3741–3759. [Google Scholar] [CrossRef]
- Perny, B.; Eberhardt, P.; Ramseyer, K.; Pankarth, R. Microdistribution of Al, Li, and Na in α quartz: Possible causes and correlation with short-lived cathodoluminescence. Am. Mineral. 1992, 77, 534–544. [Google Scholar]
- Ramseyer, K.; Baumann, J.; Matter, A.; Mullis, J. Cathodoluminescence colours of a-quartz. Mineral. Mag. 1988, 52, 669–677. [Google Scholar] [CrossRef]
- Götze, J.; Plötze, M.; Trautmann, T. Structure and luminescence characteristics of quartz from pegmatites. Am. Mineral. 2005, 90, 13–21. [Google Scholar] [CrossRef]
- Götze, J.; Pan, Y.; Stevens-Kalceff, M.; Kempe, U.; Müller, A. Origin and significance of the yellow cathodoluminescence (CL) of quartz. Am. Mineral. 2015, 100, 1469–1482. [Google Scholar] [CrossRef]
- Rusk, B.; Reed, M. Scanning electron microscope–cathodoluminescence analysis of quartz reveals complex growth histories in veins from the Butte porphyry copper deposit, Montana. Geology 2002, 30, 727–730. [Google Scholar] [CrossRef]
- Monecke, T.; Kempe, U.; Götze, J. Genetic significance of the trace element content in metamorphic and hydrothermal quartz: A reconnaissance study. Earth Planet. Sci. Lett. 2002, 202, 709–724. [Google Scholar] [CrossRef]
- Müller, A.; Herrington, R.; Armstrong, R.; Seltmann, R.; Kirwin, D.J.; Stenina, N.G.; Kronz, A. Trace elements and cathodoluminescence of quartz in stockwork veins of Mongolian porphyry-style deposits. Mineral. Depos. 2010, 45, 707–727. [Google Scholar] [CrossRef] [Green Version]
- Frelinger, S.N.; Ledvina, M.D.; Kyle, J.R.; Zhao, D. Scanning electron microscopy cathodoluminescence of quartz: Principles, techniques and applications in ore geology. Ore Geol. Rev. 2015, 65, 840–852. [Google Scholar] [CrossRef]
- Morávek, P.; Janatka, J.; Pertoldová, J.; Straka, J.; Ďurišová, E.; Pudilová, M. The Mokrsko Gold Deposit—The Largest Gold Deposit in the Bohemian Massif, Czechoslovakia. Econ. Geol. Monogr. Ser. 1988, 1989, 252–259. [Google Scholar] [CrossRef]
- Morávek, P. The Mokrsko gold deposit. In Gold Deposits in Bohemia, 2nd ed.; Morávek, P., Ed.; Czech Geological Survey: Prague, Czech Republic, 1996; pp. 31–56. ISBN 80-7075-202-5. [Google Scholar]
- Boiron, M.C.; Barakat, A.; Cathelineau, M.; Banks, D.A.; Durisová, J.; Morávek, P. Geometry and p–V–T–X conditions of microfissural ore fluid migration: The Mokrsko gold deposit (Bohemia). Chem. Geol. 2001, 173, 207–225. [Google Scholar] [CrossRef]
- Zachariáš, J.; Morávek, P.; Gadas, P.; Pertoldová, J. The Mokrsko-West gold deposit, Bohemian Massif, Czech Republic: Mineralogy, deposit setting and classification. Ore Geol. Rev. 2014, 238–263. [Google Scholar] [CrossRef]
- Zachariáš, J. Structural evolution of the Mokrsko-West, Mokrsko-East and Čelina gold deposits, Bohemian Massif, Czech Republic: Role of fluid overpressure. Ore Geol. Rev. 2016, 74, 170–195. [Google Scholar] [CrossRef]
- Moravek, P.; Pouba, Z. Precambrian and Phanerozoic history of gold mineralization in the Bohemian Massif. Econ. Geol. 1987, 82, 2098–2114. [Google Scholar] [CrossRef]
- Zachariáš, J.; Stein, H. Re-Os Ages of Variscan Hydrothermal Gold Mineralizations, Central Bohemian Metallogenic Zone, Czech Republic. In Mineral Deposits at the Beginning of the 21st Century; Piestrzyński, A., Ed.; Swets & Zeitlinger Publishers: Lisse, The Netherlands, 2001; pp. 851–854. ISBN 9789026518461. [Google Scholar]
- Franke, W. The Variscan orogen in Central Europe: Construction and collapse. Geol. Soc. Lond. Mem. 2006, 32, 333–343. [Google Scholar] [CrossRef]
- Holub, F.V.; Cocherie, A.; Rossi, P. Radiometric dating of granitic rocks from the Central Bohemian Plutonic Complex (Czech Republic): Constraints on the chronology of thermal and tectonic events along the Moldanubian-Barrandian boundary. Comptes Rendus De L’Académie Des Sci. 1997, 325, 19–26. [Google Scholar] [CrossRef]
- Janoušek, V.; Braithwaite, C.J.R.; Bowes, D.R.; Gerdes, A. Magma-mixing in the genesis of Hercynian calc-alkaline granitoids: An integrated petrographic and geochemical study of the Sázava intrusion, Central Bohemian Pluton, Czech Republic. Lithos 2004, 78, 15–26. [Google Scholar] [CrossRef]
- Hajná, J.; Žák, J.; Kachlík, V. Structure and stratigraphy of the Teplá–Barrandian Neoproterozoic, Bohemian Massif: A new plate-tectonic reinterpretation. Gondwana Res. 2011, 19, 495–508. [Google Scholar] [CrossRef]
- Waldhauserová, J. Proterozoic volcanites and intrusive rocks of the Jílové zone in Central Bohemia. Krystalinikum 1984, 17, 77–97. [Google Scholar]
- Janoušek, V.; Wiegand, B.A.; Žák, J. Dating the onset of Variscan crustal exhumation in the core of the Bohemian Massif: New U-Pb single zircon ages from the high-K calc-alkaline granodiorites of the Blatna suite, Central Bohemian Plutonic Complex. J. Geol. Soc. 2010, 167, 347–360. [Google Scholar] [CrossRef]
- Dörr, W.; Zulauf, G. Elevator tectonics and orogenic collapse of a Tibetan-style plateau in the European Variscides: The role of the Bohemian shear zone. Int. J. Earth Sci. 2010, 99, 299–325. [Google Scholar] [CrossRef]
- Ackerman, L.; Haluzová, E.; Creaser, R.A.; Pašava, J.; Veselovský, F.; Breiter, K.; Erban, V.; Drábek, M. Temporal evolution of mineralization events in the Bohemian Massif inferred from the Re–Os geochronology of molybdenite. Miner. Depos. 2017, 52, 651–662. [Google Scholar] [CrossRef]
- Žák, J.; Schulmann, K.; Hrouda, F. Multiple magmatic fabrics in the Sázava pluton (Bohemian Massif, Czech Republic): A result of superposition of wrench-dominated regional transpression on final emplacement. J. Struct. Geol. 2005, 27, 805–822. [Google Scholar] [CrossRef]
- Žák, J.; Holub, F.V.; Verner, K. Tectonic evolution of a continental magmatic arc from transpression in the upper crust to exhumation of mid-crustal orogenic root recorded by episodically emplaced plutons: The Central Bohemian Plutonic Complex (Bohemian Massif). Int. J. Earth Sci. 2005, 94, 385–400. [Google Scholar] [CrossRef]
- Groves, D.I.; Goldfarb, R.J.; Robert, F.; Hart, C.J.R. Gold Deposits in Metamorphic Belts: Overview of Current Understanding, Outstanding Problems, Future Research, and Exploration Significance. Econ. Geol. 2003, 98, 1–29. [Google Scholar] [CrossRef]
- Goldfarb, R.J.; Bakker, T.; Dubé, B.; Groves, D.I.; Hart, C.J.R.; Gosselin, P. Distribution, Character, and Genesis of Gold Deposits in Metamorphic Terranes. In 100th Anniversary Volume; Hedenquist, J.W., Thompson, J.F.H., Goldfarb, R.J., Richards, J.P., Eds.; Society of Economic Geologists: Littleton, CO, USA, 2005; pp. 407–450. ISBN 978-1-887483-01-8. [Google Scholar]
- Hart, C.; Goldfarb, R.J. Distinguishing intrusion-related from orogenic gold systems. In Proceedings of the New Zealand Minerals Conference: Realising New Zealand’s Mineral Potential, Auckland, New Zealand, 13–16 November 2005; Crown Minerals, Ministry of Economic Development and Australasian Institute of Mining and Metallurgy, New Zealand Branch: Wellington, New Zealand, 2005; pp. 125–133. ISBN 0478284551. [Google Scholar]
- Hart, C.J.R. Reduced Intrusion-related Gold system. In Mineral Deposits of Canada: A Synthesis of Major Deposit Types, District Metallogeny, the Evolution of Geological Provinces and Exploration Methods; Goodfellow, W.D., Ed.; Geological Association of Canada—Mineral Deposits Division: St. John’s, NL, Canada, 2007; Volume 102, pp. 95–112. [Google Scholar]
- Neuser, R.D.; Bruhn, F.; Götze, J.; Habermann, D.; Richter, D.K. Kathodolumineszenz: Methodik und Anwendung. Zentralblatt für Geologie und Paläontologie Teil I H 1995, 1/2, 287–306. [Google Scholar]
- Miyoshi, N. Successive zoning of Al and H in hydrothermal vein quartz. Am. Mineral. 2005, 90, 310–315. [Google Scholar] [CrossRef]
- Wark, D.A.; Watson, E.B. TitaniQ: A titanium-in-quartz geothermometer. Contrib. Mineral. Pet. 2006, 152, 743–754. [Google Scholar] [CrossRef]
- Thomas, J.B.; Bruce Watson, E.; Spear, F.S.; Shemella, P.T.; Nayak, S.K.; Lanzirotti, A. TitaniQ under pressure: The effect of pressure and temperature on the solubility of Ti in quartz. Contrib. Mineral. Pet. 2010, 160, 743–759. [Google Scholar] [CrossRef]
- Huang, R.; Audétat, A. The titanium-in-quartz (TitaniQ) thermobarometer: A critical examination and re-calibration. Geochim. Cosmochim. Acta 2012, 84, 75–89. [Google Scholar] [CrossRef]
- Rusk, B.G.; Lowers, H.A.; Reed, M.H. Trace elements in hydrothermal quartz: Relationships to cathodoluminescent textures and insights into vein formation. Geology 2008, 36, 547–550. [Google Scholar] [CrossRef]
- Breiter, K.; Gardenová, N.; Kanický, V.; Vaculovič, T. Gallium and germanium geochemistry during magmatic fractionation and post-magmatic alteration in different types of granitoids: A case study from the Bohemian Massif (Czech Republic). Geol. Carpath. 2013, 64, 171–180. [Google Scholar] [CrossRef]
- Höll, R.; Kling, M.; Schroll, E. Metallogenesis of germanium—A review. Ore Geol. Rev. 2007, 30, 145–180. [Google Scholar] [CrossRef]
- Bailey, J.C. Fluorine in granitic rocks and melts: A review. Chem. Geol. 1977, 19, 1–42. [Google Scholar] [CrossRef]
- Yang, X.-M.; Lentz, D.R. Chemical composition of rock-forming minerals in gold-related granitoid intrusions, southwestern New Brunswick, Canada: Implications for crystallization conditions, volatile exsolution, and fluorine-chlorine activity. Contrib. Mineral. Petrol. 2005, 150, 287–305. [Google Scholar] [CrossRef]
- Rusk, B. Cathodoluminescent Textures and Trace Elements in Hydrothermal Quartz. In Quartz: Deposits, Mineralogy and Analytics; Götze, J., Möckel, R., Eds.; Springer: Berlin/Heidelberg, Germany, 2012; pp. 307–329. [Google Scholar]
© 2018 by the authors. Licensee MDPI, Basel, Switzerland. This article is an open access article distributed under the terms and conditions of the Creative Commons Attribution (CC BY) license (http://creativecommons.org/licenses/by/4.0/).


