Water Structure, Dynamics and Ion Adsorption at the Aqueous {010} Brushite Surface


1
Curtin Institute for Computation/The Institute for Geoscience Research (TIGeR), School of Molecular and Life Sciences, Curtin University, P.O. Box U1987, Perth, WA 6845, Australia
2
Institute for Molecules and Materials, Radboud University, Heyendaalseweg 135, 6525 AJ Nijmegen, The Netherlands
*
Author to whom correspondence should be addressed.
Minerals 2018, 8(8), 334; https://doi.org/10.3390/min8080334
Submission received: 29 June 2018
/
Revised: 31 July 2018
/
Accepted: 1 August 2018
/
Published: 3 August 2018
(This article belongs to the Special Issue Mineral Surface Reactions at the Nanoscale)
Abstract
:Understanding the growth processes of calcium phosphate minerals in aqueous environments has implications for both health and geology. Brushite, in particular, is a component of certain kidney stones and is used as a bone implant coating. Understanding the water–brushite interface at the molecular scale will help inform the control of its growth. Liquid-ordering and the rates of water exchange at the brushite–solution interface have been examined through the use of molecular dynamics simulation and the results compared to surface X-ray diffraction data. This comparison highlights discrepancies between the two sets of results, regardless of whether force field or first principles methods are used in the simulations, or the extent of water coverage. In order to probe other possible reasons for this difference, the free energies for the adsorption of several ions on brushite were computed. Given the exothermic nature found in some cases, it is possible that the discrepancy in the surface electron density may be caused by adsorption of excess ions.
1. Introduction
Calcium phosphate phases are ubiquitous both as biominerals and geologically. The mineral apatite (Ca(PO)X, where X is an anion such as F, Cl or OH) is the most stable of the calcium phosphate phases over a large pH range. However, in acidic aqueous conditions brushite (CaHPO·2HO, dicalcium phosphate dihydrate, DCPD) is often formed. Brushite crystallises to hydroxyapatite at neutral pH and is thought to be a precursor phase [1]. Brushite forms a particularly aggressive kidney stone variant [2], and while a correlation between pH and calcium content has been identified there is not yet a full understanding of this undesirable calcification [3]. Additionally, of the calcium phosphate minerals, brushite in particular has been heavily researched for use in biological applications, such as drug delivery, orthopaedics, craniofacial surgery, cancer therapy, and biosensors [4]. Brushite is a favoured choice because of its high solubility, but there is a limited understanding in regard to its successful resorption into the body [5,6]. Understanding these growth and dissolution processes, particularly in a biological, geological [7] and industrial [8,9] context relies on understanding brushite’s structure and especially its interaction with water at the morphologically important surfaces.
As stated above, brushite has the chemical formula CaHPO·2HO, making it a structural analogue to gypsum (CaSO·2HO). Like gypsum [10], brushite has alternating bilayers of water molecules and calcium phosphate (or sulfate, in gypsum’s case) rows, and each bilayer is offset. Unlike gypsum, the space group of brushite is I a (non-standard setting of Cc) as opposed to I 2/a (C2/c) for gypsum. Indeed the epitaxial relationship between brushite and gypsum has been subject of much study, it was first studied in depth by Heijnen and Hartman by periodic bond chain analysis [11], and later through microscale observations [12] and in situ AFM [13]. In the as-synthesised morphology, the {010} face is most commonly exposed [14,15]. When imaged via atomic force microscopy (AFM) in water the {010} brushite surface typically exhibits steps of height 7.6 Å [15,16], which correspond to one bilayer of calcium phosphate and one bilayer of water molecules. The dissolution of brushite is then observed to proceed via the formation of triangular etch pits with [001], [201] and [101] steps [17,18] (see Figure 1).
Understanding the structure of bulk brushite, with its intrinsic hydration, has so far not been sufficient to understand the water ordering that occurs at hydrated external surfaces. The {010} face of brushite is parallel to the brushite water layers and the natural cleavage plane lies between the two water layers. Thus no reconstruction of the surface is needed and the first layer of water can be considered as a part of the brushite crystal. Furthermore, it might be supposed that the water ordering of the second layer of water should also be particularly strong and follow that which occurs in the bulk. With this as a hypothesis, surface X-ray diffraction (SXRD) was used by Arsic et al. [16] to determine the electron density distribution of the water–brushite interface. However, less in-plane ordering was found than expected. While the first water layer was found to be ordered similarly to the bulk, the second layer appeared to be without in-plane ordering, though both exhibited strong perpendicular ordering.
A similar SXRD study investigated the water ordering of KHPO (KDP) and found an unexpected amount of water ordering which they theorised arose from strong ionic interactions with the charged surface [19]. For KDP they found that the first two water layers exhibited strong ordering, both laterally and perpendicularly, while the third layer had reduced order in both dimensions. The fourth water layer had perpendicular order, but lacked discernible in-plane order. In comparison to this extended ordering for KDP, the lack of structuring of the water over brushite appears a surprising result.
Understanding the water ordering on brushite can also be explored through the use of atomistic simulation. Although there have been studies of the brushite-water interface, to date there has been no precise determination of the water ordering. Jiang et al. [20] studied the adsorption of aspartic acid on brushite and as a part of their study attempted to reproduce the SXRD spectrum from Arsic et al. [16]. The force field employed was based upon existing interatomic potentials (OPLS-AA [21], TIP3P water model [22]) with modifications for brushite based on Hauptmann’s model [23] with partial charges from density functional theory (DFT). There was no specific parameterisation of the force field for aqueous-mineral interfaces and the thermodynamic accuracy of the model was not validated. While this model reproduces some features of the SXRD spectrum, discrepancies were also evident. For example, in the bulk structure, though the peaks were approximately at the same positions as the experimental peaks they were much broader indicating a lack of order, perhaps due to the vibrational modes of the mineral being too soft.
The main aim of the present work was to examine the water ordering and dynamics at the surface of brushite. Here a new force field [24] is used that has been specifically parameterised to reproduce a range of both structural and thermodynamic data for calcium phosphate phases, including the hydration free energy of the phosphate anions and the solubility of different phosphate mineral phases. This was complemented by the use of ab initio molecular dynamics to validate the results, where feasible, and a modified version of our previous force field [24] to examine the sensitivity to choices made during the parameterisation. Simulations were performed for both a flat surface and a surface with one of the possible steps, as the latter represents the most likely site for growth and dissolution. This work examined the extent to which it was possible to reproduce the experimentally acquired SXRD spectrum using simulations of the flat surface. A discrepancy between experiment and simulation led us to further consider the thermodynamics of phosphate and calcium ion adsorption as processes that might lead to disruption of the water structure. Finally, the rates of water exchange were explored based on an analysis of the residence time at the exposed calcium sites, since such data has not been previous reported, yet may be an important kinetic limitation for growth and dissolution.
2. Methods
In this study we have simulated the brushite aqueous interface using atomistic molecular dynamics based on both interatomic potentials and density functional theory. For the classical simulations, interactions were predominately described using the force field of Demichelis et al. [24] (hereafter labelled C1), which was developed with a specific focus on reproducing the thermodynamic properties of phosphate minerals. In particular, the hydration free energy of the phosphate anions and the solubility of different phosphate mineral phases were used for fitting, as these properties are important for an accurate description of the water structure and dynamics around the phosphate and calcium ions. The SPC/Fw water model [25] was chosen for consistency with the previous force field parameterisation developed for carbonate minerals [26]. At 300 K, the present force field gives deviations in the lattice parameters relative to the experimental values [27] of Δa−0.03% Δb −1.03% and Δc +7.48%. As compared to the force field reported by Jiang et al. (at 300 K: Δa 3.89% Δb +1.96% and Δc +1.32%), this force field performs more accurately in the a and b directions, but worse in c [20]. We also modified the parameters of [24] to produce a force field (C2) which more closely matched the experimental lattice parameters (See Table S1 in the Supplementary Information for force field parameters). With this revised model, the errors in the cell parameters after optimisation are Δa −2.38% Δb 0.1% and Δc +0.69%. However, for C2 the thermodynamic quantities were not targeted, and resulted in a worse performance. For example, the solvation free energy for HPO had an error of −4.80% (as opposed to the unmodified force field error of +0.03%) relative to the reference value used for fitting based on quantum mechanical data.
The brushite-water interface was modelled through a periodic cell with lattice parameters of 45.999 Å, 150.978 Å, 53.545 Å, 90.00, 114.13, 90.00, containing 1280 formula units of CaHPO and 8239 water molecules (2206 of which were part of the brushite slab). The brushite slab and water layer were approximately 72 and 76 Å thick, respectively, with the mineral surface lying in the plane of the a and c lattice parameters. The same cell with a single additional ion [Ca, PO, HPO, HPO] was used for the adsorption studies. Further simulations were performed using the same cell, but with reduced water coverage, in order to investigate the influence of the experimental conditions, where only a few layers of water were present, rather than bulk solvent. The same cell with 784, 682, and 596 water molecules was used instead of bulk water for three simulations investigating the effect of the experimental water coverage. Here one side of the slab had 261 water molecules in each case and the other side whose density profile was analysed had 523, 421 and 335 water molecules, respectively.
The brushite slab was built from unit cells reported through X-ray structure data [27] with lattice parameters 5.810 Å, 15.176 Å, 6.234 Å, 90.00, 116.41, 90.00. Brushite and water were pre-equilibrated in separate cells before being combined into a cell that was relaxed in the y direction prior to performing production runs in the canonical ensemble. All classical molecular dynamics simulations were run using the LAMMPS package [28] with a 1 fs time step. The temperature was kept at 300 K via a Nosé-Hoover chain of thermostats (length 5) with a relaxation time of 0.1 ps and atomic trajectories were sampled every 1 ps. The dynamics of water using force field C1 at the flat and stepped brushite surfaces were monitored during 50 and 58 ns runs, respectively. The simulations with reduced water coverage and force field C2 were analysed based on shorter 2 ns runs, as they were used only for calculating electron density profiles, rather than the dynamics of water exchange.
In previous experimental studies, the [001], [201] and [101] steps have all been observed as sites for dissolution [17,18]. A [001] or [201] step on brushite would result in either a row of Ca or HPO ions, if unreconstructed, whereas a [101] step naturally results in alternating Ca and HPO ions. Rows of a single charged species could potentially result in an unstable surface termination and thus the [101] step was chosen for study (see Figure 1). For the investigation of water dynamics at this step a larger periodic cell in the a direction was needed in order to have sufficient separation between steps. Hence, in this case the cell was doubled, with half of the top row of phosphate ions removed and replaced with water molecules.
Analysis of the trajectory resulting from the molecular dynamics simulations was used to calculate the density distribution, radial distribution functions and water residence times. To compare to experiment, the electron density distribution was calculated by weighting atomic positions by the number of electrons per atom. This approximation, if anything, should lead to the simulation overestimating the sharpness of peaks in the electron density distribution, though in practice this is not observed to be the case. The method of fitting the residence times has been previously described by De La Pierre et al. [29].
In order to complement the classical force field study of the hydration of the brushite surface, we have also performed ab initio molecular dynamics (AIMD). Here a reduced surface model consisting of 424 atoms was constructed with lattice parameters of 11.5, 30.196 and 13.386 Å, for a, b, and c, respectively, and a monoclinic angle of 114.13. The system was first equilibrated with the force field C1 to initialise the AIMD. Here all quantum mechanical energies and forces were determined within Kohn–Sham density functional theory, as implemented in the code CP2K [30], using the Gaussian-augmented plane-wave approach within the Quickstep module [31]. The BLYP generalised gradient approximation exchange-correlation functional was used in combination with the D3 dispersion corrections of Grimme and co-workers [32]. A plane-wave cutoff of 400 Ry was set for the auxiliary basis employed for the electron density, in combination with the Goedecker-Teter-Hutter TZVP basis sets and corresponding pseudopotentials [33] for all elements except Ca, where a DZVP basis was chosen. For the AIMD, simulations were also performed in the NVT ensemble with a time step of 0.5 fs and a stochastic thermostat with a time constant of 10 fs to ensure fast equilibration given that only the water structure and not the dynamics were to be analysed. The mass of hydrogen was also set to 2 amu, corresponding to deuterium, and a slightly elevated temperature of 330 K was employed based on previous results that show that BLYP-D3 under these conditions leads to an improved description of the structure of liquid water, which can otherwise be over-structured in AIMD [34].
Multiple-walker [35], well-tempered [36], metadynamics was used to investigate the adsorption of ions [Ca, PO, HPO, HPO] on brushite within the force field simulations. Again LAMMPS [28] was used, but with the inclusion of the PLUMED 2.0 [37] plug-in in order to compute the binding free energies. The collective variable chosen was the normal component of the distance between the ion (taken as the position of Ca or P, as appropriate to the species) and the middle Ca of the brushite slab. Gaussians were laid every 1 ps with a width of 0.2 Å and an initial height of . Using the multiple walkers algorithm, 30 parallel simulations with a bias factor of 5 were run for each energy profile. Aggregated simulation times of at least 500 ns were performed for each system to ensure well-converged sampling.
3. Results and Discussion
3.1. Electron Density Profiles Normal to the {010} Surface
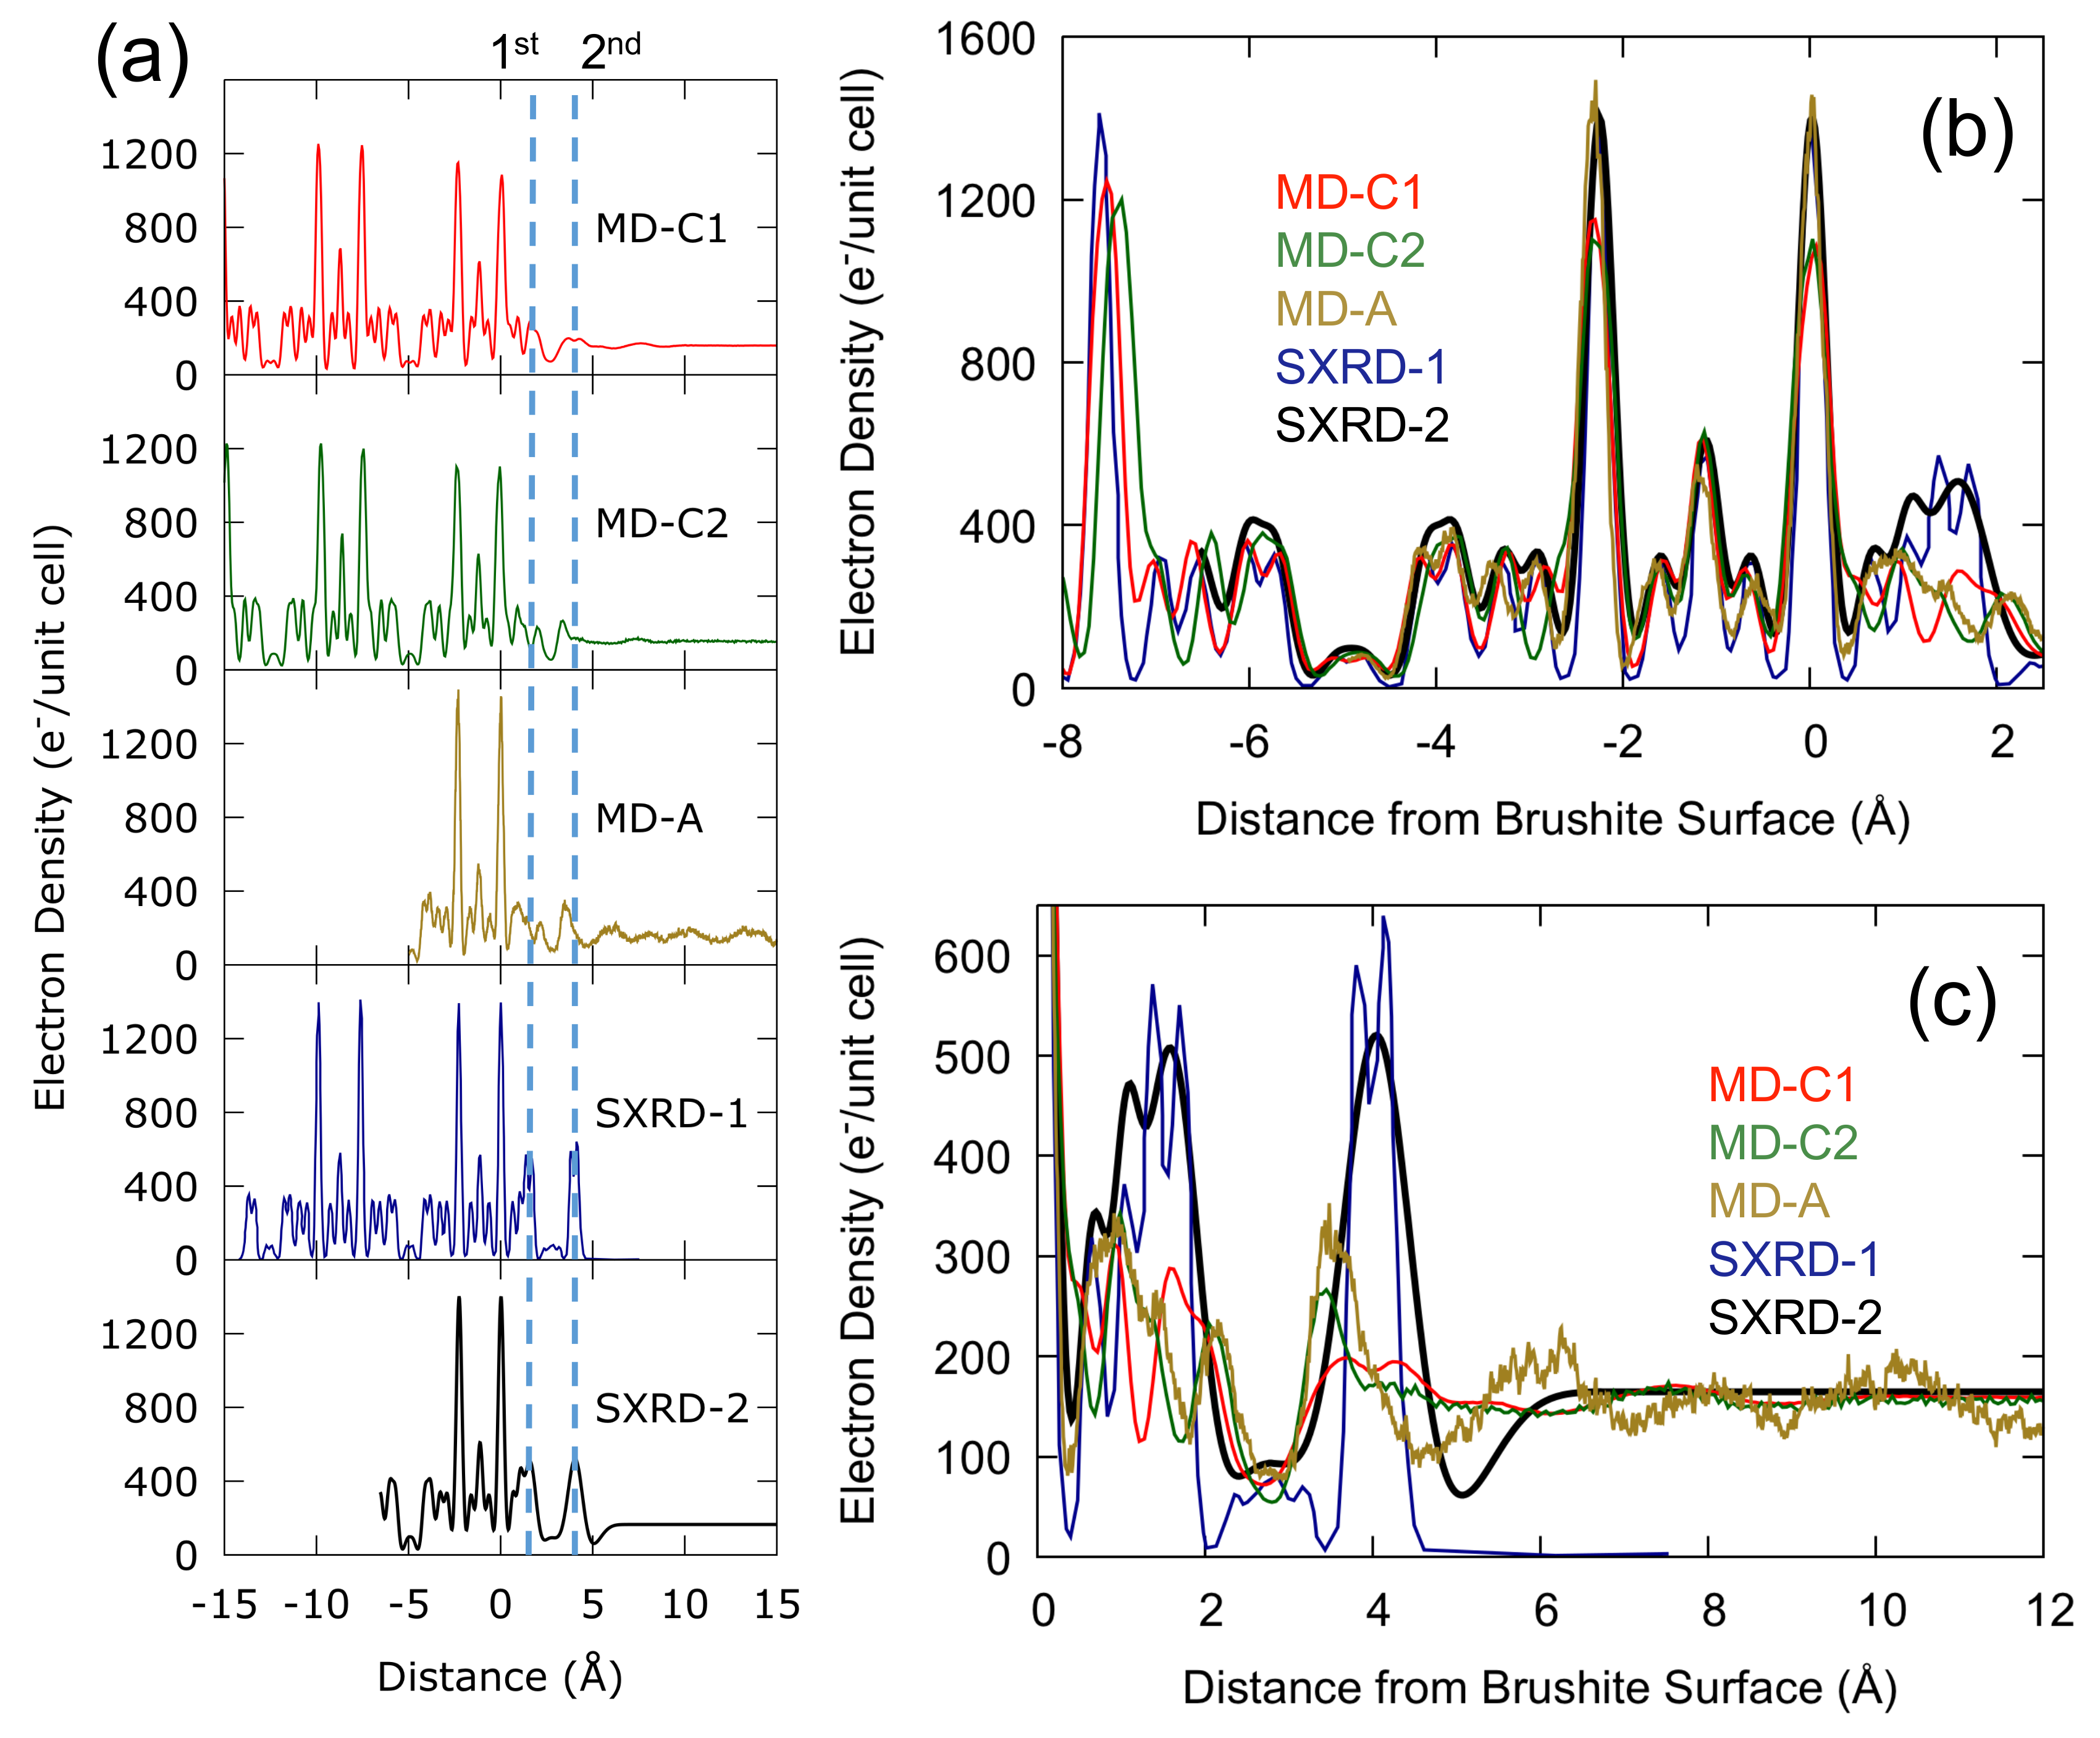
The time averaged electron density was calculated for the interface between the flat {010} surface of brushite and bulk water, resulting in the density profiles normal to the surface shown in Figure 2. In the bulk brushite region (Figure 2b) both of the classical force fields (MD-C1 and MD-C2), and ab initio methods (MD-A), reproduce the SXRD electron density, whether fitted without (SXRD-1) or with (SXRD-2) bulk water. There is some discrepancy in z positions (as discussed in the Methods) and the classical force fields do not quite reproduce the peaks for the brushite Ca atoms, but overall the electron density profiles have similar heights, widths and z positions of peaks. This comparison provides some validation that the force field from Demichelis et al. [24] is appropriately describing the phosphate-water interactions, at least within the bulk brushite environment. Additionally, due to the smaller system size of the AIMD simulations it is possible that the peaks widths might be underestimated due to the truncation of the phonon spectrum in reciprocal space; however the comparison to experimental results shows the peak widths match well.
The comparison of the brushite-water interface between force fields, ab initio methods and SXRD, while qualitatively similar, shows differences in both heights, widths and position of peaks for the interfacial region (see Figure 2c). Using a fit with bulk water (SXRD-2) or without (SXRD-1) did not significantly affect the intensity or position of peaks at the interface, however the peak shape was slightly different between the two fits. In the first water layer both ab initio and classical force fields show a reduced intensity compared to the SXRD profiles and a trough where none exists in the experimental results. All three simulation methods show the three peaks present in the SXRD data at this reduced intensity in the 0.5 to 2 Å region, but the peak positions vary. The results of the modified Demichelis et al. force field (MD-C2) more closely resemble those of the ab initio molecular dynamics (MD-A) in both the first and second water layer, though at reduced intensity in the second water layer. In the second water layer the original Demichelis et al. force field (MD-C1) has a much lower intensity than the SXRD results, but does have the correct position, whereas MD-C2 and MD-A have a higher intensity but have peak positions closer to the brushite surface than the SXRD data suggests is the case. In addition, MD-A has a more pronounced minimum in the density to the right of the peak before tending to bulk water. It is important to recognise that the shorter run length that is currently possible with AIMD compared with force field approaches will partly contribute to a greater degree of structuring in the water distribution. However, despite this caveat, the AIMD results are at least suggestive of under-structuring in the force field results.
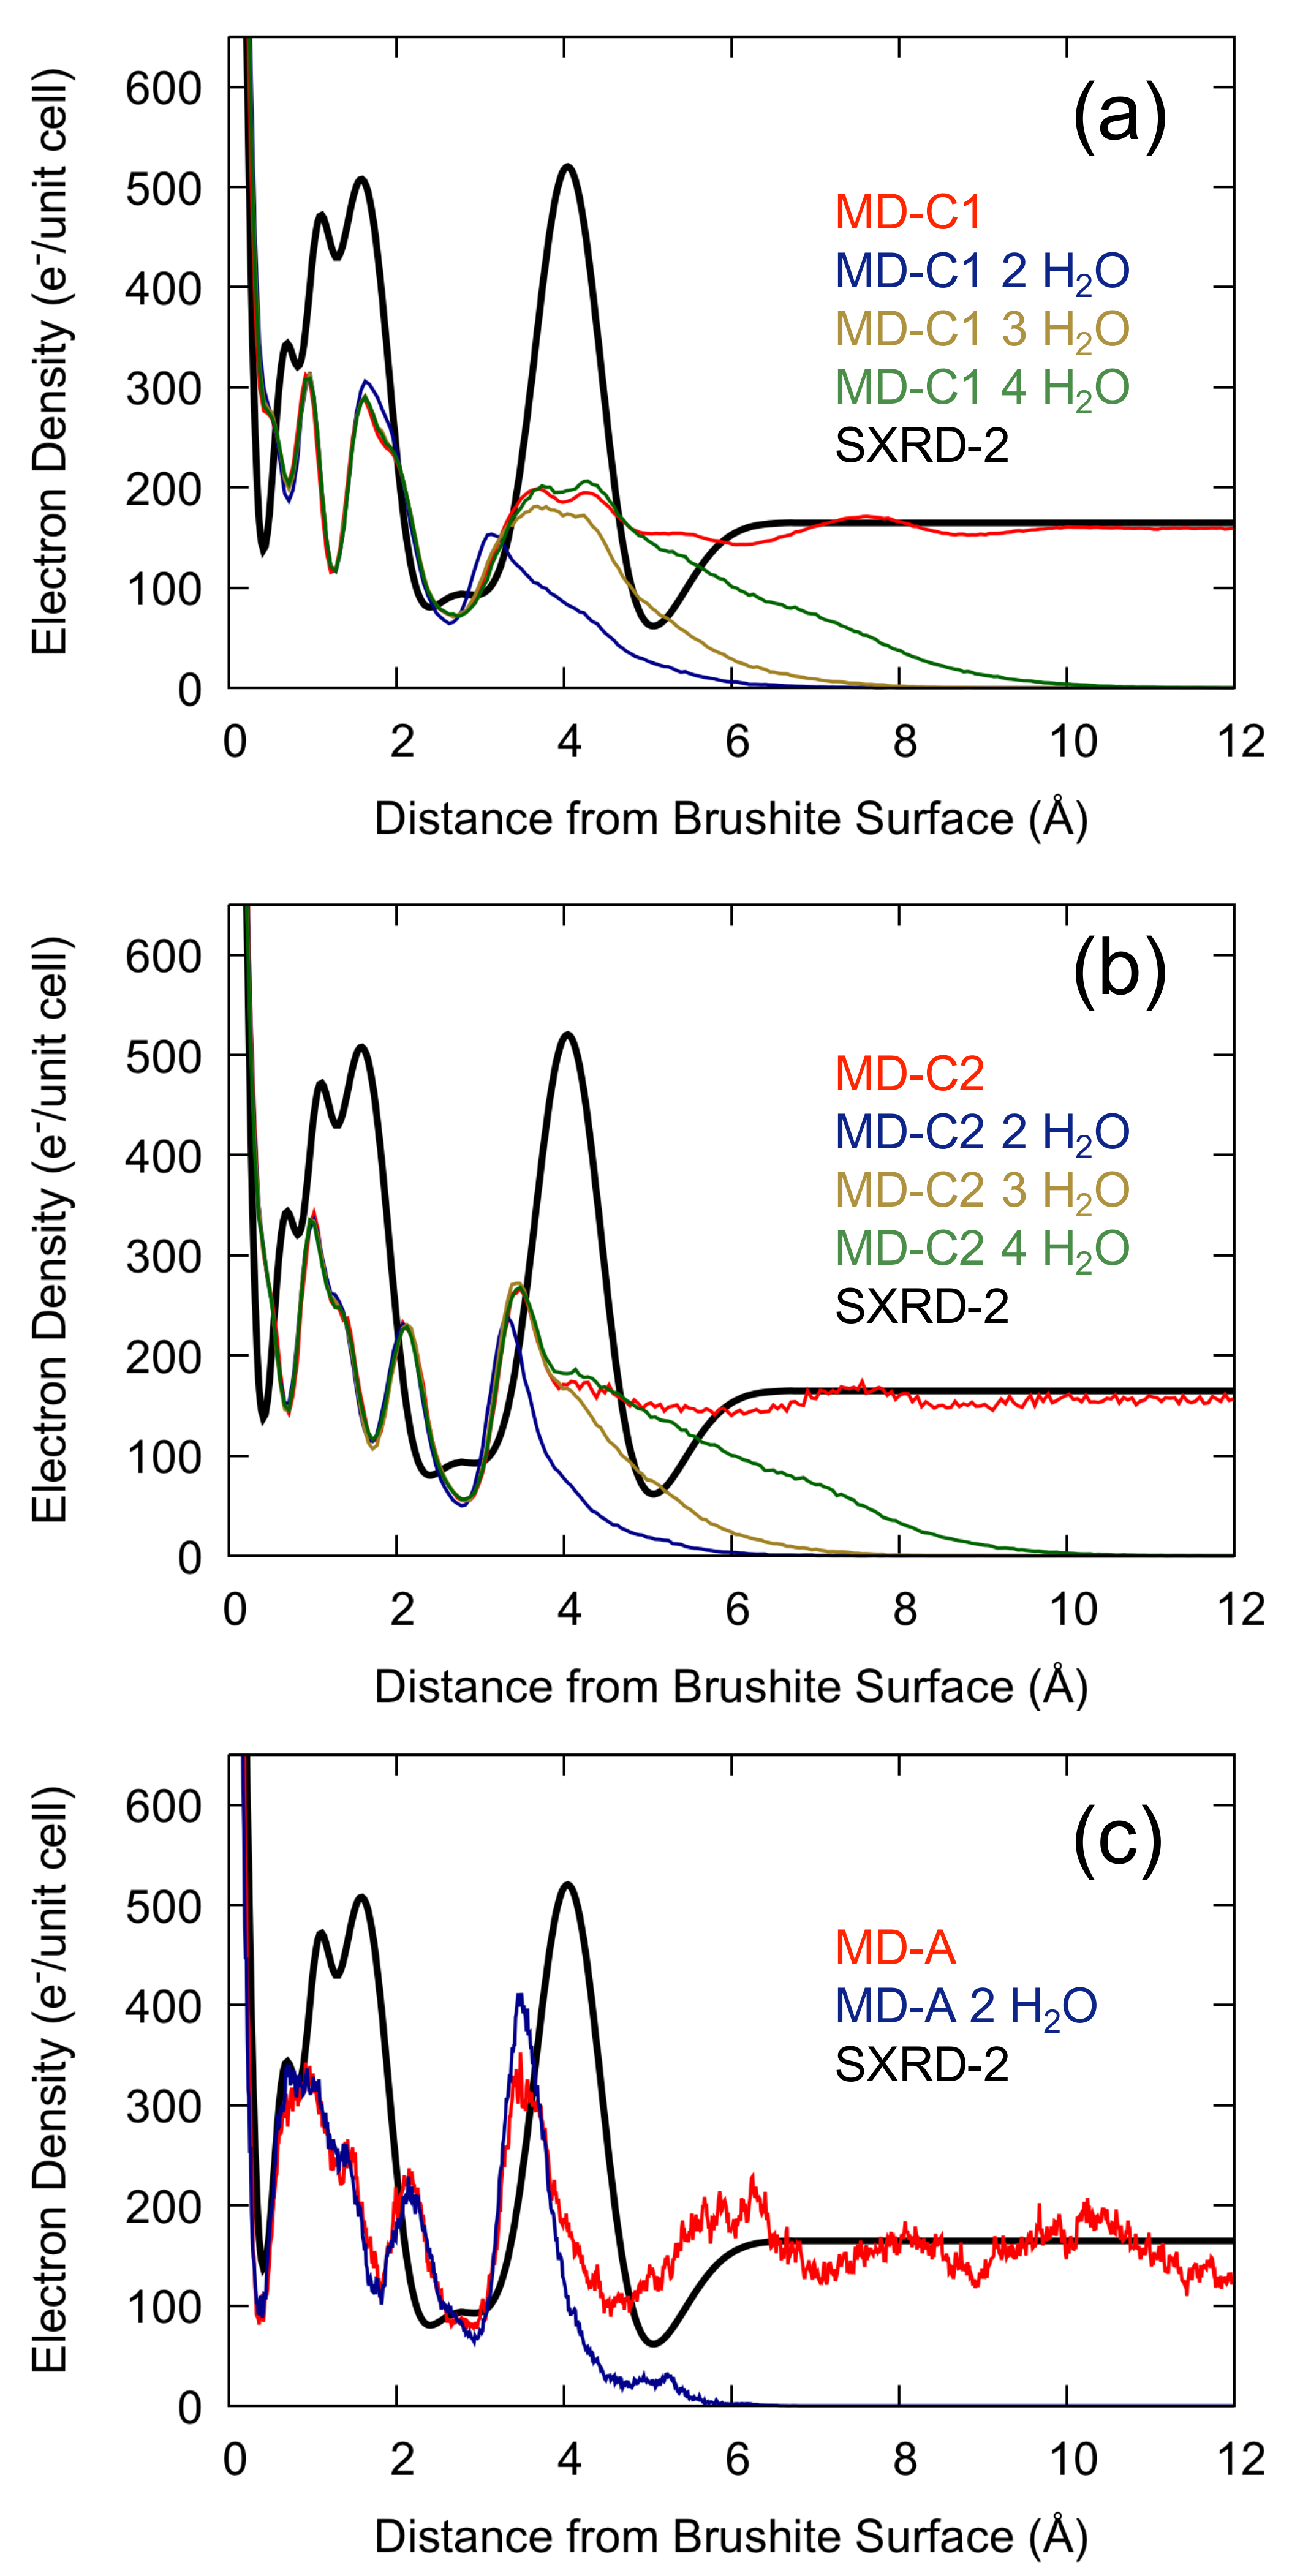
Arsic et al. estimated in [16] that there was a coverage of approximately 2–3 layers of water during the experiments as opposed to bulk water for the simulated interface, which could cause a discrepancy between simulated and measured density profiles. However, a comparison to results using other methods suggests this was an underestimate. For example, using ATR-IR Asay and Kim [38] calculated the average thickness of adsorbed water on silicon oxide and found that at 100% relative humidity there were ten monolayers of water. In another experiment, for measurements on an NaCl surface, Arsic et al. found that above 75% relative humidity a macroscopic water layer formed causing the crystal to dissolve [39]. Still, to verify whether the level of coverage affected the measured density profiles we performed additional simulations as a function of this quantity. In Figure 3 we see that calculating the electron density in the presence of bulk water or with a reduced water coverage gives essentially the same result for a distance <2.5 Å from the top layer Ca atom. While the density tails off above the surface for low coverages due to the presence of vacuum, the lack of bulk water in the simulation does not result in an increased peak height for the first two water layers using the classical force fields, but gives a small but non-negligible increase using ab initio methods. Although reducing the water coverage at the surface clearly alters the electron density away from the surface, it fails to explain the discrepancy with the experimental results for the strongly-ordered peaks close to the brushite-water interface.
3.2. Atomic Density Maps for Water at the {010} Surface
While acquisition of a long ab initio trajectory was not feasible, we performed extended simulations using the force field C1 [24] to better understand the water structure at this brushite surface in all directions, as opposed to just the surface normal projection of the electron density. Figure 4 shows the calculated 3D density isosurfaces for the different types of atom, which can be compared to Figure 1 from Arsic et al. [16]. This shows that the hydrogen bonding pattern within the bulk region, where water hydrogen bonds to oxygens of the hydrogen phosphate anions, matches between the simulated and experimental structure. We verified that the density patterns did not change greatly between force fields using a shorter simulation with C2 (see Supplementary Information Figure S1).
The first water layer in the simulations also follows this bonding pattern with some deviations. By investigating the 3D maps we can postulate H-bonding patterns to help explain the observed oxygen positions. We see in the 3D map that the distribution of hydrogens for the lower water layer at the surface (i.e., first layer above the CaHPO layer) follows the bonding pattern of the bulk. In contrast, the upper water hydrogens (shown in dark grey in Figure 4) are much more diffuse, which indicates that the second water layer will also be less well-ordered due to the lack of a well-defined hydrogen bonding pattern. Experimental results suggest no in-plane ordering in the second water layer, but a high degree of perpendicular order, whereas the calculated distribution has a lower level of perpendicular order but a greater amount of in-plane ordering.
The suggested H-bonding pattern of Arsic et al. appears to disagree with the results of the force field simulation. As seen in Figure 4, the hydrogens of the first water layer, though somewhat diffuse, follow a similar pattern as the bulk. We confirm via the 3D map of the water density viewed down the surface normal (see Figure 5) that the oxygen of the first water layer is coordinated to calcium, whereas the oxygen of the second layer lies above phosphate. The proposed loss of H-bonding suggested by Arsic et al. is seen as an increase in the diffuse nature of the distribution for hydrogen where it rotates between multiple sites. The third layer appears to be largely diffuse, giving rise only to small localised regions at low values for the isosurface density. In terms of position, these slight indications of a third layer occur at a site that is almost directly above the first water layer. These results suggest that the brushite surface is affecting the water structure at a height of as much as 6 Å away from the surface.
3.3. Water Density at the [101] Steps
The creation of a step corresponds to a disruption in the water structure and is frequently the site of growth and dissolution. We investigated two obtuse [101] steps; one where hydrogens of the phosphate anion were oriented outward towards the bulk water and another where they were oriented inward towards the mineral. Though the step where hydrogens are pointed inward towards the bulk does not appear in nature, since triangular islands/etch pits bounded by 3 different crystallographic directions are formed, the simulated model required the presence of this step and was thus included for analysis. We therefore expect the step with hydrogens oriented inward to be less stable than the naturally occurring one, though within the timescale of the simulations neither showed any tendency toward dissolution.
In our analysis of the water distribution at the step edges, shown in Figure 6, phosphate/calcium rows of the underlying surface are referred to by position in terms of surface height, being in the upper (U) or lower (L) terrace, and by row number where an increasing value represents a greater distance away from the step edge (example: U2 refers to the second row relative to the upper terrace step edge). The step where hydrogen is pointed inward towards the bulk is denoted with a prime e.g., U’2.
Based on the computed isosurfaces, the first water layer appears unchanged on the lower terraces for both steps as compared to the flat surface, except for the now exposed L1/L’1 sites. The second water layer has a clustering of water molecules where the step occurs, one of which appears to be coordinated to the newly exposed upper site (U1/U’1). Analysis of the radial distribution functions confirms that the U1 Ca sites have two water oxygens coordinated and the other calcium sites have only one water oxygen coordinated (See Figure S2 in the Supplementary Information). By positions L3/U3 and L’3/U’3, the density appears to have approximately returned to the same distribution as above a surface Ca. From the top view we see more clearly the disruption of the water ordering due to the presence of both steps (see Figure S3).
3.4. Water Residence Times
Experimental evidence suggests that bulk brushite water behaves in a manner that is ”ice-like”, where the extrapolated brushite water density based on the water bilayer is 4% higher than normal ice [16]. At the interface, water is suggested to be crystalline but not ”ice-like,” with only partial water ordering [16]. One way of characterising the nature of the water is through the dynamics of exchange between sites. Analysis of the residence times of water around the surface calcium sites of the flat surface indicates that they are particularly long, with no water exchange observed over the course of the 50 ns simulation. To place this in context, the exchange is much slower than for an isolated calcium ion in pure water or for calcium at the basal surface of calcite, which have been previously reported using the same force field as ≈0.2 and ≈2 ns, respectively [29].
In contrast to the flat surface, most of the calcium sites around the step edges did exhibit significant water exchange. Figures S4 and S5 show the survival function, P(t), as a function of time on a logarithmic scale for the upper and lower rows of the step. Table 1 shows the corresponding residence times of water around the calcium ions near the steps. Most residence times were ≈20–50 times longer than the residence time of an isolated calcium ion in pure water. The U1 calcium has one of the lowest residence times and thus is likely to be a reactive centre.
We expect that as the distance increases from the step, the residence times should converge to those for the flat brushite surface, which would correspond to no observable exchange over the duration of the simulation. However, this was not found to be the case, at least within the range of 5 rows either side of the step; some degree of exchange was still observed, suggesting a long-range perturbation of the water dynamics occurs due to the presence of the step. It should be noted that as the residence times increased to the order of the simulation length, the uncertainties became large, as can be seen in Figure S5. In particular, the results for site U’5 are not well fitted, indicating a degree of uncertainty regarding its value. Sites L1 and L’1 also had long residence times (>20 ns) but were more accurately sampled than U’5 as seen from the survival functions.
3.5. Adsorption of Ions
To further investigate the discrepancy in calculated electron densities at the {010} brushite-water interface, the possibility that this was due to the adsorption of excess ions has been explored. The experimental technique used to measure the electron density distribution used a high relative humidity and a reduced X-ray intensity in order to try to balance beam damage and healing of the surface, in order to prolong the lifetime of the surface during data collection [16]. Despite this, it remains possible that there could be phosphate and calcium ions in solution produced by the X-rays and local changes in pH, and that adsorption of these ions (Ca, PO, HPO and HPO) could lead to a change in the measured electron density. At neutral pH, the predominant phosphate ions are likely to be HPO and HPO, but the adsorption of PO was also included, as proton transfers may occur in these unusual environments, though this is unlikely.
To probe this, the free energies of adsorption of the above ions on the brushite {010} surface from bulk water were calculated. Of the ions studied, adsorption of HPO and HPO were thermodynamically favourable (see Table 2). The trend of lower free energies (i.e., more exothermic) of adsorption for ions that have a lower charge magnitude suggests that the desolvation of the ions in water dominates over the strength of adsorption to the brushite surface. As the magnitude of the charge increases, the solvation shell is more tightly bound and thus desolvation is less favourable. This is evidenced by the trend in hydration free energy of the ions reported previously with the same force field, where HPO, HPO, Ca and PO are −339, −1140, −1350 to −1503 and −2495 kJ/mol, respectively [24,40]. Though Ca and HPO have the same charge magnitude, HPO has a less exothermic hydration free energy. Thus it is not surprising that of the two ions HPO has a more favourable adsorption, as it is more easily desolvated. Correspondingly, HPO with both the lowest charge magnitude and the highest hydration free energy has the lowest free energy of adsorption of the ions studied.
The position of the minima for HPO was also the closest to the arguably anomalous peak in the experimental spectrum, 0.14 Å away, as indicated by the dashed line in Figure 7. With a relatively strong minima located within the second water layer, there is a possibility of HPO ions being adsorbed to the surface. Further investigation would be needed to determine whether this could account for the apparent discrepancy between experiment and simulation.
4. Conclusions
In this study the aqueous interface at the brushite {010} surface has been simulated using both classical and ab initio methods. All methods reproduced the bulk brushite structure; however, there were discrepancies between the experimental electron density for the first two water layers as reported from SXRD and those obtained from the present simulations. In particular, the molecular dynamics simulations all find a reduced degree of ordering perpendicular to the surface. Repeated simulations with varying amounts of water showed that the experimental conditions, where there were only 2–3 layers of water [16], could effect the final results, but failed to explain the higher density in the second water layer for the experimental electron density at the level observed. A modified version of a published force field for aqueous calcium phosphate systems [24] better reproduced the electron density obtained using ab initio methods, but the differences between the distribution as a function of force field parameterisation are far smaller than those between simulation and experiment, which suggests that the difference is due to factors beyond the choice of level of theory.
Density maps obtained from our simulations are consistent with the H-bonding patterns proposed experimentally for the water within bulk brushite, while providing further insights as to how that H-bonding pattern would change for an exposed surface of aqueous brushite. Analysis of the density isosurfaces suggests that the second water layer is hydrogen bonded to phosphate ions, while the third layer, though very diffuse, does appears to show a slight preference to be located over the first layer water oxygen. While experimental results suggest that beyond the first water layer there is no lateral order, our results suggest a modified continuation of the bulk H-bonding pattern.
Analysis of water exchange dynamics at calcium ions in the surface indicates that the water is strongly bound leading to no observable exchange of water on the timescale of our simulations for the flat surface. The same analysis for [101] steps indicate that they are potentially much more reactive as water exchange is far more rapid, allowing us to determine likely active sites for growth/dissolution. Analysis of water residence times as a function of proximity to the step edge indicated that positions as far as 17 Å away may still be affected by the presence of a step, with the caveat that the uncertainty in these values increases as the exchange slows down. Investigation of the [001] and [201] steps could be used to further characterise the water dynamics on the {010} brushite surface, as the different steps could have very different residence times and coordination patterns.
Investigation of the free energies associated with adsorption of various ions suggest that there is a possibility that the experimental electron density distribution may include some contribution from the adsorption of excess phosphate ions, as their adsorption is found to be thermodynamically favourable. These ions would be present in low concentration due to equilibration with the water layers to achieve saturation, though this may be enhanced as a result of beam damage to the sample leading to the creation of defects. At this stage it is not possible to determine unambiguously the reason for the discrepancy between simulation and experiment, since both approaches suffer from limitations when studying interfacial systems, and further studies will be required in future as techniques progress.
Supplementary Materials
The following are available online at https://www.mdpi.com/2075-163X/8/8/334/s1, Section: Radial Distribution Functions. Table S1: Modified force field parameters for C2, Table S2: Electron density peak positions and intensities, Figure S1: Electron density normal to the {010} brushite-water interface from MD-C2, Figure S2: Side and top view of 3D density maps of the {010} brushite-water interface from MD-C2, Figure S3: Radial distribution functions for oxygen around Ca, Figure S4: Top view of 3D density maps of the [101] steps, Figure S5: Survival functions for the lower row of the step, Figure S6: Survival functions for the upper row of the step.
Author Contributions
E.V., J.G. and P.R. conceived the work; N.G. set up the classical simulations, with help from P.R., and then performed the molecular dynamics and analysed the results. J.G. ran the ab initio MD based on an initial configuration generated by N.G. E.V. was responsible for providing the SXRD data and additional fits. N.G. drafted the manuscript and all authors contributed to the revision.
Funding
This research was funded by the Australian Research Council under grant numbers FT130100463 and DP160100677.
Acknowledgments
The Australian National Computational Infrastructure (NCI) and the Pawsey Supercomputing Centre are acknowledged for the provision of computing resources.
Conflicts of Interest
The authors declare no conflict of interest.
References
- Johnsson, M.S.A.; Nancollas, G.H. The Role of Brushite and Octacalcium Phosphate in Apatite Formation. Crit. Res. Oral Biol. Med. 1992, 3, 61–82. [Google Scholar] [CrossRef]
- Pramanik, R.; Asplin, J.R.; Jackson, M.E.; Williams, J.C. Protein content of human apatite and brushite kidney stones: Significant correlation with morphologic measures. Urol. Res. 2008, 36, 251–258. [Google Scholar] [CrossRef] [PubMed]
- Siener, R.; Netzer, L.; Hesse, A. Determinants of Brushite Stone Formation: A Case-Control Study. PLoS ONE 2013, 8, e78996. [Google Scholar] [CrossRef] [PubMed]
- Tamimi, F.; Sheikh, Z.; Barralet, J. Dicalcium phosphate cements: Brushite and monetite. Acta Biomater. 2012, 8, 474–487. [Google Scholar] [CrossRef] [PubMed]
- Cama, G.; Barberis, F.; Capurro, M.; Silvio, L.D.; Deb, S. Tailoring brushite for in situ setting bone cements. Mater. Chem. Phys. 2011, 130, 1139–1145. [Google Scholar] [CrossRef]
- Bannerman, A.; Williams, R.L.; Cox, S.C.; Grover, L.M. Visualising phase change in a brushite-based calcium phosphate ceramic. Sci. Rep. 2016, 6, 32671. [Google Scholar] [CrossRef] [PubMed] [Green Version]
- Laviano, R.; Fiore, S. Brushite, hydroxylapatite, and taranakite from Apulian caves (southern Italy): New mineralogical data. Am. Miner. 1991, 76, 1722–1727. [Google Scholar]
- Tortet, L.; Gavarri, J.R.; Nihoul, G.; Dianoux, A.J. Proton mobilities in brushite and brushite/polymer composites. Solid State Ion. 1997, 97, 253–256. [Google Scholar] [CrossRef]
- Kumar, M.; Dasarathy, H.; Riley, C. Electrodeposition of brushite coatings and their transformation to hydroxyapatite in aqueous solutions. J. Biomed. Mater. Res. 1999, 45, 302–310. [Google Scholar] [CrossRef]
- Yan, C.; Nishida, J.; Yuan, R.; Fayer, M.D. Water of Hydration Dynamics in Minerals Gypsum and Bassanite: Ultrafast 2D IR Spectroscopy of Rocks. J. Am. Chem. Soc. 2016, 138, 9694–9703. [Google Scholar] [CrossRef] [PubMed]
- Heijnen, W.M.M.; Hartman, P. Structural morphology of gypsum (CaSO4·2H2O), brushite (CaHPO4·2H2O) and pharmacolite (CaHAsO4·2H2O). J. Cryst. Growth 1991, 108, 290–300. [Google Scholar] [CrossRef]
- Pinto, A.; Jiménez, A.; Prieto, M. Interaction of phosphate-bearing solutions with gypsum: Epitaxy and induced twinning of brushite (CaHPO4·2H2O) on the gypsum cleavage surface. Am. Mineral. 2009, 94, 313–322. [Google Scholar] [CrossRef]
- Pinto, A.J.; Ruiz-Agudo, E.; Putnis, C.V.; Putnis, A.; Jimenez, A.; Prieto, M. AFM study of the epitaxial growth of brushite (CaHPO4·2H2O) on gypsum cleavage surfaces. Am. Mineral. 2010, 95, 1747–1757. [Google Scholar] [CrossRef]
- Abbona, F.; Christensson, F.; Angela, M.; Madsen, H. Crystal habit and growth conditions of brushite, CaHPO4·2H2O. J. Cryst. Growth 1993, 131, 331–346. [Google Scholar] [CrossRef]
- Kanzaki, N.; Onuma, K.; Treboux, G.; Ito, A. Dissolution kinetics of dicalcium phosphate dihydrate under pseudophysiological conditions. J. Cryst. Growth 2002, 235, 465–470. [Google Scholar] [CrossRef]
- Arsic, J.; Kaminski, D.; Poodt, P.; Vlieg, E. Liquid ordering at the Brushite-{010}-water interface. Phys. Rev. B 2004, 69, 245406. [Google Scholar] [CrossRef]
- Scudiero, L.; Langford, S.C.; Dickinson, J.T. Scanning force microscope observations of corrosive wear on single-crystal brushite (CaHPO4·2H2O) in aqueous solution. Tribol. Lett. 1999, 6, 41–55. [Google Scholar] [CrossRef]
- Giocondi, J.L.; El-Dasher, B.S.; Nancollas, G.H.; Orme, C.A. Molecular mechanisms of crystallization impacting calcium phosphate cements. Phil. Trans. Math. Phys. Eng. Sci. 2010, 368, 1937–1961. [Google Scholar] [CrossRef] [PubMed] [Green Version]
- Reedijk, M.F.; Arsic, J.; Hollander, F.F.A.; de Vries, S.A.; Vlieg, E. Liquid Order at the Interface of KDP Crystals with Water: Evidence for Icelike Layers. Phys. Rev. Lett. 2003, 90, 066103. [Google Scholar] [CrossRef] [PubMed]
- Jiang, W.; Pan, H.; Zhang, Z.; Qiu, S.R.; Kim, J.D.; Xu, X.; Tang, R. Switchable Chiral Selection of Aspartic Acids by Dynamic States of Brushite. J. Am. Chem. Soc. 2017, 139, 8562–8569. [Google Scholar] [CrossRef] [PubMed]
- Jorgensen, W.L.; Maxwell, D.S.; Tirado-Rives, J. Development and Testing of the OPLS All-Atom Force Field on Conformational Energetics and Properties of Organic Liquids. J. Am. Chem. Soc. 1996, 118, 11225–11236. [Google Scholar] [CrossRef] [Green Version]
- Jorgensen, W.L.; Chandrasekhar, J.; Madura, J.D.; Impey, R.W.; Klein, M.L. Comparison of simple potential functions for simulating liquid water. J. Am. Chem. Soc. 1983, 79, 926–935. [Google Scholar] [CrossRef]
- Hauptmann, S.; Dufner, H.; Brickmann, J.; Kast, S.M.; Berry, R.S. Potential energy function for apatites. Phys. Chem. Chem. Phys. 2003, 5, 635–639. [Google Scholar] [CrossRef] [Green Version]
- Demichelis, R.; Garcia, N.A.; Raiteri, P.; Malini, R.I.; Freeman, C.L.; Harding, J.H.; Gale, J.D. Simulation of Calcium Phosphate Species in Aqueous Solution: Force Field Derivation. J. Phys. Chem. B 2017, 122, 1471–1483. [Google Scholar] [CrossRef] [PubMed]
- Wu, Y.; Tepper, H.L.; Voth, G.A. Flexible simple point-charge water model with improved liquid-state properties. J. Chem. Phys. 2006, 124, 024503. [Google Scholar] [CrossRef] [PubMed]
- Raiteri, P.; Demichelis, R.; Gale, J.D. Thermodynamically Consistent Force Field for Molecular Dynamics Simulations of Alkaline-Earth Carbonates and Their Aqueous Speciation. J. Phys. Chem. C 2015, 119, 24447–24458. [Google Scholar] [CrossRef]
- Schofield, P.F.; Knight, K.S.; van der Houwen, J.A.M.; Valsami-Jones, E. The role of hydrogen bonding in the thermal expansion and dehydration of brushite, di-calcium phosphate dihydrate. Phys. Chem. Miner. 2004, 31, 606–624. [Google Scholar] [CrossRef]
- Plimpton, S. Fast Parallel Algorithms for Short-Range Molecular Dynamics. J. Comput. Phys. 1995, 117, 1–19. [Google Scholar] [CrossRef] [Green Version]
- Pierre, M.D.L.; Raiteri, P.; Gale, J.D. Structure and Dynamics of Water at Step Edges on the Calcite {1014} Surface. Cryst. Growth Des. 2016, 16, 5907–5914. [Google Scholar] [CrossRef]
- Vondele, J.V.; Krack, M.; Mohamed, F.; Parrinello, M.; Chassaing, T.; Hutter, J. Quickstep: Fast and accurate density functional calculations using a mixed Gaussian and plane waves approach. Comput. Phys. Commun. 2005, 167, 103–128. [Google Scholar] [CrossRef] [Green Version]
- Lippert, G.; Hutter, J.; Parrinello, M. The Gaussian and augmented-plane-wave density functional method for ab initio molecular dynamics simulations. Mol. Phys. 1999, 103, 124–140. [Google Scholar] [CrossRef]
- Grimme, S.; Antony, J.; Ehrlich, S.; Kreig, H. A consistent and accurate ab initio parametrization of density functional dispersion correction (DFT-D) for the 94 elements H-Pu. J. Chem. Phys. 2010, 132, 154104. [Google Scholar] [CrossRef] [PubMed]
- Goedecker, S.; Teter, M.; Hutter, J. Separable dual-space Gaussian pseudopotentials. Phys. Rev. B 1996, 54, 1703–1710. [Google Scholar] [CrossRef] [Green Version]
- Bankura, A.; Karmakar, A.; Carnevale, V.; Chandra, A.; Klein, M.L. Structure, Dynamics, and Spectral Diffusion of Water from First-Principles Molecular Dynamics. J. Phys. Chem. C 2014, 118, 29401–29411. [Google Scholar] [CrossRef]
- Raiteri, P.; Laio, A.; Gervasio, F.L.; Micheletti, C.; Parrinello, M. Efficient Reconstruction of Complex Free Energy Landscapes by Multiple Walkers Metadynamics. J. Phys. Chem. B 2006, 110, 3533–3539. [Google Scholar] [CrossRef] [PubMed]
- Barducci, A.; Bussi, G.; Parrinello, M. Well-Tempered Metadynamics: A Smoothly Converging and Tunable Free-Energy Method. Phys. Rev. Lett. 2008, 100, 020603. [Google Scholar] [CrossRef] [PubMed]
- Bonomi, M.; Branduardi, D.; Bussi, G.; Camilloni, C.; Provasi, D.; Raiteri, P.; Donadio, D.; Marinelli, F.; Pietrucci, F.; Broglia, R.A.; et al. PLUMED: A portable plugin for free-energy calculations with molecular dynamics. Comput. Phys. Commun. 2009, 180, 1961–1972. [Google Scholar] [CrossRef] [Green Version]
- Asay, D.B.; Kim, S.H. Evolution of the Adsorbed Water Layer Structure on Silicon Oxide at Room Temperature. J. Phys. Chem. B 2005, 109, 16760–16763. [Google Scholar] [CrossRef] [PubMed]
- Arsic, J.; Kaminski, D.M.; Radenovic, N.; Poodt, P.; Graswinckel, W.S.; Cuppen, H.M.; Vlieg, E. Thickness-dependent ordering of water layers at the NaCl(100) surface. J. Chem. Phys. 2004, 120, 9720–9724. [Google Scholar] [CrossRef] [PubMed]
- Raiteri, P.; Gale, J.D.; Quigley, D.; Rodger, P.M. Derivation of an Accurate Force-Field for Simulating the Growth of Calcium Carbonate from Aqueous Solution: A New Model for the Calcite-Water Interface. J. Phys. Chem. C 2010, 114, 5997–6010. [Google Scholar] [CrossRef]
Figure 1.
One of the two Brushite {010} surfaces viewed from above with crystallographic directions indicated with solid black lines. Water is omitted for clarity. H is white, O is red, P is tan, and Ca is cyan.
Figure 1.
One of the two Brushite {010} surfaces viewed from above with crystallographic directions indicated with solid black lines. Water is omitted for clarity. H is white, O is red, P is tan, and Ca is cyan.

Figure 2.
(a) Time averaged electron density profiles obtained by MD simulations (MD-C1 refers to simulations using the Demichelis et al. force field [24]; MD-C2 refers to the modified version of MD-C1; MD-A refers to the results from ab initio molecular dynamics) compared with the electron density profiles obtained via SXRD ( SXRD-1 refers to the published data of Arsic et al. and SXRD-2 refers to the same data with a fit including bulk water). Peak positions are listed explicitly in Table S2. The origin is chosen such that the top layer Ca is at Å and densities are scaled to the experimental unit cell (lattice parameters a = 5.812 Å, b = 15.18 Å, c = 6.239 Å, and = 114.13) [16]. Dashed blue lines indicate the 1st and 2nd hydration layer positions as indicated by SXRD. Overlaid density profiles for specific regions are also shown in the case of (b) the top two brushite layers and (c) the brushite–water interface.

Figure 3.
The interfacial water structure with 2, 3, and 4 layers of water using (a) the Demichelis et al. force field (MD-C1) [24], (b) the modified Demichelis et al. force field (MD-C2) and (c) ab initio methods (MD-A) (for this last case only the two-layer coverage was simulated).
Figure 3.
The interfacial water structure with 2, 3, and 4 layers of water using (a) the Demichelis et al. force field (MD-C1) [24], (b) the modified Demichelis et al. force field (MD-C2) and (c) ab initio methods (MD-A) (for this last case only the two-layer coverage was simulated).

Figure 4.
The atom density isosurfaces for brushite and water averaged over the molecular dynamics simulation (MD-C1). The {010} surface of CaHPO·2HO is shown through the [201] plane. For the calcium and phosphate ions, H is white, O is red, P is tan, and Ca is cyan, while for the water density isosurfaces the bulk water is blue and H is white (all isosurfaces at 2 atoms/Å). Oxygens of water from beyond the first layer are shown with yellow isosurfaces and H is shown with transparent grey in the bulk region due to its diffuse distribution (both 0.05 atoms/Å).

Figure 5.
Top view of the 3D atomic structure of the flat brushite-water interface for the {010} plane. Average positions of the crystal are represented with a ball-and-stick model with only the top layer of the phosphate bilayer shown and calculated density isosurfaces for the first three water layers. For average positions, H is white, O is red, P is tan, and Ca is cyan. In the water density isosurfaces the first layer H is white and the first layer O is blue (both isosurfaces set to 2 atoms/Å), the second layer O is yellow (0.2 atoms/Å) and the third layer O is orange (0.05 atoms/Å). The surface unit cell is indicated with a dashed black line.

Figure 6.
Side view of the 3D density maps of the [101] steps with (Top) hydrogens facing outward towards water (L or U) and (Bottom) hydrogens facing inward towards the bulk (L’ or U’) on the {010} face. Average positions of the phosphate and calcium ions are represented with a ball and stick model where H is white, O is red, P is tan, and Ca is cyan (all isosurfaces set to 2 atoms/Å). For water, the isosurfaces shown are in transparent colours where the darker shade is used for the higher density (blue: 2 atoms/Å and grey 0.05 atoms/Å). Labels indicate the atomic row position (Upper or Lower) and its proximity to the step (1, 2, 3, 4 or 5) using the same notation established for calcite [29].

Figure 7.
Free energies of adsorption of Ca, PO, HPO and HPO at the brushite {010}-aqueous interface with respect to the distance of Ca/P, as applicable, from the central surface calcium. Curves are aligned to G = 0 in the long-range limit prior to the constraining wall. The location of the second water layer in the experimental spectrum is indicated with a dashed line at a height above the surface of 4.04 Å.


Table 1.
Residence times of waters around sites with the terminology of sites specified in Figure 6 using fits shown in Figures S4 and S5. The column with ”Hydrogen Out” refers to the step where the hydrogens of the hydrogen phosphate are pointed outward towards the bulk water and ”Hydrogen In” refers to the step where the hydrogens of the hydrogen phosphate are pointed inward towards the bulk phosphate.
| Site | Time (ns) | |
|---|---|---|
| Hydrogen Out | Hydrogen In | |
| L1/L’1 | 20.1 | 31.1 |
| L2/L’2 | 9.9 | 17.1 |
| L3/L’3 | 9.9 | 10.5 |
| L4/L’4 | 10.3 | 10.9 |
| U1/U’1 | 2.7 | 3.1 |
| U2/U’2 | 3.6 | 7.3 |
| U3/U’3 | 13.7 | 10.4 |
| U4/U’4 | 7.4 | 11.3 |
| U5/U’5 | 12.2 | 4.2 |
Table 2.
Free energies of adsorption for calcium and phosphate ions at the aqueous-brushite {010} interface relative to bulk solution. Heights above the surface are given relative to the first layer of Ca ions.
Table 2.
Free energies of adsorption for calcium and phosphate ions at the aqueous-brushite {010} interface relative to bulk solution. Heights above the surface are given relative to the first layer of Ca ions.
| Ion | Height of Minimum (Å) | G (kJ/mol) |
|---|---|---|
| Ca | 5.60 | 0.96 |
| PO | 5.99 | 8.52 |
| HPO | 4.82 | −3.81 |
| HPO | 4.18 | −13.13 |
© 2018 by the authors. Licensee MDPI, Basel, Switzerland. This article is an open access article distributed under the terms and conditions of the Creative Commons Attribution (CC BY) license (http://creativecommons.org/licenses/by/4.0/).
Share and Cite
MDPI and ACS Style
Garcia, N.A.; Raiteri, P.; Vlieg, E.; Gale, J.D. Water Structure, Dynamics and Ion Adsorption at the Aqueous {010} Brushite Surface. Minerals 2018, 8, 334. https://doi.org/10.3390/min8080334
AMA Style
Garcia NA, Raiteri P, Vlieg E, Gale JD. Water Structure, Dynamics and Ion Adsorption at the Aqueous {010} Brushite Surface. Minerals. 2018; 8(8):334. https://doi.org/10.3390/min8080334
Chicago/Turabian StyleGarcia, Natalya A., Paolo Raiteri, Elias Vlieg, and Julian D. Gale. 2018. "Water Structure, Dynamics and Ion Adsorption at the Aqueous {010} Brushite Surface" Minerals 8, no. 8: 334. https://doi.org/10.3390/min8080334
Note that from the first issue of 2016, this journal uses article numbers instead of page numbers. See further details here.