Effects of Xanthate on Flotation Kinetics of Chalcopyrite and Talc


1
College of Resources & Civil Engineering, Northeastern University, Shenyang 110819, China
2
College of Mining Engineering, North China University of Science and Technology, Tangshan 063210, China
*
Author to whom correspondence should be addressed.
Minerals 2018, 8(9), 369; https://doi.org/10.3390/min8090369
Submission received: 19 June 2018
/
Revised: 26 July 2018
/
Accepted: 16 August 2018
/
Published: 25 August 2018
(This article belongs to the Special Issue Applications of Atomic Force Microscopy in Mineral Flotation)
Abstract
:This paper investigated the effects of using or not using potassium butyl xanthate (PBX) as a collector on the flotation kinetics of talc and chalcopyrite. By means of atomic force microscopy (AFM), Fourier-transform infrared spectroscopy (FTIR), a contact angle measuring instrument and particle size analyzer, the underlying causes behind the flotation rate changes of talc and chalcopyrite are analyzed. Experimental results showed that in collectorless flotation, the law of change in the flotation rate constant (k) of the two minerals over time is independent of pH, and k values of chalcopyrite are much smaller than those of talc. In the presence of PBX, the flotation speed of chalcopyrite greatly increases, and the k values of chalcopyrite are far larger than those of talc. This is mainly because the amount of xanthate adsorbed on the surface of chalcopyrite is large and the adsorption is in the form of chemisorption, while the adsorption of xanthate on the talcum surface is in very small amounts and in the form of physical adsorption. Simulation results indicated that the collectorless flotation of chalcopyrite conform to the classical first-order kinetics model and the Kelsall model, whereas that of talc only conform to the latter, which is due to the layered structure of talc. In the presence of the collector, talc flotation conforms to the two model, because talc has a higher floatability and particle morphology has less influence on the flotation rate.
1. Introduction
Chalcopyrite exhibits good performances in self-induced, collector-induced and sulfur-induced flotation in a wide range of pulp pH values and electric potentials. Serpentine copper bearing ore is generally considered as the most refractory type in various chalcopyrite ores, which is predominantly due to the fact that it includes talc [1]. As a nonpolar layered silicate mineral, talc is usually associated with nonferrous metal sulfide ores [2]. In practical flotation, talc is readily reported in the concentrate launder because of good native floatability, and simultaneously tends to be coated on valuable minerals as slimes due to always being in an extremely fine state, both of which are detrimental to concentrate quality and flotation behaviors [3]. There are two approaches to enhance the flotation efficiency of such chalcopyrite ore: one is floating the floatable talc preferentially, and the other is floating the sulfide minerals by inhibiting the talc in the presence of the sulfide mineral collector [4,5]. However, neither of them could yield the desired separation efficiencies in terms of the fine chalcopyrite ores. Therefore, from the point view of flotation kinetics, this present paper studied differences between the flotation performances of fine chalcopyrite and talc in the absence or presence of a collector.
2. Materials and Methods
2.1. Materials
The chalcopyrite and talc minerals used in the experiments were taken from copper ore deposits of the Donggua Mountain in China. In order to conduct the experiments of the flotation kinetics, the chalcopyrite and talc samples in large bulk were first comminuted in a jaw crusher, subsequently ground in a ceramic mill, and then sieved into 5–38 μm size fraction. The chalcopyrite sample was purified by means of hand sorting and electric separation.
Mineralogical composition of ores used in the test was determined using a Rigaku X-ray diffractometer (XRD). As shown in Figure 1, the XRD spectrums of talc and chalcopyrite are free of any other impurity peeks. Chemical analysis conducted on representative samples suggests that chalcopyrite has a purity of 95.70% containing 33.09% Cu, 31.80% S, 31.39% Fe, 0.65% Zn, 0.50% Pb, 0.63% Si, 0.09% Al, and talc has a purity of 97.70% containing 61.94% SiO2, 31.45% MgO, 0.56% Al2O3, 0.05% CaO.
Particle size composition was analyzed with a Malvern MS2000 laser particle size analyzer, and in the measurement, ethyl alcohol was employed as a dispersant to disperse the talc sample thoroughly. The particle size distribution is shown in Figure 2. According to Figure 2, particle size compositions of talc and chalcopyrite are similar to each other, wherein the mean particle sizes of talc and chalcopyrite are 24.273 μm and 25.762 μm respectively, and median particle sizes are 20.440 μm and 20.200 μm respectively. According to the contact angle measurement results, the contact angles of bedding plane and fault plane of talc are 74° and 52° respectively, and the contact angle of chalcopyrite is 61°.
In this test, deionized water with a resistivity of 18 MΩ was utilized for preparation of all required solutions and pulps. Potassium butyl xanthate (PBX) and methyl iso butyl carbinol (MIBC) were used as collector and frother, respectively, and the pH value of the pulps were adjusted by hydrochloric acid (HCl) and sodium hydroxide (NaOH).
2.2. Flotation Test
Before the flotation experiment began, the chalcopyrite sample was added into a beaker with 30 mL of deionized water and cleaned in an ultrasonic bath for 5 min. Subsequently the suspension liquid was kept static for 3 min, and then the supernatant liquid was collected and dried at 95 °C. The dry product was weighed in the calculation of the chalcopyrite recovery.
Batch flotation experiments were carried out on the cleaned chalcopyrite and talc samples in a XFG-II50 flotation cell (Jilin Exploration Machinery Plant, Changchun, China) at a solid concentration of around 8% with the impeller speed of 1950 r/min. In collectorless flotation, samples were firstly added to the cell and stirred for 1min, and then hydrochloric acid and sodium hydroxide were added to adjust the pH value of pulp, after which the pulp was stirred for 2 min. The quantity of pulp was maintained at 25 mL with an intermittent addition of deionized water. Since the air was introduced into the cell, the froth products have been collected at intervals of 1, 4, 5, 5, 5, 5, and 15 min throughout the 40 min-flotation. The obtained concentrate and tailing samples were dried and weighed to calculate the recoveries of the chalcopyrite or the talc, respectively. In the flotation with the utilization of PBX, samples were firstly added to the cell and stirred for 1 min, and then PBX and MIBC were added in subsequence and the pulp was stirred for 2 min after each addition. In consideration of a significantly enhanced flotation rate, the froth products were collected at intervals of 0.33, 0.33, 0.33, 0.5, 0.5, 0.5, 2 min and consequently the total flotation time was cut down to 4.5 min. The collected concentrate and tailing samples were dried and weighed to calculate the recoveries of chalcopyrite or talc, respectively.
2.3. Contact Angle Measurements
An CA100A contact angle measurement instrument (Shanghai Innuo Precision Instruments Co. Ltd, Shanghai, China) was used to determine the contact angles for the mineral samples, and prior to the measurement bulk pure talc and chalcopyrite minerals were selected and polished into smooth tetrahedrons along bedding planes and fault planes through a sampling machine. The contact angles of the mineral surfaces were measured three times then averaged respectively by dropping a certain volume of deionized water onto the nearly flat mineral surface.
2.4. Fourier-Transform Infrared Spectroscopy Measurements
Fourier-Transform Infrared Spectroscopy (FTIR) was used to illustrate the structure of PBX as well as to study the adsorption of PBX onto the mineral surfaces. The IR spectrum tests were conducted using a 380 FTIR (NICOLET, Townsend, MA, USA). FTIR grade KBr powder was used to obtain the background spectrum. To investigate PBX adsorption onto the mineral surfaces, −2 μm mineral particles were added into the PBX solution. The mineral suspension was continuously shaken for 5 min. The treated mineral particles were then filtered and washed 2 times with deionized water to eliminate the influence of nonadsorbed or weakly adsorbed PBX. After filtration, the solids were dried in a vacuum drying oven. The PBX samples, treated and untreated minerals powders, were hand mixed with KBr powder respectively with an agate mortar/pestle, and the IR spectrum of PBX, untreated, and treated minerals were obtained against the KBr background.
2.5. Atomic Force Microscope Imaging
Atomic force microscopy (AFM) has matured to an indispensable tool to characterize nanomaterials in colloid and interface science [6]. In this test, AFM (Multimode 8, BRUKER, Billerica, MA, USA) was imaged the surface topography of minerals at nanometer resolution before and after PBX treatment was examined by atomic force microscopy in the Scanasyst mode, which can provide information of PBX adsorption on mineral surfaces such as polymer surface coverage. The surface was scanned in the ambient air at an average temperature of 20.0 ± 2.0 °C using a Si3N4 gold-coated cantilever (SN-AF 01-S-NT, Epolead Service Inc., Tokyo, Japan) with a spring constant of 0.08 N/m and a resonance frequency of 34 kHz. The polished mineral sample was immersed in the PBX solution for 3 min. Following the sample treatment, the mineral surface was dried and scanned.
3. Results and Discussion
3.1. Flotation Rate Constant of Mineral and Its Distribution
The feasibility of the bubble-particle mineralization process is reflected in the mineralized bubble rising velocity with respect to time, thus it can be represented by the flotation rate constant k [7]. This present paper figures out the k1, k2, …, ki corresponding to time interval Δt1, Δt2, …, Δti by assuming that the flotation process of mineral conforms to the classical first-order kinetics equation and flotation rate constant k is invariable at a short time interval Δt. The average flotation rate constant k is calculated with the weighted average method according to Equation (1) [8].
where refers to the statistical average value, refers to k of minerals at time interval i, εi refers to flotation recovery of minerals at time interval i.
Under conditions of varying pH values and dosages of collector, flotation rate constants of talc and chalcopyrite at different flotation time intervals are calculated with Equation (1) and the calculations are shown in Table 1. Effects of flotation conditions on and cumulative recovery are shown in Figure 3, where “Chalcopyrite-K”, “Talc-K”, “Chalcopyrite-R”, and “Talc-R” represent and cumulative recovery R of chalcopyrite and talc, respectively. In the absence of collector, the flotation rate constant distribution [8] of chalcopyrite and talc under conditions of the pH values of natural pulps is also shown in Figure 3.
As seen from Table 1, the variation regularity in k values of the two minerals over time is independent of pH, and k values of talc continually decrease with increasing flotation time whereas k values of chalcopyrite fluctuate over, as shown in Figure 3a. In terms of single minerals, flotation recovery and value is found to change in the same way with increasing pH value. It comes to a similar conclusion in Figure 3b, that in the presence of xanthate, the flotation recovery and value of both talc and chalcopyrite roughly follow the same variation trend with an increasing dosage of collector.
In the collectorless flotation, under conditions of experimental pH values, all values of chalcopyrite (0.021 min−1 to 0.061 min−1) are lower than those of talc (0.177 min−1~0.29 min−1), and individual cumulative recoveries of chalcopyrite (50.92%~79.54%) are higher than those of talc (72.55%~85.78%). In the presence of collector, values and cumulative recoveries of both chalcopyrite and talc increase, and all values of chalcopyrite (1.270 min−1 to 1.859 min−1) are considerably higher than those of talc (0.362 min−1~0.715 min−1) and individual cumulative recoveries of chalcopyrite (89.23%~97.39%) are lower than those of talc (69.01%~94.64%). Both cumulative recovery and values of talc increase with increasing dosage of xanthate, and for chalcopyrite, cumulative recovery increases with an increasing dosage of xanthate, while values increase progressively with an increasing dosage of xanthate up to 40 mg/L, at which point the maximum value is obtained. Thereafter they have unnoticeable changes with further increase in the dosage of the collector. Therefore, analyses were carried out on flotation rate constants of the two minerals at the pH values of natural pulp.
According to Table 1, in the absence of xanthate, when floated for 1 min, k value of talc (0.374 min−1) is around 60 times that of chalcopyrite (0.006 min−1), whereas k values of talc and chalcopyrite are near to each other after floating for 5 min. In the presence of xanthate, k values of talc fluctuate within a range with increasing flotation time up to 2.5 min (i.e., in the presence of 100 mg/L of xanthate, k value fluctuates between 0.701 min−1 and 0.425 min−1) and decrease obviously thereafter, whereas overall the k values of chalcopyrite decrease gradually (i.e., in the presence of 40 mg/L of xanthate, k value decreases from 2.427 min−1 to 0.137 min−1) with increasing time.
When two minerals have a cumulative recovery up to 94%, 40 mg/L and 120 mg/L of collector are required for chalcopyrite and talc respectively, and a value of chalcopyrite (1.873 min−1) is considerably higher than that of talc (0.715 min−1), despite the similar flotation recovery. It can be seen that compared to talc, a dosage of PBX has much greater effects on the floatability of chalcopyrite.
In the presence of 40 mg/L of collector, it is found that the value of talc increases by 1.5 times from 0.184 min−1 (pH 8.0, collectorless) to 0.464 min−1, while k value of chalcopyrite increases by 57 times from 0.032 min−1 (pH 5.0, collectorless) to 1.873 min−1. Since interaction between xanthate and chalcopyrite is chemisorption considerably stronger than physisorption between xanthate and talc, the superficial hydrophobicity of chalcopyrite is obviously higher than that of talc. As the flotation rates of chalcopyrite increase much more, it may be because the induction period in the particle-bubble attachment and probability of the particle-bubble detachment of the chalcopyrite are reduced even more.
According to Figure 4, in the absence of collector, at the natural pH of 8.0, k values of talc have a wider distribution, which are roughly classified into 0.21 min−1~0.4 min−1 (53.84%) and less than 0.21 min−1 (46.16%). Whereas at the natural pH of 5.0, k values of chalcopyrite have a narrower distribution, which are mostly less than 0.024 min−1 (93.95%). Therefore, k values of talc and chalcopyrite can be divided into two parts and one part respectively.
3.2. Flotation Kinetics Simulations
In essence, the flotation of mineral particles refers to a process where intervening liquid film between mineral and bubble is thinned then ruptured to eventually form a three-phase contact line (solid, gas and liquid) and mineral-bubble attachment [9,10]. The kinetics equation for the flotation process is highly complex and the flotation rate constant k is dependent on several factors including particle size distribution, morphology, and the flotation environment, etc. [11,12,13]. The classical first-order kinetics model provides a path way for the prediction of the flotation process and is the most widely used in the literature. Due to heterogeneity, the mineral particles exhibit various flotation behaviors, which usually leads to a deviation between the modeling predictions and experimental data. Therefore, distributed flotation kinetics models have been developed on the basis of a classical first-order kinetics model [14]. In the virtual research of distributed flotation kinetics models, mineral particles are generally classified into fast and slow floating components, which in fact is modelled with fast and slow floating components, namely the Kelsall model. Asghar Azizi et al. [15] found that among four conventional first-order flotation kinetics models, the perfectly mixed reactor model and the Kelsall model gave the best and the weakest fit to the experimental data of the Sarcheshmeh porphyry copper sulfide ore, respectively. However, Ofori Phili et al. [6] proposed that a distributed flotation kinetic model provided an adequate fit to the flotation process of coal particles in different size and composition classes, and Junwang Li et al. [16] found that the flotation process of galena and pyrite from Huize lead-zinc sulfide ores deposits could be simulated by a model with fast and slow floating components.
In the present paper, the classical first-order kinetics model and Kelsall model are adopted to simulate the flotation process of talc and chalcopyrite in fine size and narrow size fractions, based on the above-mentioned distribution characteristics of their k values.
Classical first-order kinetics model:
where ε and is flotation recovery and ultimate recovery, respectively.
Distributed flotation kinetics model:
where is the mass fraction of the component j in size fraction i, and are the flotation rate constant and ultimate recovery of component j in size fraction i, respectively. Furthermore, n and l refer to the number of particle size fractions and components, respectively.
Kelsall model (Model with fast and slow floating components) D1:
where and represent the overall maximum recovery and maximum recovery of the fast-floating component, respectively. The maximum recovery of the slow floating component is equal to minus . and are the flotation rate constants of the fast and slow floating components (min−1), respectively.
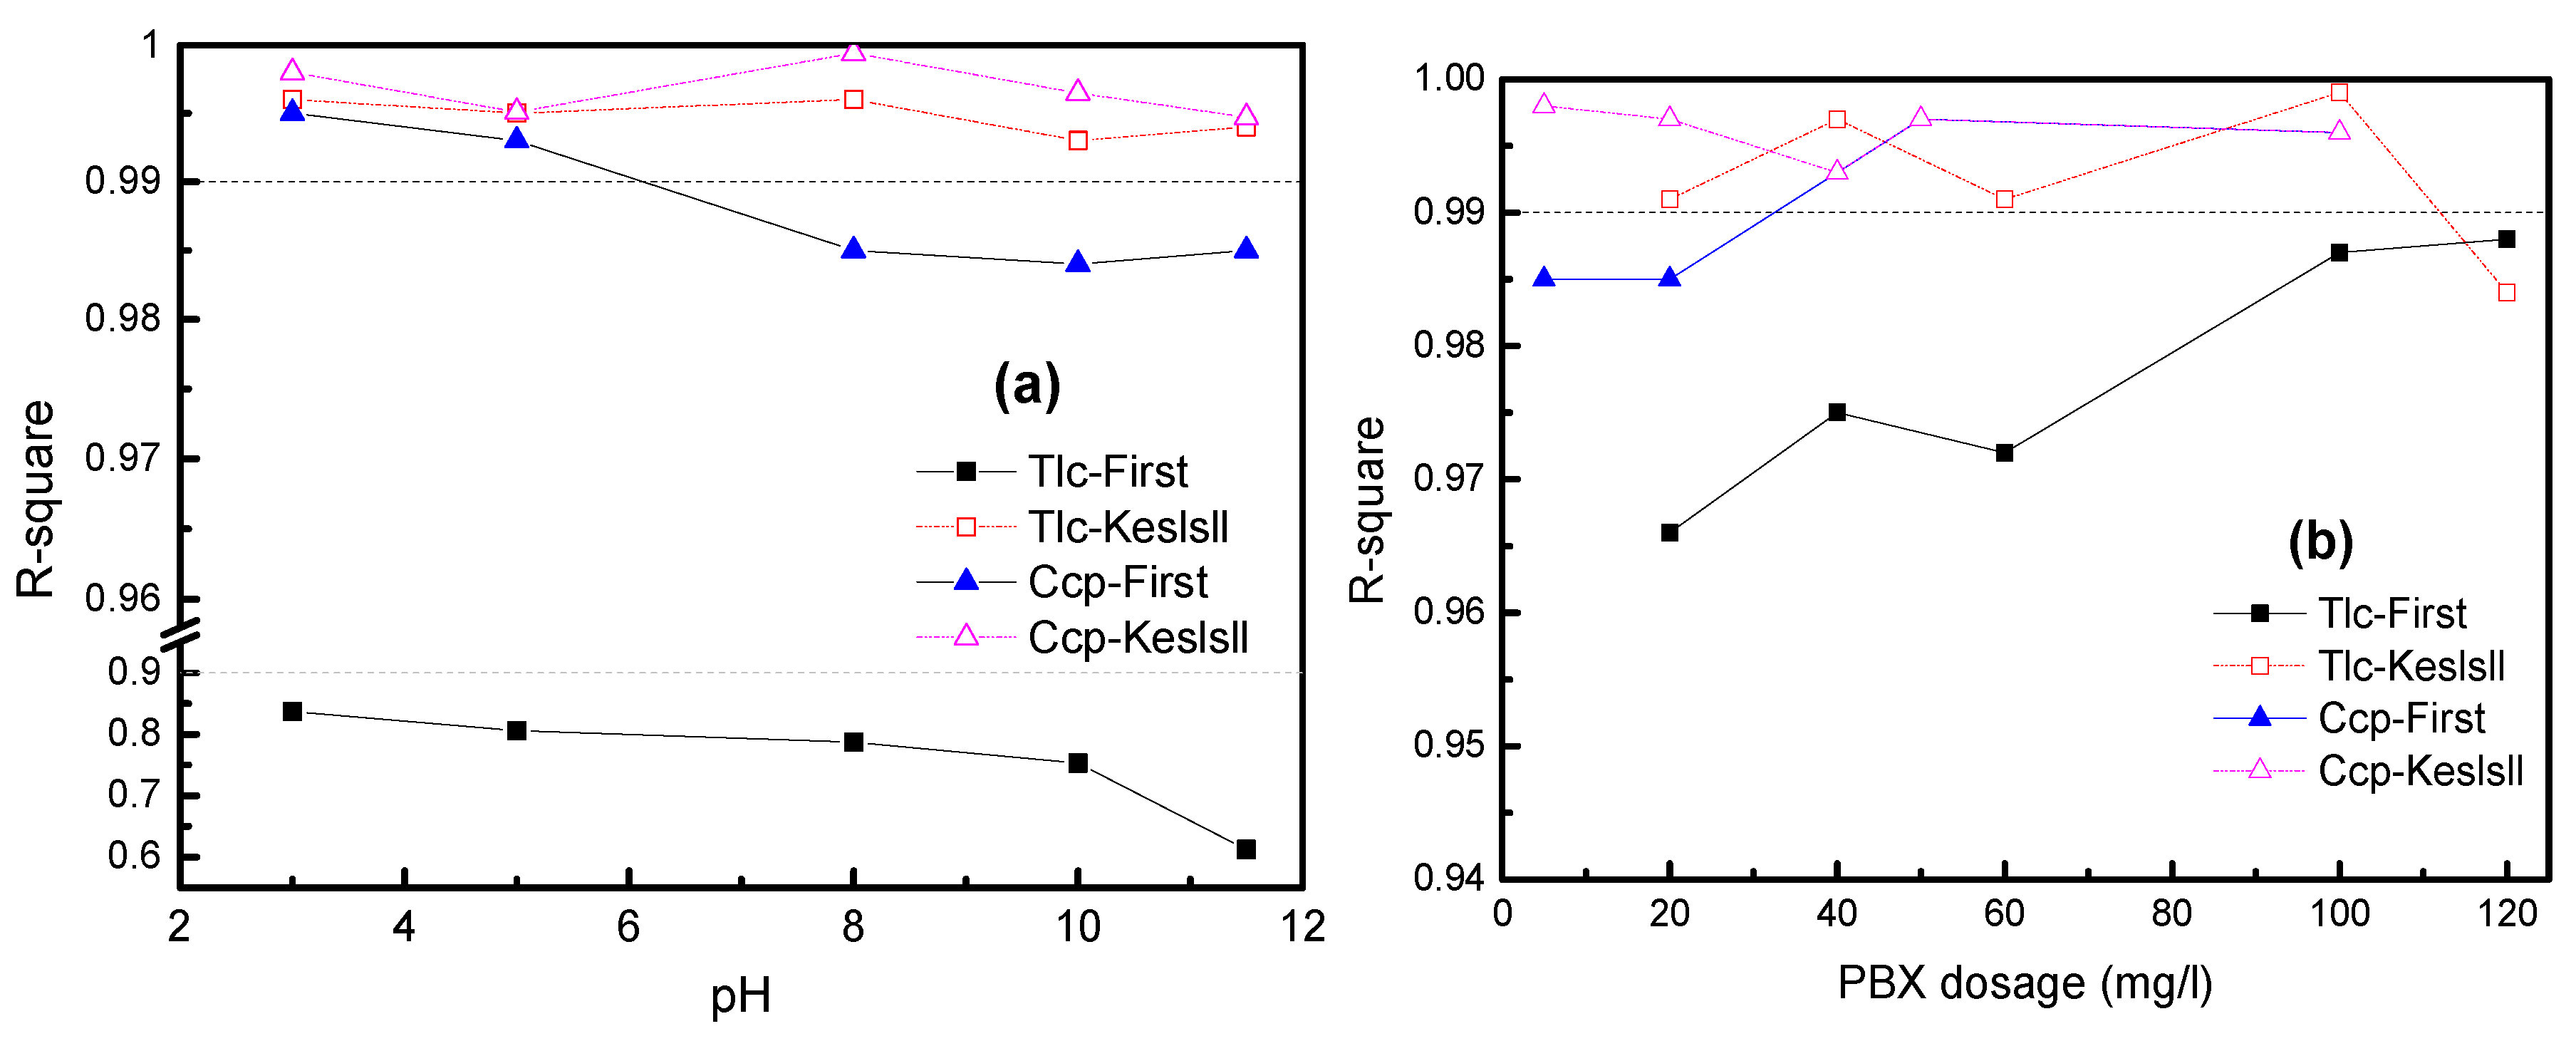
In the absence or presence of collector, flotation processes of talc and chalcopyrite are simulated with flotation kinetics models under conditions of different pH values or dosages of PBX, and the R-square of the kinetics simulation are shown in Figure 5. The flotation rate of the kinetics simulation calculated with MATLAB (MathWorks, Natick, MA, USA) multiple nonlinear regress method is shown in Table 2.
As seen from Figure 5a and Table 2, at experimental pH values, the collectorless flotation processes of chalcopyrite all conform to the first-order and Kelsall model with R-square more than 0.984 and 0.992 respectively, and are similar to the corresponding k of the first-order model with all more than 97.70%. It can be noticed that the fast-floating component with all less than 2.30% can be neglected, and that is why collectorless flotation processes of chalcopyrite fit to the first-order model. In addition, the values are significantly higher than practical values, which might be caused by operational or iterative errors.
As for talc, the R-square of the first-order and Kelsall kinetics simulation are between 0.60 and 0.85 and more than 0.99 respectively, so collectorless flotation processes only conform to the latter. Considering that vary from 30.24% to 46.74% and all (more than 0.694 min−1) are far higher than (less than 0.037 min−1), neither of the two components can be neglected or coalesced. Therefore, the collectorless flotation processes of talc are in poor agreement with the first-order model.
As seen from Figure 5b and Table 2, in the presence of the collector, flotation processes of chalcopyrite conform to the first-order and Kelsall model with R-square more than 0.985 and 0.990, respectively. R-square of the first-order model increases slightly with increasing dosage and can reach 0.993 at 40 mg/L. In the Kelsall simulation results, there is no difference between (2.014 min−1) and (2.014 min−1) with a dosage up to 40 mg/L.
As for talc, R-square of the first-order and the Kelsall kinetics simulation are more than 0.966 and 0.984, respectively, so the flotation processes of talc also conform to the two models, and R-square of the first-order model increases slightly with the increasing dosage of collector. In the Kelsall simulation results, increases gradually with increasing dosage and and is also identical to at 120 mg/L.
Although the Kelsall model can simulate the flotation process of talc and chalcopyrite and predict the flotation recovery at a given flotation time appropriately, on account of varying percentages for minerals floated with different flotation rates, it cannot reflect the flotation rate directly. That is to say, in practical application, the Kelsall model cannot be used to compare the flotation rates of minerals but to simulate the flotation process. Therefore, a fractional order equation has been considered for flotation kinetics simulation, e.g., Vinnett L et al., who adopted fractional calculus to describe batch kinetic characterization of copper and molybdenum [17].
It is widely known that the narrower size fraction the floated pure minerals have, the closer their floatability will be, until each of them has identical floatability. Therefore, the flotation process of mineral particles in adequately narrow size fractions should be in good agreement with the classical first-order kinetics equation. However, in this paper, even though two minerals have similar particle size compositions (as seen in Figure 1), the collectorless flotation process of chalcopyrite, rather than talc, is found to conform to the classical first-order kinetics model. Therefore, aside from size composition, the morphology of the particle also has a certain effect on the flotation kinetics parameters of the minerals.
3.3. Infrared Spectroscopy
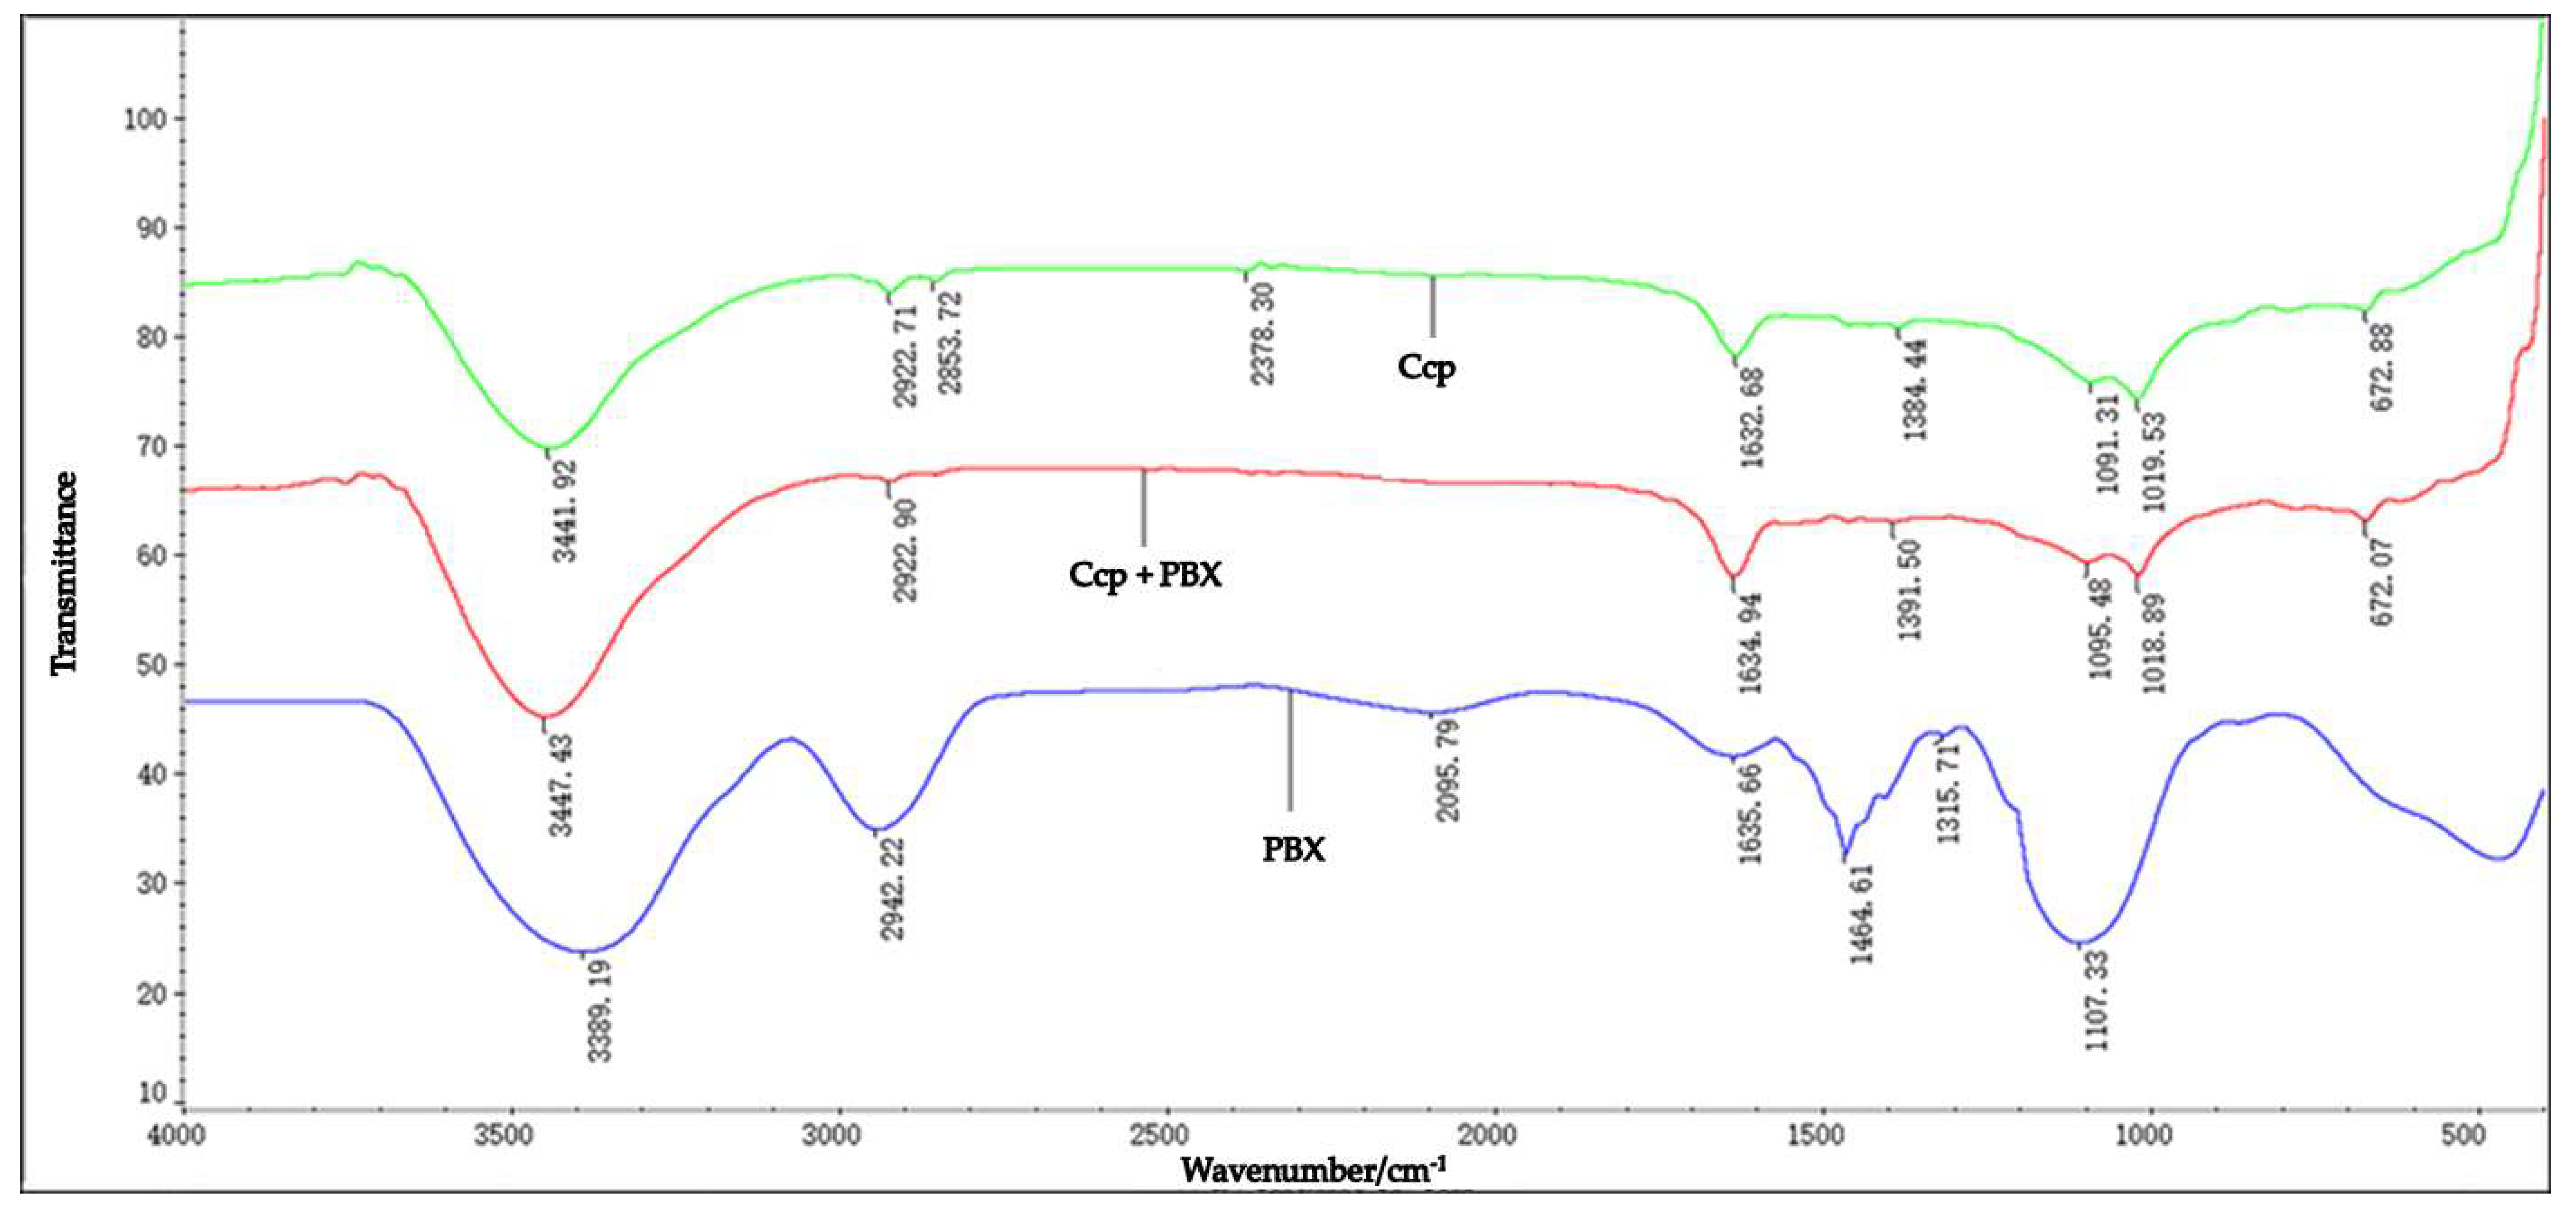
The infrared spectra of talc before and after treatment with 50 mg/L PBX at the pH value of the natural pulp are shown in Figure 6, together with the spectrum of PBX.
Figure 6 shows that after talc was treated with PBX, a new peak appeared at 3447.87 cm−1 and a left shift occurred, which corresponded to a shift in the antisymmetric stretching peak of NH2 in PBX at 3389.19 cm−1, indicating that PBX may be adsorbed on the surface of talc. The results also showed that the peaks at 2942.22 cm−1, 2095.79 cm−1, 1635.66 cm−1, 1464.61 cm−1, and 1315.71 cm−1 disappeared in the IR spectrum of the xanthate, corresponding to the antisymmetric expansion peaks of CH2 and R–C≡C stretching vibration, asymmetrical angle change, CH2 variable angle vibration, and C–O–C asymmetric stretching vibration, but there is no obvious change in the infrared spectrum of talc after adding xanthate, suggesting that the interactions between talc and xanthate are relatively weak.
The Infrared spectra of chalcopyrite before and after being treated with 50 mg/L PBX at the pH value of nature pulp are shown in Figure 7, together with the spectrum of PBX. The figure showed that the peaks at 2378.30 cm−1 and 2853.72 cm−1 had disappeared after the action of chalcopyrite and PBX, corresponding to the CO2 antisymmetric stretching peak and methylene stretching vibration peak in the infrared spectra of chalcopyrite, respectively. The results also show that the peak at 1391.50 cm−1 shifted left, corresponding to the 1384.44 cm−1 symmetrical stretching peak in the chalcopyrite, indicating that PBX was adsorbed on the surface of the chalcopyrite by chemisorption.
3.4. Atomic Force Microscope Imaging
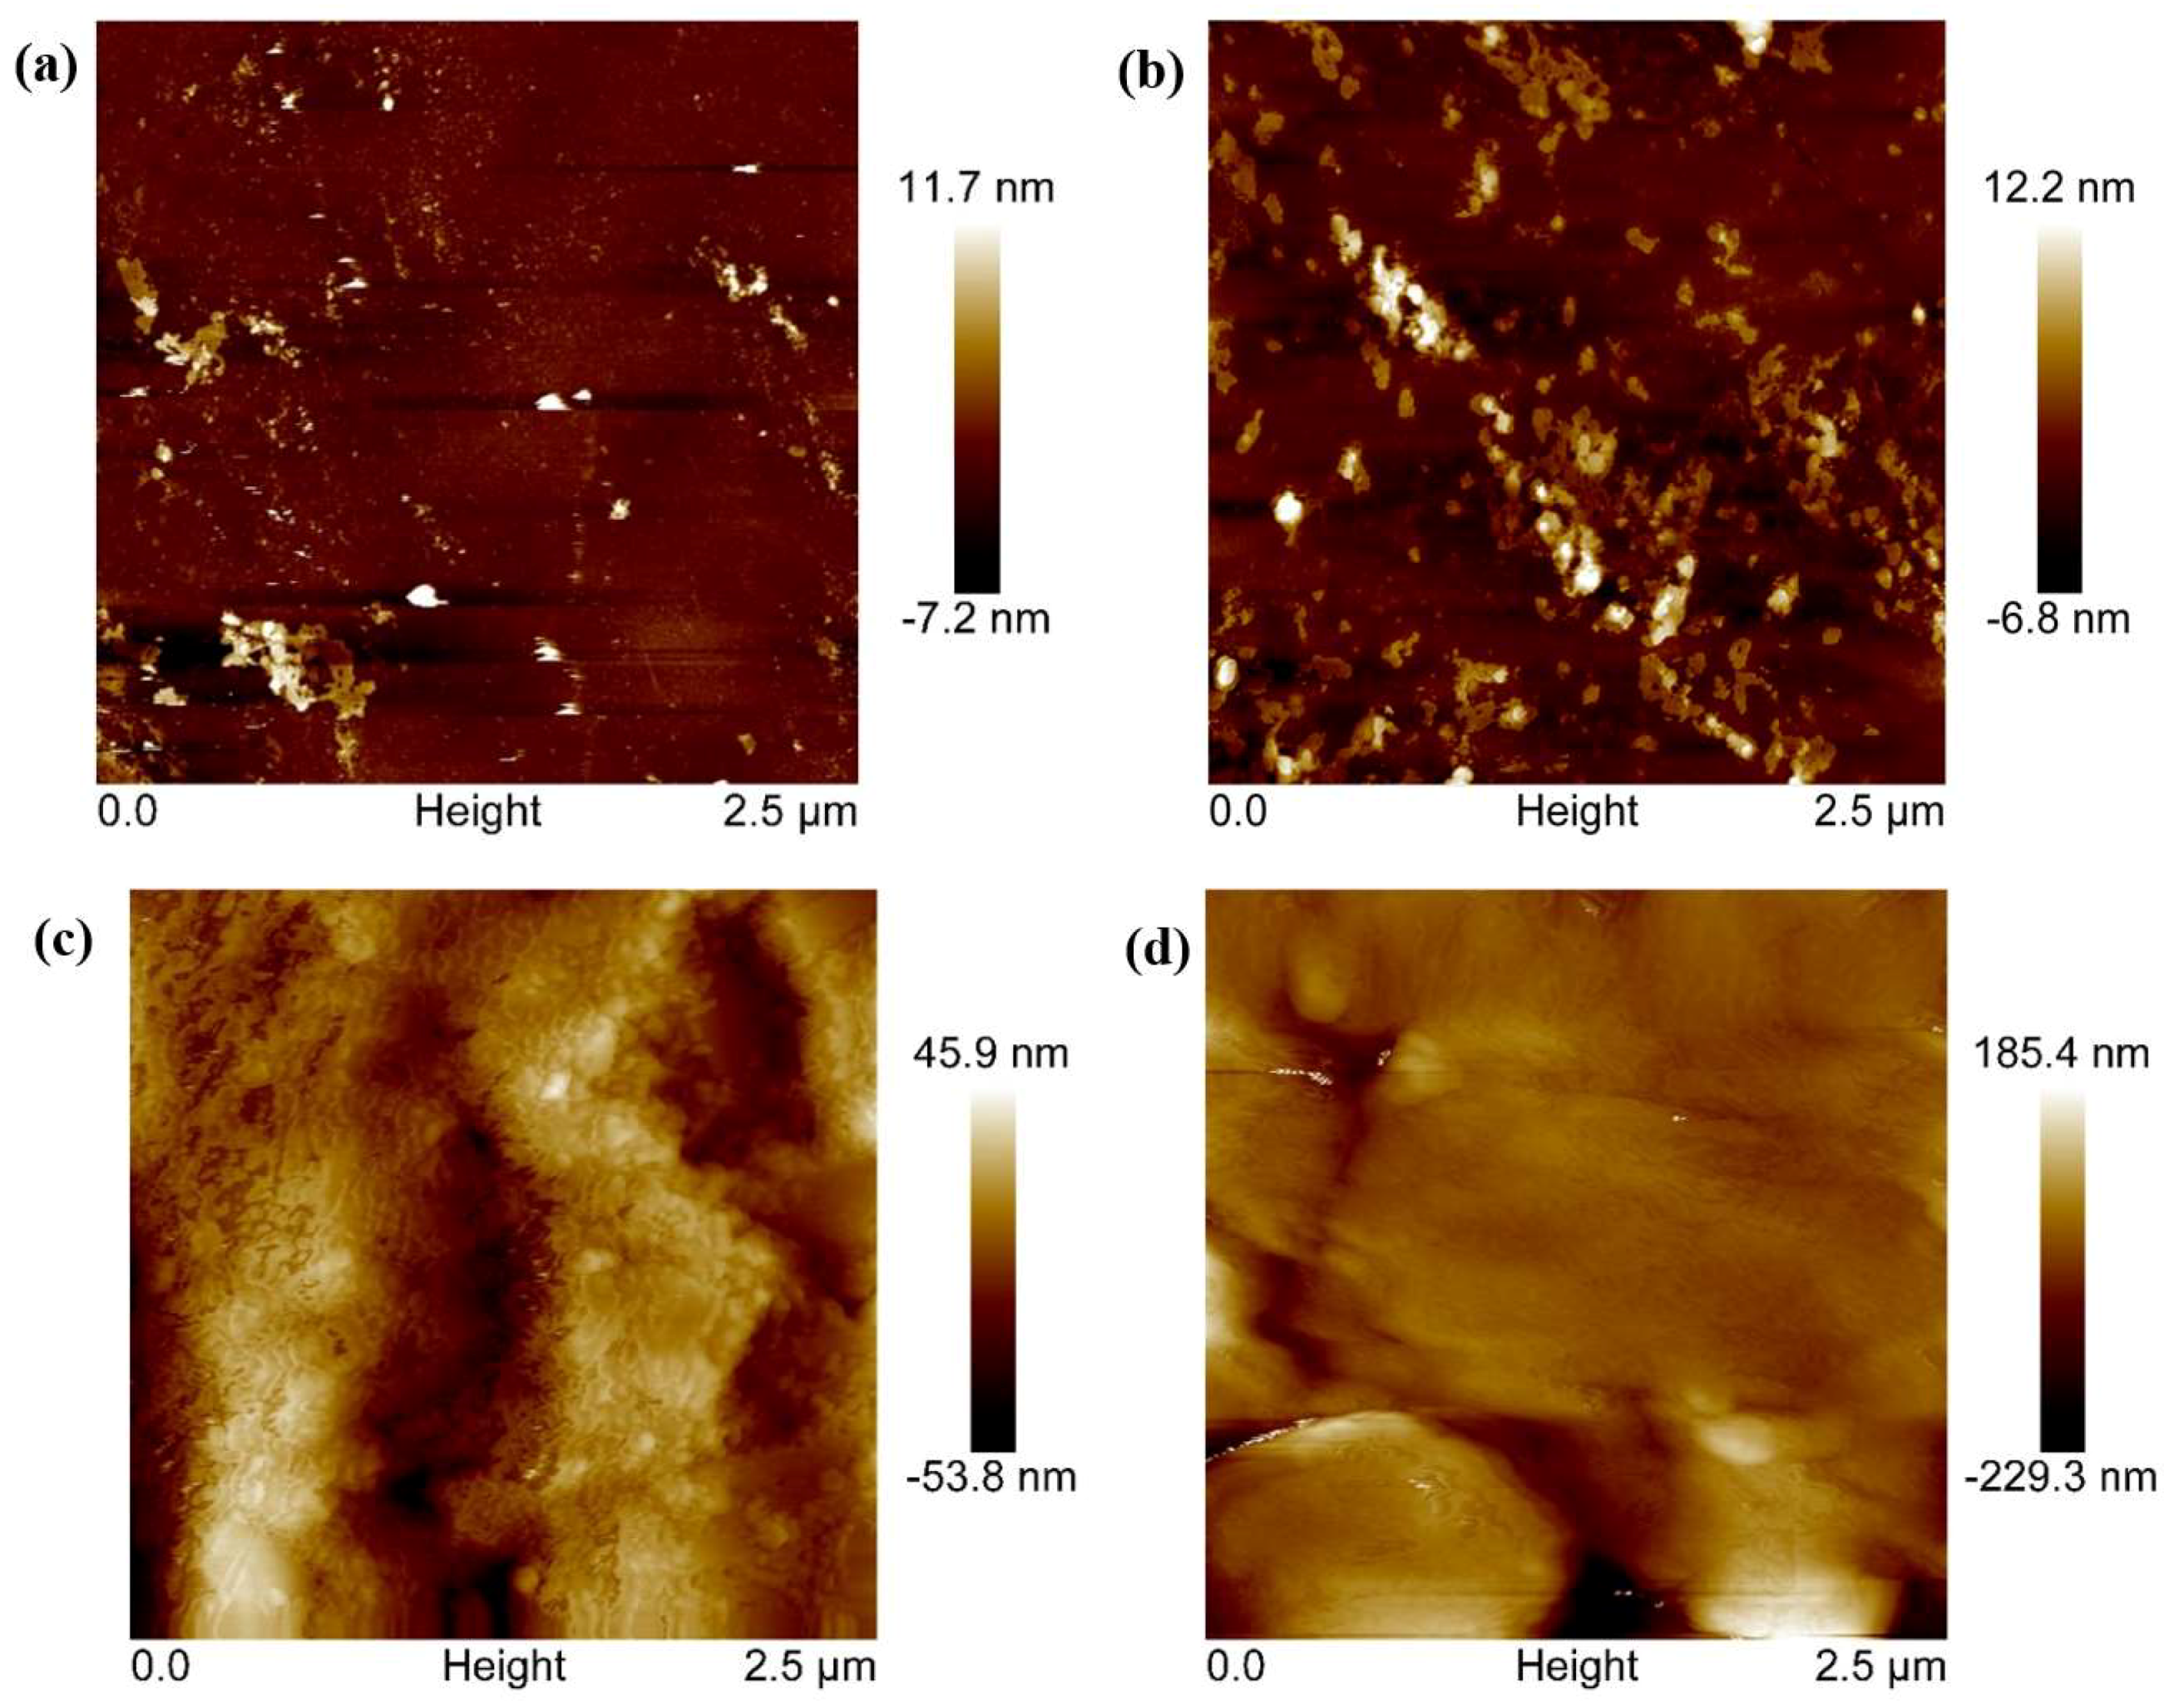
Figure 8 shows the topographic AFM images of the mineral surfaces before and after treatment by PBX solution, respectively. As can be seen from Figure 8a, the surface of freshly cleaved chalcopyrite is cleaner with some scratchers and covered with little bright spots, which may be the oxidation product of the chalcopyrite surface. After treatment with 50 mg/L PBX at the pH values of natural pulp, the surface of chalcopyrite is covered with some bright spots as shown in Figure 8b, which are attributed to PBX adsorption on the surface of the sample.
As shown Figure 8c, the surface of talc is clean at pH 8 with some uniform fine-grained stripes, which are caused by the layered structure of talc, and the surface of talc also have some scratches, seen as valleys, which were caused by the polishing treatment. After being treated with 50 mg/L PBX at the pH value of natural pulp, the surface of talc is still relatively clean, and with some uniform fine-grained stripes and some scratches as shown in Figure 8d. Therefore, the PBX was not absorbed on the surface of talc. In a word, a large amount of PBX was adsorbed on the surface of the chalcopyrite, but little PBX was adsorbed on the surface of the talc.
In general, chalcopyrite particles are in a blocky shape (contact angle of chalcopyrite is 61°), whereas talc particles predominantly consist of a layered structure that leads to different contact angles between the bedding and fault planes (the contact angles of the bedding plane and fault plane of talc are 74° and 52°, respectively). The large proportion of the fault plane renders particles weakly hydrophobic and the flotation rate slowed down, so particles with different proportions of bedding and fault planes have diverse flotation performances. Thus, it can conclude that the collectorless flotation process of talc not fitting to the classical first-order kinetics model should be attributed to the morphological characteristics, instead of particle size distribution of talc. Behzad Vaziri Hassas [18], David I. Verrelli [19] and T.G.Vizcarra et al. [20] also considered that the morphology had an effect on the flotation rate performance.
In the presence of the collector, chalcopyrite and talc possesses stronger hydrophobicity, and the flotation rates of both of them are improved (particularly chalcopyrite), and thereby the flotation processes of them (emphasizing on talc) better fit the classical first-order kinetics model. Therefore, it can be found that morphology exerts less influence on the flotation performance of particles with high floatability. T.G. Vizcarra et al. [20], by comparing the flotation experiments in the presence or absence of the collector, also found that the particle shape properties were significant only for weakly hydrophobic minerals, and when particle floatability was high, shape properties were not found to contribute significantly to the flotation rate. S. Farrokhpay et al. [21] found that talc particles moved to the froth phase and therefore affected the froth stability in the presence of xanthate. The interaction between xanthate and tacl is physisorption, and the xanthate has a strong collecting effect on the talc. With the addition of xanthate, the flotation speed of chalcopyrite greatly increases, while an increase in the flotation speed of talc is relatively low compared to chalcopyrite. In addition, the flotation speed of chalcopyrite is much higher than that of the talc.
This is mainly because the amount of xanthate adsorped on the surface of chalcopyrite is large and the adsorption is in the form of chemisorption, while the adsorption of xanthate on the talcum surface is in very small amounts and in the form of physical adsorption.
4. Conclusions
(i) In the absence of xanthate, at experimental pH values, k values of talc have a relatively wide distribution and continually decrease over time, whereas k values of chalcopyrite fluctuate in a relatively narrow distribution with increasing flotation time. In terms of single minerals, flotation recovery and roughly follow the same variation trend whether with increasing pH value or dosage of a collector. In collectorless flotation, all values of chalcopyrite are lower than those of talc, but in the presence of collector, all values of chalcopyrite are considerably higher than those of talc. According to the examination of AFM and FTIR, the reason is that interactions of PBX with talc and chalcopyrite are physisorption and chemisorption, respectively.
(ii) In this present experiment, particle size compositions of talc and chalcopyrite are similar to each other. In the absence of collector, flotation processes of chalcopyrite conform to the first-order and Kelsall model, whereas talc only conform to the Kelsall model. In the presence of a collector, flotation processes of both minerals conform to the two models. In a practical application, the Kelsall model cannot be used to compare the flotation rates of minerals directly but to simulate the flotation process. Therefore, a more scientific model should be adopted to simulate the flotation process, such as a fractional order kinetics model.
(iii) The collectorless flotation processes of talc not fitting to the classical first-order kinetics model should be attributed to the morphological characteristics (layered structure), instead of the particle size distribution of talc. In the presence of a collector, the flotation processes of talc conform to the first-order model, because the morphology exerts less influence on the flotation performance of particles with high floatability.
Author Contributions
L.B. was responsible for the flotation kinetics calculation and writing this paper; J.L. responsible for flotation kinetics simulations and was the correspondent author; Y.H. carried out supporting experiments, and also gave some advice on the manuscript writing; K.J. conducted AFM and IR tests; W.Z. also gave some advice.
Founding
This work was carried out with funding provided by the National Natural Science Foundation of China (51204035 and 51674066).
Conflicts of Interest
The authors declare no conflict of interest.
References
- Lu, S. Research on crystal chemistry of talc and review and application of talc flotation in mineral processing of nonferrous sulphide. Min. Metall. 2010, 24, 517–519. [Google Scholar]
- Yuan, D.; Xie, L.; Shi, X.; Yi, L.; Zhang, G.; Zhang, H.; Liu, Q.; Zeng, H. Selective flotation separation of molybdenite and talc by humic substances. Miner. Eng. 2018, 117, 34–41. [Google Scholar] [CrossRef]
- David, A.B.; Le, H.; Gillian, B.N.; Kaggwa, J.R. The effect of polysaccharides and polyacrylamides on the depression of talc and the flotation of sulphide minerals. Miner. Eng. 2006, 19, 598–608. [Google Scholar]
- David, A.B.; Le, H.; Gillian, B.K.; Ralston, J. Influence of adsorbed polysaccharides and polyacrylamides on talc flotation. Int. J. Miner. Process. 2006, 78, 238–249. [Google Scholar]
- Leung, A.; Wiltshire, J.S.; Blencowe, A.; Fu, Q. The effect of acrylamide-co-vinylpyrrolidinone copolymer on the depression of talc in mixed nickel mineral flotation. Miner. Eng. 2011, 24, 449–454. [Google Scholar] [CrossRef]
- Xing, Y.; Xu, M.; Gui, X.; Cao, Y.; Babel, B.; Rudolph, M.; Weber, S.; Kappl, M.; Butt, H.J. The application of atomic force microscopy in mineral flotation. Adv. Colloid Interface Sci. 2018, 256, 373–392. [Google Scholar] [CrossRef]
- Philip, O.; Graham, O.B.; Hapugoda, P.; Bruce, F. Distributed flotation kinetics models—A new implementation approach for coal flotation. Miner. Eng. 2014, 66, 77–83. [Google Scholar]
- Chen, Z. Study on flotation kinetics II-Recovery for distribution density function of flotation rate constant. Non-Ferr. Met. (Extr. Metall.) 1978, 11, 27–33. [Google Scholar]
- Yalcin, E.; Kelebek, S. Flotation kinetics of a pyritic gold ore. Int. J. Miner. Process. 2011, 98, 48–54. [Google Scholar] [CrossRef]
- Xing, Y.; Gui, X.; Pan, L.; Pinchasik, B.E.; Cao, Y.; Liu, J.; Kappl, M.; Butt, H.-J. Recent experimental advances for understanding bubble-particle attachment in flotation. Adv. Colloid Interface Sci. 2017, 246, 105–132. [Google Scholar] [CrossRef] [PubMed]
- Zhang, H.; Liu, J.; Cao, Y.; Wang, Y. Effects of particle size on lignite reverse flotation kinetics in the presence of sodium chloride. Powder Technol. 2013, 246, 658–663. [Google Scholar] [CrossRef]
- Muganda, S.; Zanin, M.; Grano, S.R. Influence of particle size and contact angle on the flotation of chalcopyrite in a laboratory batch flotation cell. Int. J. Miner. Process. 2011, 98, 150–162. [Google Scholar] [CrossRef]
- Natarajan, R.; Nirdosh, I. Effect of molecular structure on the kinetics of flotation of a Canadian nickel ore by N-arylhydroxamic acids. Int. J. Miner. Process. 2009, 93, 284–288. [Google Scholar] [CrossRef]
- Imauzimi, T.; Inoue, T. Kinetic consideration of froth flotation. In Proceedings of the VI Mineral Processing Congress, Cannes, France, 26 May–2 June 1963; pp. 563–579. [Google Scholar]
- Asghar, A.; Ahmad, H.; Behnam, F. Investigating the first-order flotation kinetics models for Sarcheshmeh copper sulfide ore. Int. J. Min. Sci. Technol. 2015, 25, 849–854. [Google Scholar] [CrossRef]
- Li, J.; Sun, C.; Yuan, C. Study on new technology of asynchronous flotation for Huize lead-zinc sulphide ores. Met. Mine 2011, 425, 88–96. [Google Scholar]
- Vinnett, L.; Alvarez-Silva, M.; Jaques, A.; Hinojosa, F.; Yianatos, J. Batch flotation kinetics: Fractional calculus approach. Miner. Eng. 2015, 77, 167–171. [Google Scholar] [CrossRef]
- Behzad, V.H.; Hidayet, C.; Onur, G.; Fırat, K.; Mustafa, C.; Mehmet, S.C. Effect of roughness and shape factor on flotation characteristics of glass beads. Colloids Surf. A Physicochem. Eng. Asp. 2016, 492, 88–99. [Google Scholar]
- David, I.V.; Warren, J.B.; Peter, T.L.K.; Schwarz, M.P.; Bart, F. Particle shape effects in flotation. Part 1: Microscale experimental observations. Miner. Eng. 2014, 58, 80–89. [Google Scholar]
- Vizcarra, T.G.; Harmer, S.L.; Wightman, E.M.; Johnson, N.W.; Manlapig, E.V. The influence of particle shape properties and associated surface chemistry on the flotation kinetics of chalcopyrite. Miner. Eng. 2011, 24, 807–816. [Google Scholar] [CrossRef]
- Farrokhpay, S.; Ndlovu, B.; Bradshaw, D. Behavior of talc and mica in copper ore flotation. Appl. Clay Sci. 2018, 160, 270–275. [Google Scholar] [CrossRef]
Figure 1.
The X-ray diffraction patterns of talc and chalcopyrite samples.

Figure 2.
The particle size distribution curves of talc and chalcopyrite samples.

Figure 3.
Influence of pH or collector dosage on and R. (a): collectorless, (b): collector.

Figure 4.
Distribution of k values without collector.

Figure 5.
Kinetics simulation on mineral flotation (a): collectorless, (b): collector.

Figure 6.
Infrared spectra of talc before and after treatment with PBX.

Figure 7.
Infrared spectra of chalcopyrite before and after treatment with PBX.

Figure 8.
Atomic force microscopy (AFM) height images of mineral substrates. (a): freshly cleaved chalcopyrite surface, (b): Chalcopyrite surface treated with PBX, (c): freshly cleaved talc surface, (d): talc surface treated with PBX.
Figure 8.
Atomic force microscopy (AFM) height images of mineral substrates. (a): freshly cleaved chalcopyrite surface, (b): Chalcopyrite surface treated with PBX, (c): freshly cleaved talc surface, (d): talc surface treated with PBX.


Table 1.
Flotation rate calculation results of minerals.
| Mineral | Flotation Rate Constant k (min−1) | |||||||||||||||
|---|---|---|---|---|---|---|---|---|---|---|---|---|---|---|---|---|
| In Different pH Value | In Different Dosage of PBX | |||||||||||||||
| pH | min | mg/L | min | |||||||||||||
| 1 | 5 | 10 | 15 | 20 | 25 | 40 | 0.3 | 0.7 | 1 | 1.5 | 2 | 2.5 | 4.5 | |||
| Chalcopyrite | 3 | 0.047 | 0.058 | 0.056 | 0.051 | 0.045 | 0.043 | 0.026 | 5 | 1.635 | 1.384 | 0.945 | 0.626 | 0.439 | 0.307 | 0.099 |
| 5 | 0.006 | 0.023 | 0.039 | 0.039 | 0.036 | 0.034 | 0.012 | 20 | 1.592 | 1.621 | 0.85 | 0.632 | 0.615 | 0.510 | 0.141 | |
| 8 | 0.029 | 0.022 | 0.027 | 0.023 | 0.017 | 0.019 | 0.008 | 40 | 1.594 | 2.427 | 2.126 | 1.041 | 0.518 | 0.387 | 0.137 | |
| 10 | 0.014 | 0.017 | 0.02 | 0.02 | 0.019 | 0.034 | 0.02 | 50 | 1.658 | 2.237 | 1.803 | 1.972 | 1.022 | 1.123 | 0.088 | |
| 11.5 | 0.054 | 0.081 | 0.063 | 0.054 | 0.046 | 0.029 | 0.019 | 100 | 1.786 | 2.272 | 2.250 | 0.717 | 0.482 | 0.644 | 0.393 | |
| Talc | 3 | 0.525 | 0.171 | 0.075 | 0.037 | 0.034 | 0.028 | 0.016 | 20 | 0.700 | 0.391 | 0.217 | 0.296 | 0.397 | 0.483 | 0.074 |
| 5 | 0.382 | 0.138 | 0.057 | 0.044 | 0.027 | 0.025 | 0.014 | 40 | 0.556 | 0.429 | 0.569 | 0.391 | 0.402 | 0.646 | 0.101 | |
| 8 | 0.374 | 0.129 | 0.054 | 0.033 | 0.033 | 0.027 | 0.014 | 60 | 0.347 | 0.684 | 0.793 | 0.456 | 0.487 | 0.387 | 0.103 | |
| 10 | 0.368 | 0.112 | 0.048 | 0.038 | 0.026 | 0.024 | 0.012 | 100 | 0.625 | 0.695 | 0.701 | 0.496 | 0.691 | 0.425 | 0.278 | |
| 11.5 | 0.400 | 0.086 | 0.038 | 0.029 | 0.017 | 0.018 | 0.012 | 150 | 0.762 | 0.724 | 0.89 | 0.708 | 0.857 | 0.602 | 0.345 | |
Table 2.
Kinetics simulation results of talc and chalcopyrite.
| Condition | Value | k of First Model | k of Keslsll Model | ||||||
|---|---|---|---|---|---|---|---|---|---|
| Ccp | Tlc | Ccp | Tlc | ||||||
| kf | ks | kf | ks | ||||||
| pH | 3 | 0.051 | 0.224 | 0.69 | 6.666 | 0.050 | 30.24 | 0.860 | 0.037 |
| 5 | 0.028 | 0.122 | 2.30 | 5.533 | 0.032 | 38.51 | 0.694 | 0.030 | |
| 8 | 0.023 | 0.110 | 1.59 | 5.352 | 0.020 | 40.83 | 0.721 | 0.030 | |
| 10 | 0.019 | 0.095 | 0.90 | 5.509 | 0.021 | 43.99 | 0.774 | 0.027 | |
| 11.5 | 0.064 | 0.076 | 1.02 | 6.753 | 0.063 | 46.74 | 0.979 | 0.021 | |
| Dosage of PBX (mg/L) | 5 | 1.344 | - | 84.26 | 1.764 | 0.107 | - | - | - |
| 20 | 1.478 | 0.322 | 77.59 | 2.073 | 0.366 | 76.60 | 0.541 | 4.6*10−12 | |
| 40 | 2.014 | 0.442 | 94.83 | 2.014 | 2.014 | 84.28 | 0.627 | 5.6*10−10 | |
| 50 | 1.971 | 0.502 | 94.09 | 1.969 | 1.973 | 85.81 | 0.984 | 9.2*10−9 | |
| 100 | 2.100 | 0.621 | 94.90 | 2.100 | 2.101 | 94.08 | 0.690 | 5.6*10−9 | |
| 120 | - | 0.722 | - | - | - | 95.00 | 0.722 | 0.722 | |
© 2018 by the authors. Licensee MDPI, Basel, Switzerland. This article is an open access article distributed under the terms and conditions of the Creative Commons Attribution (CC BY) license (http://creativecommons.org/licenses/by/4.0/).
Share and Cite
MDPI and ACS Style
Bai, L.; Liu, J.; Han, Y.; Jiang, K.; Zhao, W. Effects of Xanthate on Flotation Kinetics of Chalcopyrite and Talc. Minerals 2018, 8, 369. https://doi.org/10.3390/min8090369
AMA Style
Bai L, Liu J, Han Y, Jiang K, Zhao W. Effects of Xanthate on Flotation Kinetics of Chalcopyrite and Talc. Minerals. 2018; 8(9):369. https://doi.org/10.3390/min8090369
Chicago/Turabian StyleBai, Limei, Jie Liu, Yuexin Han, Kai Jiang, and Wenqing Zhao. 2018. "Effects of Xanthate on Flotation Kinetics of Chalcopyrite and Talc" Minerals 8, no. 9: 369. https://doi.org/10.3390/min8090369
Note that from the first issue of 2016, this journal uses article numbers instead of page numbers. See further details here.