Numerical Simulation on Authigenic Barite Formation in Marine Sediments

Key Laboratory of Groundwater Resources and Environment, Ministry of Education, Jilin University, Changchun 130021, China
*
Author to whom correspondence should be addressed.
Minerals 2019, 9(2), 98; https://doi.org/10.3390/min9020098
Submission received: 29 December 2018
/
Revised: 2 February 2019
/
Accepted: 5 February 2019
/
Published: 10 February 2019
(This article belongs to the Special Issue Deep-Sea Minerals and Gas Hydrates)
Abstract
:Submarine cold seep and its associated authigenic minerals in sediment are meaningful to indicate the existence of underlying natural gas hydrate. The anaerobic oxidation of methane (AOM) is coupled with sulfate reduction (SR) and influences the dissolution and precipitation of barite. However, the forming mechanism of barite is not yet clearly understood. In order to investigate the forming process of authigenic barite and its relationship with methane leakage flux, based on the measured data of the Qiongdongnan Basin in the Northern slope of the South China Sea, we constructed a 1D model of a sedimentary column to reproduce the formation of barite using the numerical simulation method. The results show that the original equilibrium of barite was broken by the cold seep fluids and Ba2+ was carried upward to the sulfate-rich zone leading to the formation of barite front. When there is no flux of methane from the bottom of sediment, the barite front disappears. The relationship between methane leakage flux and authigenic minerals was also discussed. It can be concluded that high methane flux corresponds to a shallow barite front in the sediment, furthermore, the barite content first increases and then decreases as the methane flux increases. At the same time, an inverse relationship between the ratio of authigenic barite to calcite and methane flux was obtained.
1. Introduction
Submarine cold seep is one of the most important discoveries in the last 25 years of the 20th century. It is widely distributed in the active and passive continental marine sediment [1,2,3]. A great number of fluids were carried by cold seep from deep sediments, such as water and hydrocarbons generally produced from natural gas hydrate decomposition [4,5,6]. Because of its high energy density and being environmentally friendly, natural gas hydrate was considered to be one of the ideal alternative and clean energies, and it was estimated that it contained two times the total global level of known fossil fuel thermal equivalent and could meet energy needs in 1000 years [7,8]. However, as a stable substance under high pressure and low-temperature conditions, methane hydrate is in a balance with the natural environment. Environmental disturbance often leads to decomposition, causing the release of the methane. The environmental effects related to the decomposition of methane hydrate and its corresponding biogeochemical reactions in marine sediments have undoubtedly become a hot research topic.
A series of biogeochemical reactions take place under the influence of anaerobic microorganisms while methane is transported in the form of the cold seep. The main reaction is the anaerobic oxidation of methane (AOM) coupled with sulfate reduction (SR) [9,10]. The simplified reaction can be expressed as
Relevant studies suggest that the AOM-SR reaction occurs due to the combined actions of anaerobic methanotrophic archaea (ANME) and sulfate-reducing bacteria (SRB). The number of microbial aggregates of ANME and SRB accounts for more than 90% of the total number of microorganisms in cold seep area [11,12,13]. AOM-SR consumes and and changes the chemical conditions of the sediment. The product term alters alkalinity and promotes carbonate precipitation such as calcite. For example, in the hydrate occurrence area of the Black Sea platform, a large number of carbonate rocks samples were obtained through the ODP (Ocean Drilling Program) survey [14]. The main carbonate rock in the hydrate bearing zone of the Gulf of Mexico was calcite [15].
Besides authigenic carbonate rock, which is widespread in the cold seep environment, barite was frequently found in oceanic exploration [16]. Authigenic barite caused by fluid drainage overflow was found in the Peru oceanic crust zone [17], and barite intergrowth with carbonate rock was discovered in the sea of Okhotsk on the Northwestern edge of the Pacific Ocean [18]. Meanwhile, a high content of barite was found in the Qiongdongnan basin on the north continental slope in the South China Sea [19].
A number of research works suggest that the authigenic carbonate rock is probably capable of indicating the leakage of methane cold seep. However, the indication of barite for the leakage of methane cold seep is seldom reported. Some researchers have proposed the preliminary barium circulation process in seafloor sediments based on the measured data of Blake Ridge and the continental slope of the Gulf of Mexico [20,21]. They inferred that it would form a barite front by recording the activity of cold seep fluid [22]. As for morphology of barite, some scanning electron microscope images tell the difference between leaking and non-leaking conditions. The typical barite grains from South Atlantic sediments well-developed smooth crystal planes on ellipsoidal grains, which indicate the barite formed at oceanic setting with no cold seep [23]. As for cold seep leakage, barite crystals show strong dissolution structures caused by cold seep fluids [24]. Recent analysis has suggested that the formation of authigenic barite is due to the interaction between barium carried by cold seep leakage and sulfate in the shallow surface layer of the seafloor [25]. However, the mechanisms of the barite front and its relationship with methane seepage fluid are hardly understood.
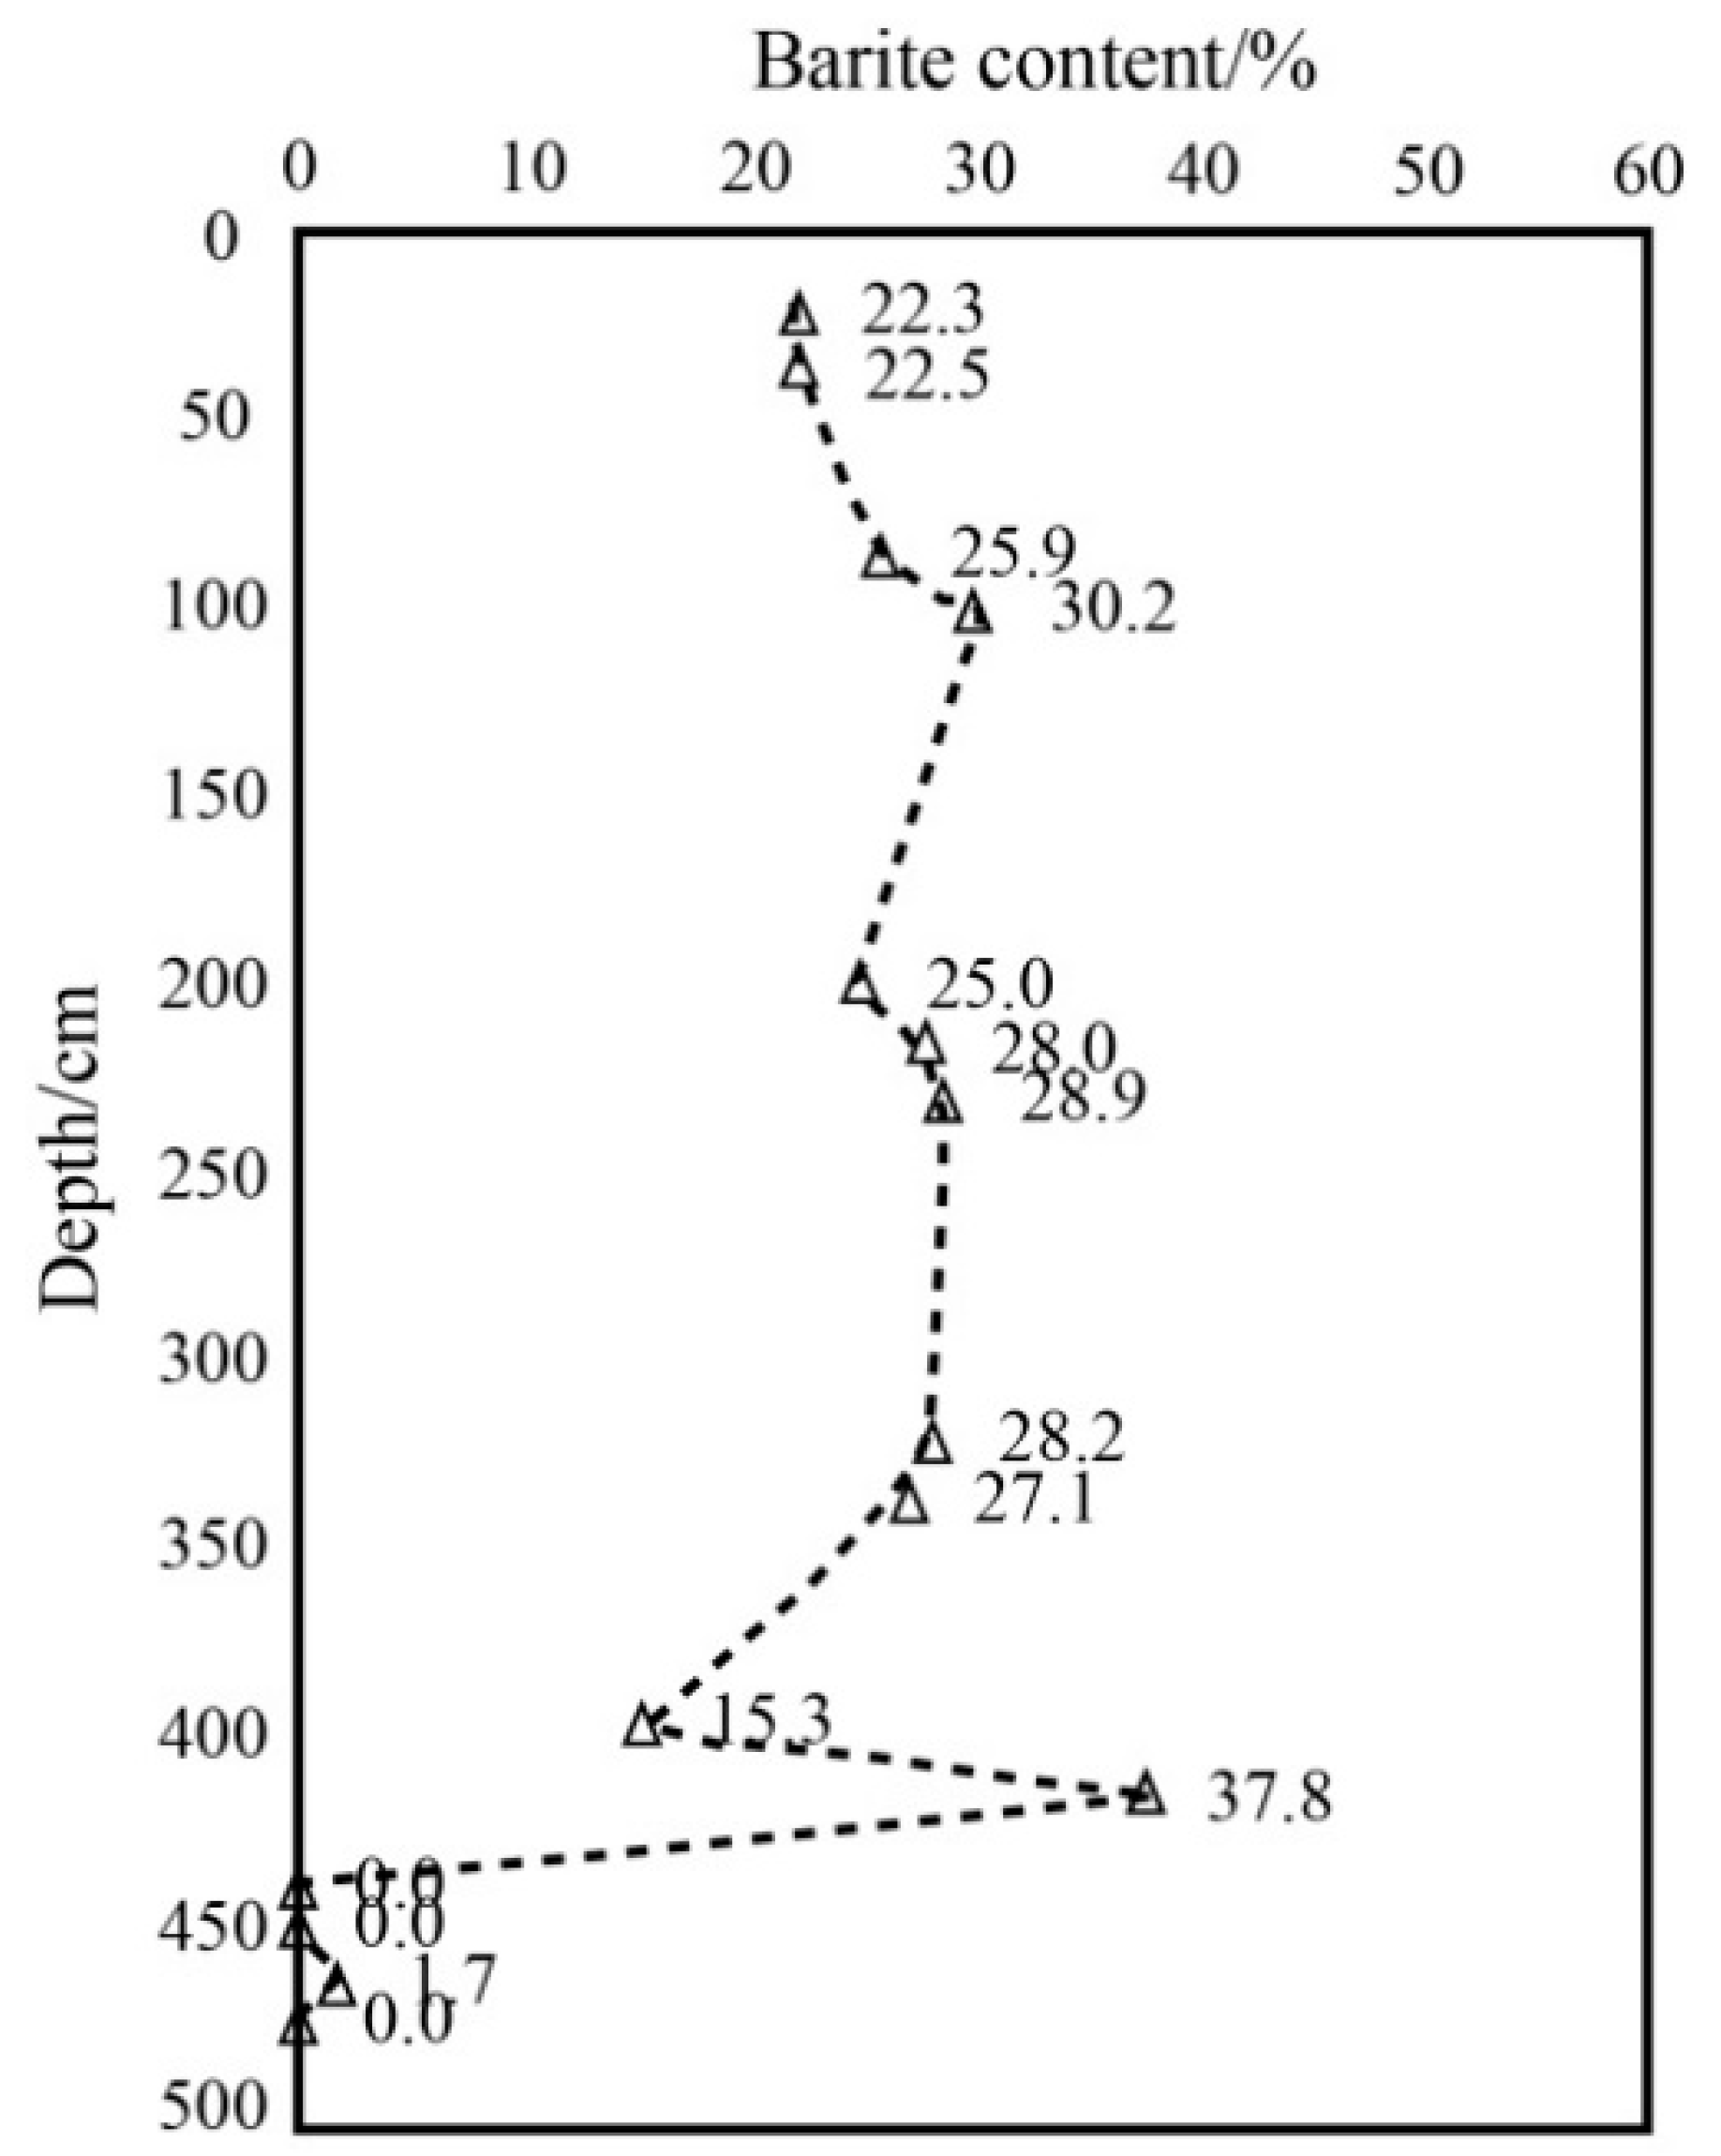
According to the measured data of the T1 sampling station in the Qiongdongnan Basin of the South China Sea, there is a considerable quantity of barite in the marine sediment [26]. The vertical distribution diagram of barite at the station shows that a barite front exists at a depth of 400–450 cm from the sample column (Figure 1). However, the location of the barite front is not near the sulfate–methane transition zone (SMTZ) caused by the AOM-SR, based on the measured sulfate profiles. Therefore, this barite front was probably generated by paleotypal fluid activities, because there are discoveries that more than one front was detected in other borehole explorations [17,20]. Whatever the case, the measured data supported the evidence of a barite front. The relevant reports show that the basin has been operational since the Eocene [27], including a lot of diapirs that are liable to be associated with the cold seep phenomenon. Consequently, the formation process of the barite front probably relates to the activity of cold seep fluid.
The objective of this study is to investigate the processes of barite formation and the corresponding alterations of authigenic minerals through the numerical method.
Based on the measured data of the Qiongdongnan Basin of the Northern slope of the South China Sea, a 1D model is built, and the formation processes of barite and authigenic minerals are firstly discussed. Subsequently, the parameter sensitivity analysis is performed to identify the factors affecting the formation of barite. Thirdly, the relationship between barite formation and methane leakage flux is tentatively regressed. By discussing the above results, several conclusions are finally drawn.
2. Geologic Site Description
Qiongdongnan Basin is located in the north of the South China Sea and at the north of Hainan island and the Xisha islands, distributed along the NE direction, covering a sea area of 6 × 10⁴ km2 and a basin area of 4.5 × 10⁴ km2 [28]. The location of the research area is marked in red in Figure 2.
The HY4-2005-5, a voyage of research work conducted by the Guangzhou Marine Geological Survey, was carried out for exploration, and gained the numbers of samples of sediments by large gravity piston samplers. The coordinates of the sampling station T1 are 111°3.71′ E, 18°1.73′ N, which is about 150 km away from Hainan Province, China. The geological structural unit belongs to the west depression of Qiongdongnan Basin, and the seafloor terrain is a flat slope [29]. The pore water and mineral composition of borehole sedimentary samples taken from the basin were analyzed [30].
Quaternary sediments in the Qiongdongnan Basin are thick and rich in organic matter, which provide a rich source of hydrocarbon gases. A high geothermal gradient and abnormally high pressure are common in the basin, which is favorable for hydrocarbon gas formation, diffusion, and migration. Mud volcanoes, mud diapirs, gas chimneys, and other structures related to methane seepage have been discovered in some areas of the basin [31,32].
Due to the good deposit condition and the prospect of natural gas hydrate [33], this basin is selected as the target area to investigate the impact of methane leakage on the formation of barite front and the characteristics of authigenic minerals.
3. Methods
3.1. Numerical Simulator
In this study, all simulations were carried out using TOUGHREACT [34], which was developed by coupling reactive transport processes with the multiphase flow code TOUGH2 written in Fortran 77 [35,36]. The numerical method for fluid flow and chemical transport simulations is based on the integral finite difference (IFD) method for space discretization. TOUGHREACT allows the comprehensive modeling of biogeochemical interactions between fluid and solid phases that are coupled to solute transport. The program is applicable to one-, two-, or three-dimensional geological domains with physical and biogeochemical heterogeneity. Further descriptions about this code are provided in Appendix A.
3.2. Biodegradation Kinetics and Parameters
In this paper, the biodynamic reaction module is added, which simulates the methane anaerobic oxidation reaction under the microbial effect and the biogeochemical reaction of the methane in the sedimentary layer. The governing equation referring to the Monod equation [34] is
where is the reaction rate of methane anaerobic oxidation; is the maximum reaction rate of the methane anaerobic oxidation reaction; and are the half-saturation constant of methane and sulfate separately, and are concentrations of methane and sulfate, and is the minimum reaction concentration.
According to the work of Dale et al. [37,38], we obtained the maximum reaction concentration rate of AOM and the half-saturated constant in the controllable Equation (2). The maximum and the minimum reaction concentrations of AOM were considered as gained from Liu et al. [12], which are shown in Table 1.
4. Model Setup and Case Settings
4.1. Conceptual Model and Boundary Conditions
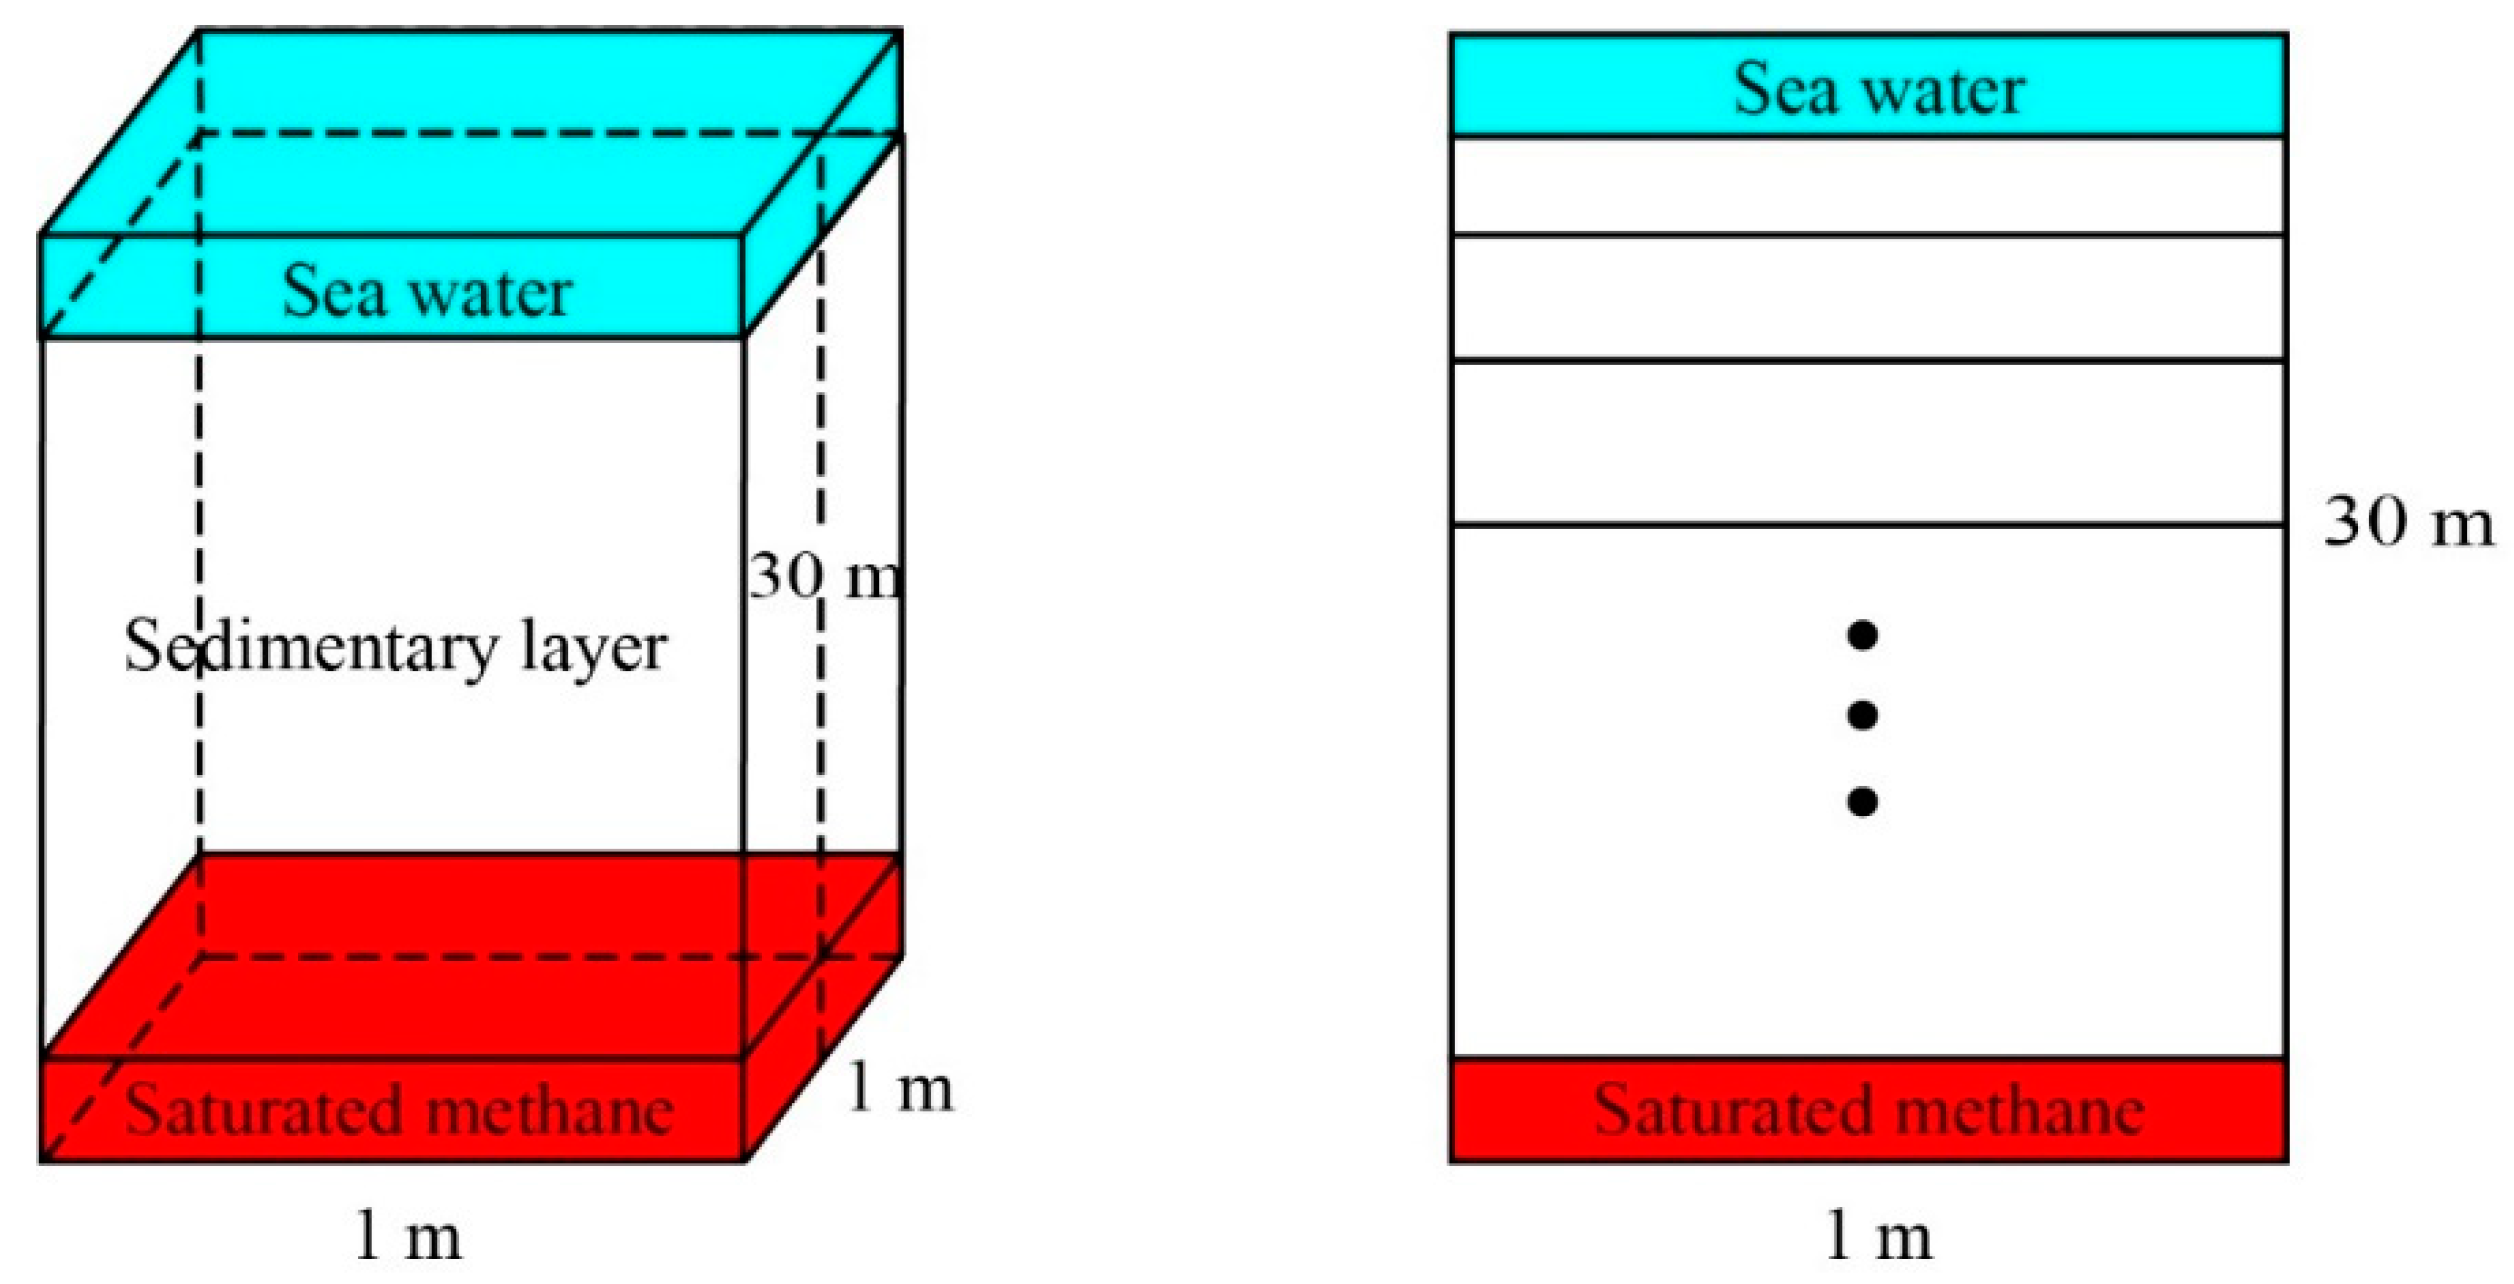
A one-dimensional column model was built according to statistics and some relevant conceptual models [39]. The sulfate–methane interface (SMI) is usually located at a depth of 7–15 m below seafloor (mbsf) where methane leakage flux existed in the Qiongdongnan Basin [40]. At the same time, we calculated the SMI depth of T1 according to the sulfate profile, that is about 22 mbsf. Given the above-mentioned, the height of the column was set up as 30 m to fit actual conditions (Figure 3).
The model is divided into two hundred grids unevenly, and the dividing approach is expressed as (for details, the readers are referred to Liu et al. [41]):
where L is the height of the cylinder of the sediment, n is the number of grids, and c is the attenuation coefficient, which is 10.
The top element of the model is supposed to be the seawater body and is treated as the first boundary condition with constant pressure, temperature, and water chemical component. A boundary with known flux (i.e., the secondary condition) is assigned on the bottom of the model, which acts as the source of methane.
4.2. Physical Parameters Used in the Model
The physical parameters of the sedimentary column are summarized in Table 2. The porosity and permeability were obtained by averaging the measured data of the Qiongdongnan Basin as well as some surrounding areas of the South China Sea [41,42]. The temperature and pressure are adopted from the reported data in the Northern Slope of the South China Sea [43,44].
4.3. Initial Water Chemistry
In the model, three different initial waters were required: sea water in the top of the model, sedimentary porous water, and methane-saturated water in the bottom of the model. The seawater compositions are referred to Wu et al. (2010) and Yang et al. (2013) [19,45]. The concentration of primary species in the sedimentary layer is obtained based on the testing data of the samples from the T1 station in the Qiongdongnan Basin [26], and ionic strength of the solution is 0.6594. The bottom boundary water of the sedimentary layer is saturated methane water. The methane intrudes upwards from the bottom with a fixed flux of 5.95 × 10⁻³ mmol·cm−2·a−1 according to the reference methane flux in the South China Sea [19]. Subsequently, we calculated the saturated methane concentration at the corresponding temperature and pressure by a thermodynamic model [46]. The calculated saturated methane concentration is 1.5424 × 10⁻¹ mol/L. All water solutions are listed in Table 3.
4.4. Sedimentary Minerals
According to the results of the X-ray diffraction (XRD) of the sediment samples collected by the ‘HY4-2005-5’ in 2005, the initial mineral components of the sedimentary layer in simulations were given as shown in Table 4. Additionally, the saturation indexes are also calculated as follows.
The content of chlorite refers to the average composition of clay minerals in the Northern Slope of the South China Sea. We found that the proportion of chlorite, kaolinite, and illite content in the sediment in the South China Sea was about 1:1:2, so the initial chlorite content was determined. Other mineral settings were based on the measured data [39]. Furthermore, the content of the barite is invoked as the initial content in the vertical direction based on the average value measured to examine the relationship between the distribution characteristic of authigenic barite, the leakage of methane and the forming of barite front.
4.5. Case Settings
In order to investigate the formation process of the barite front in the cold seep environment and the relationship between the authigenic barite and the flux of methane leakage, the following scenarios were designed in this work (Table 5).
Base-case 1 was designed based on the measured data in the Qiongdongnan Basin, which is used to simulate and analyze the transformation characteristics of the authigenic barite in the methane leakage environment. Base-case 2 was designed to reveal the forming mechanism of barite in the T1 station by comparing it with Base-case 1. In Case 1–Case 7, the methane flux was changed to 0.5-, 0.75-, 5-, 7.5-, 10-, 15-, and 20-fold that in Base-case 1, respectively. Furthermore, Case5–Case 7 were designed to verify the relationship between the methane leakage flux and the precipitation ratio of barite over calcite obtained from the results based on Case 1–Case 4. The simulation time is 100,000 years with temperature unchanged.
5. Results and Discussion
5.1. Analysis of the Forming Mechanism of the Barite Front
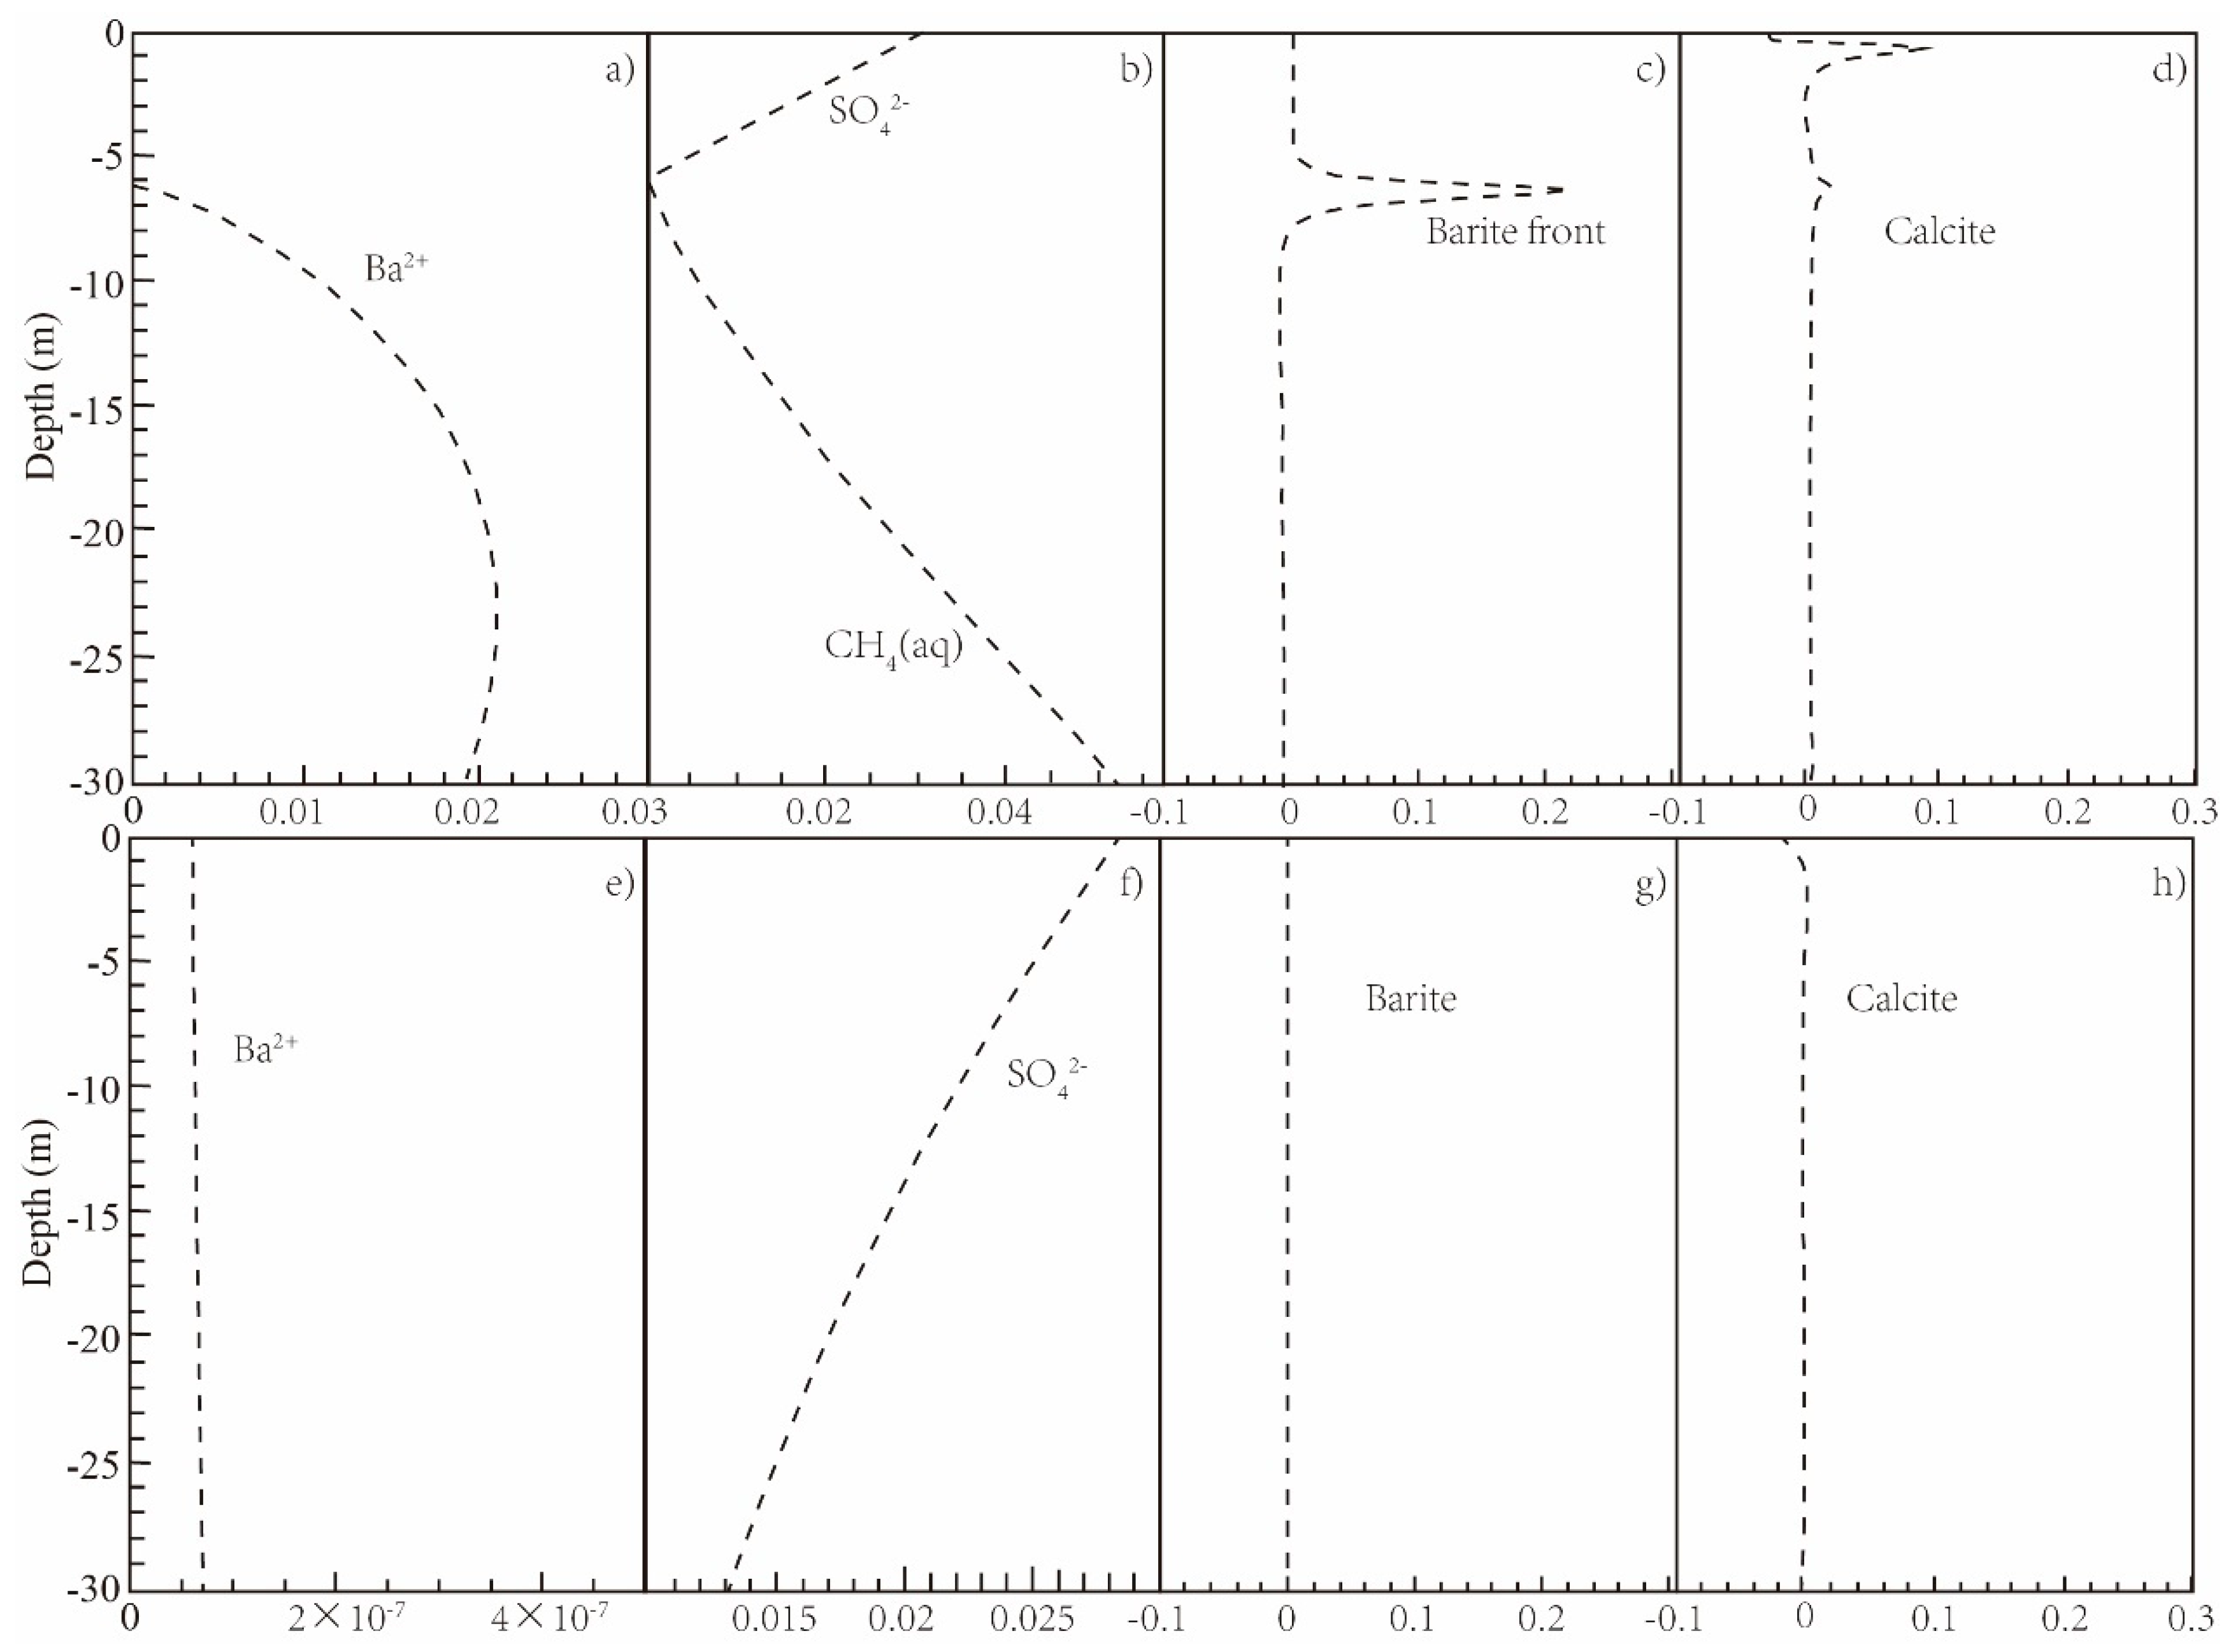
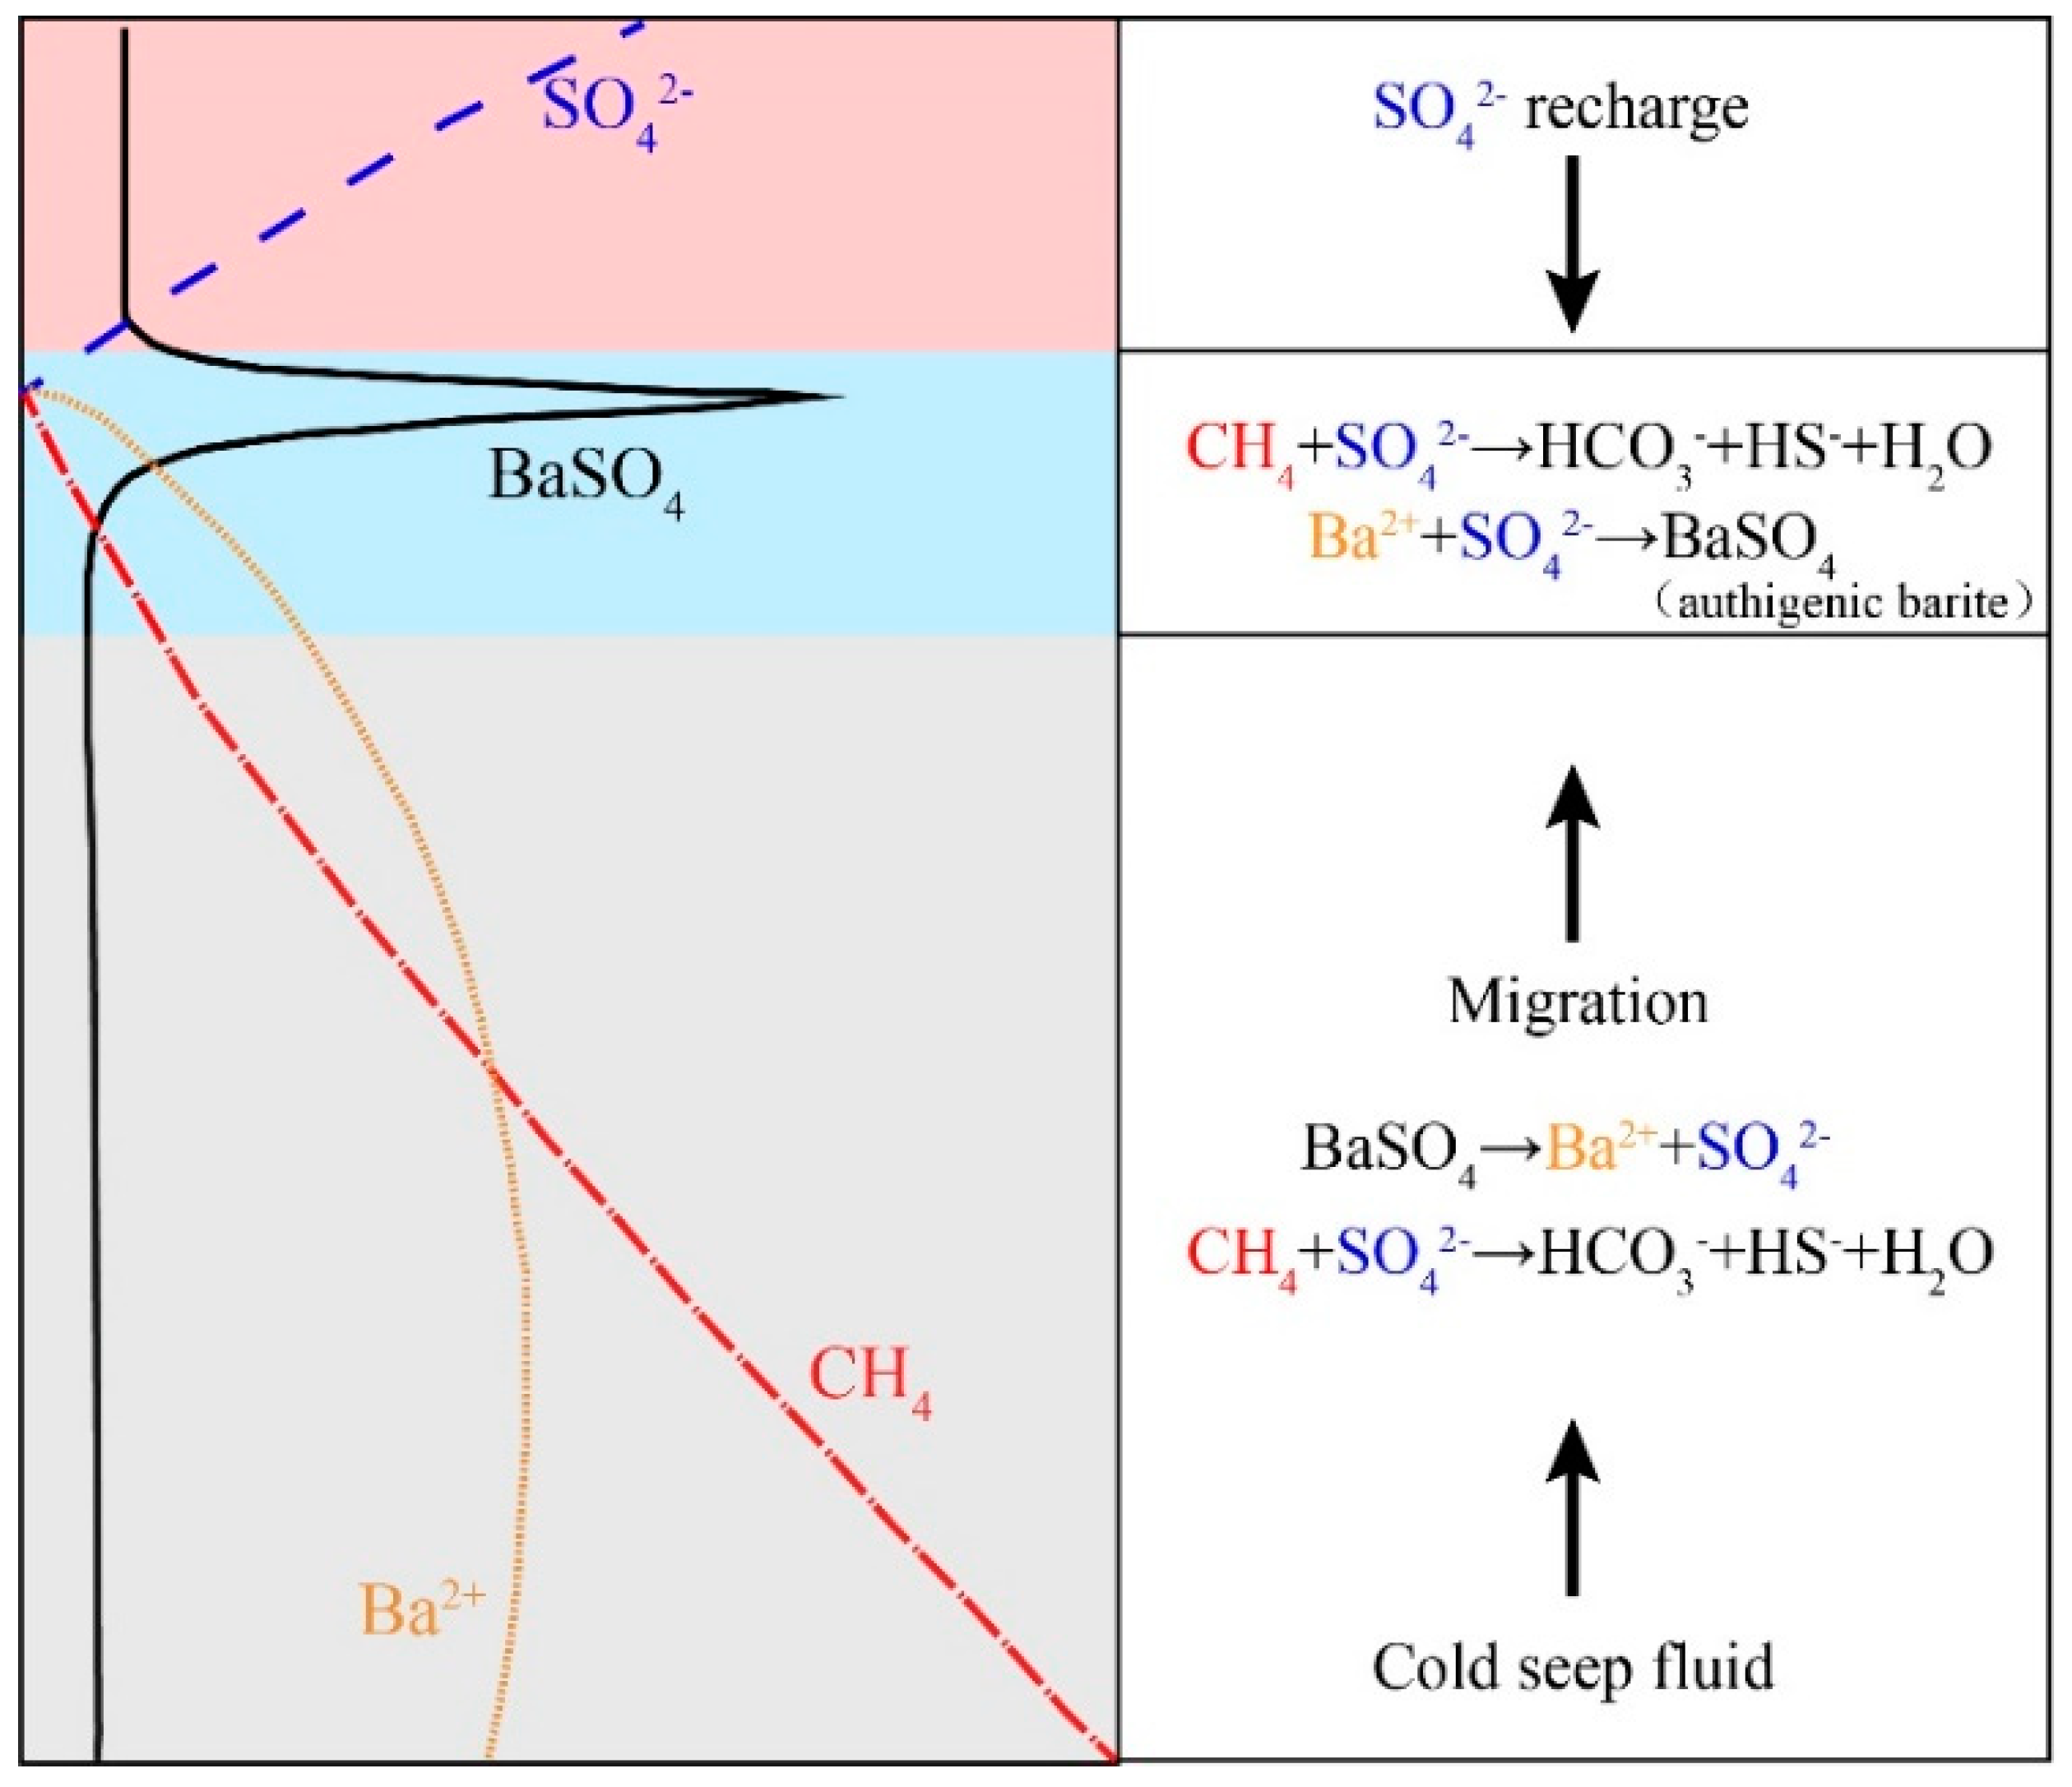
By comparing Base-case 1 with methane flux with Base-case 2 without flux, we concluded that the barite front is extremely relevant to the AOM-SR. Figure 4a,e indicate the barium profiles under methane flux and no flux conditions. When considering the methane flux, the AOM-SR consumed the sulfate dissolved from original depositional barite. Thus, this process promotes the dissolution of barite and releases more barium to the water. The dissolved barium continuously migrates to upper sediment with the cold seep activities, which explains the barium profile in Figure 4a. However, under the no flux condition, the barite and barium are in equilibrium, which leads to a low barium concentration because of a low solubility of barite. Therefore, the barite front cannot be formed in the sediment due to the lower concentration of barium.
In the early stage of methane leakage, the sulfate-less fluid caused by the cold seep activity broke the equilibrium of barite in the sedimentary layer. The original depositional barite in the bottom of the sedimentary layer dissolved, releasing to the water. With the AOM-SR process in the sediment, the sulfate is consumed continually, bringing the source of barium to shallow sediment.
The dissolved moves upward with the cold seep fluid; at the location where sulfate is abundant, the barite re-precipitated and the barite front presented, which may indicate the methane fluid activity. The AOM-SR, on the one hand, enhances the dissolution of the barite in the bottom of the sedimentary layer by consuming the sulfate dissolved from barite. On the other hand, the generated and the upward fluid migration stimulate the production of some carbonate minerals (mainly authigenic calcite, as shown in Figure 4d). The relationship between authigenic barite and calcite is discussed in the next section. Relevant mechanisms are shown in Figure 5, including some key reactions during the formation of the barite front. The requirements of the barite front formation are as follows:
- Original depositional barite in sediments (providing a source of barium);
- AOM-SR process caused by anaerobic microbes (promoting the release of barium);
- Methane leakage flux (promotes AOM-SR and carries the barium).
5.2. Impacts of Methane Leakage on the Distribution of Authigenic Minerals
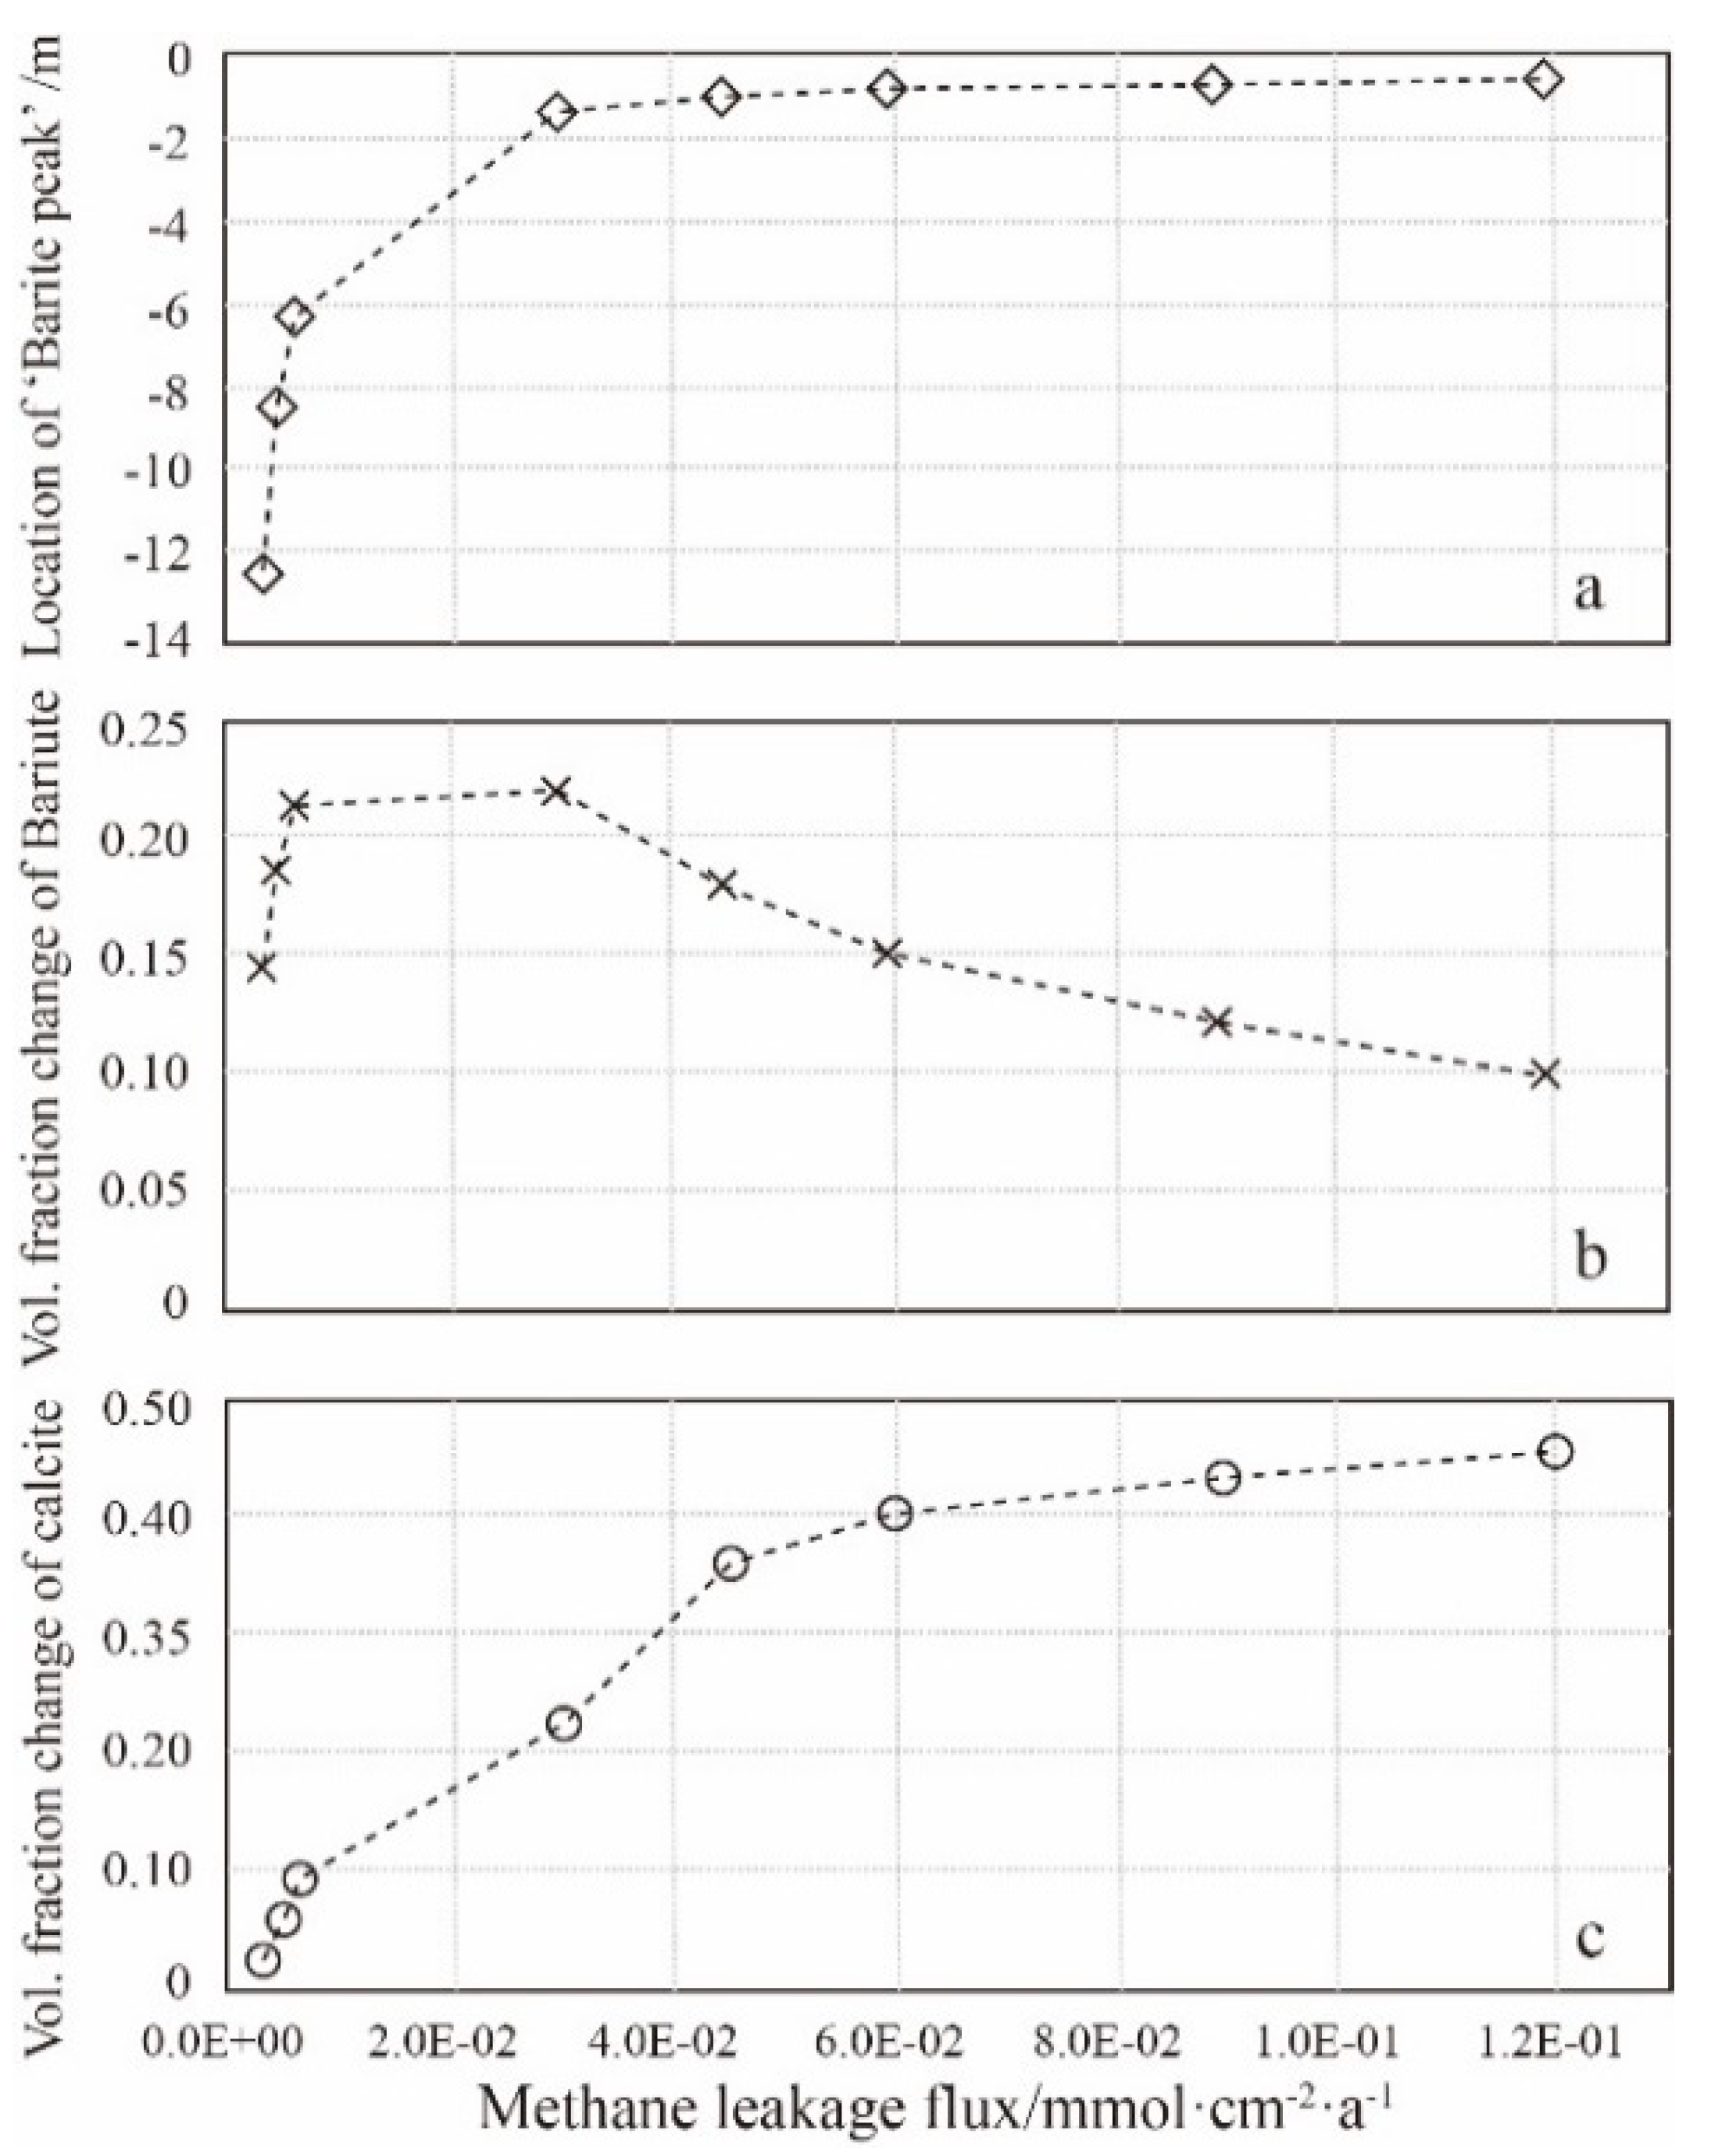
Based on the results summarized from Cases 1–7, the influence of methane flux on the location of the barite front, and the content of authigenic calcite and barite is obtained (each dot indicates one case at a certain flux). As the cold seep fluid leaks, the sedimentary balance of the minerals is split, and then the vertical distribution of the minerals is re-established. Figure 6a implies the location of a barite front significantly triggered by methane leakage flux. A doubling of flux results in nearly a halving of the location (comparing Base-case 1 with Case 1 and Case 2). This is because the high flux of methane promotes the AOM-SR reaction rate, which causes the sulfate-depletion zone to extend to a shallower area, causing the barite to re-precipitate at the sulfate-rich place, which is shallower than the low methane flux, and form a barite front. However, although the location of the barite front is shallower as the methane leakage flux increases, the volume fraction change of barite did not increase (Figure 6b) in the same manner as the calcite (Figure 6c). The volume fraction change of barite increases first and then decreases with the increasing of flux.
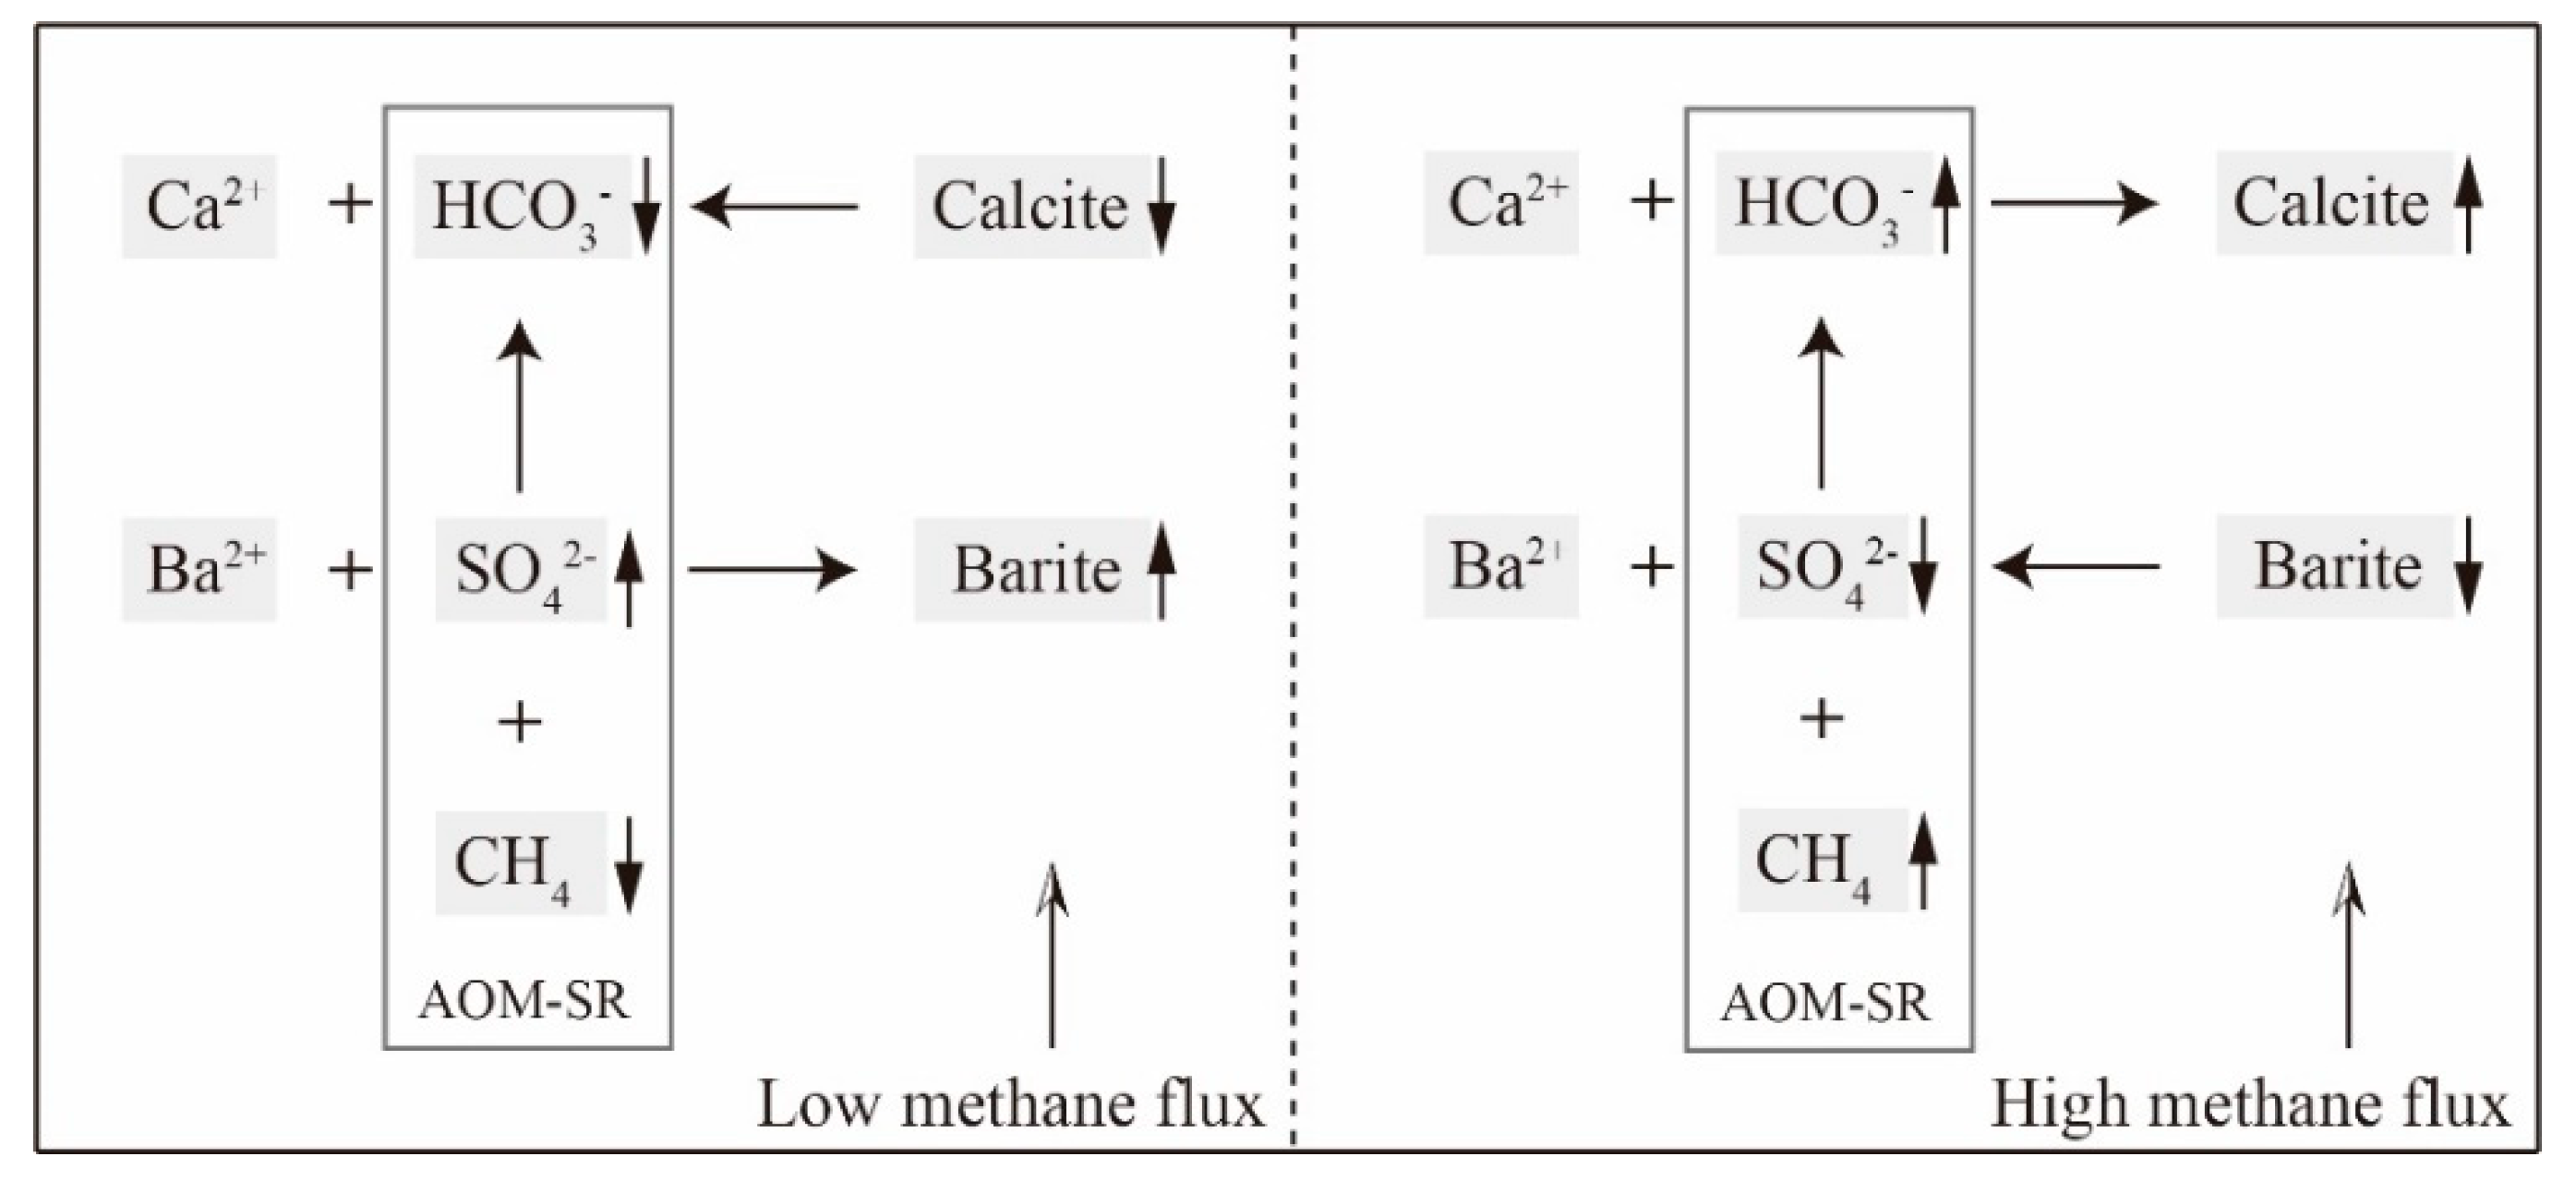
Based on the above findings, we analyzed the reasons why this could occur. The increase of methane leakage flux improves the AOM reaction rate, consuming more sulfate. For the calcite, an improvement of the AOM reaction rate means more HCO3− could be generated, causing a more alkaline environment for calcite to form. However, for the barite, the methane would compete with barium to utilize the sulfate. Therefore, two situations are discussed. As for low methane flux, the methane and barium coexist in balance; therefore, both can react with sulfate within the sulfate-rich zone. Such that the calcite and barite both increase at the range of low methane flux. In contrast, the high flux of methane enhances AOM-SR consuming more sulfate relatively, which inhibits the reaction between barium and sulfate. Consequently, the barite content shows a decreasing tendency with high flux of methane. The pattern diagram of this process is shown in Figure 7.
With the methane flux increases, the barite and calcite show different changing directions. The enrichment of authigenic calcite is more likely to indicate cold seep, but the content of barite may also show the activities of cold seep for its changing characteristics. Therefore, we analyzed the relationship between the flux of methane and these two minerals based on the simulation results of all cases.
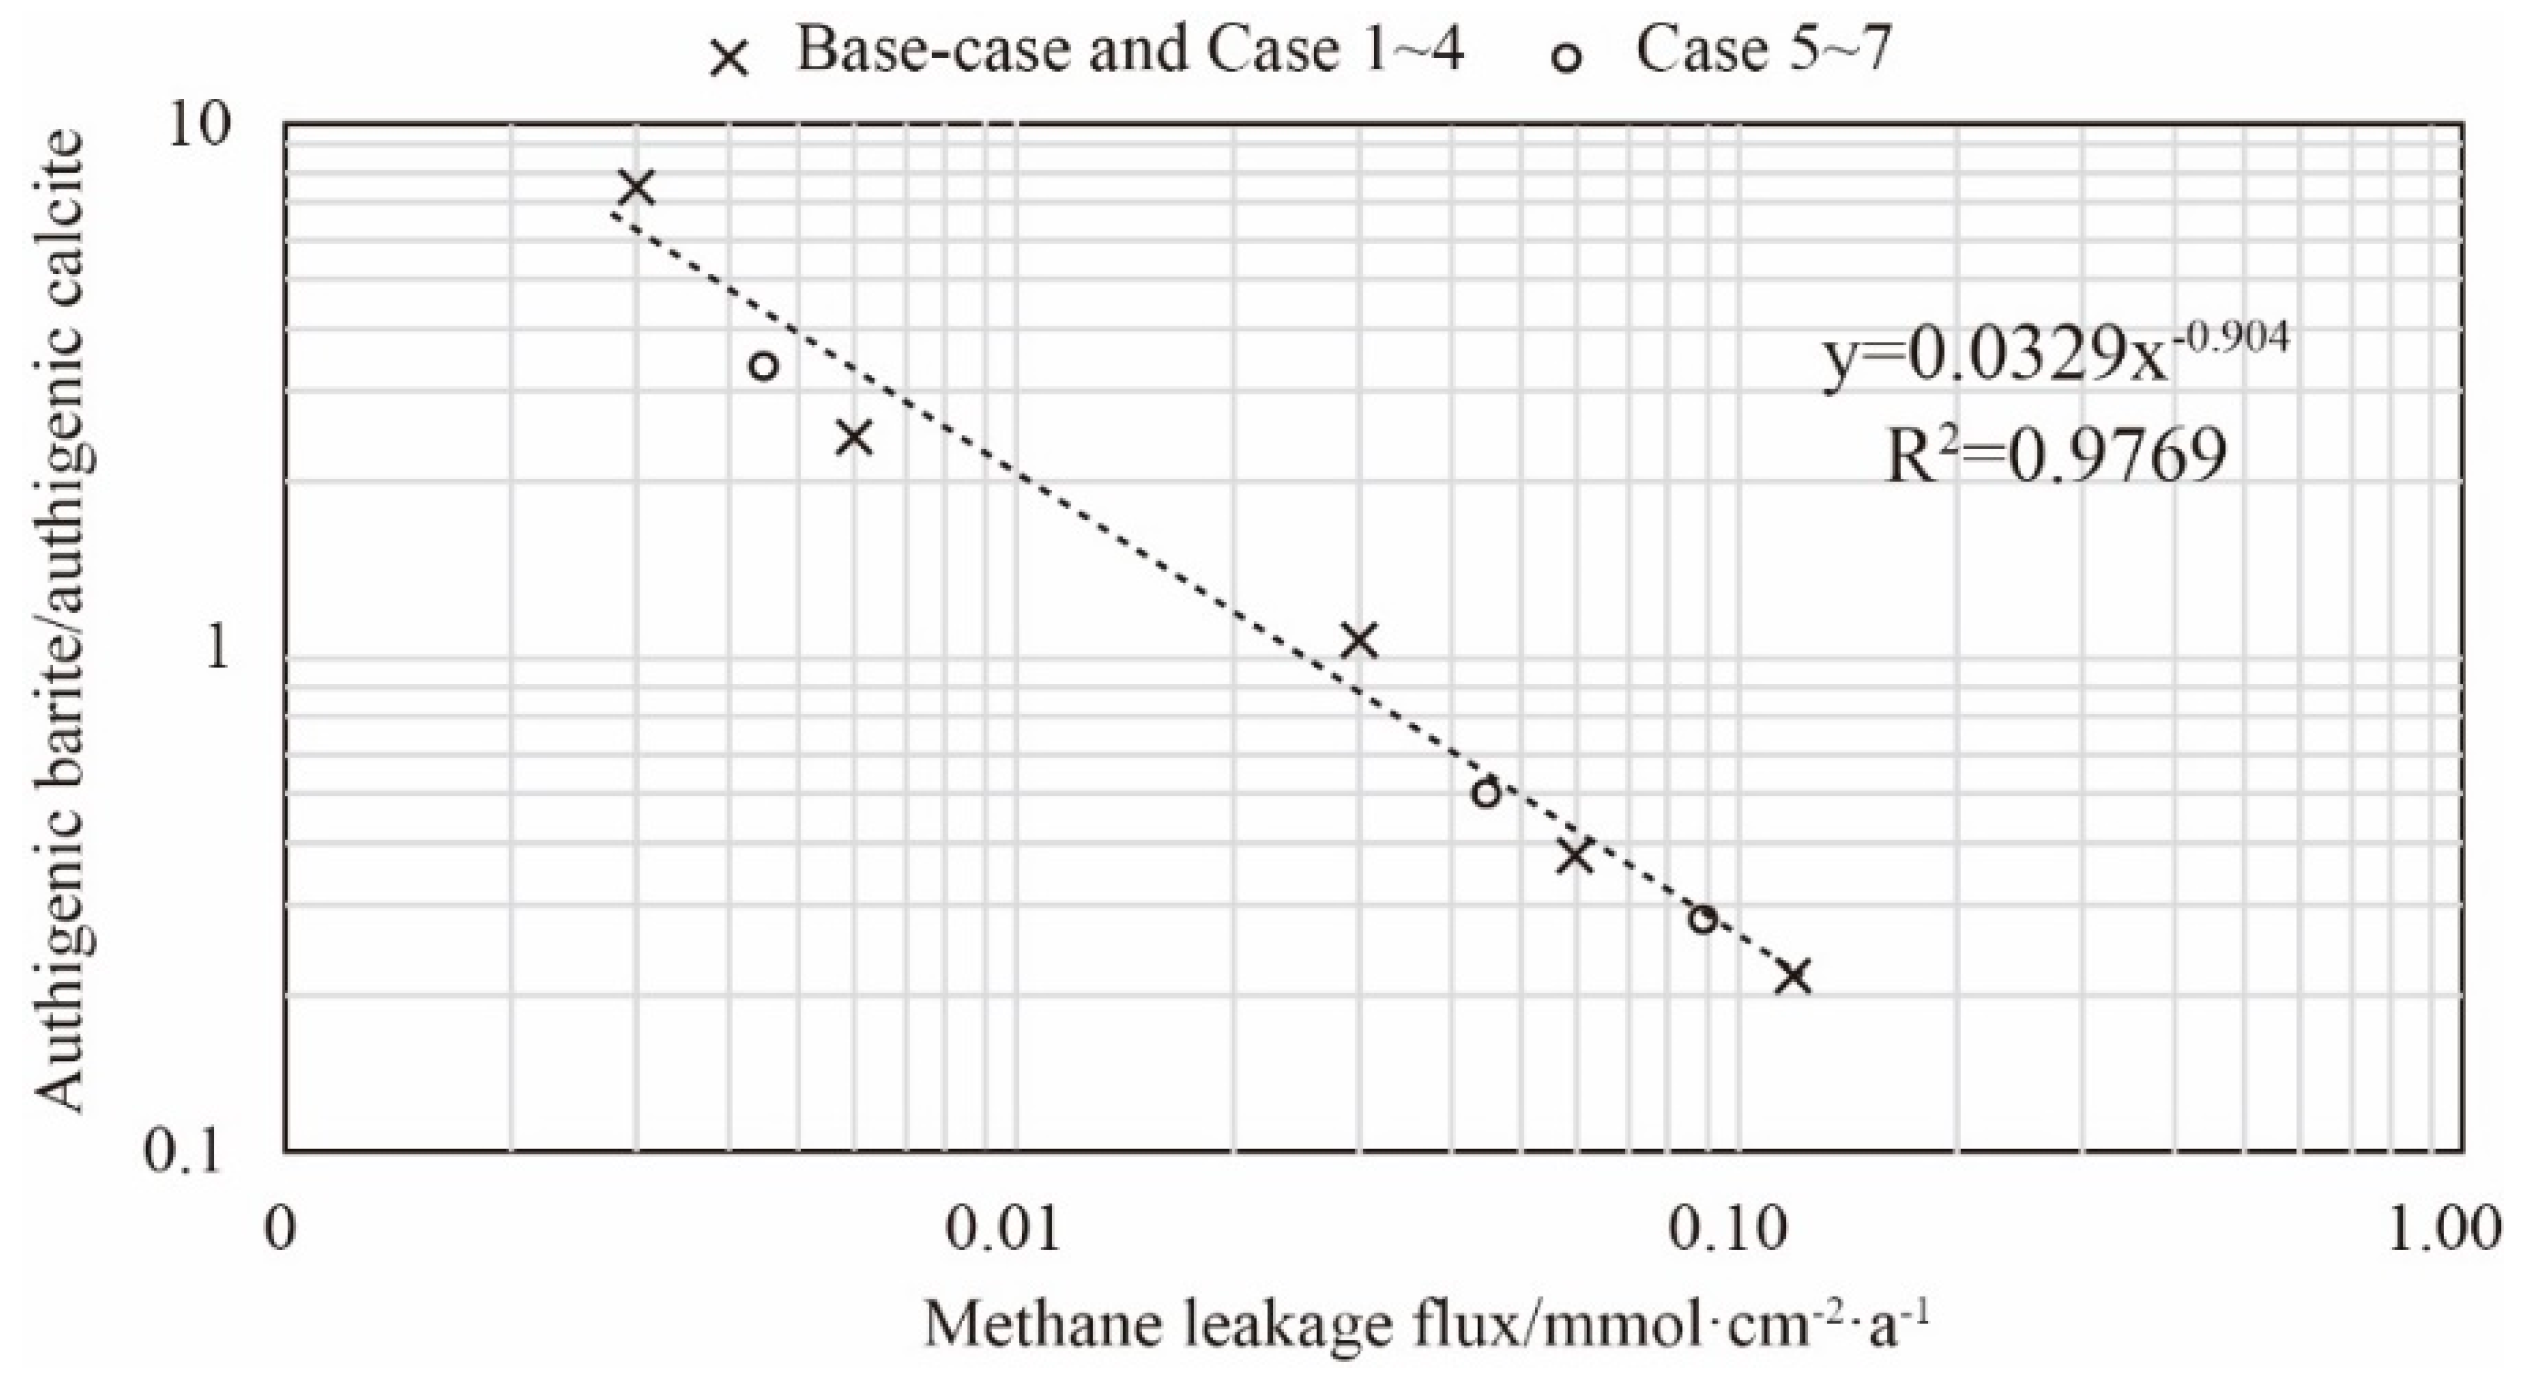
As shown in Figure 8, we found that the simulation results indicated a negative linear correlation between the methane leakage flux and the precipitation ratio of barite to calcite in two-logarithmic scale diagram. The fitted formula is y = 0.0329x − 0.904 with R2 = 0.9769. For correlation, we compared the results of Case 5–Case 7 with the corresponding sample of methane flux (round dots in Figure 8). It is revealed that the smaller the ratio, the greater the methane leakage velocity at the bottom is, which implies a greater possibility of holding natural gas hydrate in sediment. This implication might provide a workable guidance to search for natural gas hydrate using geochemical characteristics.
5.3. Analysis of Forming Mechanism of Multi-Front Barite
Based on the results of the previous sections, the barite front formed because of the methane leakage activities. In addition, the location of the front is related to the methane leakage flux. While in the geologic history, the methane flux could not be a constant value, the high flux of methane may cause the shallow barite front; inversely, the low flux leads to a deep front of barite. Therefore, with different methane fluxes, different fronts formed in different depths of sediment, which show the existence of multi-front barite.
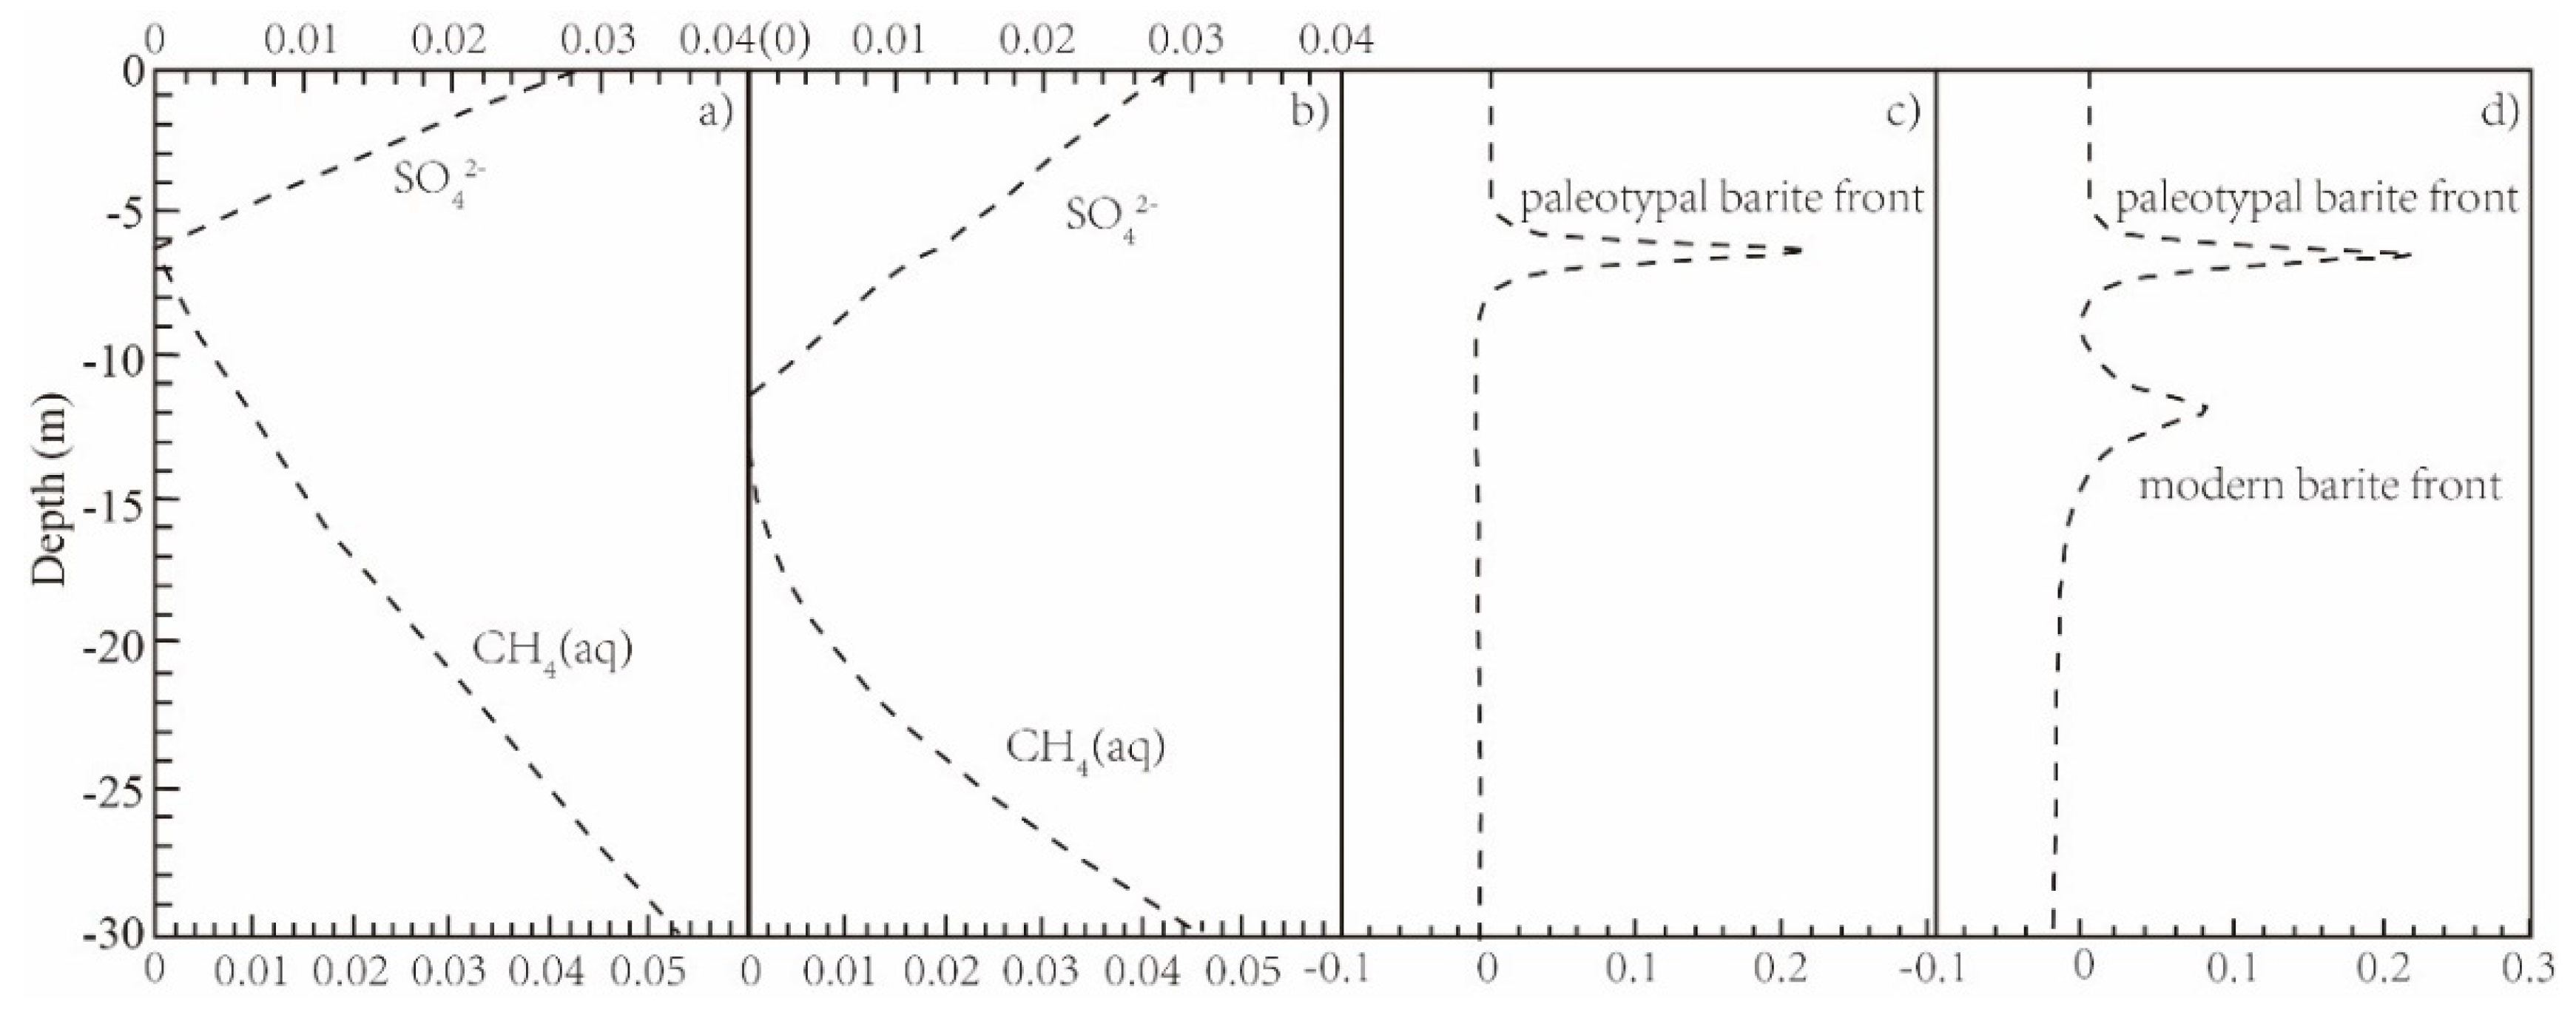
From the mechanism of the formation process of the barite front, the front appears near to the sulfate–methane transition zone due to its relationship with AOM-SR. However, at the T1 station in Qiongdongnan Basin, we find that the sulfate profile is inconsistent with the barite front. The barite front existed at a shallower depth compared with the SMTZ inferred from sulfate profiles. That means the front at the T1 station is not formed with the recent methane flux, and maybe there is another barite front around the modern methane flux. For the contradiction between the sulfate profile and barite front in the T1 station, we simulated the formation of multi-front barite to explain the mechanism of the multi-front barite based on the measured data in the T1 station of Qiongdongnan Basin. A simulation case was designed, and we assumed that the methane flux is high in the first 100,000 years, and that there is low methane in the next 100,000 years. Using the two-flux model, the simulation results are shown in Figure 9.
According to the simulation results, we explained why the sulfate profile is not consistent with the barite front. From Figure 9a,c, in the first 100,000 years, the sulfate profile corresponds to the barite front. The results in Section 5.1 indicate the relationship between the methane leakage flux and barite front. However, in the next 100,000 years, with low methane flux, another front beneath the original front appears. Therefore, we called the two fronts the paleotypal and modern front, respectively.
We could infer that the barite front we detected in the measured data is probably the paleotypal barite front of the simulation combined with the periodical activities of the methane cold seep of the Qiongdongnan Basin. In the early stage, the active cold seep produced a barite front in the shallow area. However, over a long geologic historical period, the methane flux decreased for certain reasons. The sulfate-rich zone moved downward for relatively low AOM-SR and formed a new barite front. Therefore, the key factors of the multi-front are the periodical activities of the cold seep. High methane flux corresponds to a shallow front and low flux relates to a deep front. Different fronts formed over time, showing a multi-front in our modern measurements. Based on the above discussion, the requirements of multi-front barite are as follows:
- Cold seep areas;
- AOM-SR under the reaction of microorganisms;
- Periodical activities of cold seep.
The first and second conditions assure the formation of a barite front, but the key factors are the periodical activities of cold seep for multi-front barite. Under natural conditions, it is likely that different fluxes are exhibited over a long history. The multi-front barite is more realistic and is closer to the actual conditions. It should be noted that the mechanism of multi-front barite is hardly understood, with limited research work having focused on it. This discussion will provide an instructive prospect and be useful for studies on the activities of cold seep over geological periods.
6. Conclusions
By establishing a 1D sedimentary column model, we simulated the formation process of barite front in cold seep environments. In this study, the formation mechanism of the barite front was investigated, and the relationship between the flux of methane leakage and cold seep minerals was analyzed. By discussing the simulation results, the following conclusions were drawn:
- The formation of a barite front is relevant to the activities of cold seep, which leaks from the deep sediments carrying -bearing fluid. The up-moving reacts with sulfate, forming the barite front in the sulfate-rich zones;
- The location of the barite front is closely related to the methane leakage flux: the higher the leakage flux is, the shallower the location of the barite front. Additionally, multiple peaks appeared due to the periodical cold seep leakages, which provide us with records of cold seep activities;
- Based on the simulated results, a linear relationship with a negative correlation between the leakage flux of methane and the precipitation ratio of barite to calcite was regressed, which might serve as a workable guidance when searching for natural gas hydrate through geochemical characteristics.
Author Contributions
Conceptualization, S.S. and K.B.; Formal analysis, S.S. and H.T.; Software, T.X.; Validation, T.X., H.T. and Y.C.; Writing—original draft, S.S.; Writing—review & editing, T.X. and H.T.
Funding
This research was funded by “the National Key Research and Development Plan of China, grant number 2017YFC0307300”, and partly supported by “the National Natural Science Foundation of China, grant number 41877185” and “the National Natural Science Foundation of China, grant number 41772247”.
Acknowledgments
The authors sincerely appreciate immense support of Zhenyu Zhu of CNOOC Research Institute Co., Ltd., China.
Conflicts of Interest
The authors declare no conflict of interest.
Appendix A
In TOUGHREACT, to represent a geochemical system, a subset of aqueous species are selected as basis species (or called component or primary species). All other species are called secondary species, including aqueous complexes, precipitated (mineral) and gaseous species [47,48,49]. The number of secondary species must be equal to the number of independent reactions. Any of the secondary species can be represented as a linear combination of the set of basis species as
where S represents chemical species, j is the basis species index, i is the secondary species index, is the number of reactions (or secondary species), and is the stoichiometric coefficient of j-th basis species in the i-th reaction.
At any time, the total concentration of basis species j in the system is given by
where c shows concentrations, subscripts j, k, m, n, z, and s are the indices of basis species, aqueous complexes, minerals at equilibrium and minerals under kinetic constraints, and exchanged and surface complexes, respectively. , , , , , and are the number of the corresponding species and minerals; , , , , and are stoichiometric coefficients of the basis in the aqueous complexes, equilibrium, kinetic minerals, and exchanged and surface complexes, respectively; r is the kinetic dissolution rate (negative for precipitation, and positive for dissolution). In contrast to an aqueous equilibrium, species involved in kinetic reactions, such as redox couples, are independent and must be considered as primary species [34]. On the mass balance basis, we obtain a set of equations, and all equations involved in the chemical system are solved using the Newton–Raphson iteration method.
A broad range of subsurface thermal–physical–chemical–biological processes are considered under various thermo-hydrological and chemical conditions of pressure, temperature, ionic strength, and pH and Eh. The simulator can accommodate any number of minerals theoretically. However, in order to avoid out-of-memory errors, the code limits the maximum number of minerals to 45 for the current version of TOUGHREACT. Readers are referred to the relevant literature [50] for details.
The general rate expression used in TOUGHREACT is taken from Lasaga et al. (1994) [51]:
where n denotes the mineral index, positive values of indicate dissolution, and negative values precipitation; is the rate constant (moles per unit mineral surface area and unit time), which is temperature dependent. An is the specific reactive surface area per kg H2O; is the equilibrium constant for the mineral-water reaction written for the destruction of one mole of mineral n; and is the reaction quotient. The parameters q and h must be determined from experiments; usually, but not always, they are taken as equal to one.
For many minerals, the kinetic rate constant k can be summed from three mechanisms [52], or
where superscripts or subscripts nu, H, and OH indicate neutral, acid, and base mechanisms, respectively; is the activation energy; is the rate constant at 25 °C; R is a gas constant; T is the absolute temperature; a is the activity of chemical species; and n is an exponent (constant).
References
- Astrom, E.K.; Carroll, M.L.; Ambrose, W.G., Jr.; Carroll, J. Arctic Cold Seeps in Marine Methane Hydrate Environments: Impacts on Shelf Macrobenthic Community Structure Offshore Svalbard. Mar. Ecol. Process Ser. 2016, 552, 1–18. [Google Scholar] [CrossRef]
- Campbell, K.A.; Nelson, C.S.; Alfaro, A.C.; Boyd, S.; Greinert, J.; Nyman, S.; Grosjean, E.; Logan, G.A.; Gregory, M.R.; Cooke, S.; et al. Geological Imprint of Methane Seepage on the Seabed and Biota of the Convergent Hikurangi Margin, New Zealand: Box Core and Grab Carbonate Results. Mar. Geol. 2010, 272, 285–306. [Google Scholar] [CrossRef]
- Stevens, E.W.; Bailey, J.V.; Flood, B.E.; Jones, D.S.; Gilhooly, W.P.; Joye, S.B.; Teske, A.; Mason, O.U. Barite Encrustation of Benthic Sulfur-Oxidizing Bacteria at a Marine Cold Seep. Geobiology. 2015, 13, 588–603. [Google Scholar] [CrossRef] [PubMed]
- Han, X.; Yang, K.; Huang, Y. Origin and Nature of Cold Seep in Northeastern Dongsha Area, South China Sea: Evidence from Chimney-Like Seep Carbonates. Chin. Sci. Bull. 2013, 58, 3689–3697. [Google Scholar] [CrossRef]
- Jakubowicz, M.; Dopieralska, J.; Belka, Z. Tracing the Composition and Origin of Fluids at an Ancient Hydrocarbon Seep (Hollard Mound, Middle Devonian, Morocco): A Nd, REE and Stable Isotope Study. Geochimica et Cosmochimica ACTA 2015, 156, 50–74. [Google Scholar] [CrossRef]
- Toki, T.; Higa, R.; Ijiri, A.; Tsunogai, U.; Ashi, J. Origin and Transport of Pore Fluids in the Nankai Accretionary Prism Inferred from Chemical and Isotopic Compositions of Pore Water at Cold Seep Sites Off Kumano. Earth Planets Space 2014, 66, 173. [Google Scholar] [CrossRef]
- Liang, Q.; Hu, Y.; Feng, D.; Peckmann, J.; Chen, L.; Yang, S.; Liang, J.; Tao, J.; Chen, D. Authigenic Carbonates from Newly Discovered Active Cold Seeps on the Northwestern Slope of the South China Sea: Constraints on Fluid Sources, Formation Environments, and Seepage Dynamics. Deep-sea Res. Part I-Oceanogr. Res. Pap. 2017, 124, 31–41. [Google Scholar] [CrossRef]
- Makogon, Y.F. Natural Gas Hydrates. A Promising Source of Energy. J. Nat. Gas Sci. Eng. 2010, 2, 49–59. [Google Scholar] [CrossRef]
- Liu, X.; Xu, T.; Tian, H.L.; Wei, M.C.; Jin, G.R.; Liu, N. Numerical Modeling Study of Mineralization Induced by Methane Cold Seep at the Sea Bottom. Mar. Pet. Geol. 2016, 75, 14–28. [Google Scholar] [CrossRef]
- Orcutt, B.; Samarkin, V.; Boetius, A.; Joye, S. On the Relationship Between Methane Production and Oxidation by Anaerobic Methanotrophic Communities from Cold Seeps of the Gulf of Mexico. Environ. Microbiol. 2008, 10, 1108–1117. [Google Scholar] [CrossRef]
- Boetius, A.; Ravenschlag, K.; Schubert, C.J.; Rickert, D.; Widdel, F.; Gieseke, A.; Amann, R.; Jørgensen, B.B.; Witte, U.; Pfannkuche, O. A marine microbial consortium apparently mediating anaerobic oxidation of methane. Nature 2000, 407, 623. [Google Scholar] [CrossRef] [PubMed]
- Knittel, K.; Boetius, A. Anaerobic Oxidation of Methane: Progress with an Unknown Process. Annu. Rev. Microbiol. 2009, 63, 311–334. [Google Scholar] [CrossRef] [PubMed]
- Orphan, V.J.; House, C.H.; Hinrichs, K.U.; McKeegan, K.D.; DeLong, E.F. Multiple archaeal groups mediate methane oxidation in anoxic cold seep sediments. Proc. Natl. Acad. Sci. USA 2002, 99, 7663–7668. Available online: http://sims.ess.ucla.edu/PDF/Orphan_et_al_PNAS_2002.pdf (accessed on 10 February 2019). [CrossRef] [PubMed]
- Torres, M.E.; McManus, J.; Hammond, D.E.; de Angelis, M.A.; Heeschen, K.U.; Colbert, S.L.; Tryon, M.D.; Brown, K.M.; Suess, E. Fluid and Chemical Fluxes in and Out of Sediments Hosting Methane Hydrate Deposits on Hydrate Ridge, Or, I: Hydrological Provinces. Earth Planet. Sci. Lett. 2002, 201, 525–540. [Google Scholar] [CrossRef]
- Roberts, H.H.; Aharon, P. Hydrocarbon-Derived Carbonate Buildups of the Northern Gulf of Mexico Continental Slope: A Review of Submersible Investigations. Geo-Marine Lett. 1994, 14, 135–148. [Google Scholar] [CrossRef]
- Turner, S.C. Tracking Sulfur Diagenesis in Methane Rich Marine Sediments on the Cascadia Margin: Comparing Sulfur Isotopes of Bulk Sediment and Chromium Reducible Sulfur. Master’s Theses, University of New Hampshire, Durham, NH, USA, 2018. [Google Scholar]
- Torres, M.E.; Bohrmann, G.; Suess, E. Authigenic Barites and Fluxes of Barium Associated with Fluid Seeps in the Peru Subduction Zone. Earth Planet. Sci. Lett. 1996, 144, 469–481. [Google Scholar] [CrossRef]
- Greinert, J.; Bohrmann, G.; Suess, E. Gas Hydrate-Associated Carbonates and Methane-Venting at Hydrate Ridge: Classification, Distribution, and Origin of Authigenic Lithologies. Nat. Gas Hydrates Occur. Distrib. Detect. 2001, 124, 99–113. [Google Scholar]
- Yang, T.; Jiang, S.Y.; Ge, L.; Yang, J.H.; Wu, N.Y.; Zhang, G.X.; Liu, J.; Chen, D.H. Geochemistry of pore waters from HQ-1PC of the Qiongdongnan Basin, Northern South China Sea, and its implications for gas hydrate exploration. Sci. China Earth Sci. 2013, 56, 329–338. [Google Scholar] [CrossRef]
- Dickens, G.R. Sulfate Profiles and Barium Fronts in Sediment on the Blake Ridge: Present and Past Methane Fluxes through a Large Gas Hydrate Reservoir. Geochimica et Cosmochimica ACTA 2001, 65, 529–543. [Google Scholar] [CrossRef]
- Suess, E. Marine Cold Seeps: Background and Recent Advances. In Hydrocarbons, Oils and Lipids: Diversity, Origin, Chemistry and Fate. Handbook of Hydrocarbon and Lipid Microbiology; Springer: Cham, Switzerland, 2018; pp. 1–21. [Google Scholar]
- Griffith, E.M.; Paytan, A.; Wortmann, U.G.; Eisenhauer, A.; Scher, H.D. Combining metal and nonmetal isotopic measurements in barite to identify mode of formation. Chem. Geol. 2018, 500, 148–158. [Google Scholar] [CrossRef]
- Gingele, F.X.; Zabel, M.; Kasten, S.; Bonn, W.J.; Nürnberg, C.C. Biogenic Barium as a Proxy for Paleoproductivity: Methods and Limitations of Application. In Use of Proxies in Paleoceanography; Springer: Berlin, Germany, 1999. [Google Scholar]
- Riedinger, N.; Kasten, S.; GrÖger, J.; Franke, C.; Pfeifer, K. Active and buried authigenic barite fronts in sediments from the Eastern Cape Basin. Earth Planet. Sci. Lett. 2006, 241, 876–887. [Google Scholar] [CrossRef]
- Feng, D.; Roberts, H.H. Geochemical Characteristics of the Barite Deposits at Cold Seeps from the Northern Gulf of Mexico Continental Slope. Earth Planet. Sci. Lett. 2011, 309, 89–99. [Google Scholar] [CrossRef]
- Jiang, H.; Dong, H.; Ji, S.; Ye, Y.; Wu, N. Microbial Diversity in the Deep Marine Sediments from the Qiongdongnan Basin in South China Sea. Geomicrobiol. J. 2007, 24, 505–517. [Google Scholar] [CrossRef]
- Wu, S.; Yuan, S.; Zhang, G.; Ma, Y.; Mi, L.; Xu, N. Seismic Characteristics of a Reef Carbonate Reservoir and Implications for Hydrocarbon Exploration in Deepwater of the Qiongdongnan Basin, Northern South China Sea. Mar. Pet. Geol. 2009, 26, 817–823. [Google Scholar] [CrossRef]
- Wu, N.Y.; Ye, Y.; Wu, D.D.; Liu, J.; Zhang, P.P.; Jiang, H.C.; Dong, H.L.; Zhang, X.; Zhang, X.H.; Lei, Z.S. Geochemical characteristics of sediments from southeast Hainan Basin, South China Sea and micro-methane-seep activity. Geol. Res. South China Sea 2007, 00, 40–47. (In Chinese) [Google Scholar]
- Zhong, Z.H.; Wang, L.S.; Li, X.X.; Xia, B.; Sun, Z.; Zhang, M.Q.; Wu, G.G. The Paleogene Basin-filling evolution of Qiongdongnan Basin and its relation with seafloor spreading of the South China Sea. Mar. Geol. Quat. Geol. 2004, 24, 29–36. [Google Scholar]
- Yang, T.; Jiang, S.; Ge, L.; Yang, J.; Wu, N.; Zhang, G.; Liu, J. Geochemical Characteristics of Pore Water in Shallow Sediments from Shenhu Area of South China Sea and their Significance for Gas Hydrate Occurrence. Chin. Sci. Bull. 2010, 55, 752–760. [Google Scholar] [CrossRef]
- Chen, D.F.; Li, X.X.; Xia, B. Distribution of gas hydrate stable zones and resource prediction in the Qiongdongnan Basin of the South China Sea. Chin. J. Geophys. 2004, 47, 483–489. [Google Scholar] [CrossRef]
- Wu, B.H.; Zhang, G.X.; Zhu, Y.H.; Lu, Z.Q.; Chen, B.Y. Process of gas hydrate investigation in China offshore. Earth Sci. Front. 2003, 10, 177–189. [Google Scholar]
- He, J.X.; Su, P.B.; Lu, Z.Q.; Zhang, W.; Liu, Z.J.; Li, X.T. Prediction of Gas Sources of Natural Gas Hydrate in the Qiongdongnan Basin, Northern South China Sea, and its Nigration, Accumulation and Reservoir Formation Pattern. Nat. Gas Ind. 2015, 35, 19–29. [Google Scholar]
- Xu, T.; Spycher, N.; Sonnenthal, E.; Zhang, G.; Zheng, L.; Pruess, K. Toughreact Version 2.0: A Simulator for Subsurface Reactive Transport Under Non-Isothermal Multiphase Flow Conditions. Comput. Geosci. 2011, 37, 763–774. [Google Scholar] [CrossRef]
- Pruess, K. Tough2: A General-Purpose Numerical Simulator for Multiphase Fluid and Heat Flow. NasaSti/recon Technical Report N. Available online: https://cloudfront.escholarship.org/dist/prd/content/qt0wx8q119/qt0wx8q119.pdf (accessed on 7 February 2019).
- Pruess, K.; Oldenburg, C.M.; Moridis, G.J. Tough2 User’s Guide Version 2. Office of Scientific & Technical Information Technical Reports. 1999. Available online: http://citeseerx.ist.psu.edu/viewdoc/summary?doi=10.1.1.396.8810 (accessed on 7 February 2019).
- Dale, A.W.; Regnier, P.; Knab, N.J.; Jorgensen, B.B.; van Cappellen, P. Anaerobic Oxidation of Methane (AOM) in Marine Sediments from the Skagerrak (Denmark): II. Reaction-Transport Modeling. Geochimica et Cosmochimica ACTA 2008, 72, 2880–2894. [Google Scholar] [CrossRef]
- Dale, A.W.; van Cappellen, P.; Aguilera, D.R.; Regnier, P. Methane efflux from marine sediments in passive and active margins: Estimations from bioenergetic reaction–transport simulations. Earth Planet. Sci. Lett. 2008, 265, 329–344. [Google Scholar] [CrossRef]
- Xu, T.; Bei, K.; Tian, H.; Cao, Y. Laboratory Experiment and Numerical Simulation on Authigenic Mineral Formation Induced by Seabed Methane Seeps. Mar. Pet. Geol. 2017, 88, 950–960. [Google Scholar] [CrossRef]
- Wu, D.D.; Ye, Y.; Wu, N.Y.; Jiang, H.C.; Ji, S.S.; Dong, H.L.; Liu, J. Early diagenesis records and chemical composition abnormalities in pore water for methane-seep in sediments from the southern Qiongdongnan Basin. Acta Oceanol. Sin. 2009, 31, 86–96. [Google Scholar]
- Liu, L.; Wu, N. Simulation of Advective Methane Flux and Aom in Shenhu Area, the Northern South China Sea. Environ. Earth Sci. 2014, 71, 697–707. [Google Scholar] [CrossRef]
- Wang, J.; Guo, C.; Hou, Z.; Fu, Y.; Yan, J. Distributions and Vertical Variation Patterns of Sound Speed of Surface Sediments in South China Sea. J. Asian Earth Sci. 2014, 89, 46–53. [Google Scholar] [CrossRef]
- Yuan, Y.; Zhu, W.; Mi, L.; Zhang, G.; Hu, S.; He, L. “Uniform Geothermal Gradient” and Heat Flow in the Qiongdongnan and Pearl River Mouth Basins of the South China Sea. Mar. Pet. Geol. 2009, 26, 1152–1162. [Google Scholar] [CrossRef]
- Wang, H.B.; Liang, J.; Gong, Y.H.; Huang, Y.Y.; Liu, X.W.; Sha, Z.B. Estimation of the Heat Flow in the Northern of the South China Sea Based on the Seismic Data of Gas Hydrate. Geoscience 2005, 19, 67–73. (In Chinese) [Google Scholar]
- Wu, L.S.; Yang, S.X.; Liang, J.Q.; Su, X.; Yang, T.; Zhang, X.; Cheng, S.H.; Lu, H.F. Geochemical characteristics of sediments at Site HQ-48PC in Qiongdongnan area, the north of the South China Sea, and their implication for gas hydrates. Geoscience 2010, 24, 534–544. (In Chinese) [Google Scholar]
- Mao, S.D.; Duan, Z.H.; Zhang, D.H.; Shi, L.L.; Chen, Y.L.; Li, J. Thermodynamic modeling of binary CH4–H2O fluid inclusions. Geochimica et Cosmochimica ACTA 2011, 75, 5892–5902. [Google Scholar] [CrossRef]
- Reed, M.H. Calculation of Multicomponent Chemical Equilibria and Reaction Processes in Systems Involving Minerals, Gases and an Aqueous Phase. Geochimica et Cosmochimica ACTA 1982, 46, 513–528. [Google Scholar] [CrossRef]
- Steefel, C.I.; Lasaga, A.C. A Coupled Model for Transport of Multiple Chemical Species and Kinetic Precipitation/Dissolution Reactions with Application to Reactive Flow in Single Phase Hydrothermal Systems. Amer. J. Sci. 1994, 294, 529–592. [Google Scholar] [CrossRef]
- Yeh, G.T.; Tripathi, V.S. A Model for Simulating Transport of Reactive Multispecies Components: Model Development and Demonstration. Water Resour. Res. 1991, 27, 3075–3094. [Google Scholar] [CrossRef]
- Xu, T.; Sonnenthal, E.; Spycher, N.; Pruess, K. Toughreact—A Simulation Program for Non-Isothermal Multiphase Reactive Geochemical Transport in Variably Saturated Geologic Media: Applications to Geothermal Injectivity and CO2 Geological Sequestration. Comput. Geosci. 2006, 32, 145–165. [Google Scholar] [CrossRef]
- Lasaga, A.C.; Soler, J.M.; Ganor, J.; Burch, T.E.; Nagy, K.L. Chemical Weathering Rate Laws and Global Geochemical Cycles. Geochimica et Cosmochimica ACTA 1994, 58, 2361–2386. [Google Scholar] [CrossRef]
- Palandri, J.L.; Kharaka, Y.K. A Compilation of Rate Parameters of Water mineral Interaction Kinetics for Application to Geochemical Modeling; Open-File Report 2004-1068; Geological Survey: Menlo Park, CA, USA, 2004. [CrossRef]
Figure 1.
Vertical distribution of barite content at the T1 station of Qiongdongnan Basin [28].
Figure 1.
Vertical distribution of barite content at the T1 station of Qiongdongnan Basin [28].

Figure 2.
Geographical location of the research area.
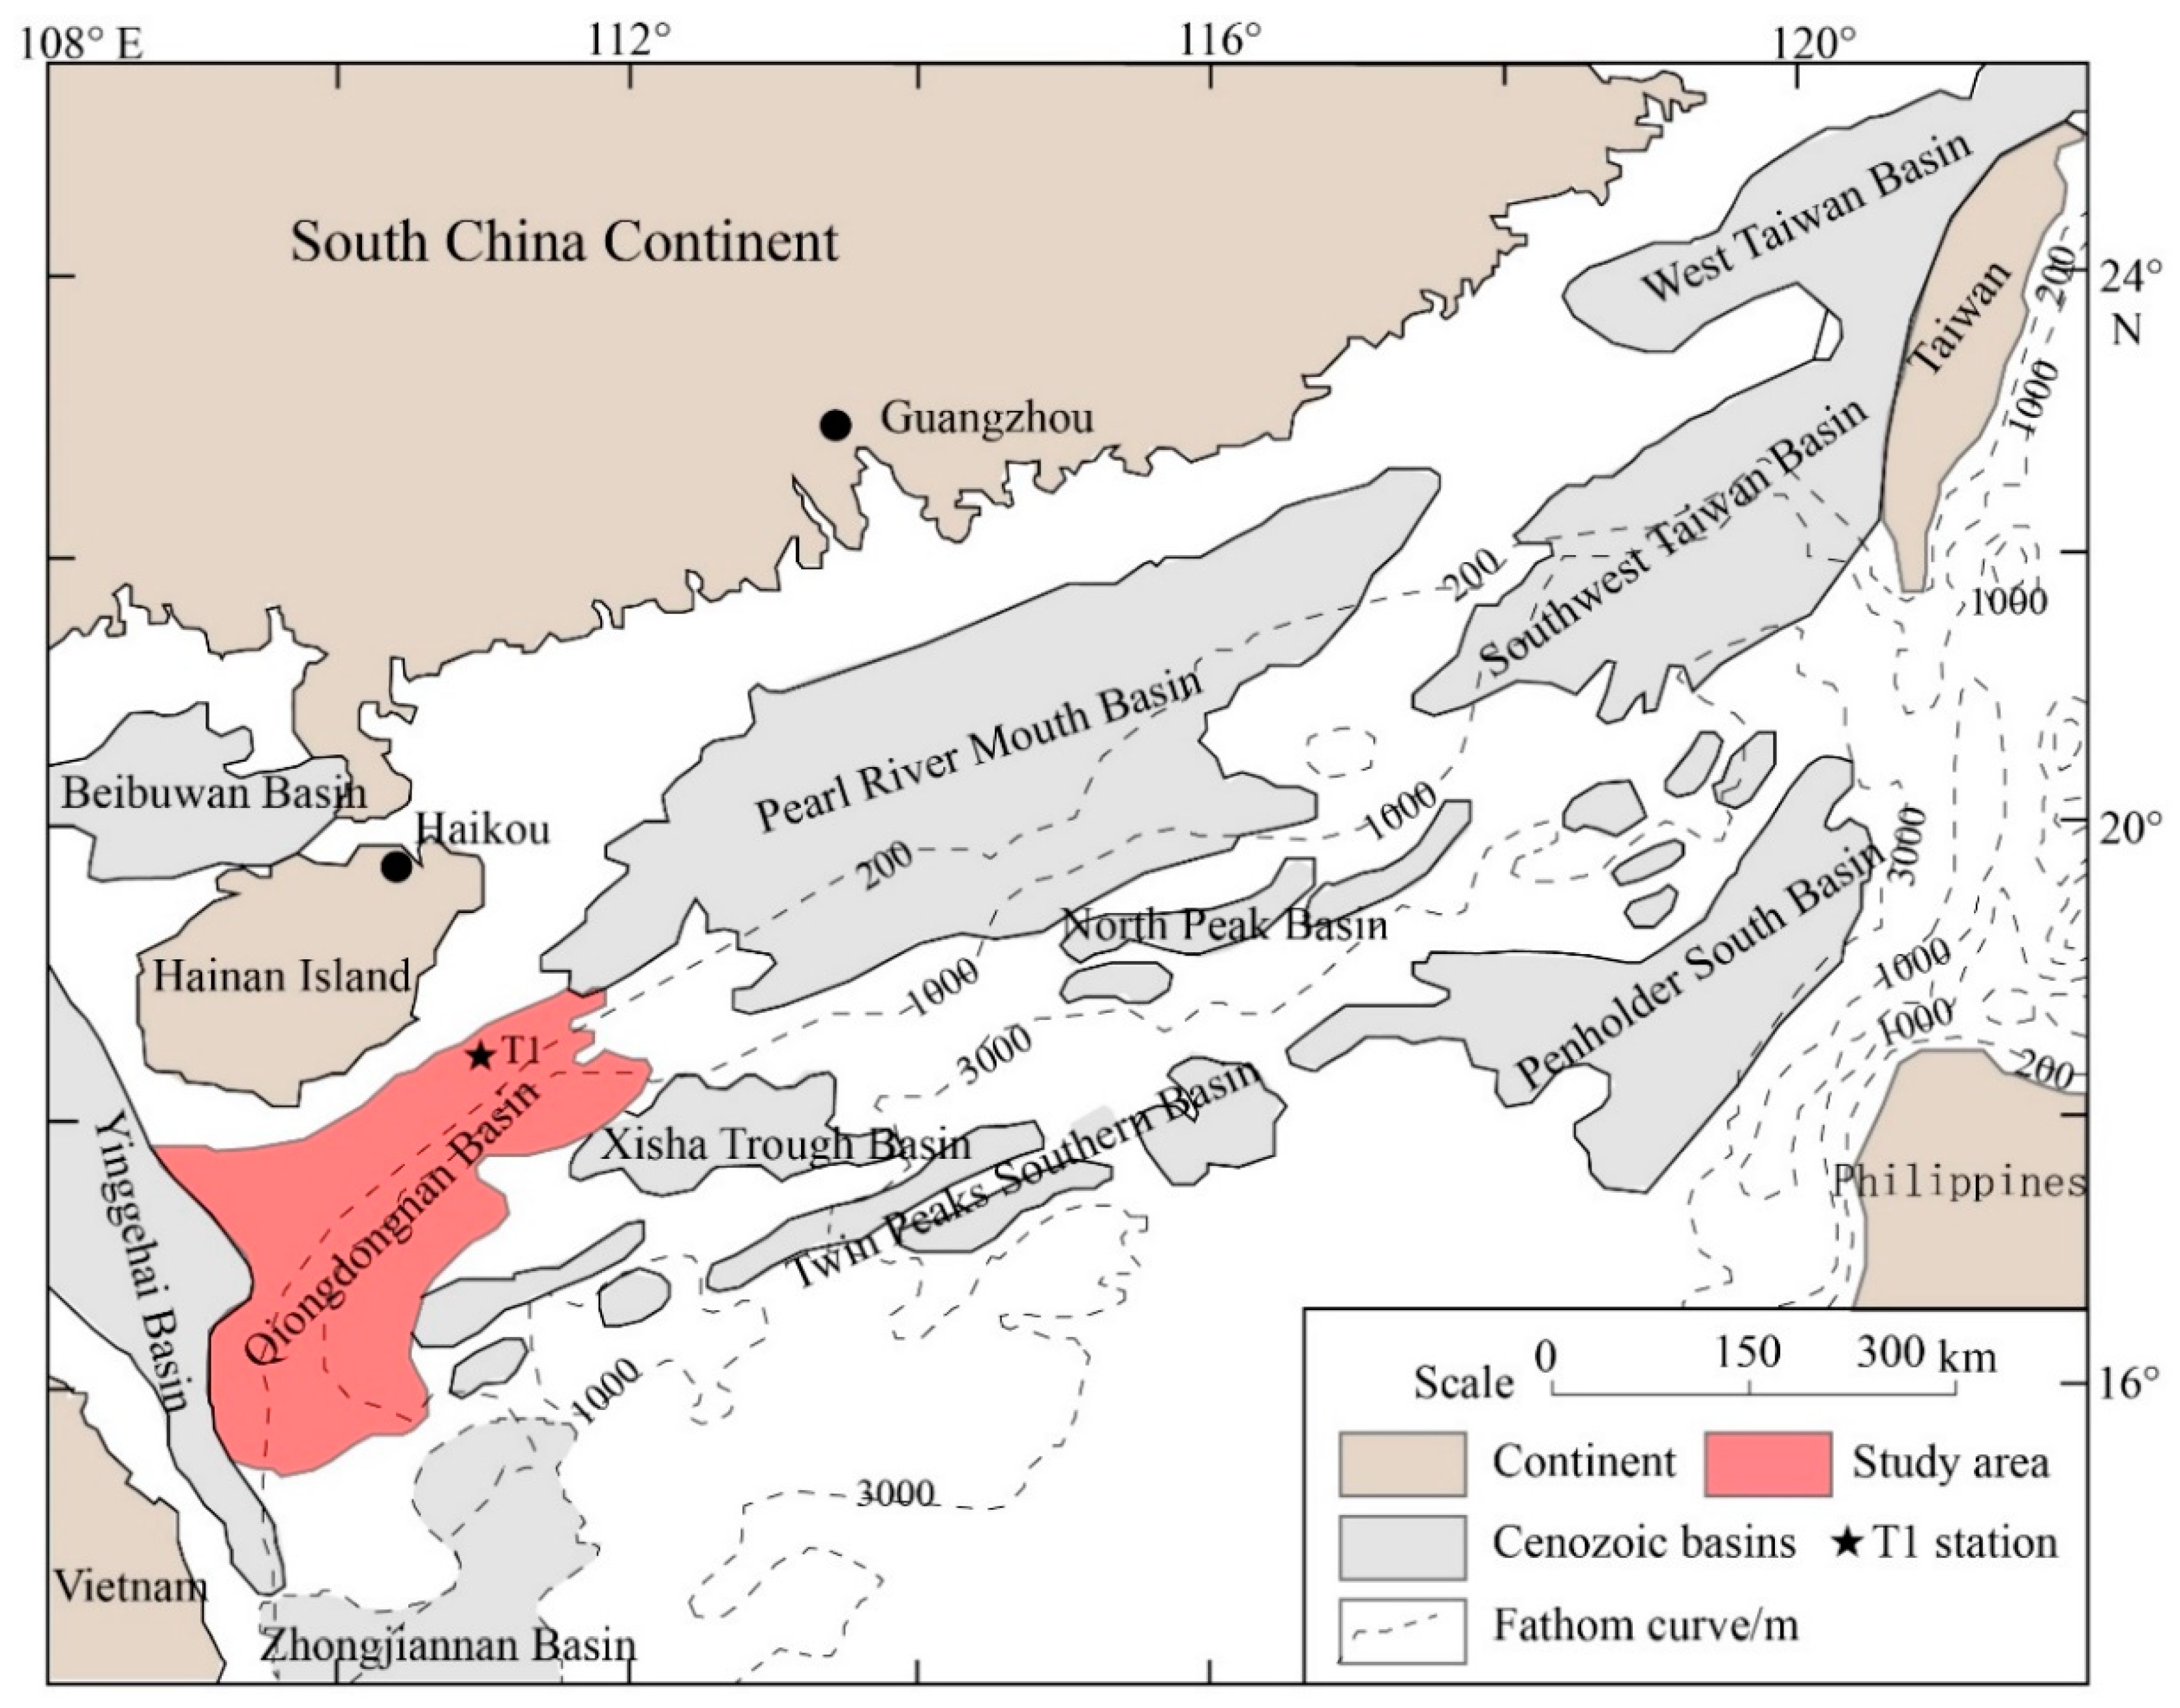
Figure 3.
One-dimensional model (left) and vertical column grid subdivision scheme (right).

Figure 4.
The simulation result of Base-case 1 (a–d) and Base-case 2 (e–h) at 100,000 years. (a) Concentration of barium. (b) Concentration of sulfate. (c) Volume fraction changes of barite. (d) Volume fraction changes of calcite. (e) Concentration of barium. (f) Concentration of sulfate. (g) Volume fraction changes of barite. (h) Volume fraction changes of calcite.

Figure 5.
Main chemical reactions during the formation of barite front.

Figure 6.
Relationship between methane leakage flux and authigenic minerals. (a) Location of Barite front with flux. (b) Volume fraction change of barite. (c) Volume fraction change of calcite.
Figure 6.
Relationship between methane leakage flux and authigenic minerals. (a) Location of Barite front with flux. (b) Volume fraction change of barite. (c) Volume fraction change of calcite.

Figure 7.
Schematic diagram of reactions at low/high methane flux condition (the arrow indicates relative richness or depletion).
Figure 7.
Schematic diagram of reactions at low/high methane flux condition (the arrow indicates relative richness or depletion).

Figure 8.
Diagram of methane leakage flux vs. the changing vol. fraction of barite to calcite (Cases 1–4 are used for regression analysis, and Cases 5–7 for verification).
Figure 8.
Diagram of methane leakage flux vs. the changing vol. fraction of barite to calcite (Cases 1–4 are used for regression analysis, and Cases 5–7 for verification).

Figure 9.
The results of the barite-forming process of the barite front. (a) Concentration of CH4 and SO42− at high methane flux. (b) Concentration of CH4 and SO42− at low methane flux. (c) Paleotypal barite front at high methane flux. (d) Modern barite front at low methane flux.
Figure 9.
The results of the barite-forming process of the barite front. (a) Concentration of CH4 and SO42− at high methane flux. (b) Concentration of CH4 and SO42− at low methane flux. (c) Paleotypal barite front at high methane flux. (d) Modern barite front at low methane flux.


Table 1.
Biogeochemical parameters. AOM: anaerobic oxidation of methane.
| Parameters | Meaning | Value | Unit |
|---|---|---|---|
| Half-saturated constant of methane | 1.5 × 10⁻³ | mol/L | |
| Half-saturated constant of sulfate | 1.0 × 10⁻³ | mol/L | |
| Maximum reaction rate of AOM | 1.62 × 10⁻⁹ | mol/L/s | |
| Minimum reaction concentration of methane | 1.0 × 10⁻⁹ | mol/L | |
| Minimum reaction concentration of sulfate | 6.0 × 10⁻⁹ | mol/L |
Table 2.
Physical parameters of the sediment.
| Parameters | Value | Parameters | Value |
|---|---|---|---|
| Rock density | 2600 kg/m3 | Top pressure | 151 bar |
| Pore water density | 1025 kg/m3 | Top temperature | 3.3 °C |
| Porosity | 0.613 | Geothermal gradient in sediment | 3.76 °C/100 m |
| Permeability | 10−15 m2 | Sediment heat conductivity | 1.7 W·m−1·K−1 |
Table 3.
Initial water.
| Components | Sea Water Components (Top Boundary Water) (mol/L) | Sedimentary Water (mol/L) | Bottom Boundary Water (mol/L) |
|---|---|---|---|
| Ca2+ | 1.06 × 10⁻² | 1.06 × 10⁻² | 1.06 × 10⁻² |
| Mg2+ | 5.31 × 10⁻² | 5.31 × 10⁻² | 5.31 × 10⁻² |
| Na+ | 4.96 × 10⁻¹ | 4.96 × 10⁻¹ | 4.96 × 10⁻¹ |
| K+ | 1.23 × 10⁻² | 1.23 × 10⁻² | 1.23 × 10⁻² |
| Ba2+ | 6.00 × 10⁻⁷ | 6.00 × 10⁻⁷ | 6.00 × 10⁻⁷ |
| Fe2+ | 5.14 × 10⁻⁴ | 5.14 × 10⁻⁴ | 5.14 × 10⁻⁴ |
| SO42- | 2.82 × 10⁻² | 1.00 × 10⁻⁶ | 1.00 × 10⁻⁶ |
| HCO3- | 2.00 × 10⁻³ | 2.00 × 10⁻³ | 2.00 × 10⁻³ |
| Cl- | 5.53 × 10⁻¹ | 5.53 × 10⁻¹ | 5.53 × 10⁻¹ |
| CH4(aq) | 1.00 × 10⁻⁶ | 1.00 × 10⁻⁶ | 1.54 × 10⁻¹ |
Table 4.
Initial mineral composition.
| Minerals | Volume Fraction (%) | Saturation Index (SI) | Minerals | Volume Fraction (%) | Saturation Index (SI) |
|---|---|---|---|---|---|
| Quartz | 15.3 | −1.98948 | Barite | 22.3 | −6.46652 |
| Illite | 25.6 | 9.26616 | Chlorite | 13.1 | −0.88747 |
| Kaolinite | 13.5 | 7.10012 | Albite | 2.3 | −0.75465 |
| Calcite | 7.9 | −6.83590 |
Table 5.
Design of simulated cases.
| Schemes | Methane Leakage Flux/mmol·cm−2·a−1 | Corresponding Saturated Flow/kg·s−1 |
|---|---|---|
| Base-case 1 | 5.95 × 10⁻³ (according to reports) | 1.2232 × 10⁻⁸ |
| Base-case 2 | 0 (no methane flux) | 1.2232 × 10⁻⁸ |
| Case 1 | 2.975 × 10⁻³ (0.5 times to Base-case 1) | 6.1160 × 10⁻⁹ |
| Case 2 | 2.975 × 10⁻² (5 times to Base-case 1) | 6.1160 × 10⁻⁸ |
| Case 3 | 5.95 × 10⁻² (10 times to Base-case 1) | 1.2232 × 10⁻⁷ |
| Case 4 | 1.19 × 10⁻¹ (20 times to Base-case 1) | 2.4464 × 10⁻⁷ |
| Case 5 | 4.46 × 10⁻³ (0.75 times to Base-case 1) | 9.1700 × 10⁻⁹ |
| Case 6 | 4.46 × 10⁻² (7.5 times to Base-case 1) | 9.1700 × 10⁻⁸ |
| Case 7 | 8.93 × 10⁻² (15 times to Base-case 1) | 1.8300 × 10⁻⁷ |
© 2019 by the authors. Licensee MDPI, Basel, Switzerland. This article is an open access article distributed under the terms and conditions of the Creative Commons Attribution (CC BY) license (http://creativecommons.org/licenses/by/4.0/).
Share and Cite
MDPI and ACS Style
Xu, T.; Shang, S.; Tian, H.; Bei, K.; Cao, Y. Numerical Simulation on Authigenic Barite Formation in Marine Sediments. Minerals 2019, 9, 98. https://doi.org/10.3390/min9020098
AMA Style
Xu T, Shang S, Tian H, Bei K, Cao Y. Numerical Simulation on Authigenic Barite Formation in Marine Sediments. Minerals. 2019; 9(2):98. https://doi.org/10.3390/min9020098
Chicago/Turabian StyleXu, Tianfu, Songhua Shang, Hailong Tian, Keqi Bei, and Yuqing Cao. 2019. "Numerical Simulation on Authigenic Barite Formation in Marine Sediments" Minerals 9, no. 2: 98. https://doi.org/10.3390/min9020098
Note that from the first issue of 2016, this journal uses article numbers instead of page numbers. See further details here.