Article

Biogeochemical Cycle of Lanthanides in a Light Rare Earth Element-Enriched Geological Area (Quebec, Canada)

1
LIEC, CNRS, UMR 7360, Université de Lorraine, Campus Bridoux, Bâtiment IBISE, 8 rue du General Delestraint, 57070 Metz, France
2
Marine Research Institute (IIM-CSIC), Eduardo Cabello 6, 36208 Vigo, Spain
3
GeoRessources, Université de Lorraine, CNRS, F-54000 Nancy, France
4
Département des Sciences de la Terre et de l’Atmosphère, Université du Québec à Montréal, 201, ave. du Président-Kennedy, Montréal, QC H2X 3Y7, Canada
5
Ressources Geoméga, 75 Boulevard de Mortagne, Boucherville, QC J4B 6Y4, Canada
*
Author to whom correspondence should be addressed.
Minerals 2019, 9(10), 573; https://doi.org/10.3390/min9100573
Submission received: 26 June 2019 / Revised: 13 September 2019 / Accepted: 16 September 2019 / Published: 20 September 2019

Abstract

:
This work investigated a rare earth element (REE) natural biogeochemical cycle in an area with a light rare earth element (LREE)-rich ferrocarbonatite intrusion. An REE determination in this geological environment allowed us to trace REE natural transfers in order to better manage future REE mining exploitations. Our findings suggest that although REE concentrations in abiotic compartments (soil and freshwater systems) and biotic samples (terrestrial and aquatic plants) were low, the LREE fractionation observed in the parent material was maintained along compartments. Additionally, Nd anomalies observed in the sediment pore water suggest a potential different biogeochemical cycle of this element in aquatic systems. According to the potential bioaccumulation of REEs in the organisms of two studied plants belonging to terrestrial and aquatic compartments, Equisetum arvense L. and Typha latifolia L. (respectively), we observed that REEs were not accumulated and that they showed limited REE transfer inside plants, but with an increased uptake of Eu relative to the other REEs. Our results indicated a low mobility and transfer of REEs from REE-rich bedrocks in a natural area toward terrestrial and freshwater systems, but also pointed to a dilution of the REE content in the different compartments, maintaining the LREE fractionation. Our findings provide new knowledge about the REE biochemical cycle in a natural area (from rocks to plants) and represent a starting point for an environmentally friendly exploitation of future REE mining areas.

1. Introduction

Rare earth elements (REEs) comprise the lanthanide group from lanthanum (atomic number, Z = 57) to lutetium (Z = 71) as well as two transition elements: yttrium (Z = 39) and scandium (Z = 21) [1]. They are naturally present in the environment, where they form a chemical group [2] of similar characteristics. Even though a recent study reported REE enrichment of more than 9000 mg kg−1 in peraluminous pegmatitic granites in Grenville Province (Quebec) [3], lanthanides are more generally associated with alkaline magmas such as peralkaline silicate rocks and carbonatites [4]. The REE group can be divided essentially into three subgroups—LREEs (light rare earth elements), MREEs (middle rare earth elements), and HREEs (heavy rare earth elements)—but their division is usually limited to LREEs and HREEs based on ionic radii [5].
The demand for REEs and their subsequent mining exploitation have dramatically increased over the last years [6]: They are mainly used for high-tech applications, e.g., in energy-efficient lighting, permanent magnets for wind turbines, batteries for hybrid and electric vehicles, digital cameras, optical glasses, catalysts, or metal alloys [7]. In 1995, REE world mining production was 72 kt year−1, and it reached up to 130 kt year−1 in 2017. China, the largest REE producer and consumer, has estimated its own consumption will be up to 149 kt in 2020, i.e., more than current worldwide production [8]. The determination of the natural cycle of REEs in natural compartments located in REE-rich geological environments will be essential to (i) predict potential natural risks associated with REE transfer from naturally enriched rocks to environmental compartments and to (ii) provide clues for a better understanding of the anthropogenic REE impact in future REE mining sites. To date, only a few studies have dealt with the distribution of REEs in natural areas (nonanthropogenically modified and far from industrial activities) [9]. Brioschi et al. [7] studied the REE transfer from natural soils to plant systems, and they were the first to report that soil formation and its REE enrichment is dependent on bedrock type. More specifically, they found HREE enrichment in their studied soils. These results are in agreement with Öhlander et al. [10], who showed that soil formation leads to HREE enrichment and LREE depletion. Chevis et al. [11] demonstrated that REE transport can be constrained by sediment characteristics (e.g., mineralogy or Fe content), as shown by the flux of REEs in a sandy subterranean estuary. This implies that different ligands and environmental parameters will affect their distribution and therefore their availability [12]. The bioaccumulation of REEs in living organisms has also been studied during the last years, and in aquatic organisms it was observed that REE contents are higher in zooplankton and benthos than in fish [13], with the highest accumulation in bottom-dwelling organisms [14]. However, the evolution of REE transfer from rock material to other environmental compartments remains unconstrained.
This study aims to reveal the cycle of REEs in a natural area from REE-rich geological material. The study area was located at the junction between the Opatica and the Abitibi subprovinces (Québec, Canada), and it was composed of a main deposit (Montviel) that corresponds to an intrusion of an alkaline magmatic complex dominated by ferro-, calcio-, and silicocarbonatites [15]. The area was discovered in 1895 [16], but the carbonatite was not discovered until 1974 [17]. The area was explored for Fe and then for Nb and more recently for P, Nb, Th, fluorite, barite, Cu, and platinum-group metals, but mostly for REEs [16,17,18]. Indeed, the estimated mineral resources are 266.6 Mt, with a total rare earth oxide grade (TREO) of 1.45% (all categories) [19]. However, no production has been carried out in the area yet. Accordingly, this site represents a perfect natural laboratory to study the evolution of the natural REE transfer from bedrock material to other environmental compartments.
In this study, we report and compare REE contents and fractionation from (i) various facies of the Montviel REE-rich carbonatite, which represents the main REE source, and from the range of environmental compartments to which they could transfer, namely (ii) soils, (iii) sediments and pore water, (iv) river water and suspended material in water, and (v) different parts of two plants found in the zone: the aquatic Typha latifolia L. (stem, leaf, and root) and the terrestrial Equisetum arvense L. (stem and leaf). The REE concentrations obtained for all of the studied compartments were low compared to rock material present in the area, but the LREE fractionation observed in the parent material was maintained along compartments. The results suggest that (i) a dilution of REEs occurred in the biogeochemical cycle, with the highest contents in the solid fractions (soils and sediments); that (ii) Nd underwent a differentiated aquatic biogeochemical cycle compared to the other studied REEs; and that (iii) REEs did not accumulate and did not translocate inside the investigated terrestrial and aquatic plants. The natural REE cycle studied in this work will provide background information for REE biogeochemical transfer in future REE mining sites.

2. Materials and Methods

2.1. Location of the Study Area and Geological Description

This study focused on the Montviel carbonatitic intrusive complex ca. 80 km east from Matagami and ca. 150 km west from Chibougamau (Québec, Canada). Representative lithological units were collected from distinct drill holes performed by GéoMégA Resources Inc. (Montreal, QC, Canada) in the Montviel complex (49°49′28.7″ N, 76°31′46.4″ W). These samples included (i) a polygenic breccia with a black aphanitic silicocarbonatite matrix, (ii) a ferrocarbonatite alternating with decametric apatite-rich sections, (iii) a greenish-brown silicocarbonatite with minor ferrocarbonatite (up to 5% of the total volume), and (iv) a gray pyroxenite (Figure 1). A total of seven sampling sites were selected according to the different rock materials present in the area and the existence of a watercourse nearby. Three sampling sites were located in the upper part of the carbonatite rock: B1 (ferrocarbonatite) and B2 (silicocarbonatite) were located near stream B, and N2 (polygenic breccia) was located near the Nomans River (Figure 1a). Three sampling sites were located downstream of the carbonatite intrusion: A1 (above tonalite) and A2 (above pyroxenite) were near stream A, and N1 (above pyroxenite) was near the Nomans River (Figure 1a). The last sampling site, N0, was located near the Nomans River at the boundary between the tonalite and the basalt material upstream of the ferrocarbonatite intrusion (Figure 1a). Detailed mineralogical, geochemical, and petrogenesis studies of the Montviel geological area have been provided in previous works [15,18,20,21,22,23].

2.2. Sampling Procedures

Four different rock types, designated as parent material (PM), were sampled. They corresponded with the four rock types that were drilled during the exploration operations of the GéoMégA Company. They corresponded with the three carbonatite samples (ferrocarbonatite (B1), silicocarbonatite (B2), and polygenic breccia (N2)) and with the pyroxenite material (A2).
River surface waters (RWs) in the 7 sites were sampled directly in the field by a portable filtration device with a manual pressure bomb. Water-suspended materials (SMs) were collected directly in filters using the same equipment. A filtration device was rinsed with a solution of 30% hydrochloric acid and natural water (1:10) before sampling in each site. A control filter was stored after the cleaning procedure. The selected filters for retaining the water-suspended materials were made from cellulose acetate membranes with a pore size of 0.45 µm (OE67 Grade, Schleicher & Schüll®, Dassel, Germany). River surface waters were stored in polypropylene tubes (VWR® Metal-Free Centrifuge Tubes). These were previously rinsed with diluted solution of 65% HNO3 and ultrapure water (Milli-Q®, Merck) (1:10). Samples were acidified with 1% HNO3 and stored in a cooler. The filters were placed in Petri dishes, transported to a laboratory, and dried over 5 d at 55 °C. Filter dry weights were recorded.
Soil samples (SOs) were collected near the riverside in 5 of the 7 studied sites. Two sites could not be sampled, one (N2) because it is only accessible using a boat and the other (B2) because of its deep (>50 cm) and wide (100% cover) organic layer (O Horizon). Upper organic layers (O Horizons) were carefully removed, and the soil samples were collected from the first 10 cm using a plastic hand shovel and were stored in rinsed polypropylene tubes. They were carefully placed in their corresponding tubes and stored in a cooler for their transport in order to avoid a modification of soil structure and aeration.
Sediment samples (SEs) were collected from the seven sampling sites by a strainer for the first 10 cm of sediments located in the riverbank. Samples were stored in previously rinsed polypropylene tubes following the procedure detailed above. Tubes were filled to the brim to reduce oxygen exposure, and overlying water was removed through small manual pressure. Samples were stored in a dark cool place for their transport. Once in the laboratory, sediment pore water extractions (PWs) were obtained by centrifuging aliquots of 50 mL of sediments over 20 min at 4000 rpm (Heraeus Multifuge X3, Thermo Scientific).
The aquatic plant Typha latifolia L. (TY) and the terrestrial plant Equisetum arvense L. (EQ) were collected manually, where present, in the sampling sites. These two species were selected because they both appeared over ferrocarbonatite rock in the B1 site. Typha latifolia L. was also found in the N2 and A2 sites, whereas EQ was present at 4 additional sites: N0, N1, A1, and A2. When possible, the plant material was divided into leaves, stems, and roots. Selected parts were gently cleaned with tap water to remove any adhered particle and later recleaned with ultrapure water. Samples were then stored in labeled paper bags and dried over 5 days at 55 °C. After that, dried samples were finely milled.
For all the studied fractions, replicates were not included in the sampling due to the high number of samples and technical constraints in the transport. A graphical description of the sampled material is summarized in Figure 1b. All samples were analyzed within the 3 months following sampling.

2.3. Physicochemical Extractions and Analyses

Parent material (PM) samples were analyzed for whole-rock geochemistry from NQ-sized half-cores (core diameter of 47.6 mm). The dried rock powders obtained from the cores (~20–50 g) were added to lithium metaborate flux (FUS-LI01) and fused in a furnace at 1000 °C. The resulting melts were cooled and dissolved in 100 mL of 4% HNO3 (65%) to 2% HCl (30%) solution. The obtained solutions were then analyzed through inductively coupled plasma atomic emission spectroscopy (ICP-AES) for major elements, and trace elements were measured through ICP mass spectrometry (ICP-MS) after Li-metaborate fusion. For these analyses, three certified standards were used (OKA-1, OKA-2, and OREAS-146). Silica sand with an average of 32 mg kg−1 Ce was used as a standard sample during the sampling and subsequent analysis to discard any possible contamination. Rock analyses were performed by ALS Minerals (Val d’Or, QC, Canada): a more descriptive methodology can be consulted in Reference [15].
To measure the environmentally available content of REEs in sediment (SE) and soil (SO) as the fraction potentially accessible to living organisms [13], a partial extraction of ~0.5 g of dried powdered material was performed by digestion in Teflon vessels with an acid mixture of HNO3/HCl (7:3 ratio) at 60 °C over 48 h [13,24]. Suspended material in filters (SM) (average mass ~0.1 g of dried material) and dried plant material (TY, EQ) (average mass ~0.2 g of dried material) were digested by a mixture of HNO3/H2O2 (10:2 ratio) under similar conditions. The REEs and other trace elements were determined on liquid samples for SE, SO, SM, TY, EQ, PW, and RW through ICP-MS (ICP-MS NEXION 300D spectrometer, University of Granada, Granada, Spain). Instrument measurements were carried out in triplicate using Rh as an internal standard. A blank and a replication of a previously measured sample were analyzed (10–15 samples) in order to validate the analytical procedure. The detection limit, calculated as the mean concentration plus three times the standard deviation, for all of the different lanthanide contents measured in the blank ranged between 0.001 and 0.043 ppb. The quantification limit, calculated as the mean concentration plus 10 times the blank standard deviation, ranged between 0.003 and 0.120 ppb. The accuracy of the selected methodology was evaluated through the selection and analysis of several reference materials following the same experimental procedures as the samples. Estuarine sediment (BCR-667) was selected as a reference for SE and SO and was digested with a HNO3/HCl mixture. The BCR-667 average recovery for REEs was 55 ± 12%. Mussel tissue material (BCR-668) and aquatic plant material (BCR-670) were also digested in addition to BCR-667 to validate the digestion procedure completed by HNO3/H2O2 (SM, TY, EQ). The average recoveries for this procedure were 61 ± 14%, 104 ± 30%, and 74 ± 18% for BCR-667, BCR-668, and BCR-670, respectively. The obtained REE patterns for the reference materials did not show differences from the patterns of the certified values; therefore, REE fractionation through the selected digestion procedures could be discarded. SPS-SW1 Batch 120 was selected as a reference material for river water (RW) and pore water (PW). In this case, the recovery was 99 ± 4%. This liquid material was not treated before analysis, and thus the partial recoveries in the other reference materials were due to the selected digestion procedures (environmentally available REE content) and not to the measuring equipment.

2.4. Data Analyses

To describe the REE distribution in parent material, values were normalized to chondrite [25] and to North American shale composite (NASC) [26]. The REE contents of the other studied abiotic (SO, SE, PW, RW, SM) and biotic (EQ, TY) samples were normalized to NASC [26]. After normalization, the La[N]/Yb[N] ratio was calculated to quantify the fractionation of the LREEs over the HREEs, with [N] referring to the corresponding normalized value. The Eu and Nd anomalies were quantified using the Eu/Eu* and Nd/Nd* ratios, respectively, as follows:
Eu/Eu* = Eu[N]/((Sm[N] + Gd[N])/2)
Nd/Nd* = Nd[N]/((Pr[N] + Sm[N])/2)
Bioaccumulation factors (BAFs) and bioconcentration factors (BCFs) were calculated to compare plant REE accumulation. Specifically, BAFs were obtained by normalizing the REE content of terrestrial (EQ) and aquatic (TY) plant materials (mg kg−1) to the soil and to sediment, respectively. BCFs were calculated on the basis of both river surface water (RW) (mg L−1) and sediment pore water (PW) (mg L−1) to trace the metal accumulation of the aquatic plant (TY), which could be taken directly from water courses.
Translocation factors (TFs) were calculated in the studied plants from leaves to stems (TF1) and from stems to roots (TF2) to assess the potential translocation of REEs. They were calculated as follows: TF = C1/C2, with C1 corresponding to the leaf value for TF1 and the steam value for TF2 and C2 corresponding to metal concentrations (μg g−1) in the stem (TF1) and in the root (TF2). A TF value above 1 indicates efficient metal translocation by the plant.
Finally, the biogeochemical cycle of REEs was assessed using LREE/(MREE + HREE) ratios that were calculated for all sampled materials, with LREE corresponding to lanthanides between La and Nd (both included) and MREE and HREE to the other lanthanides (Pm omitted). The obtained ratios were compared to each other and to the NASC ratio, which is commonly used as a standard composition. The differences between the means of the ratios obtained for each sampling site were compared using ANOVA and a post hoc Tukey’s test (p < 0.05). All of the statistical analyses were performed using SPSS v.20.0 (SPSS Inc., Chicago, IL, USA), and the graphical analysis representation relied on Microsoft Excel (v. 2013). Graphical representations of the normalized ratios presented in this document are plotted on a log scale.

3. Results and Discussion

3.1. REE Distribution in the Parent Material

The ferrocarbonatite (B1) was the most REE-enriched parent material (PM) among the four investigated in this study, with an average REE content of 12,079 mg kg−1 (Table S1). The polygenic breccia with a silicocarbonatite matrix (N2), greenish-brown silicocarbonatite with minor ferrocarbonatite (up to 5% of the total volume) (B2), and gray pyroxenite (A2) contained an average REE content of 7150 mg kg−1, 1750 mg kg−1, and 1598 mg kg−1 (Table S1), respectively. All parent materials showed a steep chondrite-normalized REE pattern with no Eu anomaly (Eu/Eu* ranging from 0.97 to 1.06, Figure 2, Table S1) and a strong fractionation of the LREE over the HREE (La[N]/Yb[N] ranging from 46 to 400, Figure 2, Table S1). In addition, the ferrocarbonatite matrix (B1) showed a slight positive Nd anomaly (Nd/Nd* of 1.64, chondrite-normalized, Figure 2a, Table S1). The North American shale composite (NASC)-normalized REE patterns of all parent materials were also characterized by a strong fractionation of the LREE over the HREE and presented slightly positive Eu and Nd anomalies, as shown by an Eu/Eu* ranging from 1.07 to 1.70 (Figure 2b, Table S1) and by an Nd/Nd* ranging from 0.90 to 1.56 (NASC-normalized, Figure 2b, Table S1).
REEs are usually concentrated in most evolved melts from the continental crust (e.g., Chakhmouradian and Wall [4]). Accordingly, the pyroxenite from sampling site N1 and the basalt from sampling site N0 (Figure 1) were expected to have very low REE contents (not higher than tens of ppm) [22]. In the same way, the tonalite (A1) was expected to have higher REE contents than the pyroxenite and the basalts due to its higher differentiation, but lower contents than the REE-rich carbonatite, i.e., not higher than a few hundreds of ppm, as shown by the REE content of ca. 113 ppm of a more evolved granite in the area [22].
The results show that the ferrocarbonatite (B1) facies investigated in this study had REE contents that were 1.7 to 7.6 times higher than other parent materials. In addition, the ferrocarbonatite was essentially an LREE-rich lithology, as shown by the La[N]/Yb[N] ratio (chondrite-normalized) of 400 (Figure 2a, Table S1).

3.2. Soil–Plant Distribution of REEs

Figure 3 presents the NASC-normalized rare earth element (REE) patterns for the studied soils (Figure 3a) and the stem (Figure 3b) and leaf (Figure 3c) REE contents normalized to their respective soils. The NASC-normalized REE patterns for soils (Figure 3a) show that soil samples A1, A2, and B1 had similar REE contents and values that were around twice as high as soil samples N0 and N1. In addition, we observed that the LREE values were higher than the unit (corresponding to LREE enrichment) in samples A2 (for La, Ce, Pr, Nd, Sm, and Eu), A1 (Ce, Nd), and B1 (La, Ce, Pr). In the E. arvense plant, the greatest REE concentrations were reported in all cases for EQ stems, and the higher REE accumulations appeared in both the stems and leaves of samples above N0, N1, and B1. The mean REE content in plants suggests that there was not necessarily a correlation with the content observed in the soils (Table 1), i.e., soils with the highest REE contents did not necessarily contain the REE-richest plants. A fractionation of the LREEs over the HREEs observed in soils was also observed in the studied plant samples (Figure 3, Table 1). The NASC-normalized REE patterns of both stems and leaves from sampling sites N0, N1, and B1 showed positive Eu anomalies (Figure 3). On the other hand, the ubiquitous slightly positive Nd anomalies observed in the soils were not detected in plant material (Figure 3). The NASC-normalized La[N]/Yb[N] ratios of the soil samples, stems, and leaves ranged from 3.9 to 15.4, from 3.6 to 15.0, and from 4.0 to 35.1 (Table 1), respectively. These features attested to a lower fractionation of the LREEs over the HREEs compared to the one observed in the parent material. On the other hand, the stems and leaves of Equisetum arvense L. (EQ) showed no fractionation of the LREEs over the HREEs in their soil-normalized REE patterns (Figure 3b,c). These contrasted fractionations of the LREEs over the HREEs between soils and plant stems and leaves point to (i) a more efficient assimilation of the HREEs from the soils by the plant tissues compared to the LREEs, which could have been due to (ii) some form of LREE saturation of the plant tissues, leading to a relative uptake of the HREEs, therefore preventing the preservation of the fractionation of the LREEs over the HREEs in their soils.
Bioaccumulation factors (BAFs) are useful indicators for determining a plant’s ability to accumulate REEs with respect to soil concentrations. For the different terrestrial plant materials (leaves and stems), BAFs were calculated in reference to soils (Table 1). The obtained low BAF values (lower than 0.108) show that the REEs were not accumulated in the selected terrestrial plant. Translocation factors (TF1s) are used to indicate the limit or the efficient translocating action inside plants. The TF1s calculated between stems and leaves were in all cases lower than 1 (between 0.04 and 0.70, Table 1), which points to a limited transfer of the REEs inside plants.
The average environmentally available REE contents of the investigated soils ranged from 85 to 191 mg kg−1 (Table 1). These values were similar to those reported for an area in China (average of 179 mg kg−1) that is far from large populations, urbanization, and industrialization [27]. In the five studied soil samples, we only observed LREE enrichment in A1 (tonalite bedrock), A2 (pyroxenite bedrock), and B1 (ferrocarbonatite bedrock). It has been previously reported that REE concentrations in soils do not directly reflect bedrock concentrations [7], as was reflected in our study. In addition, elements can display different biogeochemical behaviors in natural weathering environments, and therefore differences in individual REE distributions are common [28]. Cerium was the most concentrated REE in the investigated soils, which is consistent with its natural predominance in the environment [27,29]. Even though the REE contents of the plant tissues presented in this study exceeded the limit of detection (Table S1), they were rather low and should therefore be interpreted carefully. The REE contents in the plant tissues as well as both BAF and TF1 factors indicated that REEs were not efficiently accumulated in the terrestrial plants sampled in our study area. There were no data showing that plants were dependent on REEs to grow [29]. The total REE contents of the wild plants reported by Reference [27] ranged from 1.03 to 48.25 mg kg−1, which was similar to the results obtained in the present study (0.16–10.41 mg kg−1) (Table 1). While Reference [30] has stated that a lower REE content can be found in vascular plants from the eastern Canadian Arctic (0.15 mg kg−1), Reference [27] has also reported low bioaccumulation factors, indicating that REEs barely transfer from soils to plants. Additionally, E. arvense showed little REE content retained in the leaves, which points to an inefficient translocation to the aerial part of the plants.
The data presented in this study showed remarkable Eu anomalies for plant material. Among the lanthanides, Eu has the highest standard redox potential [31] and shows the highest ability to be adsorbed in soils [32], mainly due to the increase in soil pH and consequent Eu speciation in solution. Positive Eu anomalies in plants have been previously reported, e.g., in rice or wheat [33,34]. Ding et al. [34] have suggested that Eu can exhibit geochemically anomalous behavior due to its positive divalent state and have proposed that Eu positive anomalies in soils are related to the distribution of inorganic phosphorus, which retains Eu as a phosphate precipitate. In the present work, soil properties and other macro- and micronutrients in plants were not determined. Therefore, we could not evaluate the role of these parameters in the observed anomalies in the plants above the studied soils. To date, research on the Eu anomalies in plants is scarce, and in view of what we observed in this study, more information is needed to better understand the fate of Eu and its behavior in soil–plant distribution.

3.3. Sediment–Water Interphase Distribution of REEs

The NASC-normalized rare earth element (REE) patterns for the sediments (SEs) are represented in Figure 4a. Figure 4b shows the REE patterns of the sediment pore water (PW), river water (RW), and suspended material in rivers (SM) normalized to the respective sediment. Figure 4c presents the REE patterns of the different studied materials of the aquatic plant Typha latifolia L. (TY) normalized to the respective sediment. The total REE content in all aquatic fractions, along with the La[N]/Yb[N] fractionation factors, the Eu/Eu* and Nd/Nd* parameters, the BAFs, the bioconcentration factors (BCFs), and the TFs, are reported in Table 2.
Sediment samples showed similar NASC-normalized REE patterns (Figure 4a), with higher values for N0, N1, and A1. The latter corresponded with the highest REE environmentally available content, with an REE content of 184.9 mg kg−1 (Table 2). All of the studied sediments also showed a fractionation of the LREEs over the HREEs, as shown by La[N]/Yb[N], with the ratio ranging from 3.27 to 6.43 in the NASC-normalized REE patterns. Moreover, all sediment samples showed NASC-normalized REE patterns characterized by positive Nd anomalies, with an Nd/Nd* between 1.35 and 1.86 (Figure 4a, Table 2).
The highest REE contents from the liquid phases appeared in sediment pore water (PW), with average values 3 to 25 times higher than the REE content in the river (Figure 4b, Table 2). Among the samples, sample N0 had the highest REE content in PW, with an REE content of 99.4 µg L−1 (Table 2). The REE sediment-normalized patterns of PW showed a depletion of Nd for N2, A1, B1, and B2, which was supported by the low Nd/Nd* ratio calculated from NASC-normalized values (Table 2). River water showed similar REE contents from all sampling sites (average of 3.8 µg L−1), with slight positive Eu anomalies for samples B1 and B2 in sediment-normalized REE patterns (Figure 4b) and in NASC-normalized calculated Eu/Eu* ratios (Table 2). The suspended material showed REE contents between 0.3 (B2) and 5.7 (N1) mg kg−1 (Table 2), and REE patterns were normalized to their respective sediments with no Nd anomalies but a slight Eu negative anomaly in B1(Figure 4b, Table 2).
The highest REE contents of the selected aquatic plant (TY) were obtained from roots (2.35 mg kg−1) (Table 2). All of the investigated materials showed positive Eu anomalies in their sediment-normalized REE patterns (Figure 4c), which was supported by the positive values obtained for the Eu/Eu*ratios (Table 2). In all of the studied materials, the BAF values were commonly below 1, whereas the BCF values calculated from PW were between 8 and 169 and those calculated from RW were between 66 and 772, with higher values in the stems and leaves from sampling site B1 (Table 2). TF1 and TF2 were below 1, with the exception of TF1 from sampling site N2 (Table 2), which could be explained by (i) an REE transfer from stems to leaves and/or (ii) by the adsorption of REEs by atmospheric dust in aerial parts [35].
These features were consistent with the obtained La[N]/Yb[N] fractionation factors, which showed moderately fractionated LREEs over the HREEs in all aquatic compartments, with generally higher La[N]/Yb[N] ratios for ferrocarbonatite sampling site B1, both in abiotic and biotic samples (Table 2).
Brito et al. [36] studied the REE content in sediments and halophyte plants (Sarcocornia fruticosa and Spartina maritima) in research performed in a salt marsh with high human pressure. They reported REE contents in sediments ranging between 32 and 190 mg kg−1, which is similar to the values obtained in this study, although the sediments investigated in the Montviel area came from a zone that has not undergone human modification. On the other hand, the REE contents obtained from the aquatic Typha latifolia (TY) and terrestrial E. arvense (EQ) plants were far from those obtained from the halophyte plants analyzed by Reference [36], which are known to be good sequesters of metals. In the same study, no differences in the fractionation between the LREEs and the HREEs were observed between sediments and root plants. This supports the results presented here from the investigated plants, which showed LREE enrichment similar to the sediments with high La[N]/Yb[N] ratios in plants despite their low REE contents. The positive Eu anomalies observed in the REE patterns normalized to their respective sediments from both aquatic and terrestrial plant tissues indicated an increased uptake of Eu relative to the other REEs. This feature was also observed by Reference [30], who proposed that this could be due to (i) the reduction of Eu3+ to the more mobile Eu2+ under anoxic conditions or to (ii) the preferential transport of Eu3+ into biota due to similarities to Ca2+. In addition, the suggestion by Reference [34] that Eu anomalies in terrestrial plants could be related to the distribution of inorganic phosphorous should also be considered.
Chevis et al. [11] studied the flux of REEs in a sandy subterranean estuary, and their results revealed that sediment characteristics (e.g., mineralogy or Fe content) can constrain REE transport. Rare earth elements can form strong complexes with a number of different ligands, and the environmental parameters will affect their distribution and therefore their availability in the different natural compartments [12]. We observed the lowest REE contents in the sediment fractions above carbonatite rocks (sampling sites B1, B2), but all material sampled in the ferrocarbonatite site (B1) showed NASC-normalized REE patterns with high La[N]/Yb[N] ratios and positive Eu anomalies. MacMillan et al. [30] observed (after normalization to different compartments and organisms, including freshwater systems) a clear downward slope with LREE enrichment compared to HREE. In addition, positive Eu anomalies were detected in the surface waters and in all of the vascular plants they studied, but not in the sediments. They suggested that these anomalies could be linked to (i) the reduction of Eu3+ to the more mobile Eu2+ ion (as explained before), but also to (ii) analytical interference from the BaO ion during the ICP-MS measurements [30]. Our data showed Eu recoveries for plant reference material (BCR-670) similar to those obtained for the other studied rare earth elements (data not shown). Therefore, BaO interference could be discarded. However, according to the low REE concentrations obtained for the different plant tissues, the calculated ratios should be interpreted carefully (the total Eu content of the different studied materials can be consulted in Table S1).
Chevis et al. [11] suggested that Nd fluxes could be directly influenced by the mineralogy of the sediments and that the released Nd will participate in Fe reduction. On the other hand, Casse et al. [37] supported that REE scavenging could be produced by adsorption onto Fe-organic colloids and particulate organic carbon. In the studied Montviel area, Nd also appeared to be anomalously enriched in REE-bearing fluorocarbonates from the carbonatites [15]. The potential for dissolution of such carbonates could account for strong Nd availability in subsequent environmental compartments, therefore supporting the positive Nd anomalies obtained for sediments and soils [24]. Moreover, the investigated sediments above the carbonatites showed the lowest Fe contents and the highest organic carbon content [24]. Although no chemical determinations were performed in pore water, it was expected that the negative Nd anomalies observed in our samples could be explained due to their physicochemical properties. According to Chevis et al. [11] (and in order to better understand the aquatic Nd cycle), more studies are needed.
In the fresh aquatic system considered in this study, we can conclude that REEs in sediments can be available in the pore water fraction. However, the Nd depletion relative to the other REEs observed in sediment pore water indicated the different behavior of this element compared to the other lanthanides. The highest REE concentrations from the investigated aquatic plants appeared as expected in roots. In addition, although the REE content in plants was low, LREE enrichment as well as Eu positive anomalies were detected.

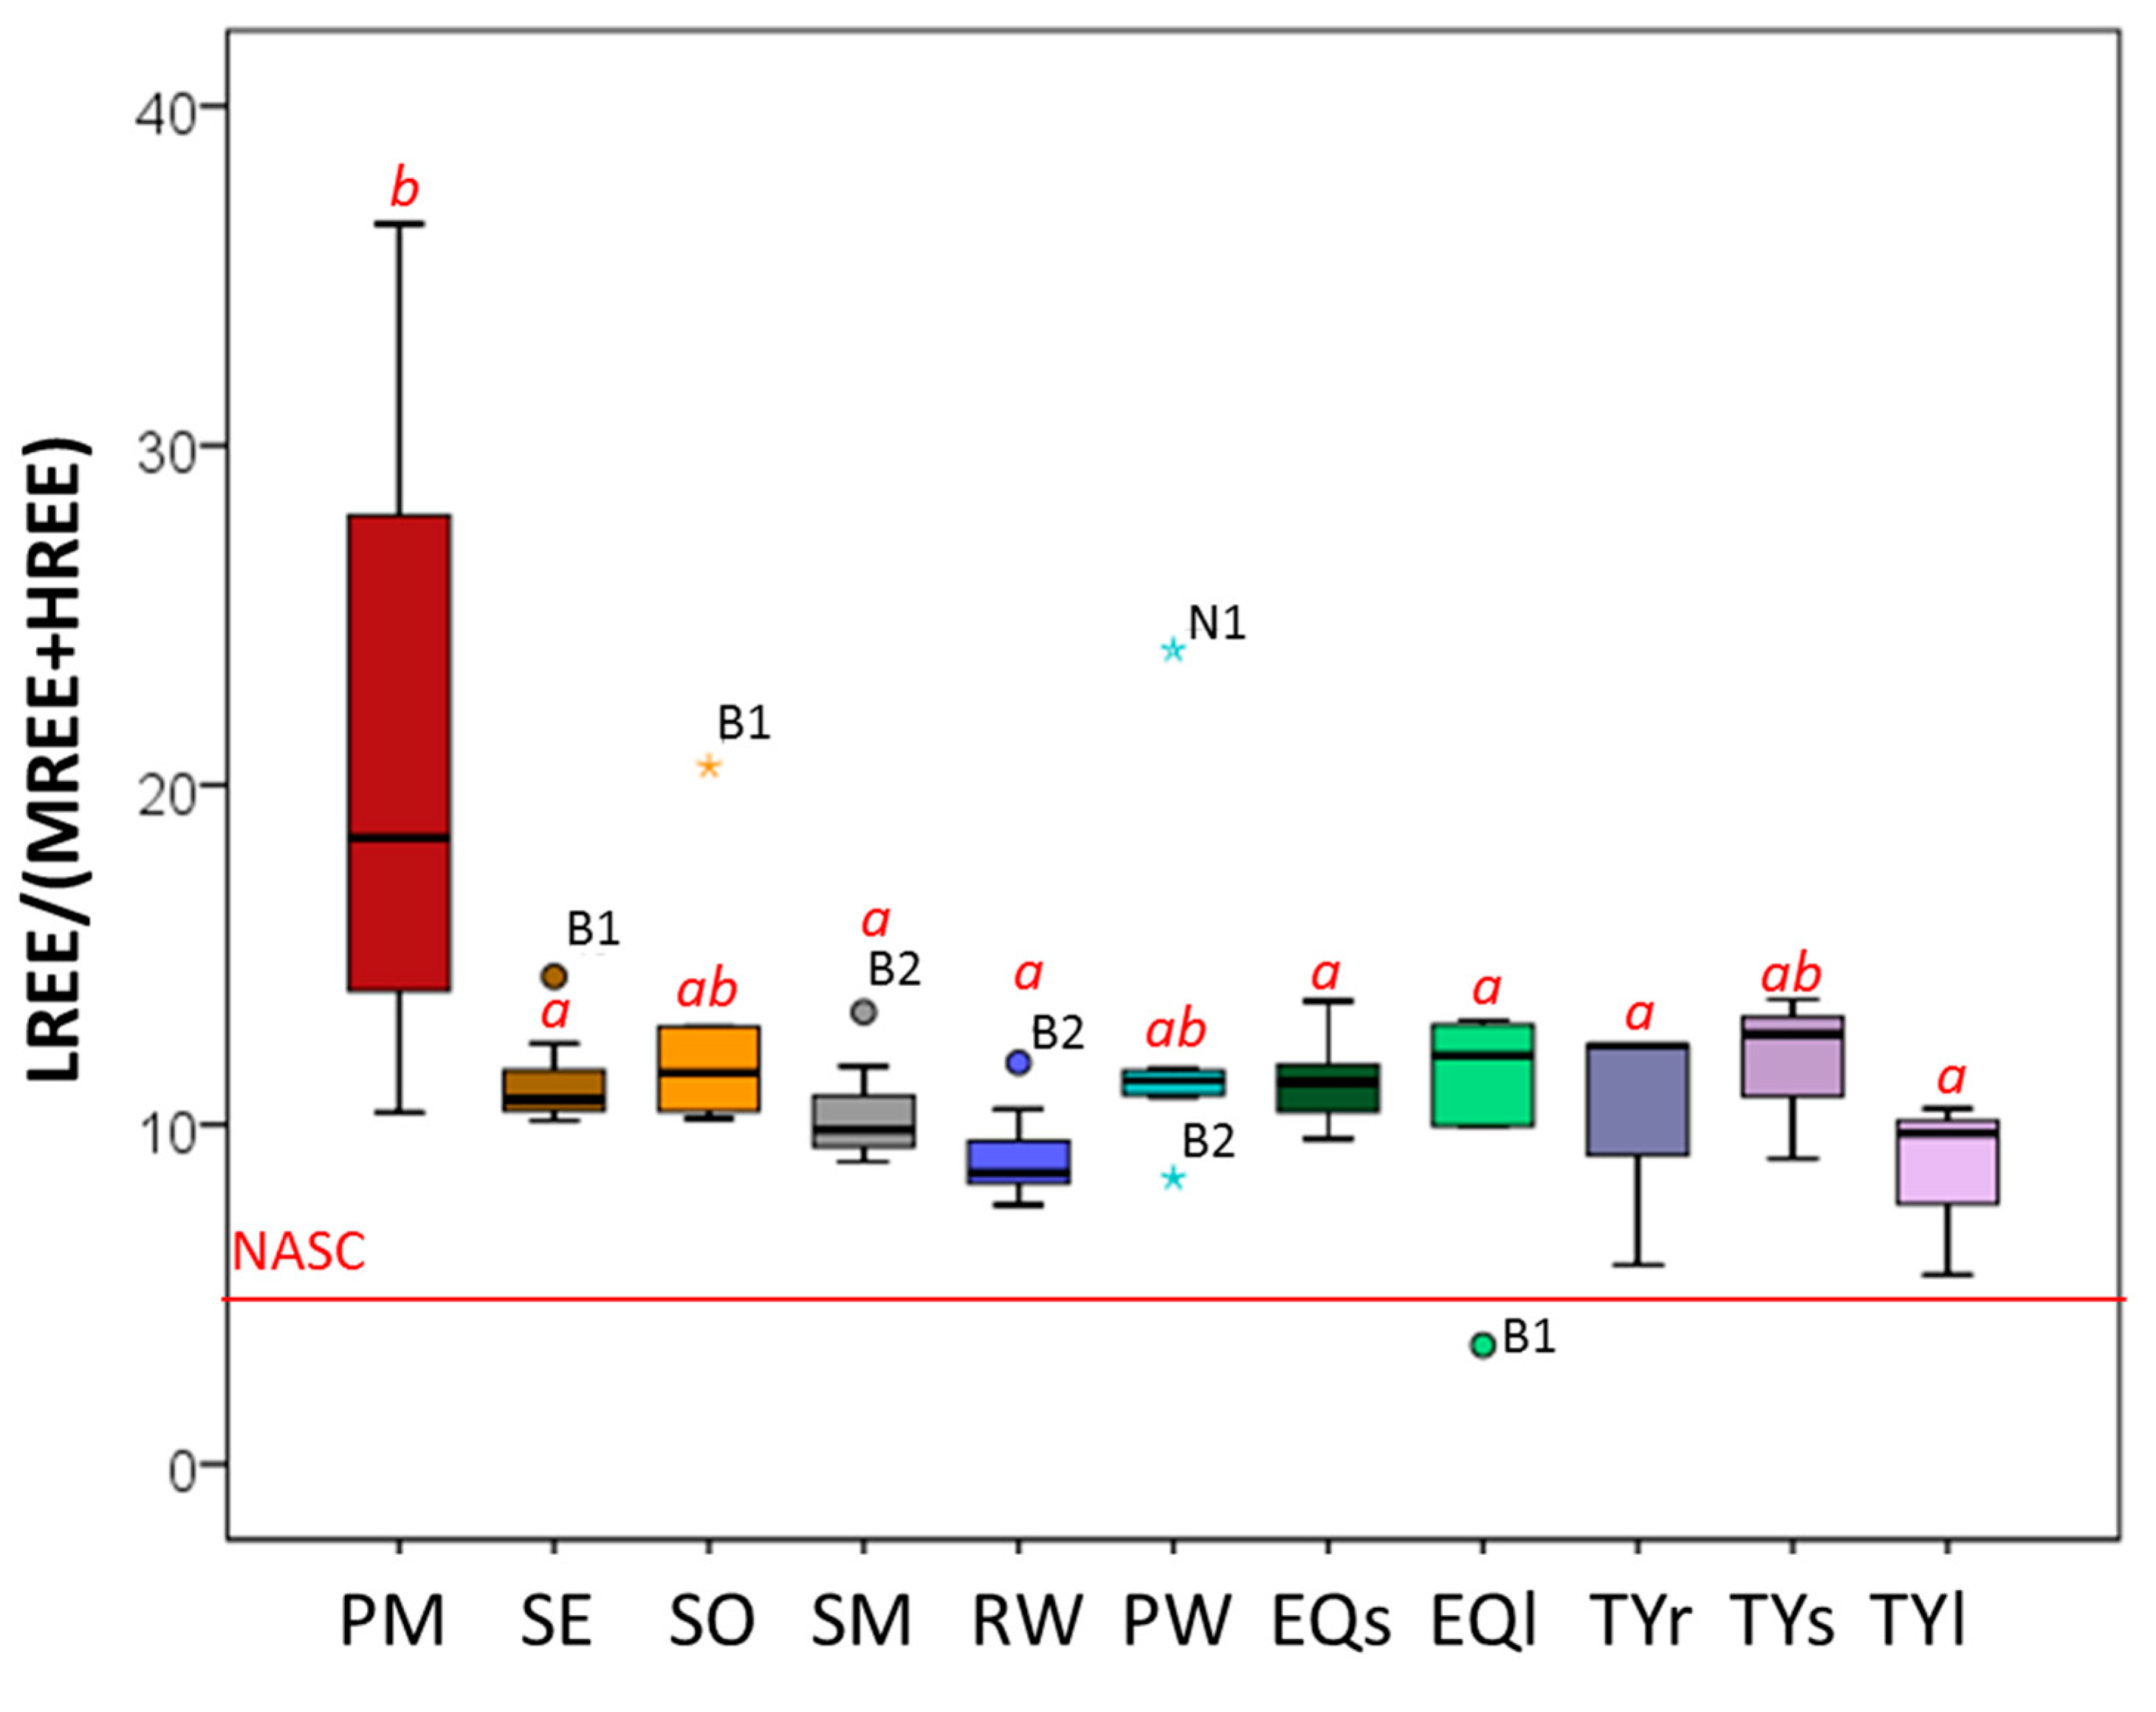
3.4. Distribution of REEs along the Study Ecosystem

The LREE/(MREE + HREE) ratio was used to decipher how REEs were distributed along the abiotic and biotic components of the studied ecosystem and if some LREE enrichments occurred in the studied samples relative to the LREE content reported for the parent material. Significant differences between ratios were observed with the Tukey test (p < 0.05). In addition, the results were compared to the ratio obtained for the NASC values (Figure 5). All abiotic samples showed higher LREE/(MREE + HREE) ratios than the NASC did. On the other hand, the leaves of T. latifolia showed the lowest values among the biotic samples, which were, however, also higher than the NASC.
It is worth noting the outliers for (i) the sediment and soils from sampling site B1, characterized by a higher LREE content; (ii) the suspended material and river water from sampling site B2, characterized by a higher LREE content but the lowest LREE content in sediment pore water; and (iii) sediment pore water from sampling site N1, characterized by LREE enrichment (Figure 5). The studied samples showed LREE/(MREE + HREE) ratios that were (i) ca. 0.7–4.9 times higher than the NASC ratios, which pointed to their potential LREE enrichment relative to the NASC; and (ii) ca. 0.9 to 6.0 times lower than in parent material, which pointed to their LREE depletion relative to PM. In addition to the parent material, the Tukey test showed significant differences only for soils, sediment pore water, and stems of the aquatic plant (Figure 5).
Amyot et al. [13] studied REE transfers in abiotic and food web components of several temperate lakes in Canada and observed that the dissolved organic carbon and oxygen, as well as the REE content in sediments, controlled the potential REE transfer into the aquatic system. The same authors also detected a trophic REE dilution along food webs. This trophic web dilution was confirmed by MacMillan et al. [30], who studied REE contents from different compartments, including terrestrial and freshwater environments, and observed that the highest REE contents were found in biota in the base food web that belonged to terrestrial and freshwater systems. They concluded that the REE content decreased with trophic level across ecosystems. In addition, even though they observed that many REEs bioaccumulated, they did not appear to biomagnify within the different microcosms.
In this study, the LREE enrichment observed in the rock material seemed persistent in the studied components, even in biotic samples, which showed low REE contents and no clear transfer between plant tissues. From the calculated LREE/(MREE + HREE) ratios in the studied samples, the highest LREE enrichment appeared in the soil and sediment developed above the ferrocarbonatite material (B1). This observation was strengthened by the calculated La[N]/Yb[N] ratios (NASC-normalized). Additionally, it is interesting to highlight the outliers of the studied ratio in our aquatic ecosystem, which were observed in the sediment pore water fraction (PW) (Figure 5). A negative outlier was obtained in the silicocarbonatite sampling site (B2), but a positive one was obtained in the pyroxenite sampling site (N1). These outliers could be explained by the observed Nd anomalies. Indeed, the sampling site B2 corresponded to the most negative Nd anomaly, whereas the sampling site N1 showed the highest and most positive Nd anomaly. Therefore, these findings also support that the geochemical cycle of Nd in aquatic systems does not necessarily follow the pattern of the other REEs.

4. Conclusions

This study provides novel data on the biogeochemical cycle of REEs in an undisturbed REE-rich geological area and establishes baseline data for future investigations, which are crucially needed for REE exploitation of mining areas. Although the REE contents in the parent material were really high for the ferrocarbonatite intrusion, the REE contents in the soil and aquatic compartments investigated in the study area were low. In addition, although it did not show clear correlations with bedrock concentrations, LREE enrichment of the solid fractions (soils and sediments) was observed above the ferrocarbonatite material. Even though REEs decreased along the investigated biogeochemical cycle, i.e., from solid to water fractions and to plants, LREE fractionations were still persistent over all studied materials. In addition, we observed positive Eu anomalies in plant material, which suggests an increased uptake of Eu relative to the other REEs. On the contrary, Nd negative anomalies were obtained from the sediment pore water fraction, which indicates a potential different biogeochemical cycle of Nd in aquatic systems compared to the other REEs. Although more studies and a larger range of organisms are needed to evaluate the REE impact on natural ecosystems, this study constitutes reference information for authorities and companies for opening REE mining exploitations in an environmentally friendly framework.

Supplementary Materials

The following are available online at https://www.mdpi.com/2075-163X/9/10/573/s1, Table S1. REE content of the various materials investigated in the Montviel area.

Author Contributions

Specifically, the conceptualization was done by L.G. and A.-S.A.-M.; methodology, A.R.-F. and L.G.; formal analysis, A.R.-F. and F.T.; investigation and sampling, A.R.-F., L.G., M.P., and A.C.; resources, M.P. and A.C.; data curation, A.R.-F. and M.P.; writing—original draft preparation, A.R.-F.; writing—review and editing, A.R.-F., F.T., A.-S.A.-M., and L.G.; visualization, A.R.-F., F.T., and M.P.; supervision, L.G. and A.-S.A.-M.; project administration, L.G. and A.C.; funding acquisition, L.G.

Funding

This work was supported by the French National Research Agency through the national program “Investissements d’avenir” with the reference ANR-10-LABX-21-01/LABEX RESSOURCES21. A. Romero-Freire would like to acknowledge support by the COST-European Cooperation in Science and Technology (TD1407: NOTICE).

Conflicts of Interest

The authors declare no conflicts of interest: the funders had no role in the design of the study; in the collection, analyses, or interpretation of data; in the writing of the manuscript; or in the decision to publish the results”.

References

  1. Fisher, A.; Kara, D. Determination of rare earth elements in natural water samples—A review of sample separation, preconcentration and direct methodologies. Anal. Chimica. Acta 2016, 935, 1–29. [Google Scholar] [CrossRef] [PubMed]
  2. Feng, X.; Zhu, G.; Li, Y. Toxicological effects of rare earth yttrium on wheat seedlings (Triticum aestivum). J. Rare Earths 2013, 31, 1214–1220. [Google Scholar] [CrossRef]
  3. Turlin, F.; André-Mayer, A.-S.; Moukhsil, A.; Vanderhaeghe, O.; Gervais, F.; Solgadi, F.; Groulier, P.-A.; Poujol, M. Unusual LREE-rich, peraluminous, monazite- or allanite-bearing pegmatitic granite in the central Grenville Province, Québec. Ore Geol. Rev. 2017, 89, 627–667. [Google Scholar] [CrossRef]
  4. Chakhmouradian, A.R.; Wall, F. Rare earth elements: Minerals, mines, magnets (and more). Elements 2012, 8, 333–340. [Google Scholar] [CrossRef]
  5. Zepf, V. Rare Earth Elements: What and Where They Are. In Rare Earth Elements: A New Approach to the Nexus of Supply, Demand and Use: Exemplified along the Use of Neodymium in Permanent Magnets; Springer: Berlin/Heidelberg, Germany, 2013; pp. 11–39. [Google Scholar]
  6. Geagea, M.L.; Stille, P.; Millet, M.; Perrone, T. REE characteristics and Pb, Sr and Nd isotopic compositions of steel plant emissions. Sci. Total Environ. 2007, 373, 404–419. [Google Scholar] [CrossRef] [PubMed]
  7. Brioschi, L.; Steinmann, M.; Lucot, E.; Pierret, M.C.; Stille, P.; Prunier, J.; Badot, P.M. Transfer of rare earth elements (REE) from natural soil to plant systems: Implications for the environmental availability of anthropogenic REE. Plant Soil 2013, 366, 143–163. [Google Scholar] [CrossRef]
  8. Rare Earths Statistics and Information. U.S. Geological Survey, 2018. Available online: http://minerals.usgs.gov/minerals/pubs/commodity/rare_earths/ (accessed on 11 January 2019).
  9. Aubert, D.; Probst, A.; Stille, P. Distribution and origin of major and trace elements (particularly REE, U and Th) into labile and residual phases in an acid soil profile (Vosges Mountains, France). Appl. Geochem. 2004, 19, 899–916. [Google Scholar] [CrossRef] [Green Version]
  10. Öhlander, B.; Land, M.; Ingri, J.; Widerlund, A. Mobility of rare earth elements during weathering of till in northern Sweden. Appl. Geochem. 1996, 11, 93–99. [Google Scholar] [CrossRef]
  11. Chevis, D.A.; Johannesson, K.H.; Burdige, D.J.; Cable, J.E.; Martin, J.B.; Roy, M. Rare earth element cycling in a sandy subterranean estuary in Florida, USA. Mar. Chem. 2015, 176, 34–50. [Google Scholar] [CrossRef]
  12. Armand, R.; Cherubini, C.; Tuduri, J.; Pastore, N.; Pourret, O. Rare earth elements in French stream waters —Revisiting the geochemical continental cycle using FOREGS dataset. J. Geochem. Explor. 2015, 157, 132–142. [Google Scholar] [CrossRef]
  13. Amyot, M.; Clayden, M.G.; MacMillan, G.A.; Perron, T.; Arscott-Gauvin, A. Fate and trophic transfer of rare earth elements in temperate lake food webs. Environ. Sci. Technol. 2017, 51, 6009–6017. [Google Scholar] [CrossRef] [PubMed]
  14. Mayfield, D.B.; Fairbrother, A. Examination of rare earth element concentration patterns in freshwater fish tissues. Chemosphere 2015, 120, 68–74. [Google Scholar] [CrossRef] [PubMed]
  15. Nadeau, O.; Cayer, A.; Pelletier, M.; Stevenson, R.; Jébrak, M. The Paleoproterozoic Montviel carbonatite-hosted REE-Nb deposit, Abitibi, Canada: Geology, mineralogy, geochemistry and genesis. Ore Geol. Rev. 2015, 67, 314–335. [Google Scholar] [CrossRef]
  16. Desharnais, G.; Duplessis, C. Montviel Core zone REE Mineral Resource Estimate Technical Report; SGS Canada Inc.: Blainville, QC, Canada, 2011; pp. 43–101. [Google Scholar]
  17. Barker, A.L. Rapport statutaire déposé au ministère des Ressources Naturelles et de la Faune, Québec. Summary Report on Exploration Work. 1975, p. 133. Available online: http://sigeom.mines.gouv.qc.ca (accessed on 17 April 2019).
  18. Corta, H.; Berthelot, P. Rapport D’une Campagne de Sondages. Propriété Montviel; Resources Nomans Inc.: Québec, QC, Canada, 2002. [Google Scholar]
  19. NI 43-101 Technical Report Montviel Rare Earth Project; GéoMégA Resources Inc.: Montreal, QC, Canada, 2015; p. 186.
  20. David, J.; Dion, C.; Goutier, J.; Roy, P.; Bandyayera, D.; Legault, M.; Rhéaume, P. Datations U-Pb effectuées dans la Sous-province de l’Abitibi à la suite des travaux de 2004–2005. Ministère des Ressources Naturelles et de la Faune, Québec 2006, 4, 22. [Google Scholar]
  21. Nadeau, O.; Stevenson, R.; Jébrak, M. Evolution of Montviel alkaline-carbonatite complex by coupled fractional crystallization, fluid mixing and metasomatism—Part I: Petrography and geochemistry of metasomatic aegirine-augite and biotite: Implications for REE-Nb mineralization. Ore Geol. Rev. 2016, 72, 1143–1162. [Google Scholar] [CrossRef]
  22. Nadeau, O.; Stevenson, R.; Jébrak, M. Evolution of Montviel alkaline-carbonatite complex by coupled fractional crystallization, fluid mixing and metasomatism—Part II: Trace element and Sm-Nd isotope geochemistry of metasomatic rocks: Implications for REE-Nb mineralization. Ore Geol. Rev. 2016, 72, 1163–1173. [Google Scholar] [CrossRef]
  23. Nadeau, O.; Stevenson, R.; Jébrak, M. Interaction of mantle magmas and fluids with crustal fluids at the 1894 Ma Montviel alkaline-carbonatite complex, Canada: Insights from metasomatic and hydrothermal carbonates. Lithos 2018, 296–299, 563–579. [Google Scholar] [CrossRef]
  24. Romero-Freire, A.; Minguez, L.; Pelletier, M.; Cayer, A.; Caillet, C.; Devin, S.; Gross, E.M.; Guérold, F.; Pain-Devin, S.; Vignati, D.A.L.; et al. Assessment of baseline ecotoxicity of sediments from a prospective mining area enriched in light rare earth elements. Sci. Total Environ. 2018, 61, 831–839. [Google Scholar] [CrossRef]
  25. McDonough, W.F.; Sun, S.-S. The composition of the Earth. Chem. Geol. 1995, 120, 223–253. [Google Scholar] [CrossRef]
  26. Gromet, L.P.; Dymek, R.F.; Haskin, L.A.; Korotev, R.L. The “North American Shale Composite” its compilation, major and trace element characteristic. Geochim. Cosmochim. Acta 1984, 48, 2469–2482. [Google Scholar] [CrossRef]
  27. Li, L.; Wu, J.; Lu, J.; Min, X.; Xu, J.; Yang, L. Distribution, pollution, bioaccumulation, and ecological risks of trace elements in soils of the northeastern Qinghai-Tibet Plateau. Ecotoxicol. Environ. Saf. 2018, 166, 345–353. [Google Scholar] [CrossRef] [PubMed]
  28. Zaharescu, D.G.; Burghelea, C.I.; Dontsova, K.M.; Presler, J.K.; Maier, R.M.; Huxman, T.; Domanik, K.J.; Hunt, E.A.; Amistadi, M.K.; Gaddis, E.E.; et al. Ecosystem composition controls the fate of rare earth elements during incipient soil genesis. Sci. Rep. 2017, 7, 43208. [Google Scholar] [CrossRef] [PubMed]
  29. Edahbi, M.; Plante, B.; Benzaazoua, M. Environmental challenges and identification of the knowledge gaps associated with REE mine wastes management, J. Clean. Prod. 2019, 212, 1232–1241. [Google Scholar] [CrossRef]
  30. MacMillan, G.A.; Chételat, J.; Heath, J.; Mickpegak, R.; Amyot, M. Rare earth elements (REE) in freshwater, marine, and terrestrial ecosystems in the eastern Canadian Arctic Environ. Environ. Sci. Process. Impacts 2017, 19, 1336–1345. [Google Scholar] [CrossRef] [PubMed]
  31. Morais, C.A.; Ciminelli, V.S.T. Recovery of europium by chemical reduction of a commercial solution of europium and Gadolinium chlorides. Hydrometallurgy 2001, 60, 247–253. [Google Scholar] [CrossRef]
  32. Soares Dinali, G.S.; Root, R.A.; Amistadi, M.K.; Chorover, J.; Lopes, G.; Guimarães Guilherme, L.R. Rare earth elements (REE) sorption on soils of contrasting mineralogy and texture. Environ. Int. 2019, 128, 279–291. [Google Scholar] [CrossRef]
  33. Liang, T.; Ding, S.; Song, W.; Chong, Z.; Zhang, C.; Li, H. A review of fractionations of rare earth elements in plants. J. Rare Earths 2008, 26, 7–15. [Google Scholar] [CrossRef]
  34. Ding, S.-M.; Liang, T.; Zhang, C.-S.; Wang, L.-J.; Sun, Q. Accumulation and fracitonation of rare earth elements in soil-wheat system. Pedosphere 2006, 16, 82–90. [Google Scholar] [CrossRef]
  35. Censi, P.; Cibella, F.; Falcone, E.E.; Cuttitta, G.; Saiano, F.; Inguaggiato, C.; Latteo, V. Rare earths and trace elements contents in leaves: A new indicator of the composition of atmospheric dust. Chemosphere 2017, 169, 342–350. [Google Scholar] [CrossRef]
  36. Brito, P.; Malvar, M.; Galinha, C.; Caçador, I.; Canário, J.; Araújo, M.F.; Raimundo, J. Yttrium and rare earth elements fractionation in salt marsh halophyte plants. Sci. Total Environ. 2018, 643, 1117–1126. [Google Scholar] [CrossRef]
  37. Casse, M.; Montero-Serrano, J.-C.; St-Onge, G.; Poirier, A. REE distribution and Nd isotope composition of estuarine waters and bulk sediment leachates tracing lithogenic inputs in eastern Canada. Mar. Chem. 2019, 211, 117–130. [Google Scholar] [CrossRef]
Figure 1. (a) Geographical location of the Montviel area (source: Google Earth) and simplified geological map (provided by GéoMégA Resources Inc.) with the locations of the seven sampling sites in the different watercourses; (b) graphical representation of the sampled materials with their abbreviations and a description of the number of samples and where they were collected.
Minerals 09 00573 g001
Figure 2. (a) Chondrite-normalized (Reference [25]) and (b) North American shale composite (NASC)-normalized (Reference [26]) rare earth element (REE) patterns of the four parent materials (PMs) from the Montviel area investigated in this study. Lines correspond to mean values, and shaded areas correspond to 95% confidence intervals for N2, B1, and B2. All data of A2 are represented according to the limited number of replicates (n = 3).
Minerals 09 00573 g002
Figure 3. (a) NASC-normalized rare earth element (REE) patterns of the five investigated soil samples and soil-normalized REE patterns of (b) stems and (c) leaves of the plant Equisetum arvense L. (EQ).
Minerals 09 00573 g003
Figure 4. (a) NASC-normalized rare earth element (REE) patterns for the sediments (SEs); (b) REE patterns for sediment pore water (PW), river water (RW), and suspended material in rivers (SM) normalized to the respective sediment; (c) roots, stems, and leaves of REE patterns of the aquatic plant Typha latifolia L. (TY) normalized to the respective sediment. The total REE contents obtained for all studied fractions are shown in the Table S1.
Minerals 09 00573 g004
Figure 5. Box plot of the light rare earth element (LREE)/(middle rare earth element (MREE) + heavy rare earth element (HREE)) ratios calculated on the abiotic (PM, SE, SO, SM, RW, and PW) and biotic (EQ, TY) (r: root, s: stem, l: leaf) samples of the study area. The red line stands for the value of the same ratio for the reference standard composition of the North American shale composite (NASC). Different red letters correspond to the significant differences between samples (excluding the NASC value) performed with the post hoc Tukey multiple comparisons test (p < 0.05).
Minerals 09 00573 g005
Table 1. REE contents, La[N]/Yb[N] fractionation factors, and Eu/Eu* and Nd/Nd* ratios of soil (SO) and the aerial parts (stems and leaves) of the plant Equisetum arvense L. (EQ). The bioaccumulation factors (BAFs) were obtained through the ratio of the REE content in plant parts divided by the soil content, and the translocation factors (TF1s) in the plant were obtained by dividing the leaf REE content by the stem REE content. The REE content for each sampling site and element can be consulted in the Table S1.
UnitsSampling Site
N0N1N2A1A2B1B2
SOREE mg kg−185.196.4-155.2191.3152.3-
EQREE Stemmg kg−13.2110.41-7.687.724.45-
REE Leafmg kg−12.261.15-1.730.540.16-
SOLa[N]/Yb[N] 7.34.2 3.94.515.4
EQLa[N]/Yb[N]Stem 15.011.1 3.66.06.0
La[N]/Yb[N]Leaf 35.125.2 4.010.010.9
SOEu/Eu* 1.160.95 0.911.131.16
EQEu/Eu*Stem 4.932.24 1.251.482.57
Eu/Eu*Leaf 5.326.60 1.253.23n.c.
SONd/Nd* 1.451.53 1.381.591.24
EQNd/Nd*Stem 1.281.25 1.201.221.25
Nd/Nd*Leaf 1.181.22 1.051.121.28
EQ/SOBAFEQ stem/SO-0.0380.108-0.0490.0400.029-
BAFEQ leaf/SO-0.0270.012-0.0110.0030.001-
EQTF1EQ leaf/stem-0.700.11-0.230.070.04-
n.c.: Data not calculated due to analytical values near detection limits.
Table 2. REE contents, La[N]/Yb[N] fractionation factors, and Eu/Eu* and Nd/Nd* ratios of sediments (SEs), sediment pore water (PW), river water (RW), suspended material in rivers (SM), and the roots, stems, and leaves of the aquatic plant Typha latifolia L. (TY). The bioaccumulation factors (BAFs), bioconcentration factors (BCFs), and translocation factors in the plant were calculated by dividing the leaf content by the stem content (TF1) and the stem by the root (TF2).
UnitsSampling Site
N0N1N2A1A2B1B2
SE mg kg−1183.6181.0101.2184.9110.589.271.3
PW µg L−199.413.249.844.325.814.020.8
RW µg L−14.04.13.73.54.23.04.3
SMREE mg kg−11.35.74.21.41.40.40.3
TY Rootmg kg−1 1.85 -2.35
Stemmg kg−1 0.39 -1.20
Leafmg kg−1 0.67 0.730.20
SE 3.673.273.783.355.936.434.28
PW 4.383.573.805.093.886.493.82
RW 2.102.493.172.112.403.774.80
SMLa[N]/Yb[N] 3.593.283.033.614.115.195.68
TY Root 2.40 6.58
Stem 4.14 7.51
Leaf 3.87 4.449.16
SE 0.961.040.920.891.041.140.97
PW 0.992.150.950.960.961.321.19
RW 1.130.940.971.041.021.771.71
SMEu/Eu* 0.980.970.951.140.951.881.34
TY Root 1.20 2.95
Stem 3.20 3.41
Leaf 3.98 1.6226.16
SE 1.851.861.661.741.661.551.35
PW 1.2210.740.650.391.120.240.19
RW 1.221.101.171.301.151.201.21
SMNd/Nd* 1.081.121.081.111.051.031.13
TY Root 1.16 1.23
Stem 1.11 1.36
Leaf 1.25 1.191.19
TY/SE TY root/SE- 0.018 -0.026
BAFTY stem/SE- 0.004 -0.013
TY leaf/SE- 0.007 0.0070.002
TY/PW TY root/PWL kg−1 37 -169
BCFTY stem/PWL kg−1 8 -86
TY leaf/PWL kg−1 13 2814
TY/RW TY root/RWL kg−1 503 -772
BCFTY stem/RWL kg−1 106 -392
TY leaf/RWL kg−1 181 17366
TYTF1TY leaf/stem 1.70 -0.17
TF2TY stem/root 0.21 -0.51

