Abstract
Although rare earth deposits are found on all continents, China produces more than 90% of all globally used rare earth metals. Besides its economic dominance, China has also gained a monopolistic know how position in Rare Earth Elements process technologies. Based on China’s dominant position in rare earth markets, other countries such as the USA, Australia, Europe and Japan are increasingly concerned about a stable rare earth supply and their increasing dependence on China. In 2019 the new trade conflict blazed up between China and the U.S., and the threat of China to decrease or even stop rare earth supply to the U.S. is a new chapter in the trade war which shows that new means of supply must be found. The main focus of this paper is to evaluate and compare advanced rare earth projects outside China with a new holistic and objective method to get a detailed picture of possible rare earth mining outside China. In addition to the exclusively economic investigation, specific countries’ risk und price development scenarios are considered. This leads to an objective picture of rare earth mining outside of China, which is needed as a basis for discussions of secure rare earth supply for the western world. Building on this objective economic analysis, we can also add new supply risk due to new political situations. To this end, data is compiled on 14 selected focus projects with regard to the required investments, operating costs, and the potential revenues for each case. These data are used to develop a discounted cash flow model (with analogous assumptions and methods) for each project. This model enables the achievable net present value (NPV), the internal interest rate, and the static amortization period for each project to be determined.
1. Introduction
Even though rare earth deposits exist on all continents, and potential deposits are known, over 90% of rare earth produced in 2013 was mined in China. Meanwhile, China’s share of known rare earth reserves is only around 50%. Figure 1 shows that China produces 100 thousand tons of oxides of Rare Earth Elements (REO) out of around 112 thousand tons worldwide (grey), even though China’s rare earth reserves only account for 55 million tons out of 115 million tons (blue). As a result, China currently has a monopolistic position in REE mining, refining, and thus also in corresponding know how [].
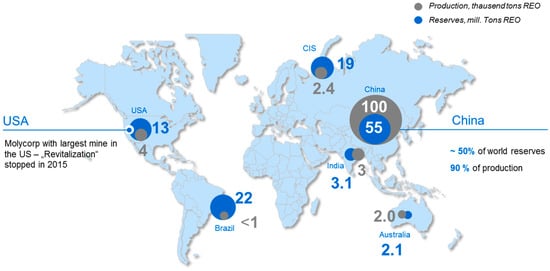
Figure 1.
Overview of reserves and mining potential of REE [].
As a result of this large share of production, China holds a kind of monopoly position in mining and refining, as well as the associated know-how. Through this position, as well as additional policy instruments such as export quotas (until 2015), China has been able to dominate the rare earth market over the last 20–25 years and thus, in some cases, the market for the dependent companies producing RE products. At an early stage, the Chinese leadership recognized the relevance of the valuable raw material for the global economy. Testimony to this is a statement by the former Chinese leader Deng Xiaoping. In a speech in January 1992, he said, “There is oil in the Middle East, rare earths in China”; and continued, “We need to properly manage our rare earth resources and make the most of our country’s development” [].
This near-monopoly position of China and its effects on the global supply of REE is also discussed by Humphries [] and Kramer []. They describe the dependency and connected threats on 100% imports for rare earth deposits, mainly from China. Additionally, China’s dominance in R&D spending on mining and exploration technologies is under close observation []. As a result, industry analysts and U.S. legislators are concerned about China’s dominance of the rare earth supply. The U.S. Department of Energy has started to focus its attention on the criticality of rare earth [] and is developing a long-term strategy for these materials with the aim of mitigating the dependency on China’s supply. Europe has proposed a strategy for critical minerals []—in particular the supply of REE—with the goal of becoming less dependent on China. Tiess [] summarized the importance of a secure supply of critical raw materials for Europe’s economy []. The fact that the REE market is only served by a handful of operators who are not specialized in, for example, futures contracts—other than aluminum, for example, which is traded on the London Metal Exchange (LME)—leads to unpredictable price trends and therefore to additional risks for dependent economies such as the U.S. and Europe [].
In the context of the need for a reliable supply, REE projects outside of China could mitigate the current dependency. However, potential companies are not willing to invest on the basis of potential future uncertainties. Therefore, it is crucial to analyze the extent to which it is economically feasible to invest in projects outside of China.
So far, no comprehensive financial and technical comparison and classification of rare earth projects outside of China has been made. Each individual project has published their own investment model and technical report, [,,,,,,,,,,,,,,,,,,,,,,,]. These reports are all somewhat different in method and assumptions, and therefore are not comparable without further detailed work. To compare the common investment value the net present value (“time value of money”), the same basis for all projects has to be used in terms of REE prices, structure and included expenditures (e.g., sustaining capital and contingencies are not counted in for each project [,,,,]). The objective of this paper is to provide a sound economic analysis, by first identifying potential REE projects and then comparing their financial performance. To this end, a detailed DCF model (Discounted Cash Flow) is created for each of the 14 so-called focus projects (all projects outside China with at least a prefeasibility study [,,,,,,,,,,,,,,,,,,,,,,,]). This allows valuation using three investment calculation techniques (Static Amortization, NPV, and Internal Rate of Return). The classification and comparison of Norra Kärr with other projects ensures that the European project Norra Kärr can also exist as a sensible and attractive investment compared to, for example, Australian, American or African projects. In addition, different scenarios are being developed in which the parameters of investment level, operating costs, achievable price and specific project risks are changed, under which assumptions and limits Norra Kärr, and thus a European deposit could be attractive to potential investors. Using this holistic approach and investigating the attractiveness of the most promising projects outside of China will provide a complete view of future RE supply. In addition to the classification of Norra Kärr, the economic attractiveness of the other focus projects is also assessed from an investor perspective.
2. Criticality of REE and DCF Model
2.1. Determining the Criticality of REE
The unilateral dependency (on China) entails a risk to the economic welfare of both companies and some countries, which is difficult to calculate without in-depth analysis. By evaluating the criticality of raw materials (i.e., REE), the respective risks can be classified. In this context, criticality depends on the supply risk and the economic importance/vulnerability. The idea of criticality in relation to raw materials has been used by the U.S. government since the middle of the 20th century, starting with the “Strategic and Critical Materials Stock Piling Act” in 1939, followed by the “President’s Materials Policy Commission” in 1952 under President Truman [,]. Raw materials mainly relevant for military technology were incorporated, and thus it was the U.S. government’s intention to maintain a high degree of geopolitical independence due to the importance of raw materials in the event of war. Since the end of the Cold War, the military goals of stockpiling critical metals for military purposes have been increasingly replaced by economic, political or technical objectives. The pure national view of the criticality of raw materials has been substituted by a more global and holistic view of the effects of supply shortages [,].
In earlier studies on REE criticality, e.g., from the European Commission or the U.S. Department of Energy, REE were typically classified as a group or divided into two subgroups (light and heavy). However, conducting an assessment of new deposits requires a precise breakdown of the ores’ qualities, concentrations, locations and qualities. Taking these requirements into account, a proprietary methodology for assessing REE criticality on an individual basis has to be developed that is based on the methods applied in current studies on criticality [,,].
We based our results on the study of REE criticality by Jaroni et al. (2017) []. Following on from an initial screening of REEs based on their economic relevance, 10 REEs were analyzed in detail in terms of their industrial importance and their supply risk. This analysis involved various criteria, including their importance for the European economy, their substitutability, their dependence on China, and recycling. After that, five REEs—dysprosium, neodymium, europium, terbium, and yttrium—were classified as critical metals (see Figure 2). Dysprosium and neodymium are particularly critical, because they are primarily used in the steadily growing area of magnet production, and no potential substitutes are known. The current foreseeable demand outpaces the foreseeable future supply of both metals. Europium, terbium, and yttrium are mostly used in fluorescent lighting, which is also a strongly growing market. Furthermore, shortages and a high degree of dependency on China are evident for all three metals, meaning that the supply risk until 2020 should be classified as high [].
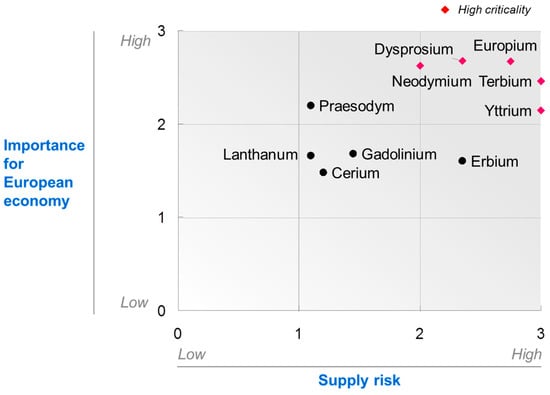
Figure 2.
Criticality matrix [].
2.2. Structure of the Model
2.2.1. Selection of Potential REE Projects
The main objective of this paper was to compare selected REE projects outside of China. As Norra Kärr was the only European project under consideration, it was given particular attention and graded on its profitability and competitiveness in relation to other relevant projects outside of China.
To evaluate the projects, we performed a multi-step procedure: First, all publicly known projects outside of China were subjected to an initial economic assessment. Second, the richest (REE content in ore), most developed, and therefore the most relevant projects were chosen for further investigation. For these so-called focus projects (see Table 1), detailed financial models were calculated in the third step. Fourth, the models’ results were compared, enabling the economic feasibility of the analyzed projects to be predicted [,,,,,,,,,,,,,,,,,,,,,,,,].

Table 1.
Overview of the 14 focus projects outside of China [,,,,,,,,,,,,,,,,,,,,,,,,].
2.2.2. Expenditure
The costs of each project were recorded separately. First, the initial investment (Capex) to start operating at the respective mine was considered, and then the operational cost (Opex) for producing separated RE-oxides (which were assumed to be the end product for each project) were calculated. The data required were extracted from public sources such as published (pre-)feasibility studies [,,,,,,,,,,,,,,,,,,,,,,,]. In the absence of data on individual items, reasonable assumptions were made using appropriate literature or by using comparable values from other projects.
When calculating Capex, we distinguished between direct and indirect costs. For each project, the costs were subdivided into the same categories. Direct costs covered the costs for mining, processing and separation, plant infrastructure and others. Indirect costs were split into “owner cost” (e.g., EPCM—Engineering, Procurement and Construction Management), contingency and other costs. In addition, “sustaining cost” was also considered.
By analogy with Capex, Opex is also split into different cost categories, namely, mining, material processing, hydrometallurgy/separation, general administration, and others.
For both Capex and Opex, the range of costs for the projects is wide. This can be explained by the different sizes of the projects, and can be made comparable on the basis of relative Capex and Opex costs. Capex in USD per mt ranges from $1 to $15, and is a result of different ore contents, infrastructure, labor costs, mine sizes, mine lifetimes, etc. When considering Opex, the costs range from $12 per kg of product to almost $50 per kg of product. For both Capex and Opex, the ore’s content and composition are of particular importance. The ore almost always consists of very small amounts of critical REE (see Table 2), and therefore the REE are very expensive to mine, process, and extract. However, if the ore has a relatively high content of critical REE, the products will often have a higher market value, and therefore the more expensive Opex costs yield higher revenues per kg [,,,,,,,,,,,,,,,,,,,,,,,,].
Table 2.
Overview of basket prices of the 14 projects outside of China for different scenarios and the content of REO [,,] to calculate the revenue.
2.2.3. Revenues
Recoverable revenues are characterized by the quantity produced and the price per unit. For the first approximation, it was assumed that the capacity was equal to the quantity sold. In the subsequently developed model, this initial approximation was replaced with detailed assumptions (e.g., ramp up of production). The amount of REO produced per year can be expressed by the mine’s capacity. The recoverable price per product unit depends on various parameters, which are also covered. First, the content of REO product varies greatly from deposit to deposit, and second, the price per REO is very different (compare, for example, Lanthanum and Europium). Moreover, the prices for the various REOs could be significantly different in future years. In particular, the developments of applications such as electric mobility or wind power, and therefore the demand and supply of the individual oxides, plays a significant role. As a consequence, critical metals, in particular, are expected to experience disproportionate price movements. Various scenarios for possible price developments and impacts on the projects are considered in Section 3.1.4 (Sensitivity Analysis) of this paper.
The different compositions of the products are reflected by the so-called basket price. The basket price is described by the sum of the proportions of the individual REOs in the product multiplied by the price of the individual REOs (see Equation (1)):
Symbols: i = REE; x = basket price for one REE.
With the basket price, the capacity and the market prices at hand, it is possible to derive the revenues of different mines. As a note of caution, we emphasize that the basket price can only provide an initial indication of a status quo price used at a selected time. Due to the very different ore compounds in the mining projects analyzed and the very different processes for each REO, the basket prices range from $14 per kg of product for the Mountain Pass mine, with an amount of only 12% of critical REO (within the REO content of 6.6% w/w in ore), to more than $60 per kg of product for the Browns Range mine, with an almost 70% share of high critical REO within the 0.7% total REO in ore.
The calculated basket prices multiplied by the production quantities provide the total revenues for each project. The basket prices for each project are shown in Table 2. In the base case, the prices for the selected time period (09/2014–08/2015) are used. In case +25%, +50% and +100%, the investments are modeled with an assumption of a rise in prices for the most critical REE (see Section 2.1)—dysprosium, neodymium, europium, terbium, and yttrium—by 25, 50 and 100%. Also shown in Table 2 are the content of REO in ore and the share of critical REE within this.
Information regarding the revenues for each project and the defined costs (Capex and Opex) provide the data basis for our economic model and for comparing the feasibility of the projects in focus.
Not further analyzed is the fact that REO is and can also be produced as a by-product (e.g., iron ore production).
2.3. DCF Model (Method)
By employing the net present value method, a DCF (discounted cash flow) model serves to calculate the economic feasibility of the focus projects. The results allow the projects to be compared and provide a basis for subsequent sensitivity analyses.
First, the revenues were computed by multiplying production quantities and the respective basket prices. A ramp-up phase for the first three years was assumed—60% in the first year, 75% in the second year, 85% in the third year, and full production in the fourth year and thereafter.
Second, the costs were divided into the Capex and the Opex, with several sub-categories (e.g., mining, process, etc.), as described earlier. It was assumed that the Opex cost comprised 30% fixed and 70% variable costs, which was also assumed during the production ramp-up phase. The Capex was assumed to be invested within three years before production, 40% in the year before production and 30% in the second and third year. These assumptions are based on available calculations for the Swedish rare Earth mine Norra Kärr [].
Taxes were included in the third part of the model. As tax systems for each country differ, and are highly complex and partially opaque in some countries, we rely on simplified assumptions and use a normalized tax rate for each project. The taxable income is derived from the difference between EBITDA (earnings before interest, taxes, depreciation, and amortization) minus depreciation and minus interest payments. We assumed that the firms apply the linear depreciation method that is common in most countries and-based our calculation on an interest rate of 10% on capital invested. The calculation of the taxes was carried out irrespective of the project location. Further fundamental discussions on taxes of the projects are possible and necessary, yet they are not the focus or objective of this paper. Nevertheless, the model is built in such a way that it can be adjusted to more complex tax schemes and considerations in a future paper.
The economic value and feasibility of the projects in focus is determined by first calculating the operating profit, the taxes, and the necessary investments. To compare the profitability of the projects, different static and dynamic capital budgeting methods and a combination of these methods are applied. The first method is the payback time as a static method. This is a simple method, often used for the first approximation, but it cannot constitute a sufficient basis for decision-making when choosing among different investment projects. For more elaborate analyses, we apply two very (most) common dynamic capital budgeting methods for each focus project and calculate the Net Present Value (NPV) and the Internal Rate of Return (IRR) for each project respectively. Since the IRR method alone is not entirely [] suited to always leading to sound investment decisions, the net present value method was primarily used to decide which project would be most profitable from an investor’s perspective.
3. Results and Discussion
3.1. Results
3.1.1. Scenario 1—Base Case
In the first scenario (base case scenario), similar preconditions and risks were assumed for all projects. All 14 focus projects were calculated with the same discount rate of 10%. The average prices for REOs from September 2014 to August 2015 were used to calculate all basket prices, which were based on ore content and average prices. Additionally, we assumed that the basket price would be stable over the lifetime of all mines (LOMs). This assumption of adopting a uniform price over the LOM was also used in the analyzed pre-feasibility studies (e.g., Norra Kärr 2015 []). We assumed the inflation rate for inputs and outputs to be zero. Taking these assumptions into account, the base case and the related results were subject to system failures (as with all simulations). In reality, the prices for inputs and outputs will not remain stable for the entire duration of the projects. However, by applying this simplification for all of the projects in focus, it is possible to obtain a relative comparison of the projects and thus derive sound conclusions about the potential economic feasibility of the European Norra Kärr project (reflecting currently known conditions).
In Figure 3, the NPVs (pre-tax and with the assumed 10% discount rate) and the IRRs are plotted for all of the projects in focus. We found that only seven of the 14 projects had a positive NPV in the base case scenario (see also Table 3 for detailed results). The IRR was highest for the Steenkampskraal project. For this project, an attractive IRR of 25.8% was achieved, even with the current historically low prices for REE. However, owing to Steenkampskraal’s relatively short lifetime of 13 years, only about $160 million NPV was generated—considerably less than with other projects. The Ngualla, Nolan and Browns projects showed positive NPVs. Here, the IRRs were about 13–18%, well above the assumed minimum return of 10%. Zandkopsdrift, Strange Lake and Kipawa only reached 10–11% and were barely economically attractive. The European project Norra Kärr (in blue) achieved a negative NPV of 155 mn USD (pre-tax). The payback period was just under 16 years, and was close to the assumed project’s lifetime of 20 years. Under these circumstances, it would not be economically viable to invest in this project.
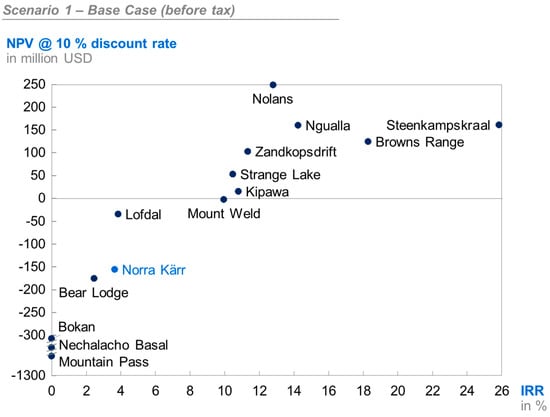
Figure 3.
Results of the DCF model with a 10% discount rate (pre-tax) and base case prices.
Table 3.
Detailed results of DCF model for base case scenario.
3.1.2. Scenario 2—Disproportionately Impact Price Development for Critical REO
In the second scenario, price increases for the critical metals neodymium, dysprosium, europium, terbium and yttrium were assumed. As mentioned earlier, a substantial price increase for these critical metals is likely to be due to a shortage of supply, increasing demand, a lack of substitutes, etc. To model this price increase, two different sub-scenarios were integrated into the DCF model: (1) a price increase for the five critical metals of 25%; and (2) a 100% price increase (relative to the base case). These price increases directly affect the basket prices for different projects depending on the ore content of the critical REOs. In Figure 4, the capital value was plotted against the IRR (pre-tax) for the 14 projects in focus (at a discount rate of 10%) for the scenario with a 25% price increase.
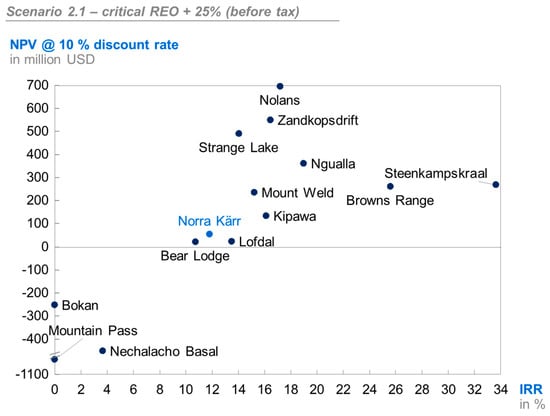
Figure 4.
Results of the DCF model at a 10% discount rate (pre-tax) and based on a 25% price increase of critical REOs.
Even with 25% higher prices, three of the 14 projects in focus—Mountain Pass, Nechalacho Basal and Bokan—were still not economically feasible. However, the Lofdal project and the European deposit of Norra Kärr were able to achieve a positive NPV, but with an absolute NPV of less than $60 million (before taxes) over a 20-year term and an initial investment of ~$430 million. The IRR for Norra Kärr increases to 11.8%. Steenkampskraal and Browns Range would achieve attractive NPVs with ~$300 million and IRRs of 33% and 25%, respectively. Under these assumptions, Nolan could achieve the highest NPV of approximately $700 million, with an IRR of about 17%.
If the prices for the five critical REOs increase by 100% (compared to the base case prices), 12 of the 14 focus projects could yield a positive NPV. Only Mountain Pass and Bokan would still not meet the set minimum IRR of 10%. Figure 5 shows that for Norra Kärr, in particular, the high amount of ~52% critical REO increases its NPV disproportionately compared to the base case scenario. In this scenario, Norra Kärr’s NPV amounts to $682 million, with a favorable IRR of 28%. Nolans and Zandkorpsdrift could also increase their NPV significantly to more than $1.8 billion, whereas Nechalacho Basal could increase its NPV to a positive value of around $250 million.
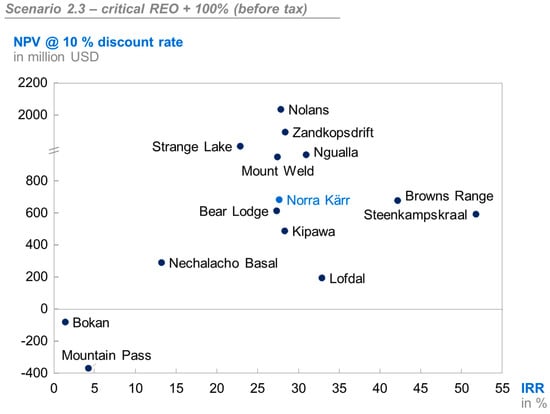
Figure 5.
Results of the DCF model at a 10% discount rate (pretax) and based on a 100% price increase of critical REOs.
Originally, more profitable projects such as Steenkampskraal and Browns Range achieved increasingly higher IRRs through the increases in critical REOs—for example, a 52% pre-tax IRR for Steenkampskraal for the calculated 100% price increase. However, the absolute achievable NPVs for these projects are much lower than for projects such as Nolan or Zandkopsdrift. This is due to the quantities of critical REO (annual capacity) and longer LOMs. However, investments in these projects (Steenkampskraal and Nolan> $1 billion) are also higher, leading to a higher overall risk.
For projects with similar IRRs, the NPVs as well as the NPV development are different because the price increases depend on the content of critical REOs. For example, the NPV for Norra Kärr is $114 million (for the +25% scenario), rising to $682 million when a 100% price increase is assumed. For the Nolans project (similar IRR as Norra Kärr), the NPV is $695 million (+25% scenario) increasing to ~$2.0 billion (+100% scenario). Given the assumed price increases for large projects such as Nolans, a significantly higher NPV can be achieved. However, a significantly higher investment (Norra Kärr ~$430 million, Nolan’s $1.2 billion) is required, which in turn poses a significantly higher financial risk.
3.1.3. Scenario 3—Project-Specific Discount Rate
In the third scenario, the risk of each project is taken into account by adjusting the discount rate for each project. The discount rate for mining projects can be divided into three components and determined for each project [,]:
(1) Risk free interest rate—assumed to be 2.5%.
(2) Specific mining project risk: 1. Stage of project (feasibility study, in operation, etc.) (Risk premium 0% to 5%); 2. Duration of LOM (risk premium 0% to 5%).
(3) Country-specific risks: e.g., political situation, geography, infrastructure, etc. (risk premium 0% to 14%).
The sum of the individual components then results in the project-specific discount rate, and therefore reflects the risk for each individual project (see Table 4). The risk-free interest rate is generally derived from the interest rate applied to long-term, non-governmental government bonds (e.g., federal bonds). In May 2015–April 2016, the interest rate (10 years) for government bonds in Germany averaged 1.4%; for government bonds in the USA, 2.0%; and for Australian government bonds, around 3.0% [,].
Table 4.
Project-specific discount rates [,,,,,,,,,,,,,,,,,,,,,,,,].
The specific mining project risks are subdivided into project stage and lifetime of the mine (LOM). The risk that the project will not be implemented exactly as described in the respective study is significantly higher for less developed projects. For example, in a prefeasibility study, the geology and the REE content of the existing ores were only assessed from a few initial drillings. The number and intensity of these geological investigations is increased significantly in a definitive feasibility study (DFS), whereby project-specific assumptions become more precise and the project-specific risk can be reduced. Accordingly, the risk also increases for projects with longer durations (LOM). Today, it is difficult to foresee the risks of technological developments and the associated price developments for REO. The further into the future a project produces REO, the more difficult—and therefore, inaccurate—the statement about the demand and supply of the corresponding raw materials becomes, which leads to a higher project-specific risk for projects with a long run-time.
The risk premiums for country-specific risks are shown in Figure 6 []. Political stability and geographical risks, as well as infrastructure, currency and social risks (among other things, corruption and distribution of wealth) are taken into account. Consequently, Western countries such as Canada and Australia have a lower risk premium, whereas African countries (excluding South Africa) and countries such as Russia and Kazakhstan have higher risks, and thus a higher premium is added to the discount rate [].
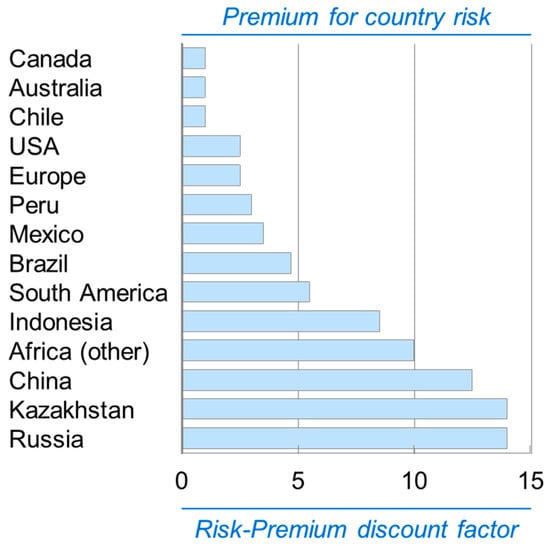
Figure 6.
Premium for country risks [].
Table 4 documents the spread of risk and discount rates for the 14 projects in focus. The individual discount rates are calculated, taking into account the specific mining risks (consist of Stage and LOM) plus the country-specific risk plus the risk-free long-term interest rate of 2.5% into account. As a result, the lowest discount rate of 7.5% was calculated for the Australian project Browns Range. This low discount rate can be attributed to a detailed feasibility study that was made, to the short LOM of 11 years, and to the low country risk for Australia. The Mount Weld and Kipawa projects also have discount rates lower than 10%. Particularly high discount rates are assumed for the African projects Ngulla (24.5%) and Lofdal (22.5%). The Swedish Norra Kärr project has a discount rate of 15%, which is in the medium range of all projects.
The project-specific discount rate enables the risk-adjusted NPVs to be calculated for each project. The NPV calculations were conducted for the basic scenario and for the scenario with an assumed price increase of 100% for the critical metals. Obviously, due to methodological reasons, the IRRs of the projects did not change, as their calculation did not require an exogenously provided discount rate.
Figure 7 reports the results of the risk-adjusted NPV calculations. Taking project-specific risks into account, only 4 out of the 14 projects in focus received a positive NPV (base case). Only the Browns Range reached a significant net present value of almost $190 million. The other “positive” projects achieved NPVs of less than $100 million. Considering the projects’ long durations and pre-tax, less than $100 million can still be regarded as a high risk for investors. The NPV for Norra Kärr (discount rate of 15%) is negative, and therefore not economically feasible when project-specific risks are taken into account.
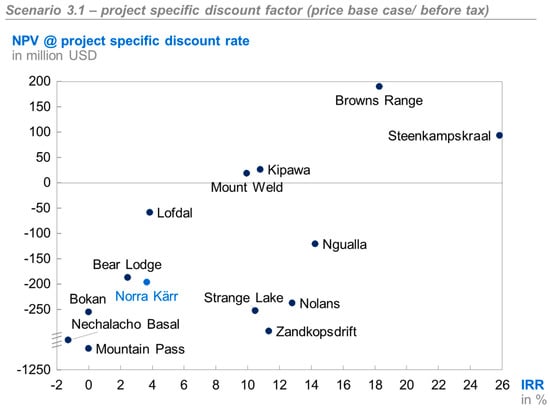
Figure 7.
Base-case results of the DCF model with project-specific discount rates (pre-tax).
Figure 8 reports the risk-adjusted NPVs for the scenario with a price increase of 100% for all critical REOs (compared to the base case scenario). 12 of the 14 projects in focus have a positive net present value, and only Bokan and Mountain Pass did not reach a positive NPV. When compared to scenario 2.3, which also includes a 100% price increase, but was calculated with a uniform discount of 10%, we also find a substantial shift of all projects. For instance, the Australian project Mount Weld now achieves the highest NPV ($1 billion). Browns Range has a substantially higher NPV due to the low risk-adjusted discount rate of 7.5%. Hence, Browns Range becomes much more attractive (NPV $860 million) compared to scenario 2.3 (NPV at $675 million). The projects with the highest risk-adjusted discount rates, Nolans and Zandkopsdrift, lose out under the given assumptions. Nolans (early stage in the project) and Zandkopsdrift (early stage in the project and high country risk) obtained the highest NPV, with >$1.8 billion in the original scenario 2.3. By adapting the project-specific discount rates, the NPV of Nolans loses more than 1.3 billion euros. Nolans’ NPV even drops from $2 billion to $650 million due to project-specific risks. These results illustrate the significance of choosing risk-adjusted, and therefore more realistic, discount rates for each project. The European project Norra Kärr has a positive net present value of $330 million. However, due to the risk-adjusted discount rate of 15%, this is significantly lower compared to scenario 2.3, with $680 million.
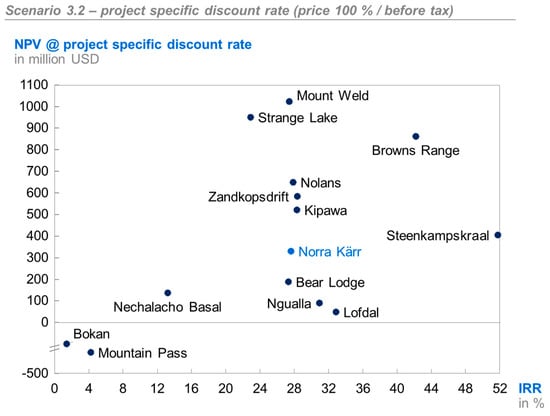
Figure 8.
Results of the DCF model with project-specific discount rates (pre-tax) with a 100% price increase for critical REO.
3.1.4. Sensitivity Analysis
For the parameters Capex, Opex, price and inflation, we conducted sensitivity analyses in order to test how robust the results are when substantial changes occur to crucial parameters. The sensitivity analyses were performed for two exemplified projects. One of them is the European project Norra Kärr and the second is the Australian project Browns Range, for which an elaborate feasibility study (DFS March 2015) has already been conducted, and which includes a high share of critical REO in the ore []. The IRR results of the sensitivity analyses for Norra Kärr and Browns Range are provided in Figure 9 and Figure 10. Additionally, we calculated the payback periods and the NPVs for all parameter changes.
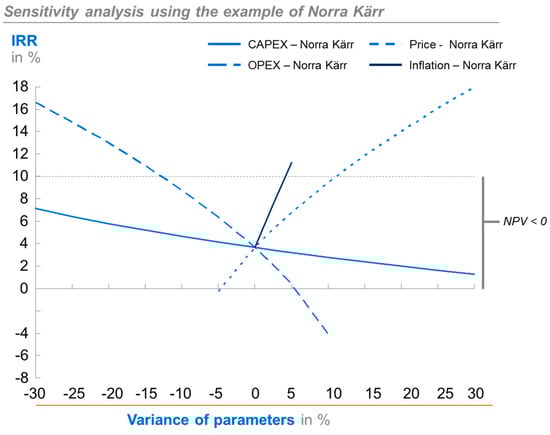
Figure 9.
Sensitivity analyses for the parameters of Capex, Opex, and the basket price of the project Norra Kärr.
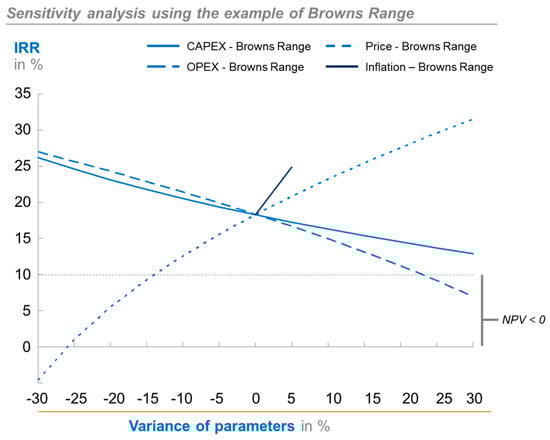
Figure 10.
Sensitivity analyses for the parameters of Capex, Opex, and the basket price of the project Browns Range.
The first parameter that we considered was the initial investment costs (Capex). A variance of CAPEX of ±30% leads to IRRs for Norra Kärr ranging from 7.1% (−30% Capex) up to 1.3% (+30% Capex). This corresponds to a variance in the IRR of about 6%. For the Browns Range project, the IRR varies from 26.3% to 12.9% for the same parameter variance of ±30%. This shows that the Browns Range project is much more sensitive to the change in Capex than Norra Kärr.
Second, we varied the operating costs (OPEX) by ±30% for each of the projects. It is evident (see Figure 9) that Norra Kärr responds more sensitively to a change in Opex compared to a change in Capex. The range of results for Norra Kärr’s IRRs is between 16.6% (−30% OPEX) and 0.5% when Opex is increased by 5%, at 5.5% the IRR is negative, and therefore no further investigation of IRR at Opex +3% was conducted. The Browns Range (see Figure 10) project yields IRR ranges from 26.9% (−30% OPEX) to 6.9% (+30%OPEX).
Furthermore, we looked at the consequences of changes to the basket price. Here, the prices for all REOs were equally changed, and the critical REOs were not examined specifically (see Scenario 2). Again, the changes to the IRR were examined for price changes of ±30%. The NPV (based on a discount rate of 10%) became positive for a 5% basket price increase for Norra Kärr and for a 25% basket price decrease for Browns Range. For Norra Kärr, it follows that for basket price changes of up to 5%, no positive NPV can be reached (Norra Kärr). For Browns Range, a positive NPV can still be reached, even if the basket price decreases by up to 25%. With an increase in the basket prices of +30% for REOs, the IRR increases to 17.9% for Norra Kärr (base case 3.7%) and 31.4% for Browns Range (base case 18.3%). The results of the IRR and NPV are therefore very sensitive to basket price changes.
The impact of potential inflation on costs and prices was examined in the last step of the sensitivity analysis. Here, the inflation rate for investments, operational costs and prices was set to range from 2.5% to 5% per year, respectively. Overall, an increase in the IRR and NPV was observed. Inflation had a positive effect on the profitability of the economic feasibility of the projects, since the revenues, which are determined by prices, absolutely increase more than the costs. Under certain price assumptions, and with an annual inflation of 5%, a positive NPV can be achieved with 11.3% IRR for the Norra Kärr project.
4. Conclusions
With the provided DCF model including the same assumptions (cost structure, prices for REE, risks, etc.) and structure for each mine a first financial comparison of rare earth projects outside of China is now possible. Before this detailed work, only isolated reports with different methods and assumptions provided by each project could be used for information, and these were not suitable for a comprehensive view on rare earth projects outside of China. It is also possible to add new projects or delete projects and update data on prices, cost, REE content, etc., for each project, therefore creating a living investment model for rare earth mines.
Under each of the investigated scenarios, there are rare earth mining projects outside China that are economically attractive even without considering the present (May 2019) political discussion about rare earth exports from China to the U.S. Taking this political and therefore far-reaching economic supply risk into account, rare earth mining outside of China is and will be needed for the western world. To find the most attractive mines, the calculated discounted cash flow models for each of the 14 in this paper investigated advanced rare earth project provide an objective and holistic picture for rare earth mining outside China.
Under all three scenarios, the Mountain Pass and Bokan projects would never achieve a minimum interest rate or a corresponding positive NPV under the given assumptions. The closure of the Mountain Pass deposit in 2015 due to unprofitability supports this theory.
Sensitivity analyses show that price levels (changes to the basket price) on the revenue side have particularly high influence.
The results show that a status quo perspective for such projects is neither sufficient nor expedient but can build a basis for further discussions. It is relevant to consider long-term developments in demand in end product markets and to take into account supply reliability (risk) for dependent companies. Also, supply risk due to political discussions such as at present, with the ongoing ‘export stop discussions’ between China and the U.S., have to be taken into account.
However, dependent companies outside of China will only be able to ensure reliability through long-term contracts and commitments. Furthermore, if REO-processing companies (jointly) invested in a deposit outside China, it could create investment stability, on the one hand and lower supply risk on the other.
At present, rare earth supply discussions between the U.S. and China also have to be taken into account, because simply opening and highly investing in a mine will not be sufficient. Competences in rare earth metallurgy and mining are lacking everywhere outside China. Western countries have also to massively invest in process know-how in order to achieve an independent rare earth supply.
Author Contributions
Conceptualization, M.J., B.F. and P.L.; methodology, M.J., B.F., P.L.; validation, M.J.; formal analysis, M.J.; data curation, M.J.; writing—original draft preparation, M.J.; writing—review and editing, M.J., B.F., P.L.; supervision, B.F., P.L.
Funding
This research received no external funding.
Conflicts of Interest
The authors declare no conflict of interest.
References
- U.S. Geological Survey. Mineral Commodity Summaries Rare Earth in the United States: U.S. Geological Survey Data Series. 2014. Available online: http://minerals.usgs.gov/minerals/pubs/commodity/rare_earths/mcs-2014-raree.pdf (accessed on 22 November 2016).
- MIDAS Research. Industry Report Seltene Metalle und Seltene Erden—Rohstoffe für das 21; Jahrhundert: Mannheim, Germany, 2011. [Google Scholar]
- Humphries, M. Rare Earth Elements: The Global Supply Chain; Congressional Research Service: Washington, DC, USA, 2013. [Google Scholar]
- Kramer, D. Concern grows over China’s dominance of rare-earth metals. Phys. Today 2010, 63, 22. [Google Scholar] [CrossRef]
- Stone, R. RAs China’s Rare Earth R&D Becomes Ever More Rarefied, Others Tremble. Science 2009, 325, 1336–1337. [Google Scholar] [PubMed]
- U.S. Department of Energy. Critical Materials Strategy. 2011. Available online: http://energy.gov/sites/prod/files/DOE_CMS2011_FINAL_Full.pdf (accessed on 22 November 2016).
- Report on Critical Raw Materials for the EU—Critical Raw Materials Profiles; European Commission: Brussels, Belgium, 2014; Available online: http://ec.europa.eu/DocsRoom/documents/11911/attachments/1/translations (accessed on 21 September 2019).
- Thiess, G. Minerals policy in Europe: Some recent developments. Resour. Policy 2010, 35, 190–198. [Google Scholar] [CrossRef]
- Massari, S.; Ruberti, M. Rare earth elements as critical raw materials: Focus on international markets and future strategies. Resour. Policy 2013, 38, 36–43. [Google Scholar] [CrossRef]
- Arafura Resource Limited. Nolans Development Report. 2014. Available online: https://www.arultd.com/images/150826_Mining_the_Territory_FINAL.pdf (accessed on 21 September 2019).
- Lynas Coproration Ltd. Quarterly Report—Period Ending 31 March 2014. Available online: https://www.lynascorp.com/wp-content/uploads/2019/04/140430-Q1-2014-Quarterly-Report-1324839.pdf (accessed on 19 September 2019).
- Lynas Coproration Ltd. Quarterly Report—Period Ending 30 June 2014. Available online: https://www.lynascorp.com/wp-content/uploads/2019/05/140929-Lynas-Financial-Report-2014.pdf (accessed on 20 September 2019).
- Lynas Coproration Ltd. Quarterly Report—Period Ending 30 September 2014. Available online: https://www.lynascorp.com/wp-content/uploads/2019/05/141015-Quarterly-Report-1373317.pdf (accessed on 20 September 2019).
- Lynas Coproration Ltd. Quarterly Report—Period Ending 31 December 2014. Available online: https://www.lynascorp.com/wp-content/uploads/2019/05/150313-Lynas-Interim-Report-31-Dec-14-1419268.pdf (accessed on 20 September 2019).
- Lynas Coproration Ltd. Quarterly Report—Period Ending 31 March 2015. Available online: https://www.lynascorp.com/wp-content/uploads/2019/04/150424-Quarterly-Activities-Report-1430062.pdf (accessed on 20 September 2019).
- Lynas Coproration Ltd. Quarterly Report—Period Ending 30 June 2015. Available online: https://www.lynascorp.com/wp-content/uploads/2019/05/150921-Financial-Report-year-ended-30-June-2015_1475481.pdf (accessed on 20 September 2019).
- Lynas Coproration Ltd. Quarterly Report—Period Ending 30 September 2015. Available online: https://www.lynascorp.com/wp-content/uploads/2019/05/151014-Lynas-Quarterly-Activities-Report.pdf (accessed on 20 September).
- Lynas Coproration Ltd. Quarterly Report—Period Ending 31 December 2015. Available online: https://www.lynascorp.com/wp-content/uploads/2019/05/160310-Half-Year-Accounts-31-Dec-2015-1534548.pdf (accessed on 20 September 2019).
- Ciuculescu, T.; Foo, B.; Gowans, R.; Hawton, K.; Jacobs, C.; Spooner, J. Technical Report Disclosing the Results of the Feasibility Study on the Nechalacho Rare Earth Elements Project; Micon International Limited for Quest Rare Minerals: Toronto, ON, Canada, 2013. [Google Scholar]
- Micon International Limited; Quest Rare Minerals Ltd. NI 43-101 Technical Report on the Preliminary Economic Assessment (PEA) for the Strange Lake property Quebec, Canada; Micon International Limited for Quest Rare Minerals: Toronto, ON, Canada, 2014. [Google Scholar]
- Molycorp. Annual Report 2013. 2014. Available online: https://sec.report/Document/0001489137-14-000014/ (accessed on 21 September 2019).
- Molycorp. Molycorp Reports Fourth Quarter and Full Year 2014 Financial Results. 2015. Available online: https://sec.report/Document/0001489137-15-000007/ (accessed on 21 September 2019).
- Molycorp. Molycorp Reports Third Quarter 2014 Financial Results. 2015. Available online: https://sec.report/Document/0001489137-14-000140/ (accessed on 21 September 2019).
- Molycorp. Molycorp Reports Second Quarter 2014 Financial Results. 2015. Available online: https://sec.report/Document/0001489137-14-000117/ (accessed on 21 September 2019).
- Molycorp. Molycorp Reports First Quarter 2014 Financial Results. 2015. Available online: https://sec.report/Document/0001489137-14-000058/ (accessed on 21 September 2019).
- Northern Minerals. Browns Range Project Definitive Feasibility Study (Presentation). 2015. Available online: http://northernminerals.com.au/wp-content/uploads/2015/02/1503-02-Browns-Range-Definitive-Feasibility-Study-Presentation-.pdf (accessed on 15 November 2016).
- Press Release Namibia Rare Earth Inc. Namibia Rare Earth Files 43-101 Preliminary Economic Assessment Report for Heavy Rare Earth Mine at Lofdal. 2014. Available online: http://www.namibiarareearths.com/lofdal.asp (accessed on 6 November 2016).
- Bentzen, E.H.; Hassan, G.; Galbraith, L.; Hammen, R.F.; Robinson, R.J.; Hafez, S.A.; Annavarapu, S. Preliminary Economic Assessment on the Bokan Mountain Rare Earth Element Project near ketchikan, Alaska; Tetra Tech: Vancouver, BC, Canada, 2013. [Google Scholar]
- Dahlberg, P.S.; Noble, A.; Pickarts, J.T.; Rose, W.L.; Jaacks, J. Bear Lodge Project Canadian NI 43-10 Pre-Feasibility Study Report—Technical Report on the Mineral Reserves and Development of the Bull Hill Mine, Wyoming; Roche Engineering, Rare Element Resources Ltd.: Littleton, CO, USA, 2014. [Google Scholar]
- Roche Engineering, Matamec Explorations Inc. NI 43-101 Report—Feasibility Study for the Kipawa Project. 2013. Available online: http://matamec.com/vns-site/uploads/documents/061623-003-finrep_matamec-n143-101-20131017-001-appen.pdf (accessed on 22 November 2016).
- Peak Resource Limited. Ngualla Rare Earth Project—Preliminary Feasibility Study, Executive Summary. 2014. Available online: https://www.peakresources.com.au/ (accessed on 22 November 2016).
- Venmyn Rand; Frontier Rare Earths Limited. Amended Independent Technical Report on the Results of a Preliminary Economic Assessment of Frontier Rare Earth Limited’s Zandkopsdrift Rare Earth Project. 2012. Available online: http://www.frontierrareearths.com/projects.php (accessed on 22 November 2016).
- Venmyn Deloitte; South Africa for Great Western Minerals Group Ltd. National Instrument 43-101 Independent Technical Report on the Results of a Feasibility Study for the Steenkampskraal Rare Earth Element Project in the Western Cape. 2014. Available online: https://www.steenkampskraal.com (accessed on 22 April 2017).
- Legislative Counsel. Strategic and Critical Materials Stock Piling Act; 1939; Volume 50, p. 98. Available online: https://legcounsel.house.gov/Comps/Strategic%20And%20Critical%20Materials%20Stock%20Piling%20Act.pdf (accessed on 17 February 2017).
- Mason, E. An american view of raw materials problems: The report of the president’s materials policy commission. J. Ind. Econ. 1952, 1, 1–20. Available online: http://www.jstor.org/stable/2097676 (accessed on 17 February 2017). [CrossRef]
- Achzet, B. Empirische Analyse von Preis-Und Verfügbarkeitsbeeinflussenden Indikatoren Unter Berücksichtigung der Kritikalität von Rohstoffen; Disserta Verlag: Hamburg, Germany, 2012; ISBN 978-3954250929. [Google Scholar]
- Kausch, P.; Bertau, M.; Gutzmer, J.; Matschullat, J. Strategische Rohstoffe—Risikovorsorge; Springer Spektrum: Berlin/Heidelberg, Germany, 2014; ISBN 978-3-642-39704-2. [Google Scholar]
- Report on Critical Raw Materials for the EU; European Commission: Brussels, Belgium, 2014; Available online: http://ec.europa.eu/DocsRoom/documents/10010/attachments/1/translations (accessed on 21 September 2019).
- Jaroni, M.; Friedrich, B.; Letmathe, P. Criticality of Rare Earth Metals: A European Analysis; Working Paper; RWTH Aachen University: Aachen, Germany, 2017. [Google Scholar]
- Short, M.; Apelt, T.; Moseley, G.; Mounde, M.; Touche, G.D. Prefeasibility Study-NI 43-101-Technical Report for the Norra Kärr Rare Earth Element Deposit; GBM Minerals Engineering Consultants Ltd.: Twickenham, UK, 2015. [Google Scholar]
- Thomson Reuters Datastream, Rare Earth Prices February 2015, Datastream Professional Version 5.1. Available online: https://www.thomsonreuters.com/en.html (accessed on 23 August 2015).
- Thomson Reuters Datastream. Rare Earth Prices June 2015 Datastream Professional Version 5.1. Available online: https://www.thomsonreuters.com/en.html (accessed on 23 August 2015).
- Thomson Reuters Datastream. Rare Earth Prices August 2015 Datastream Professional Version 5.1. Available online: https://www.thomsonreuters.com/en.html (accessed on 23 August 2015).
- Kruschwitz, L. Investitionsrechnung; De Gruyter: Oldenbourg, Germany, 2014; ISBN 978-3110371734. [Google Scholar]
- Smith, L.D. Discounted Cash Flow Analysis—Methodology and Discount Rate. Available online: http://citeseerx.ist.psu.edu/viewdoc/download;jsessionid=543F8857AD3C3993C03674199C662AA9?doi=10.1.1.201.2710&rep=rep1&type=pdf (accessed on 19 September 2019).
- Baurens, S. Valuation of Metals and Mining Companies. 2010. Available online: http://www.basinvest.ch/upload/pdf/Valuation_of_Metals_and_Mining_Companies.pdf (accessed on 25 November 2016).
- Boerse.de. Konjunkturdaten. 2016. Available online: http://www.boerse.de/konjunkturdaten/staatsanleihen (accessed on 3 May 2016).
- Schacht, U.; Fackler, M. Praxishandbuch Unternehmensbewertung: Grundlagen, Methoden, Fallbeispiele; Gabler Verlag: Wiesbaden, Germany, 2015; ISBN 978-3409126984. [Google Scholar]
© 2019 by the authors. Licensee MDPI, Basel, Switzerland. This article is an open access article distributed under the terms and conditions of the Creative Commons Attribution (CC BY) license (http://creativecommons.org/licenses/by/4.0/).