Experimental Simulation of the Self-Trapping Mechanism for CO2 Sequestration into Marine Sediments


1
Advanced Plant Laboratory, Central Research Institute, Korea Hydro and Nuclear Power Co., Ltd. (KHNP), Daejeon 34101, Korea
2
Department of Civil and Environmental Engineering, Korea Advanced Institute of Science and Technology (KAIST), Daejeon 34141, Korea
*
Author to whom correspondence should be addressed.
Minerals 2019, 9(10), 579; https://doi.org/10.3390/min9100579
Submission received: 31 July 2019
/
Revised: 12 September 2019
/
Accepted: 16 September 2019
/
Published: 24 September 2019
(This article belongs to the Special Issue Geological and Mineralogical Sequestration of CO2)
Abstract
:CO2 hydrates are ice-like solid lattice compounds composed of hydrogen-bonded cages of water molecules that encapsulate guest CO2 molecules. The formation of CO2 hydrates in unconsolidated sediments significantly decreases their permeability and increases their stiffness. CO2 hydrate-bearing sediments can, therefore, act as cap-rocks and prevent CO2 leakage from a CO2-stored layer. In this study, we conducted an experimental simulation of CO2 geological storage into marine unconsolidated sediments. CO2 hydrates formed during the CO2 liquid injection process and prevented any upward flow of CO2. Temperature, pressure, P-wave velocity, and electrical resistance were measured during the experiment, and their measurement results verified the occurrence of the self-trapping effect induced by CO2 hydrate formation. Several analyses using the experimental results revealed that CO2 hydrate bearing-sediments have a considerable sealing capacity. Minimum breakthrough pressure and maximum absolute permeability are estimated to be 0.71 MPa and 5.55 × 10⁻⁴ darcys, respectively.
1. Introduction
Carbon capture and storage (CCS) technology is essential for rapid CO2 mitigation. The geological storage of carbon dioxide (CO2) is a highly effective, long-term mitigation solution for the large quantities of CO2 emissions [1,2]. For these reasons, to date, CO2 geological sequestration (CGS) technology has been developed by several leading countries. However, most of existing CGS methods worldwide require particular geological structures to work, such as a highly pervious rock formation (e.g., sandstone layer) imbedded in impermeable layers (i.e., cap-rocks). This requirement leads to CGS application difficulties such as a shortage of proper sites, challenges in the long-range transport of CO2, deep drilling and injection, and restricted storage capacity, which substantially increases the cost of using CGS. To overcome these limitations, several CGS methods that do not need cap-rock, such as carbonated water injection (CWI), have been suggested [3,4,5,6].
CO2 can be stored in unconsolidated sediments under CO2 hydrate-bearing sediments. CO2 hydrates are ice-like solid lattice compounds composed of hydrogen-bonded water cages that encapsulate guest molecules of CO2. CO2 hydrates are formed in the seabed under low temperatures and high pressures [7,8]. Previous studies on natural gas hydrate-bearing sediments [9] and preliminary studies on CO2 hydrate-bearing sediments [10,11] have shown that CO2 migration is significantly hampered by the formation of gas hydrates, resulting in a self-trapping mechanism. Furthermore, the self-preservation response of CO2 hydrates slows the CO2 hydrate dissociation process [12], which serves to mend unintended fractures of CO2 hydrate-bearing sediments, thereby severely diminishing the transport of CO2 fluids [13,14]. Thus, it has been suggested that CO2 hydrates can be used as primary or secondary safety factors for CO2 geological storage in marine unconsolidated sediments [15,16,17]. Furthermore, unconsolidated sand sediments have advantages over consolidated rocks (e.g., sandstones) in that the CO2 storage capacity of the former is higher than that of the latter due to the high porosity of unconsolidated sandy sediments (40–60%). In addition, the CO2 injectability of unconsolidated sand sediments is superior because of their high permeability (0.1–10 darcys) resulting from wide and well-connected pore spaces.
Tohidi et al. (2010) performed experimental CO2 leakage simulations through each type of unconsolidated sediment (glass-bead, sand, and sand–clay mixture), and using electrical resistance measurements and a CO2 concentration analysis they confirmed the existence of the self-trapping effect of CO2 hydrates [11]. Massah et al. (2018) demonstrated the sequestration of CO2 through horizontal injection into a laboratory scale reservoir and revealed the large storage density of CO2 hydrate formations [18]. Gauteplass et al. (2018) described CO2 hydrate formation caused by liquid CO2 injection into cold, water-saturated sandstone and reported that hydrate formation in the pore space resulted in blockage of CO2 flow under most conditions [19]. However, more direct and comprehensive experimental data including temperature–pressure relations, elastic wave velocity, and dissociation tests are required for a better understanding of the behavior of CO2 and CO2 hydrate formation in unconsolidated sediments.
The objective of this study was to simulate CO2 geological storage into marine unconsolidated sediments using CO2 hydrates as a cap-rock. A large reaction cell was used to experimentally verify the CO2 self-trapping mechanism in marine sediments and to evaluate the behavior of CO2-stored unconsolidated sediment during CO2 hydrate formation and dissociation.
2. Experimental Program
2.1. Soil Used
The strata of unconsolidated marine sediments typically consist of multiple layers of a different sediment types such as sand-rich sediment layers and fine-grained sediment layers. The permeability of fine-grained sediments is very low (i.e., 10−3–10−7 darcys; [20]), therefore, fine-grained sediments can be practically considered as impermeable layers, which obstruct the upward flow of CO2. Meanwhile, sand-rich sediments are suitable as CO2 storage host sediments because of their relatively high permeability (0.1–10 darcys), while they are ready for permeation of CO2. The effect of the self-trapping mechanism on a sand-rich layer is, therefore, important to CO2 geological storage into unconsolidated sediments. In this study, fine sand (Ottawa F110; mean particle size = 120 μm, specific gravity = 2.65, permeability = 5–6 darcys, quartz 99%) was used as the host sediment sample.
2.2. Experiment Setup
The experimental design simulated CO2 injection into a shallow marine sediment (i.e., high water pressure, low temperature) and CO2 hydrate formation. The experimental design used in this study is shown in Figure 1. A cylindrical and rigid-wall reaction cell was made of an aluminum alloy (duralumin, AA2024). The inner diameter of the cell was 20 cm, the height of the interior was 100 cm, and the internal volume was 31.4 L. The reaction cell was originally developed for an experimental simulation of thermal stimulation on gas hydrate-bearing sediments [21]. Water and liquid CO2 were injected from the bottom of the reaction cell using a water pump and gas booster. Pressure inside the reaction cell was controlled using a back-pressure regulator at the top of the cell. The quantities of CO2 gas and water that flowed out of the reaction cell were measured using a water substitution system.
Various types of sensors were installed at predetermined layers (every 10 cm) within the reaction cell as shown in Figure 2. The cell contained five T-type thermocouples for temperature measurements of the cell interior, five pressure transducers for fluid pressure measurements, five pairs of piezoelectric ceramic disks (diameter: 20 mm) for compressional wave (P-wave) measurements at layers A1–A5, and four pairs of electrodes for electrical resistance measurements at layers B1–B4. For P-wave velocity measurements, square-shaped pulses with amplitude of 10 V (peak-to-peak) were used for excitation, and the input frequency ranged from 1 to 10 kHz. The electrodes were connected to an LCR meter in order to measure the electrical resistance (frequency = 50 kHz).
Cool water was circulated through copper tubes that coiled around the reaction cell. The temperature inside the reaction cell was controlled by two water coolers, which had different temperatures (i.e., Water cooler 1 at 3 °C, and Water cooler 2 at 15 °C). Figure 3 shows the temperature gradient of the inside of the reaction cell, which was formed by two separated cooling systems. The CO2 hydrate stability zone was developed in the middle part of the reaction cell (i.e., height of 0.35–0.75 m in the reaction cell).
2.3. Experimental Procedure
The experiment involved three procedures: (1) The preparation of a water-saturated sample; (2) the injection of the CO2 liquid; and (3) the depressurization of the cell. When the CO2 liquid was injected from the bottom of the cell, the injected CO2 moved upward in the water-saturated sediment sample due to its buoyancy. Then, CO2 hydrates formed within the CO2 hydrates stable zone, which was located at the middle part of the cell (refer to Figure 3). The depressurization test was performed after CO2 hydrate formation to evaluate the behavior of CO2 during hydrate dissociation. These procedures are detailed within this subsection.
2.3.1. Water-Saturated Sample Preparation
To simulate deep-marine sediments, a water-saturated fine sand (i.e., Ottawa F110 sand) sample was prepared. First, the sample was mixed with distilled water and packed into the cell by hand tamping. The cell was fully filled with moist sand and the porosity of the sample was 0.40. Then, the cell was slowly flushed with distilled water at pressure of ~0.5 MPa for several hours to remove remaining air bubbles. During the water flushing, a cooling process was initiated. After the completion of water flushing, the cell was pressurized to 5.5 MPa with distilled water and left for about 16 h to stabilize the temperature throughout the sample.
Our primary goal was to study the self-trapping effect induced by CO2 hydrates, and because of that, distilled water was used as pore water instead of saline water (it allows easier hydrate formation). However, this decision means that the electrical and geochemical behavior in this experiment was different from the real behavior in the marine sediments.
2.3.2. Injection of CO2 Liquid
Liquid CO2 was introduced into the cell from the bottom using the gas booster. The injection pressure was 5.6 MPa, and the backpressure at the top of the cell was 5.0 MPa. Thirty-four hours later, the injection pressure and backpressure increased to 6.2 and 5.6 MPa, respectively. The CO2 liquid was injected for more than 17 days while the temperature, pressure, P-wave velocity, and electrical resistance were measured. The formation of CO2 hydrates during the CO2 injection process was expected (refer to Section 3).
2.3.3. Depressurization
The cell was depressurized stepwise using a back-pressure regulator while the inlet valve was closed. Each depressurization step was 0.5 MPa for more than 16 hours. Temperature, pressure, P-wave velocity, and electrical resistance during the depressurization process were measured in the same manner as during CO2 injection process.
3. Experimental Results
3.1. Liquid CO2 Injection Process
When the CO2 liquid was injected from the bottom of the cell, a CO2 liquid plume moved upward because of a buoyancy force. Eventually, the CO2 liquid front reached the CO2 hydrate stability zone, and then CO2 hydrates formed. The CO2 hydrate-bearing sediment layer then obstructed the upward flow of the CO2 liquid. While water and CO2 were consumed in the CO2 hydrate formation process in the hydrate stability zone, the CO2 hydrate-bearing sediment layer prevented CO2 supply. Thus, a pressure difference between the upper and lower part of the cell appeared. The P-wave velocity and electrical resistance monitoring results indicated the formation of CO2 hydrates and the blockage of the CO2 flow. Detailed experimental results are shown in the following sections.
3.1.1. Temperature and Pressure
Figure 4 shows the pressure of each layer in the cell over time. The CO2 liquid was injected at 1300 min after data logging started. The pressure in each layer was scattered until 5000 min because of a difference in pressure between the injection pressure and backpressure (i.e., ~0.6 MPa, refer to Section 2.3.2), and volume change of pore fluids due to CO2 dissolution into pore water. The pressure in each layer was very similar to one another because the pore space was well connected throughout the sample. CO2 hydrates started to form when the injected CO2 reached the CO2 hydrate stability zone (herein, between layers A3 and A4; Figure 3). Then, the pressure in layers A1, A2, and A3 rapidly dropped to 3.3 MPa after 5000 min while the pressure of layers A4 and A5 were nearly constant and identical to the injection pressure. The difference in pressure between the upper and lower part of the cell was induced by the sealing (i.e., pore clogging) effect of the CO2 hydrate bearing-sediments layer.
The sealing capacity of the CO2 hydrate-bearing sediment layer gradually increased during the growth of CO2 hydrates in the pore space of the sample. Meanwhile, water and CO2 were consumed during CO2 hydrate formation. For a constant-volume process, the consumption of CO2 and water during CO2 hydrate formation leads to a pressure decrease because the molar volume of the CO2 hydrates is smaller than the original molar volume of the consumed fluids. For the lower part of the cell (represented by layers A4 and A5) the pressure was preserved because CO2 was supplied continuously from the bottom of the cell during the experiment. For the upper part of the cell (represented by layers A1, A2, and A3), however, the pressure decreased because the CO2 hydrate-bearing sediment layer prevented the CO2 to be supplied from the lower part of the cell.
Figure 5 shows the pressure–temperature evolution during the CO2 injection test. Note that layers A2 and A3 were in the CO2 hydrate stable condition while the others were not. The pressure of the upper part of the cell (i.e., layers A1, A2, and A3) decreased when the sealing capacity of the CO2 hydrate-bearing sediment layer increased to a level that prevented flow. Note that there were no CO2 hydrates in layer A2 because the injected CO2 did not reach it, even though this layer is in the CO2 hydrate stability zone. Meanwhile, the lower part of the cell (i.e., layers A4 and A5) maintained a constant pressure level. Then, the pressure of the upper part of the cell gradually increased. There are two mechanisms for the pressure recovery of the upper part of the cell: (1) The uppermost CO2 hydrates dissociated with the pressure decrease. Therefore, pressure was recovered restrictively via emitted CO2 and water from the CO2 hydrates, and (2) CO2 hydrate saturation is limited by capillary pressure, which is determined by the pore size [23].
In the central part of the CO2 hydrate-bearing sediment layer, CO2 hydrates grew until the CO2 hydrate saturation reached maximum CO2 hydrate saturation. Thus, the consumption of CO2 and water diminished because any additional formation of CO2 hydrates was restricted. Finally, the pressure of the upper part of the cell increased to 5.2–5.5 MPa. However, the pressure of the upper part of the cell was still lower than that of the lower part of the cell. The repetitive ascending and descending pressure could be due to the continuous repetition of the CO2 formation and dissociation process at the CO2 hydrates front.
3.1.2. P-Wave Velocity
Figure 6 shows the results of the P-wave velocity measurements during the CO2 injection process. Before the water injection process, the cell was partially saturated, and the P-wave velocity was about 900 m/s. When the sediment sample was saturated by distilled water, the P-wave velocity of all the layers was about 1600 m/s. Then, when the CO2 liquid was injected, the P-wave velocities of the lower part of the cell (i.e., layers A4 and A5) decreased because the bulk modulus of the CO2 liquid was much lower than that of the water [24,25]. Meanwhile, the P-wave velocity of layer A3 gradually increased because of the stiffening effect induced by CO2 hydrate formation. This P-wave velocity increase in layer A3 indicates that the CO2 hydrate bearing-sediment layer is between layers A3 and A4. On the other hand, the P-wave velocity of layer A1 and A2 did not change during CO2 injection. This is evidence that the CO2 hydrate-bearing sediment layer prevents any upward flow of the CO2 liquid.
3.1.3. Electrical Resistance
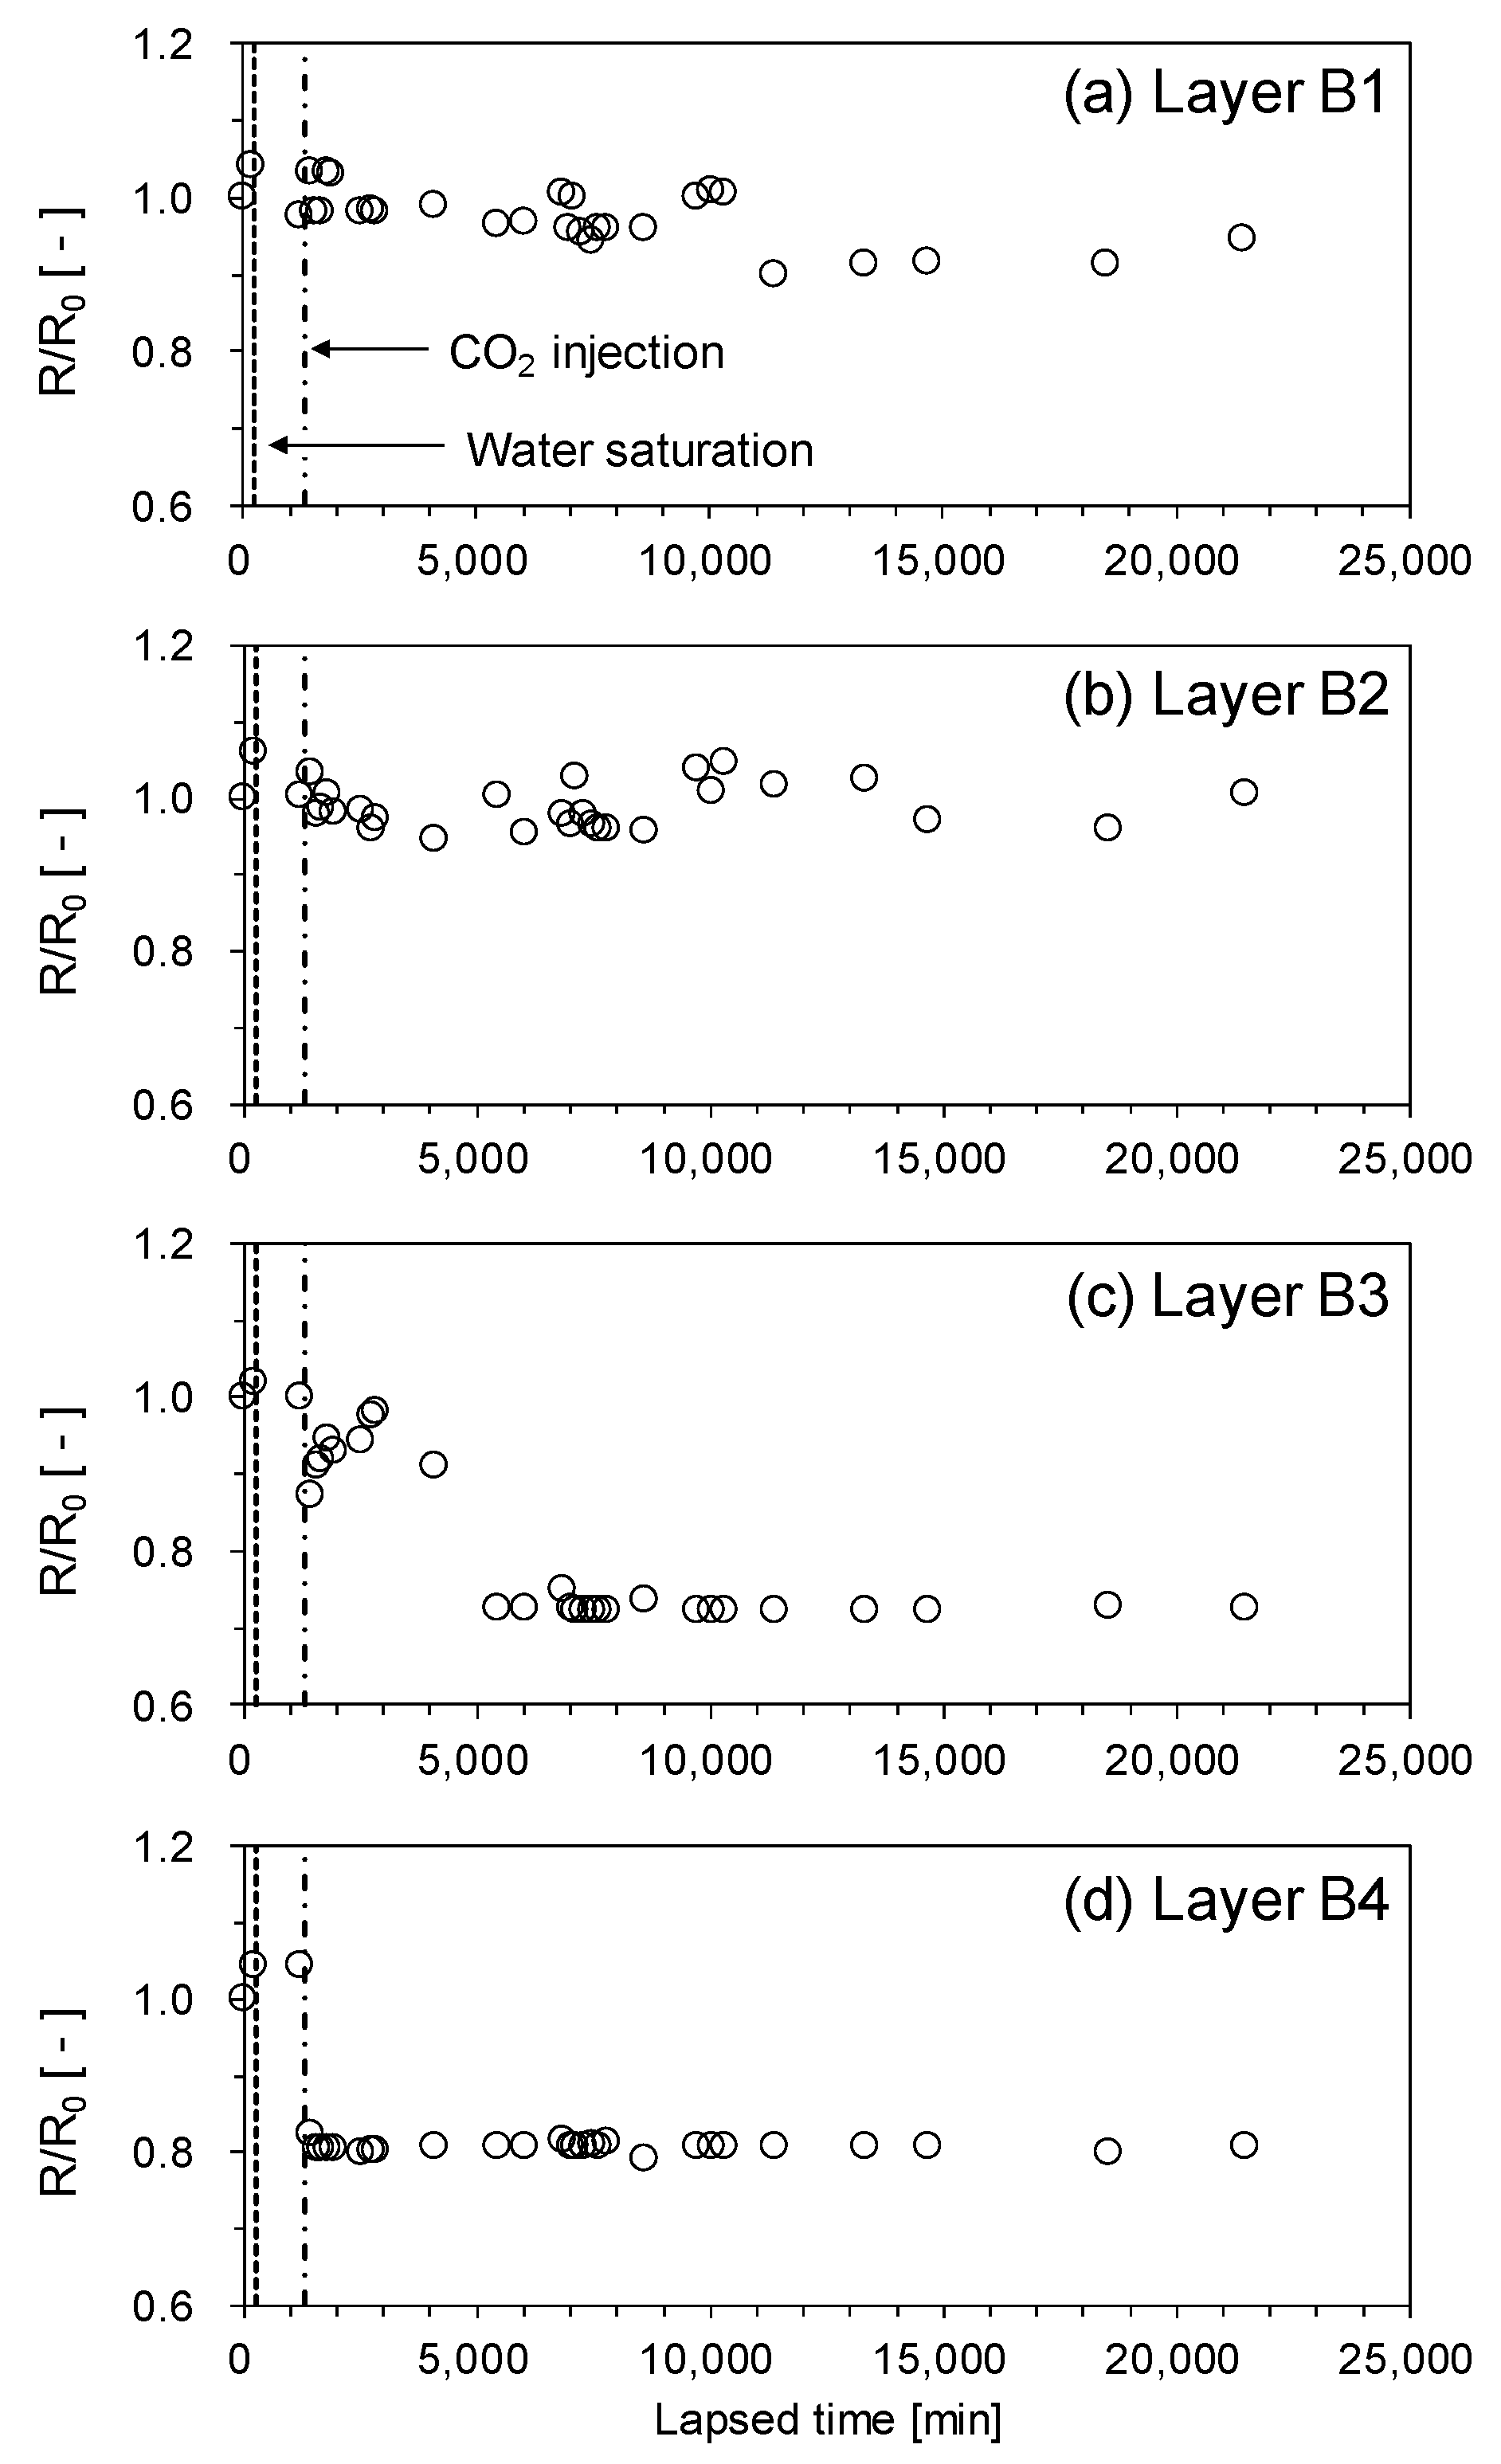
Figure 7 shows the normalized electrical resistance (R/R0) during the CO2 injection process, where R is the measured electrical resistance and R0 is the initial electrical resistance of the distilled water-saturated sample at each layer (i.e., layers B1–B4). For the lower part of the cell (i.e., layers B3 and B4), the electrical resistance decreased with CO2 injection because of the dissolution of CO2.
Electrical resistance increased in-situ in the marine sediments because the conductive pore water (i.e., brine) was replaced by CO2, which is a nonpolar molecule. This electrical resistance increase induced by the CO2 replacement was weakened by the dissolution of CO2 and the surface effect of the mineral grains [26]. For typical brine, the effect of CO2 dissolution on electrical resistance is negligible because the concentration of salt (i.e., NaCl) is much larger than the ionic concentration increased by CO2 dissolution [27]. However, if the salt concentration is low (e.g., onshore sediments), electrical resistance of in-situ sediments can decrease during the CO2 permeation [28]. In this experiment, the effect of dissolved CO2 was dominant on electrical resistance because the pore water was distilled.
Meanwhile, the electrical resistance of the upper part of the cell (i.e., layers B1 and B2) showed minor changes during CO2 injection. This is additional evidence demonstrating that CO2 liquid did not reach the upper part of the cell. Based on the change of the pressure, P-wave velocity and electrical resistance, we can presume that the CO2 hydrate formation front is located between layers A3 and B3. Meanwhile, CO2 hydrates formation was not observed in the electrical resistance data. The electrical resistance of in-situ water-saturated sediments increased when CO2 hydrates formed because the electrical resistance of CO2 hydrates is higher than pore water [29,30]. In this study, however, the change in electrical resistance was insignificant in spite of the presence of CO2 hydrates, because distilled water was used as pore water in this experiment. This is the one of the limitations of this experiment.
3.2. Depressurization Process
3.2.1. Temperature and Pressure
Figure 8 shows the pressure of each layer in the cell over time. The pressure of the cell was reduced step-wise using a back-pressure regulator. Pressure differences between the upper and lower part of the cell remained, even though CO2 was vaporized. This pressure discrepancy indicated that the sealing capacity of the CO2 hydrate-bearing sediment layer was preserved. When the CO2 hydrate dissociated completely, the pressure of each layer became equal.
Figure 9 shows the pressure–temperature relationship during the depressurization test. The pressure of the cell dropped with the pressure release using the back-pressure regulator. When the pressure of layers A4 and A5 reached the CO2 vapor pressure, their pressure and temperature relation moved along the CO2 vapor pressure (Figure 9a). The path of the pressure and temperature relationship of layers A4 and A5 was similar to that of the isometric process because the flow of fluids was obstructed by the remaining CO2 hydrate-bearing sediment layer (Figure 9b). Then, the pressure and temperature relationship of layer A2 moved along the CO2 hydrate equilibrium line (Figure 9c). This is evidence that the CO2 hydrates re-formed and dissociated in layer A2. In the previous CO2 injection process, CO2 liquid did not reach layer A2 because of the sealing effect of the CO2 hydrate-bearing sediment layer, which was located between layers A3 and B3. However, CO2 was supplied to layer A2 when the existing CO2 hydrates partially dissociated by depressurization. CO2 hydrates then re-formed because layer A3 is in the CO2 hydrate stability zone. Then, CO2 hydrates in layer A3 dissociated by additional depressurization. During the dissociation of CO2 hydrates in layer A3, a self-preservation effect was observed in the pressure and temperature relationship as seen in previous experimental studies on CO2 hydrate dissociation [12,31]. Finally, CO2 hydrates completely dissociated with step-wise depressurization (Figure 9d).
3.2.2. P-Wave Velocity
Figure 10 shows the results of the P-wave velocity measurements taken during the depressurization process. The sealing effect of the original CO2 hydrate-bearing sediment layer reduced because some portion of the original CO2 hydrates dissociated. Thus, the P-wave velocity of layer A1 decreased because CO2 intruded the upper part of the cell. On the other hand, the P-wave velocity of layers A2 and A3 suddenly increased because CO2 hydrates formed using the CO2 supply from the lower part of the cell. Note that layers A2 and A3 were in the CO2 hydrate stability zone until 3300 minutes (refer to Figure 9). Meanwhile, the P-wave velocity of layers A4 and A5 decreased because CO2 vaporized during depressurization. When the pressure was lower than the equilibrium pressure of the CO2 hydrates (i.e., 4000–6000 min, refer to Figure 9d), the P-wave velocity of layers A2 and A3 suddenly decreased because reformed CO2 hydrates in these layers dissociated.
3.2.3. Electrical Resistance
Figure 11 shows the normalized electrical resistance (R/R0) during the depressurization process. The results of the electrical resistance measurements indicated that CO2 intruded the upper part of the cell. For layers B1 and B2, electrical resistance exhibited complex behavior due to the formation of CO2 hydrates and the movement of CO2 gas bubbles. However, the electrical resistance decreased generally because of CO2 dissolution. As stated before, electrical resistance of distilled water-saturated sediment decreased with CO2 intrusion because of dissolved CO2. Meanwhile, the electrical resistance of the lower part of the cell (i.e., layers B3 and B4) was barely affected by depressurization because the pore water of the lower part of the cell was already saturated by dissolved CO2.
4. Discussion: Simple Analysis on the Sealing Capacity of CO2 Hydrate-Bearing Sediments
There are two major sealing mechanisms for CO2 structural trapping. One is the capillary seal, which occurs by capillary pressure between CO2 and water in pores. The other sealing mechanism is the permeability seal, which is related to the laminar flow velocity of CO2 in pores due to a pressure gradient. In view of the two sealing mechanisms, a simple analysis on the sealing capacity of the CO2 hydrate-bearing sediment was performed using the experimental results.
4.1. Capillary Sealing Capacity
Capillary pressure is the difference in pressure across the interface between two fluids. In petroleum reservoirs, capillary pressure between oil and water in rock pores is responsible for trapping oil [32,33]. In the same manner, capillary pressure between water and CO2 can trap CO2. For a given pore structure, the CO2 breakthrough pressure (PC*) induced by capillarity can be described using the Young–Laplace equation:
where γ is interfacial tension between water and CO2, θ is wetting angle, and d* is the critical pore throat diameter. Several researchers have measured various temperatures and pressures for the interfacial tension between water and CO2 [34,35,36].
In this study, the CO2 hydrate-bearing sediment layer could maintain about 0.71 MPa of pressure difference between the upper and lower part of the cell (Figure 12). Thus, the minimum breakthrough pressure (PC*min) can be assumed as the average pressure difference between the upper and lower parts of the cell (ΔPaverage), which is described in Figure 12 (i.e., PC* ≥ PC*min = ΔPaverage). Then, the maximum critical pore throat diameter of CO2-hydrate bearing sediments (d*max) was calculated as 132 nm using Equation (1). The values used in this calculation are summarized in Table 1.
If the pressure difference between the fluid interface exceeds PC*, then CO2 breaks through the interface, and laminar flow occurs [35,37,38]. Thus, in order for the capillary sealing mechanism to work, the breakthrough pressure (PC*) must be larger than the buoyancy pressure of the CO2 plume. The buoyancy pressure (PB) that is induced by the density difference between water and CO2 can be described as
where g is the acceleration of gravity, h is the thickness of the CO2-stored layer, and ρwater and ρCO2 are the density of water and CO2, respectively. In a similar manner to the calculation of d*max, the minimum buoyancy pressure (PBmin) which could be maintained by the CO2 hydrate-bearing sediment can be assumed as ΔPaverage (i.e., PB ≥ PBmin = ΔPaverage). At a similar thermodynamic condition of the experiment in this study (i.e., pressure of 6 MPa and temperature of 15 °C), ρCO2 was 784 kg/m3 [39]. Then, the minimum thickness of the CO2-stored layer (hmin) was calculated as 335 m according to Equation (2). Thus, we can presume that the capillary trapping capacity of the CO2 hydrate-bearing sediment is high enough.
The wettability (i.e., wetting angle) could be altered by the increase of the gas hydrate saturation because the solid materials contacting pore fluids are changed from sand particles to CO2 hydrates. For simplicity, this wettability alteration was not considered in this study. Further studies are required to evaluate the effect of wettability iteration on CO2 capillary sealing capacity.
4.2. Permeability Sealing Capacity
When the buoyancy pressure (PB) is higher than breakthrough pressure (PC*), CO2 flow occurs. Fluid flow through soils finer than coarse gravel is laminar [40]. For laminar flow in CO2-saturated sediments the flow velocity, v, can be expressed by Darcy’s law as follows:
where K is absolute or intrinsic permeability of the sediments, ρCO2 is the density of CO2 fluids, g is the gravity constant, μCO2 is the viscosity of CO2 fluids, and i is the hydraulic gradient which is expressed by the difference between two hydraulic heads over the flow length. Note that the hydraulic gradient (i) is 1 for a vertical flow. Meanwhile, the average flow velocity for flow through a round capillary tube (v0) can be described by Poiseuille’s law as follows:
where d is the diameter of the capillary tube. The flow velocity determined by Poiseuille’s law (v0) is the upper limit of the flow velocity (i.e., v ≤ v0) in porous media because flow velocity in sediments decreases by the tortuosity of the flow channel. Therefore, the upper limit of the absolute permeability of sediments can be defined using Equations (3) and (4) as
The maximum absolute permeability of CO2 hydrate-bearing sediment (Kmax) can, therefore, be calculated using the d*max, which was obtained before. Kmax is about 5.55 × 10⁻⁴ darcy. This value is similar to the permeability of fine-grained sediments (i.e., 10−3–10−7 darcys [20]), and can be considered as “very low” permeability [41].
4.3. Comparison with Other Materials
Estimated maximum absolute permeability (Kmax) and minimum breakthrough pressure (PC*min) are compared with measured absolute permeability (K) and breakthrough pressure (PC*) of various sediment samples, as shown in Figure 13. We presumed that the breakthrough pressure of F110 sand increases by more than 102 times with CO2 hydrate formation. The minimum breakthrough pressure (PC*min) of the CO2 hydrate-bearing sediments estimated in this study is comparable with that of unconsolidated clays and the shale sample. Meanwhile, the actual PC* of CO2 hydrate-bearing sediments in this experimental simulation may be higher than the estimated PC*min because the latter was estimated conservatively using the pressure difference between upper and lower parts of the cell, instead of being measured directly. In the same manner, actual K of CO2 hydrate-bearing sediments in this experimental simulation may be lower than estimated Kmax. This might be attributed to the Kmax being calculated conservatively using the assumption of fluid flow in a round capillary tube without any tortuosity. To determine the range of absolute permeability and breakthrough pressure of CO2 hydrate-bearing sediments, further experimental studies are required.
5. Conclusions
We performed an experimental simulation of CO2 geological storage in marine unconsolidated sediments in this study. CO2 hydrates were formed during the CO2 liquid injection process, and we observed the self-trapping effect of CO2 hydrates. In addition, simple analyses were conducted using the experimental results. The feasibility of CO2 geological storage in marine unconsolidated sediments was experimentally verified using 1-m-height high-pressure cell. CO2 hydrates instantly formed in the unconsolidated sediments with CO2 introduction, and prevented any upward leakage of CO2. The main findings are summarized as follows:
- CO2 hydrates formed in the CO2 hydrate stability zone of the cell during the CO2 liquid injection process. The CO2 hydrate-bearing sediment layer prevented any upward flow of CO2. This self-trapping effect was confirmed by monitoring pressure, P-wave velocity, and electrical resistance.
- The original CO2 hydrates partially dissociated during the depressurization process, and additional CO2 hydrates instantly formed in the upper layer, which was in the CO2 hydrate stability zone. When CO2 hydrates dissociated, CO2 hydrates could re-form in the upper layer (i.e., cooler layer for marine sediments) instantly. This behavior is a positive characteristic of CO2 hydrates for use as cap-rock in CGS applications.
- The CO2 hydrate-bearing sediment layer maintained a pressure of 0.71 MPa during the experiment. Simple analyses revealed that the capillary and permeability sealing capacity of CO2 hydrate-bearing sediments are considerably high.
Permeability and breakthrough pressure of CO2 hydrate-bearing sediments depend on the saturation of CO2 hydrates in the pore system. However, CO2 hydrate saturation was not analyzed in detail in the present study, as sufficient information regarding maximum CO2 hydrate saturation via experimental simulation was lacking. We expect that a geophysical analysis using experimental data from a denser sensor array could overcome this limitation. Meanwhile, the electrical and geochemical behavior of the CO2-containing sediments in this study was different from that in real marine sediments because distilled water was used as pore water instead of saline water. To overcome this limitation, an experiment using saline water will be performed for further study.
Author Contributions
Conceptualization, G.-C.C. and H.-S.K.; Methodology, G.-C.C. and H.-S.K.; Writing—Original Draft Preparation, H.-S.K.; Writing—Review & Editing, G.-C.C.; Visualization, H.-S.K.; Supervision, G.-C.C.
Funding
This research was supported by the Korea government (Ministry of Trade, Industry, and Energy) through the Project “Gas Hydrate Exploration and Production Study (19-1143)” under the management of the Gas Hydrate Research and Development Organization (GHDO) of Korea, and the National Research Foundation of Korea (NRF) grant funded by the Korea government (Ministry of Science and ICT) (No. 2017R1A5A1014883).
Conflicts of Interest
The authors declare no conflict of interest.
References
- Hepple, R.; Benson, S. Implications of Surface Seepage on the Effectiveness of Geologic Storage of Carbon Dioxide as a Climate Change Mitigation Strategy. In Proceedings of the Greenhouse Gas Control Technologies—6th International Conference, Kyoto, Japan, 1–4 October 2002. [Google Scholar]
- Shaffer, G. Long-term effectiveness and consequences of carbon dioxide sequestration. Nat. Geosci. 2010, 3, 464. [Google Scholar] [CrossRef]
- Sohrabi, M.; Riazi, M.; Jamiolahmady, M.; Kechut, N.I.; Ireland, S.; Robertson, G. Carbonated water injection (CWI)—A productive way of using CO2 for oil recovery and CO2 storage. Energy Procedia 2011, 4, 2192–2199. [Google Scholar] [CrossRef]
- Sohrabi, M.; Kechut, N.I.; Riazi, M.; Jamiolahmady, M.; Ireland, S.; Robertson, G. Coreflooding Studies to Investigate the Potential of Carbonated Water Injection as an Injection Strategy for Improved Oil Recovery and CO2 Storage. Transp. Porous Media 2012, 91, 101–121. [Google Scholar] [CrossRef]
- Bagalkot, N.; Hamouda, A.A. Diffusion coefficient of CO2 into light hydrocarbons and interfacial tension of carbonated water–hydrocarbon system. J. Geophys. Eng. 2018, 15, 2516–2529. [Google Scholar] [CrossRef]
- Hamouda, A.A.; Bagalkot, N. Effect of salts on interfacial tension and CO2 mass transfer in carbonated water injection. Energies 2019, 12, 748. [Google Scholar] [CrossRef]
- Brewer, P.G. Direct Experiments on the Ocean Disposal of Fossil Fuel CO2. Science 1999, 284, 943–945. [Google Scholar] [CrossRef] [PubMed]
- Inagaki, F.; Kuypers, M.M.M.; Tsunogai, U.; Ishibashi, J.; Nakamura, K.; Treude, T.; Ohkubo, S.; Nakaseama, M.; Gena, K.; Chiba, H.; et al. Microbial community in a sediment-hosted CO2 lake of the southern Okinawa Trough hydrothermal system. Proc. Natl. Acad. Sci. USA 2006, 103, 14164–14169. [Google Scholar] [CrossRef] [PubMed]
- Nimblett, J.; Ruppel, C. Permeability evolution during the formation of gas hydrates in marine sediments: Gas hydrate and permeability changes. J. Geophys. Res. Solid Earth 2003, 108, 2420. [Google Scholar] [CrossRef]
- Koide, H.; Takahashi, M.; Tsukamoto, H.; Shindo, Y. Self-trapping mechanisms of carbon dioxide in the aquifer disposal. Energy Convers. Manag. 1995, 36, 505–508. [Google Scholar] [CrossRef]
- Tohidi, B.; Yang, J.; Salehabadi, M.; Anderson, R.; Chapoy, A. CO 2 Hydrates Could Provide Secondary Safety Factor in Subsurface Sequestration of CO2. Environ. Sci. Technol. 2010, 44, 1509–1514. [Google Scholar] [CrossRef] [PubMed]
- Kwon, T.H.; Cho, G.C.; Santamarina, J.C. Gas hydrate dissociation in sediments: Pressure-temperature evolution: Gas hydrate dissociation in sediments. Geochem. Geophys. Geosyst. 2008, 9. [Google Scholar] [CrossRef]
- Stern, L.A.; Circone, S.; Kirby, S.H.; Durham, W.B. Anomalous Preservation of Pure Methane Hydrate at 1 atm. J. Phys. Chem. B 2001, 105, 1756–1762. [Google Scholar] [CrossRef]
- Kuhs, W.F.; Genov, G.; Staykova, D.K.; Hansen, T. Ice perfection and onset of anomalous preservation of gas hydrates. Phys. Chem. Chem. Phys. 2004, 6, 4917–4920. [Google Scholar] [CrossRef]
- Koide, H.; Takahashi, M.; Shindo, Y.; Tazaki, Y.; Iijima, M.; Ito, K.; Kimura, N.; Omata, K. Hydrate formation in sediments in the sub-seabed disposal of CO2. Energy 1997, 22, 279–283. [Google Scholar] [CrossRef]
- House, K.Z.; Schrag, D.P.; Harvey, C.F.; Lackner, K.S. Permanent carbon dioxide storage in deep-sea sediments. Proc. Natl. Acad. Sci. USA 2006, 103, 12291–12295. [Google Scholar] [CrossRef] [PubMed] [Green Version]
- Rochelle, C.A.; Camps, A.P.; Long, D.; Milodowski, A.; Bateman, K.; Gunn, D.; Jackson, P.; Lovell, M.A.; Rees, J. Can CO 2 hydrate assist in the underground storage of carbon dioxide? Geol. Soc. Lond. Spec. Publ. 2009, 319, 171–183. [Google Scholar] [CrossRef]
- Massah, M.; Sun, D.; Sharifi, H.; Englezos, P. Demonstration of gas-hydrate assisted carbon dioxide storage through horizontal injection in lab-scale reservoir. J. Chem. Thermodyn. 2018, 117, 106–112. [Google Scholar] [CrossRef]
- Gauteplass, J.; Almenningen, S.; Ersland, G.; Barth, T. Hydrate seal formation during laboratory CO2 injection in a cold aquifer. Int. J. Greenh. Gas Control 2018, 78, 21–26. [Google Scholar] [CrossRef]
- Mitchell, J.K.; Soga, K. Fundamentals of Soil Behavior, 3rd ed.; John Wiley & Sons: Hoboken, NJ, USA, 2005. [Google Scholar]
- Kwon, T.H.; Oh, T.M.; Choo, Y.W.; Lee, C.H.; Lee, K.R.; Cho, G.C. Geomechanical and thermal responses of hydrate-bearing sediments subjected to thermal stimulation: Physical modeling using a geotechnical centrifuge. Energy Fuels 2013, 27, 4507–4522. [Google Scholar] [CrossRef]
- Sloan, E.D. Gas Hydrates: Review of Physical/Chemical Properties. Energy Fuels 1998, 12, 191–196. [Google Scholar] [CrossRef]
- Dai, S.; Santamarina, J.C.; Waite, W.F.; Kneafsey, T.J. Hydrate morphology: Physical properties of sands with patchy hydrate saturation: Patchy hydrate saturation. J. Geophys. Res. Solid Earth 2012, 117. [Google Scholar] [CrossRef]
- Kim, H.S.; Oh, T.M.; Cho, G.C. P-wave velocity estimation of unconsolidated sediments containing CO2. Int. J. Greenh. Gas Control 2015, 33, 18–26. [Google Scholar] [CrossRef]
- Span, R.; Wagner, W. A New Equation of State for Carbon Dioxide Covering the Fluid Region from the Triple-Point Temperature to 1100 K at Pressures up to 800 MPa. J. Phys. Chem. Ref. Data 1996, 25, 1509–1596. [Google Scholar] [CrossRef]
- Börner, J.H.; Herdegen, V.; Repke, J.U.; Spitzer, K. The impact of CO2 on the electrical properties of water bearing porous media—Laboratory experiments with respect to carbon capture and storage. Geophys. Prospect. 2013, 61, 446–460. [Google Scholar] [CrossRef]
- Fleury, M.; Deschamps, H. Electrical conductivity and viscosity of aqueous NaCl solutions with dissolved CO2. J. Chem. Eng. Data 2008, 53, 2505–2509. [Google Scholar] [CrossRef]
- Zhou, X.; Lakkaraju, V.R.; Apple, M.; Dobeck, L.M.; Gullickson, K.; Shaw, J.A.; Cunningham, A.B.; Wielopolski, L.; Spangler, L.H. Experimental observation of signature changes in bulk soil electrical conductivity in response to engineered surface CO2 leakage. Int. J. Greenh. Gas Control 2012, 7, 20–29. [Google Scholar] [CrossRef]
- Buffett, B.A.; Zatsepina, O.Y. Formation of gas hydrate from dissolved gas in natural porous media. Mar. Geol. 2000, 164, 69–77. [Google Scholar] [CrossRef]
- Santamarina, J.C.; Ruppel, C.D. The impact of hydrate saturation on the mechanical, electrical, and thermal properties of hydrate-bearing sand, silts, and clay. In Proceedings of the 6th International Conference on Gas. Hydrates (ICGH 2008), Vancouver, BC, Canada, 6–10 July 2008. [Google Scholar]
- Falenty, A.; Kuhs, W.F. “Self-Preservation” of CO2 gas hydrates-surface microstructure and ice perfection. J. Phys. Chem. B 2009, 113, 15975–15988. [Google Scholar] [CrossRef]
- Berg, R.R. Capillary Pressures in Stratigraphic Traps. AAPG Bull. 1975, 59, 939–956. [Google Scholar]
- Schowalter, T.T. Mechanics of secondary hydrocarbon migration and entrapment. AAPG Bull. 1979, 63, 720–760. [Google Scholar]
- Chun, B.S.; Wilkinson, G.T. Interfacial tension in high-pressure carbon dioxide mixtures. Ind. Eng. Chem. Res. 1995, 34, 4371–4377. [Google Scholar] [CrossRef]
- Espinoza, D.N.; Santamarina, J.C. Water-CO2-mineral systems: Interfacial tension, contact angle, and diffusion-Implications to CO2 geological storage. Water Resour. Res. 2010, 46, W07537. [Google Scholar] [CrossRef]
- Nielsen, L.C.; Bourg, I.C.; Sposito, G. Predicting CO2–water interfacial tension under pressure and temperature conditions of geologic CO2 storage. Geochim. Cosmochim. Acta 2012, 81, 28–38. [Google Scholar] [CrossRef]
- Washburn, E.W. Note on a Method of Determining the Distribution of Pore Sizes in a Porous Material. Proc. Natl. Acad. Sci. USA 1921, 7, 115–116. [Google Scholar] [CrossRef] [Green Version]
- Li, S.; Dong, M.; Li, Z.; Huang, S.; Qing, H.; Nickel, E. Gas breakthrough pressure for hydrocarbon reservoir seal rocks: Implications for the security of long-term CO2 storage in the Weyburn field: Gas breakthrough pressure for different gas/liquid systems. Geofluids 2005, 5, 326–334. [Google Scholar] [CrossRef]
- Lemmon, E.W.; McLinden, M.O.; Friend, D.G. Thermophysical Properties of Fluid Systems; Linstrom, P.J., Mallard, W.G., Eds.; National Institute of Standards and Technology (NIST Chemistry WebBook): Gaithersburg, MD, USA, 1998.
- Taylor, D.W. Fundamentals of Soil Mechanics; Wiley: New York, NY, USA, 1948. [Google Scholar]
- Lambe, T.W.; Whitman, R.V. Soil Mechanics; Wiley: New York, NY, USA, 1969. [Google Scholar]
- Espinoza, D.N.; Santamarina, J.C. CO2 breakthrough—Caprock sealing efficiency and integrity for carbon geological storage. Int. J. Greenh. Gas Control 2017, 66, 218–229. [Google Scholar] [CrossRef]
- Zhao, Y.; Yu, Q. CO2 breakthrough pressure and permeability for unsaturated low-permeability sandstone of the Ordos Basin. J. Hydrol. 2017, 550, 331–342. [Google Scholar] [CrossRef]
- Angeli, M.; Soldal, M.; Skurtveit, E.; Aker, E. Experimental percolation of supercritical CO2 through a caprock. Energy Procedia 2009, 1, 3351–3358. [Google Scholar] [CrossRef]
Figure 1.
Conceptual drawing of the experimental design.
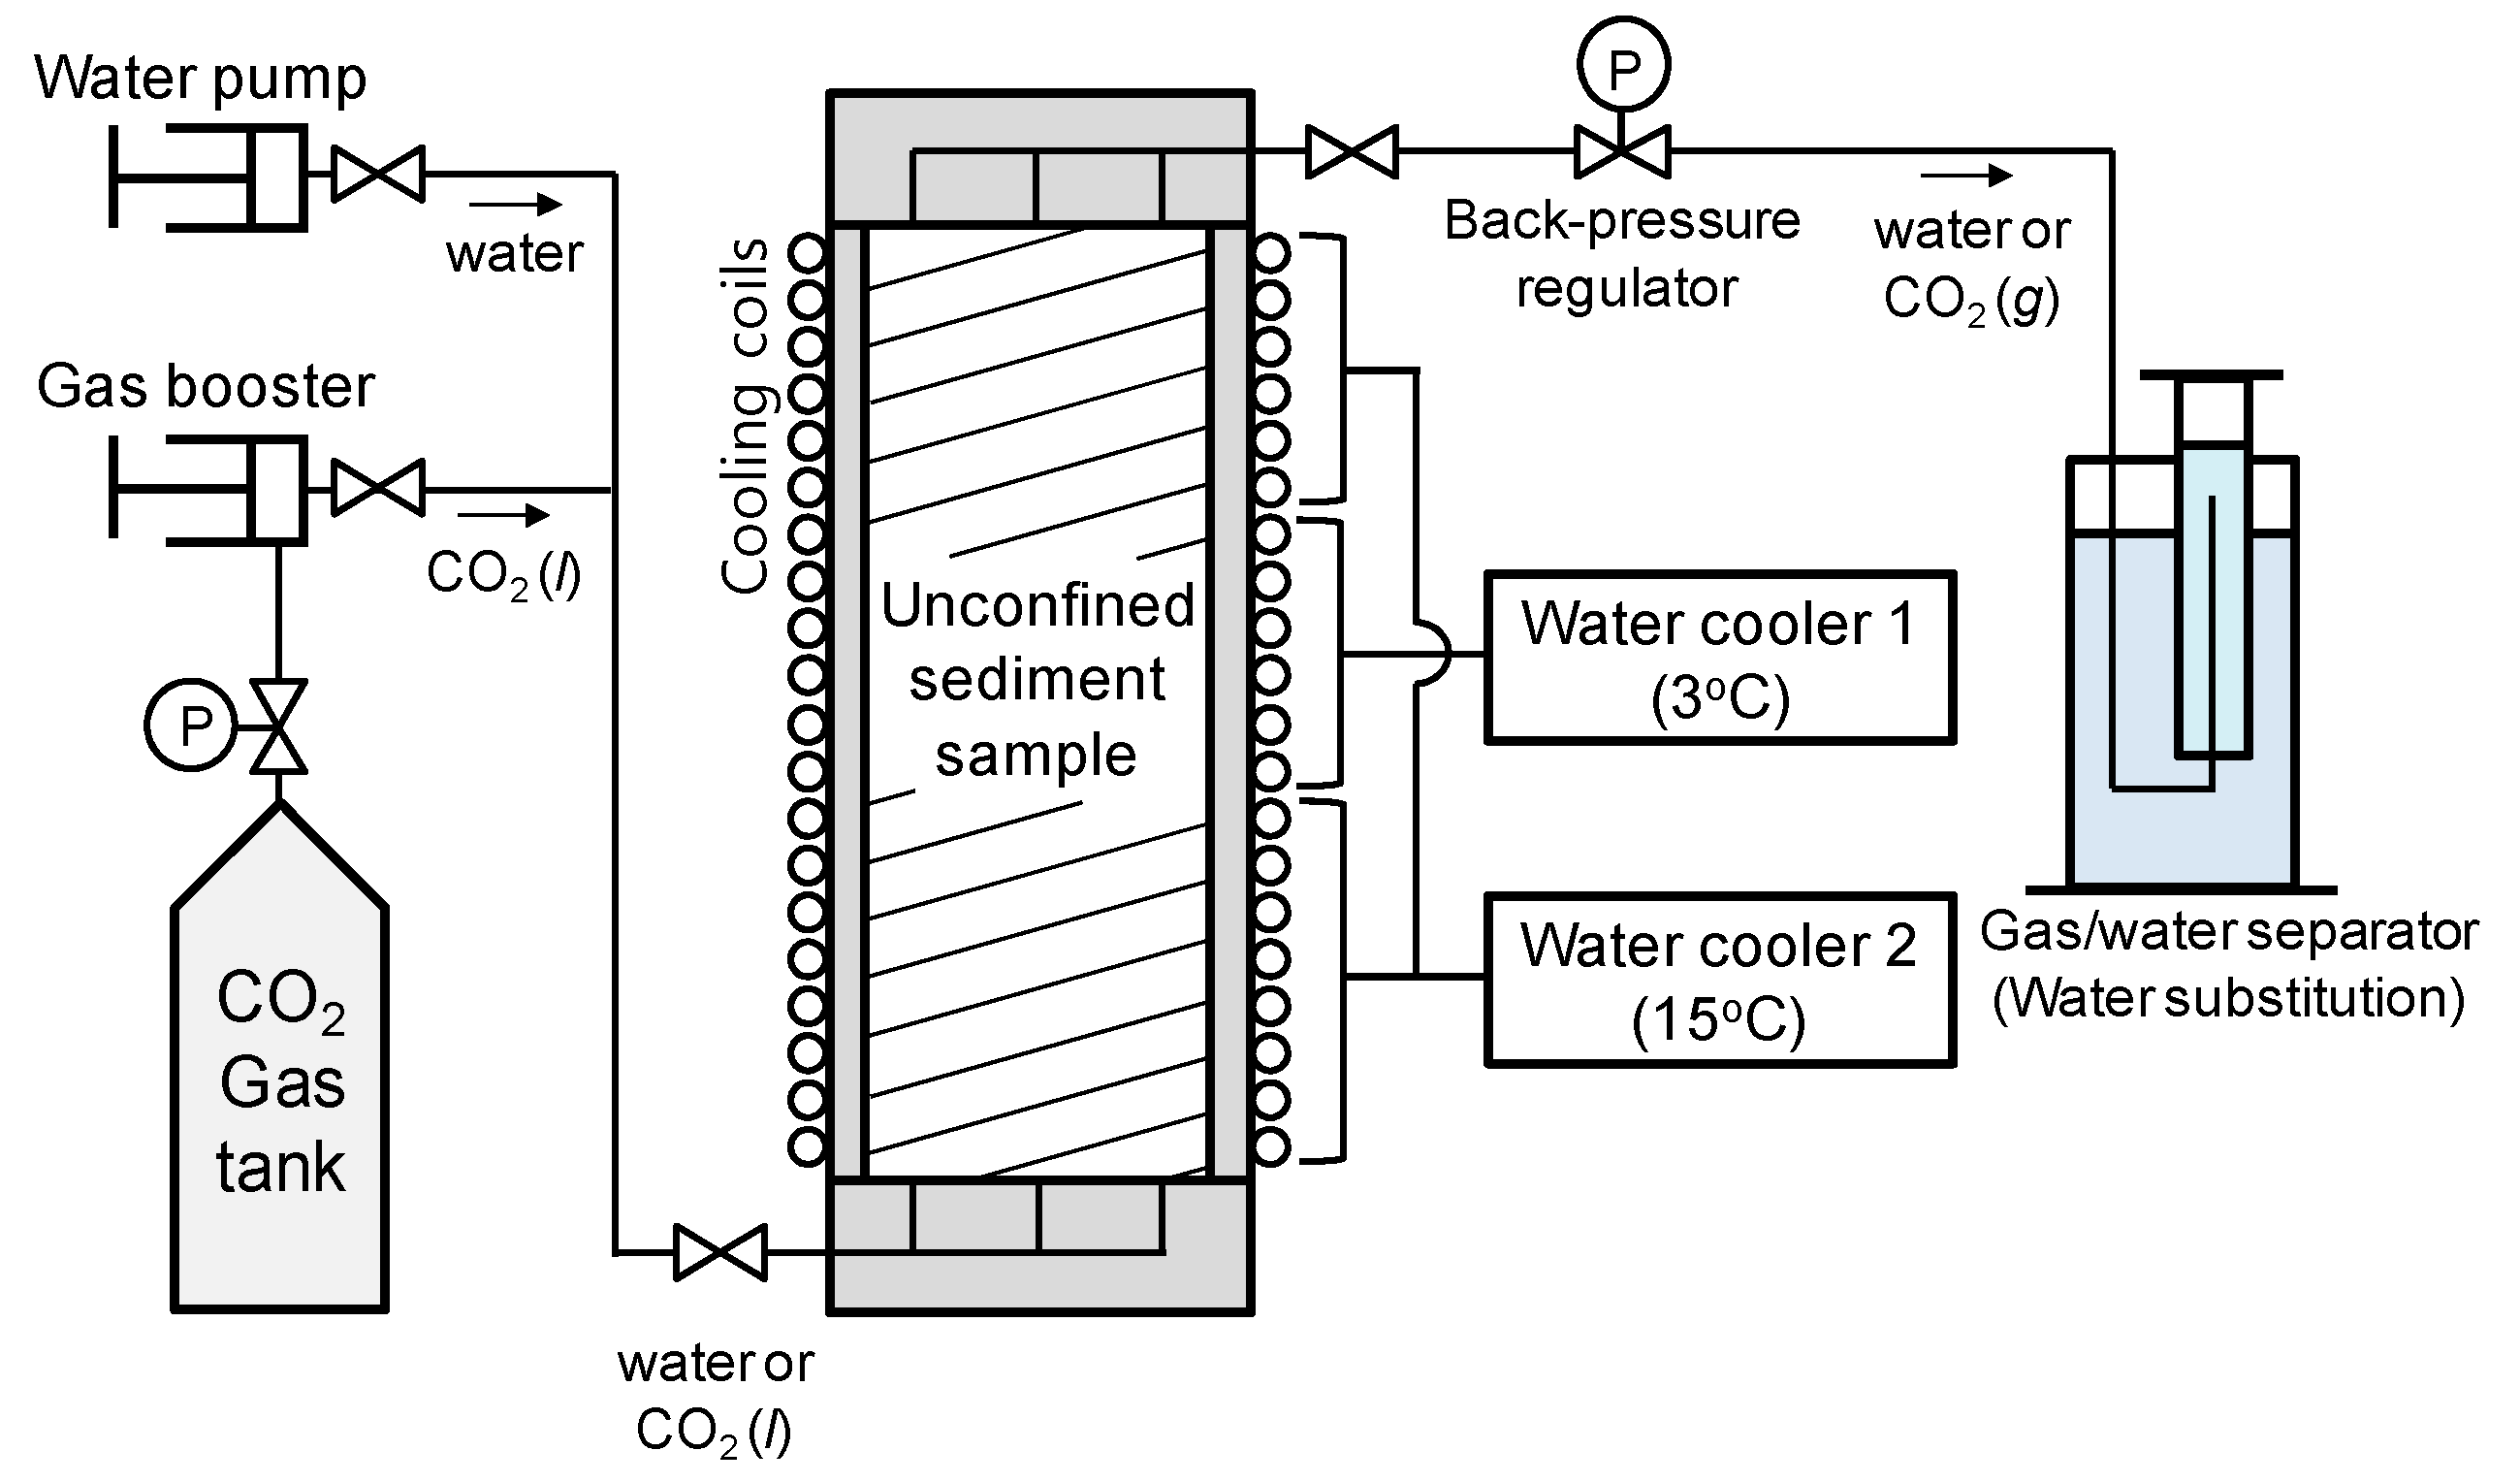
Figure 2.
Conceptual drawing of the high-pressure cell used in this study; PT: Pressure transducer, TC: Thermocouple, VP: Piezoelectric plates for P-wave velocity measurements, ER: Electrode for electrical resistance measurements. (a) Vertical cross-sectional drawing of the cell. (b) Horizontal cross-sectional drawing of the layers A1–A5 and B1–B4, respectively.
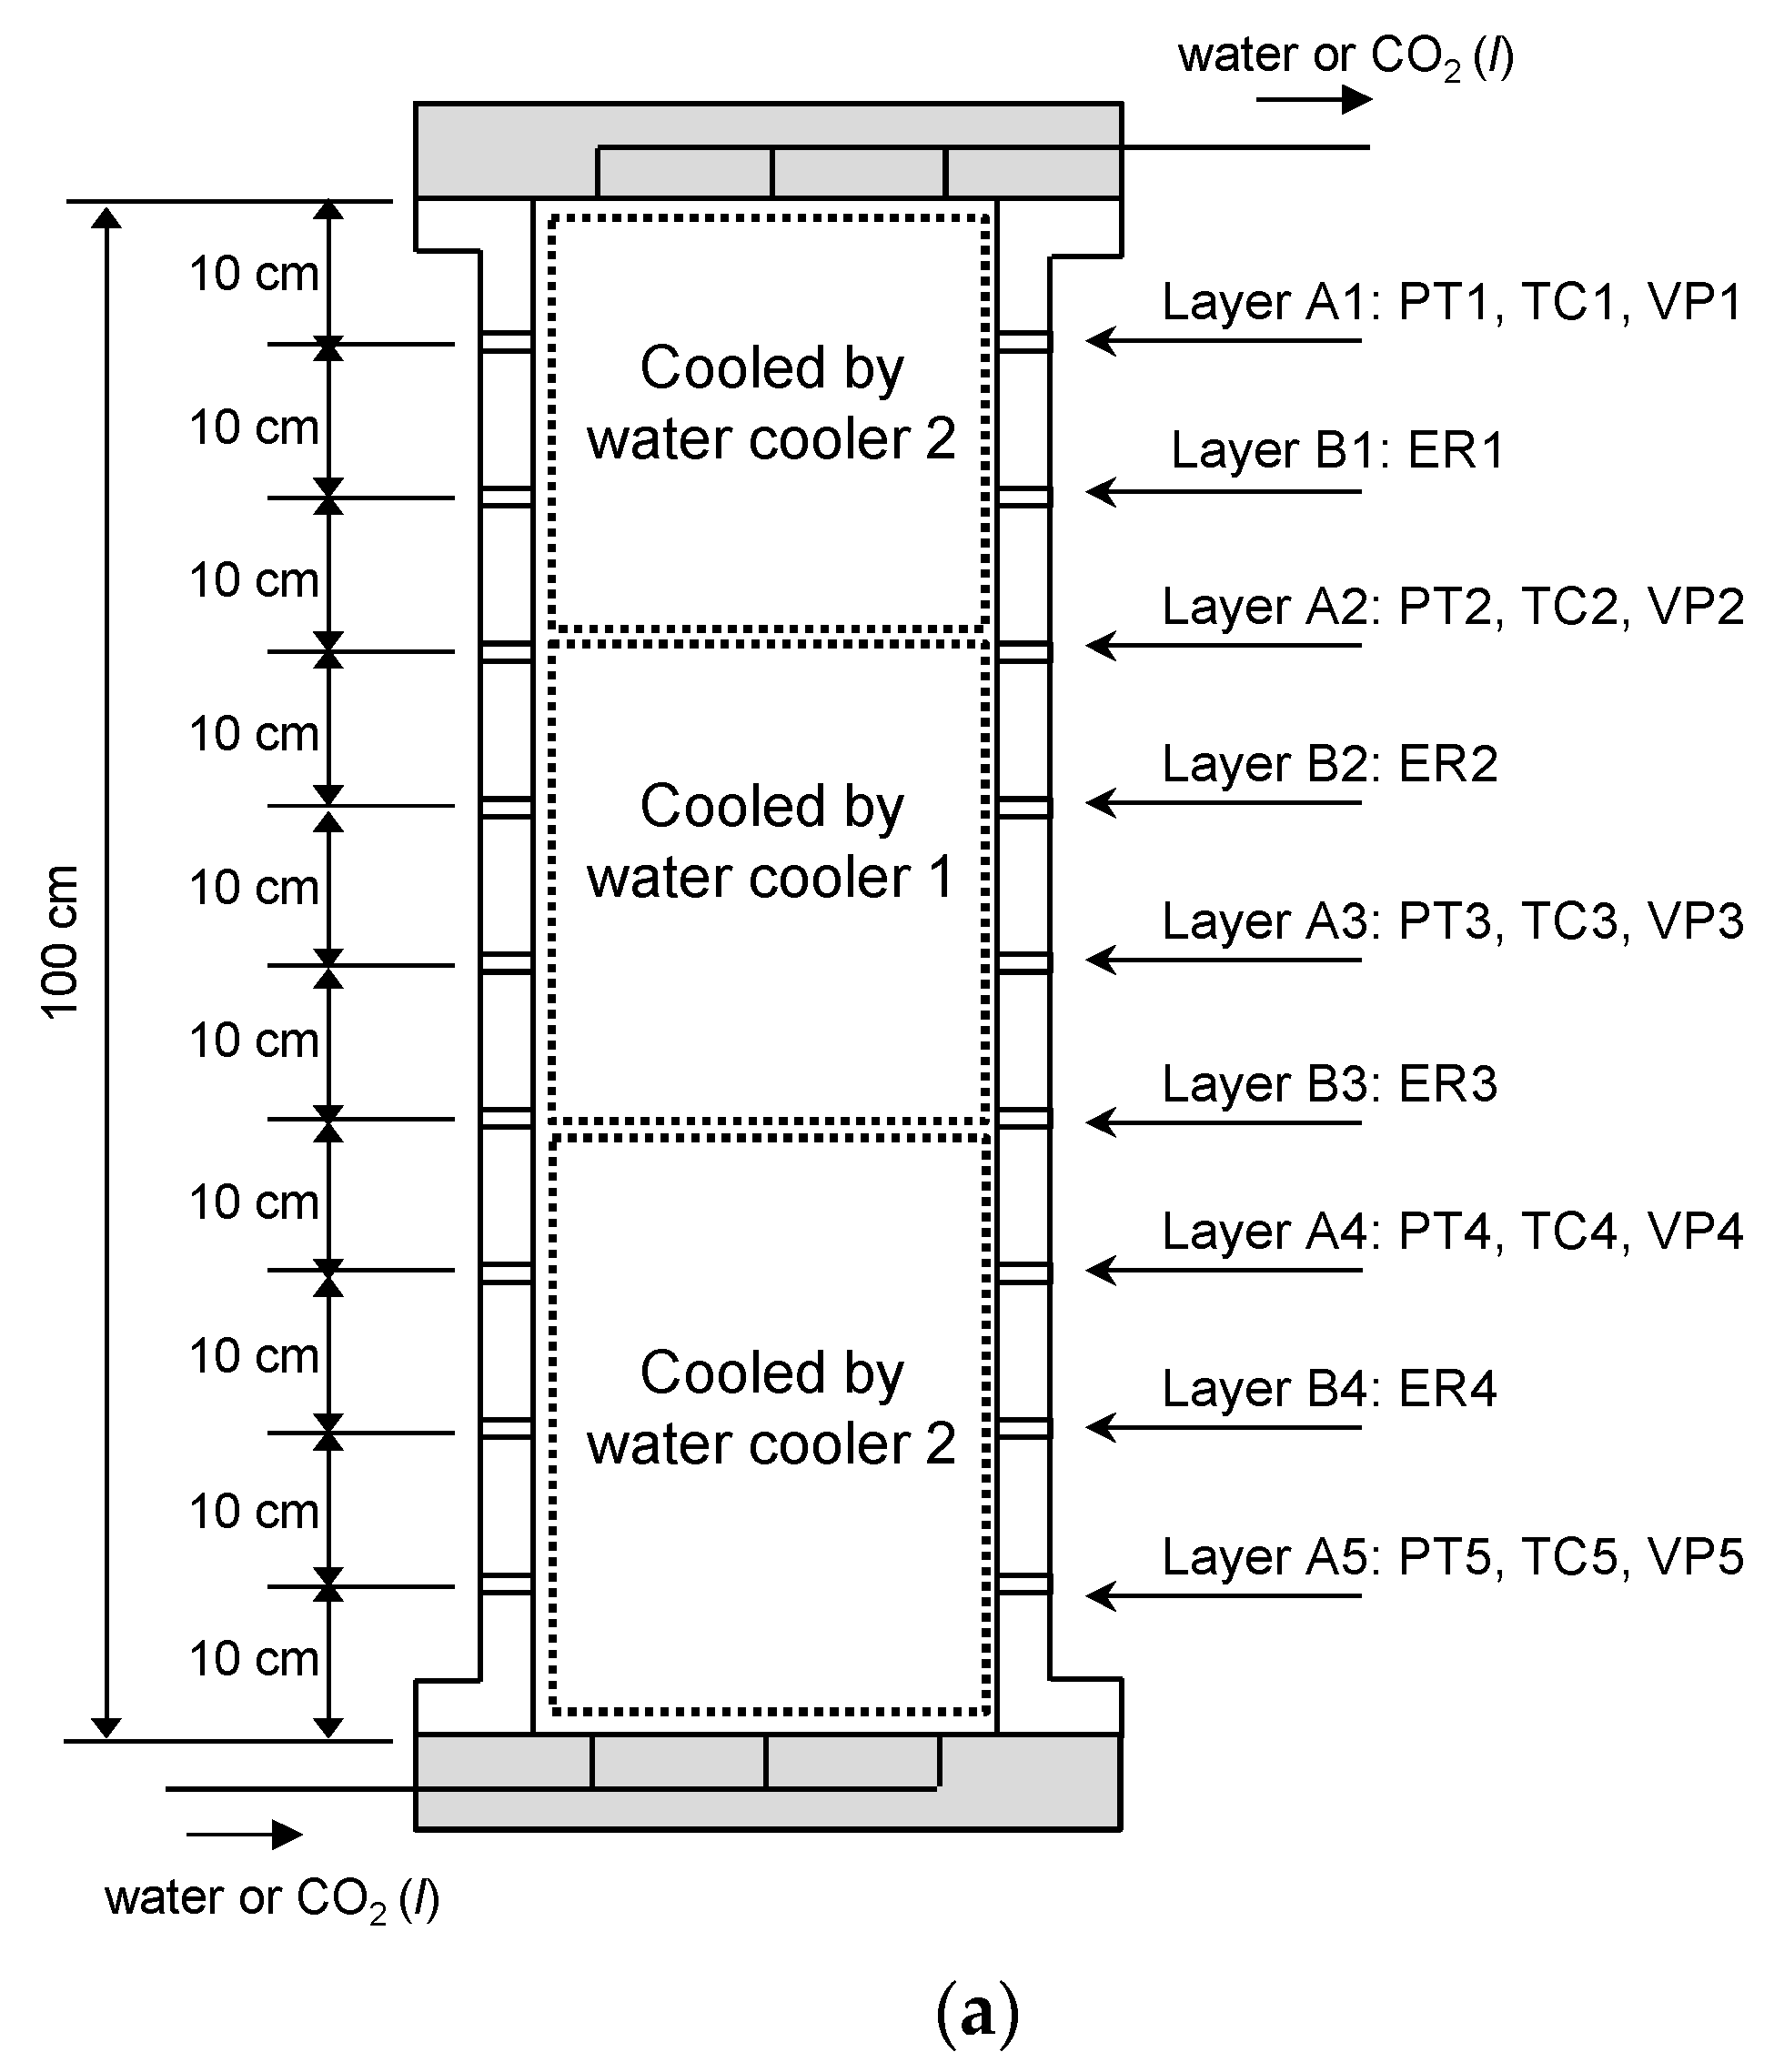

Figure 3.
Temperature distribution of the high-pressure cell obtained from the preliminary test result with distilled water. The maximum CO2 hydrate equilibrium temperature is approximated using the second quadruple point of CO2–water mixture (the intersection of the water–CO2 vapor–CO2 liquid, and water–CO2 hydrate–CO2 vapor equilibrium line) because the water–CO2 hydrate–liquid CO2 equilibrium line is essentially vertical in the pressure–temperature diagram [22].

Figure 4.
Pressure of the cell with lapsed time during CO2 injection.
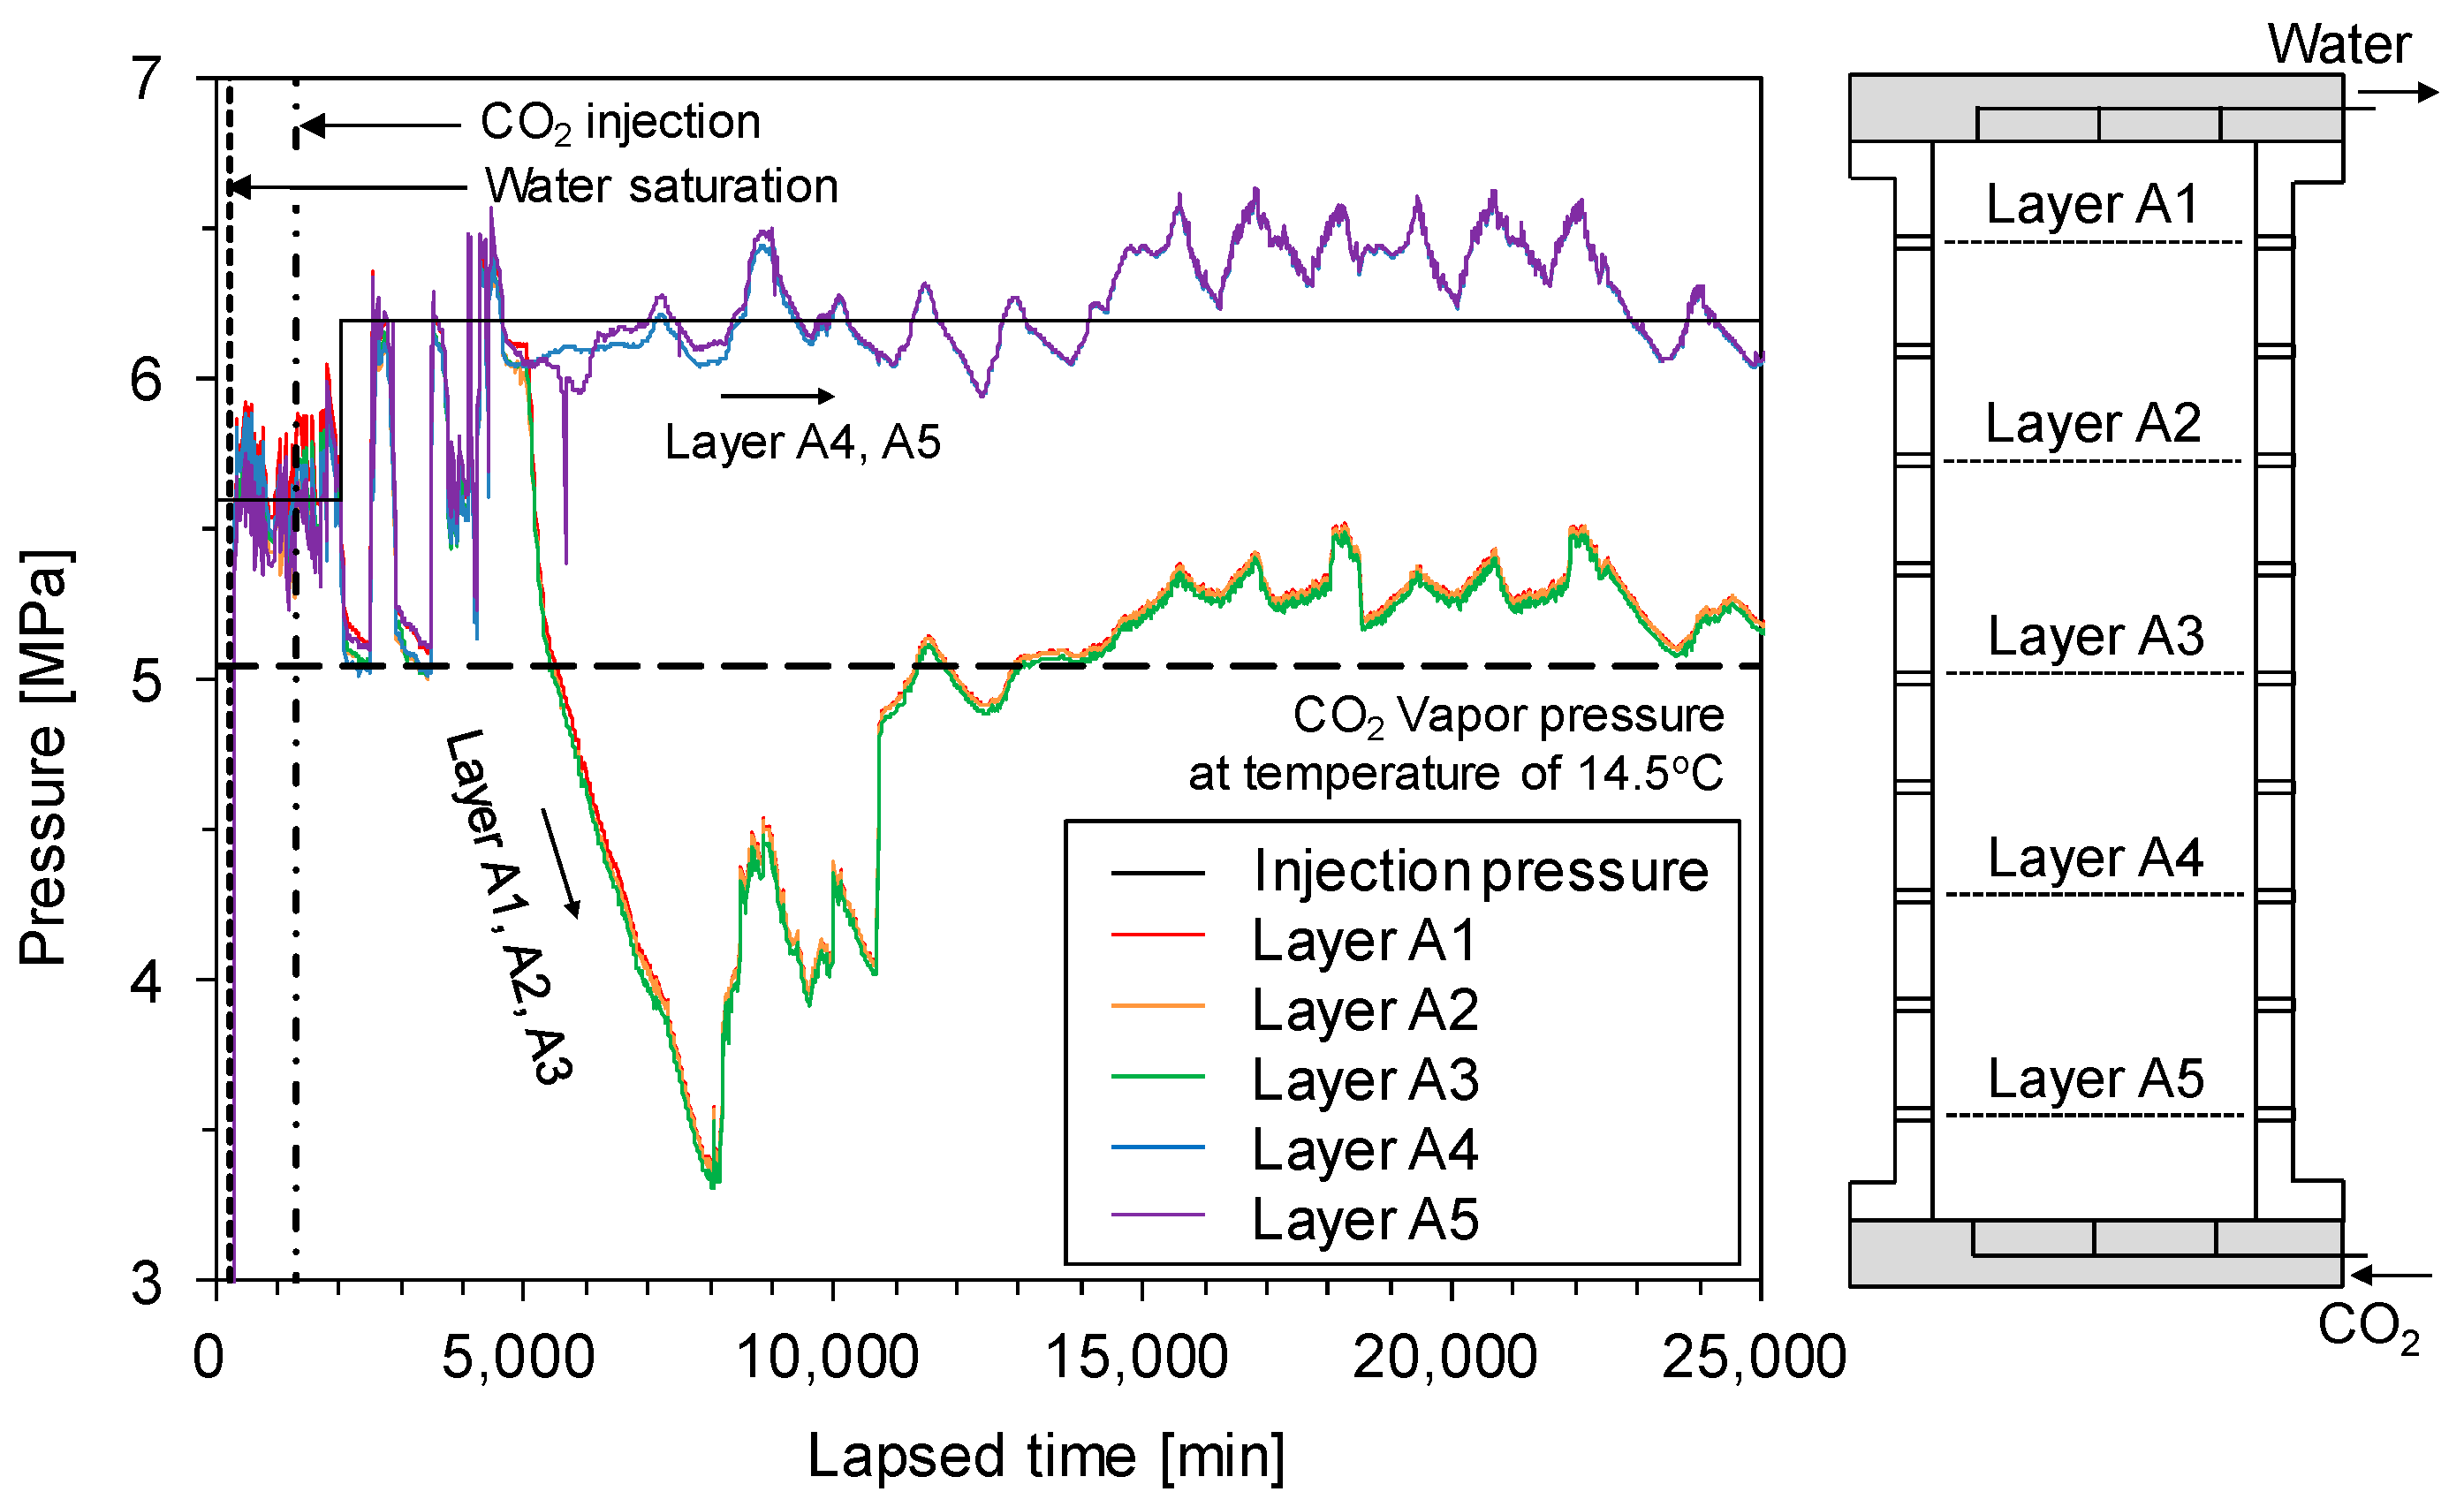
Figure 5.
The pressure–temperature relationship during CO2 injection. (a) 4680–8100 min, (b) 8100–25,300 min.
Figure 5.
The pressure–temperature relationship during CO2 injection. (a) 4680–8100 min, (b) 8100–25,300 min.
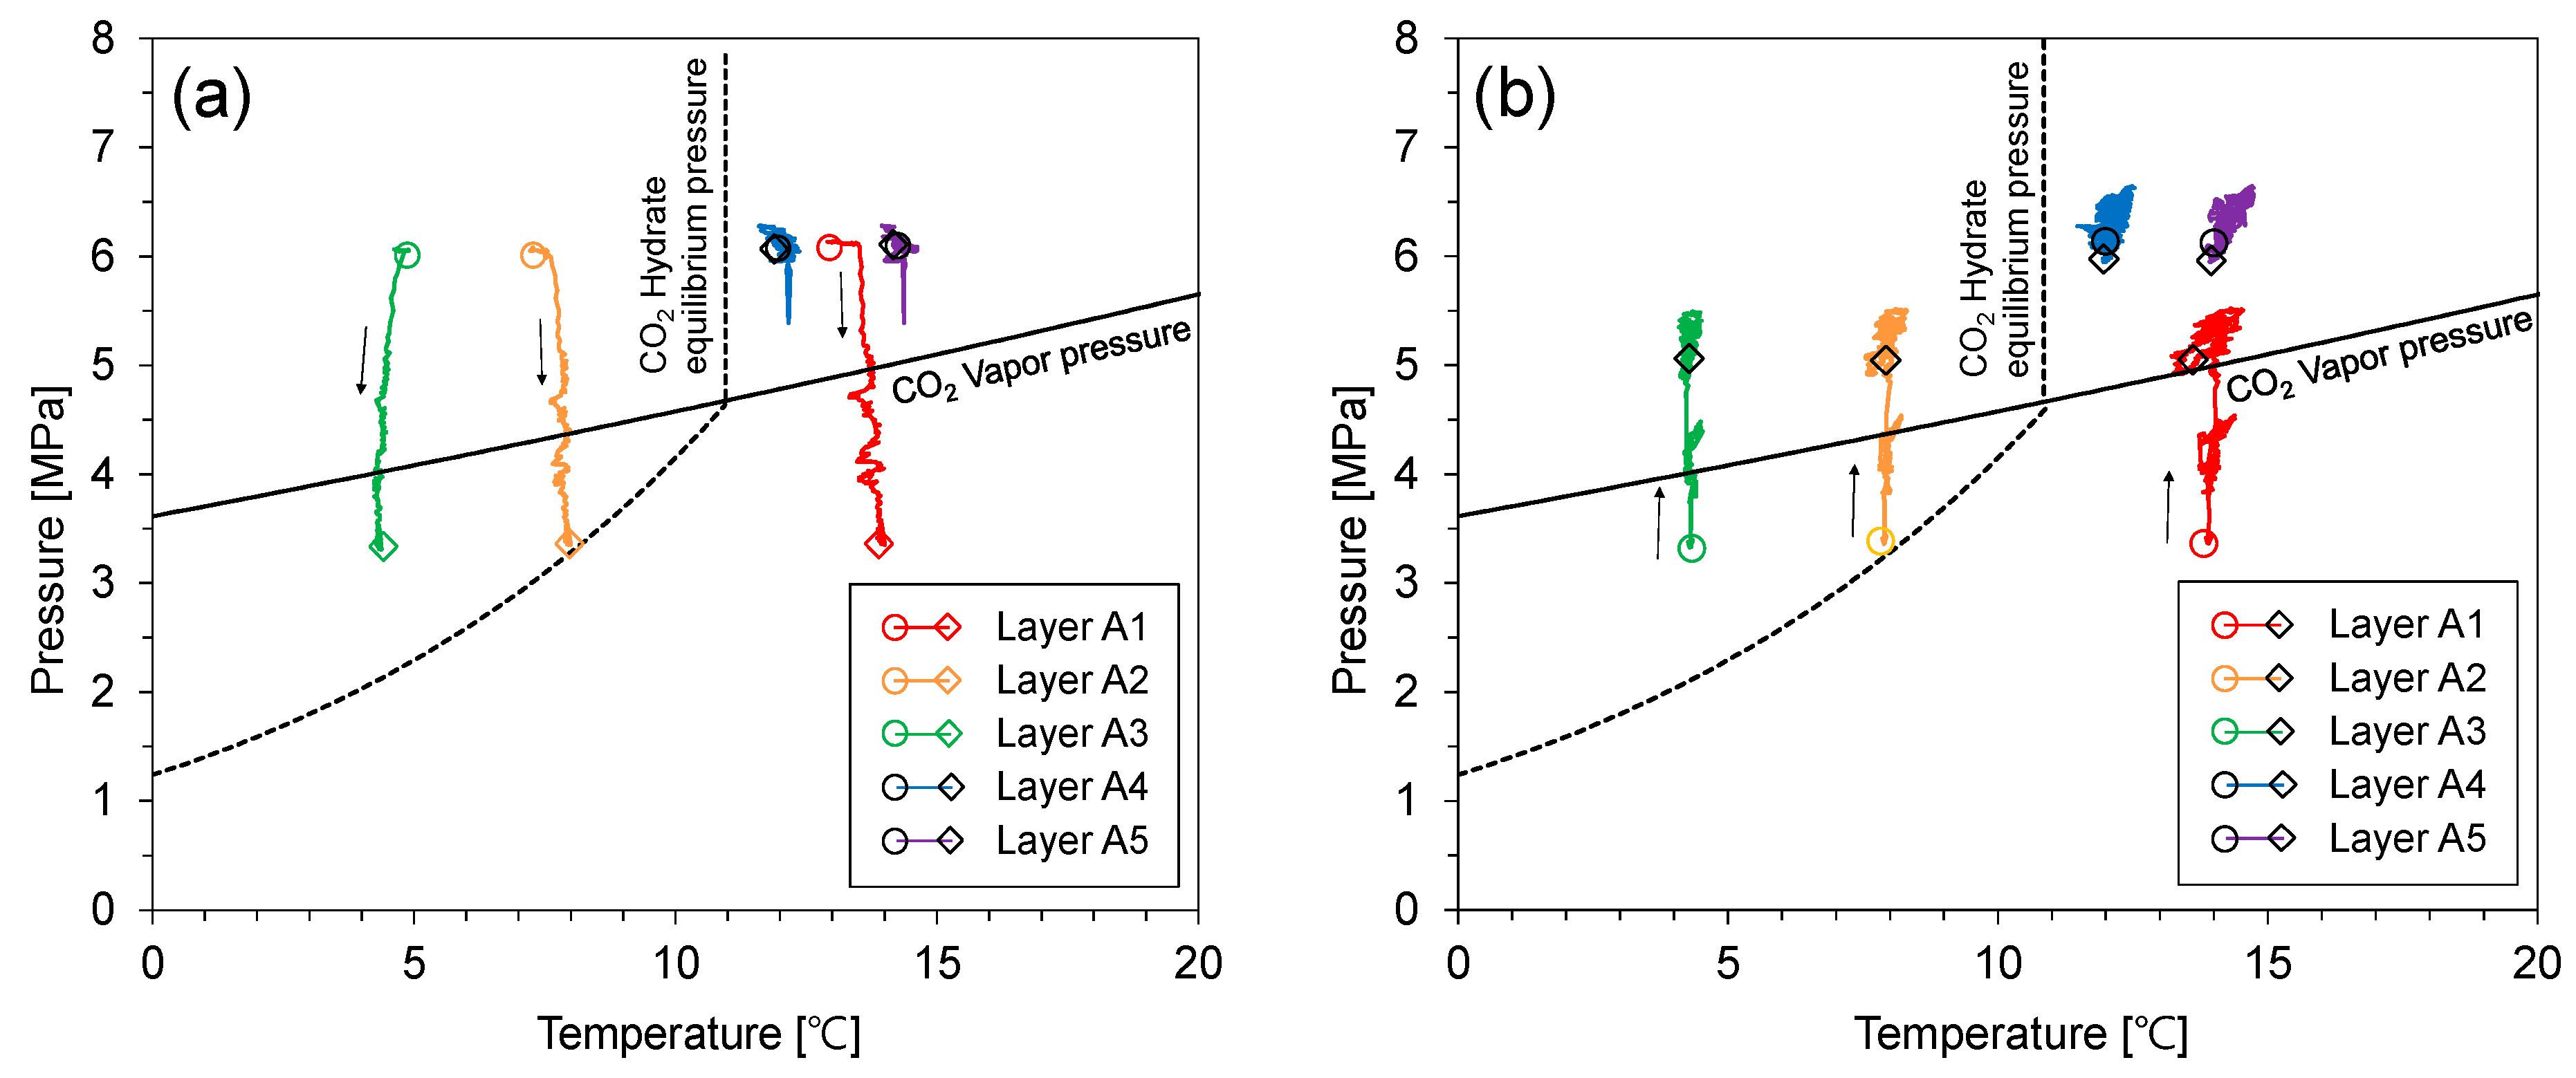
Figure 6.
P-wave velocity of the unconsolidated sediment sample during CO2 injection. (a) layer A1, (b) layer A2, (c) layer A3, (d) layer A4, (e) layer A5. P-wave velocity of layers A1 and A2 did not change during CO2 injection because the CO2 hydrate-bearing sediment layer prevented the upward flow of CO2 liquid.
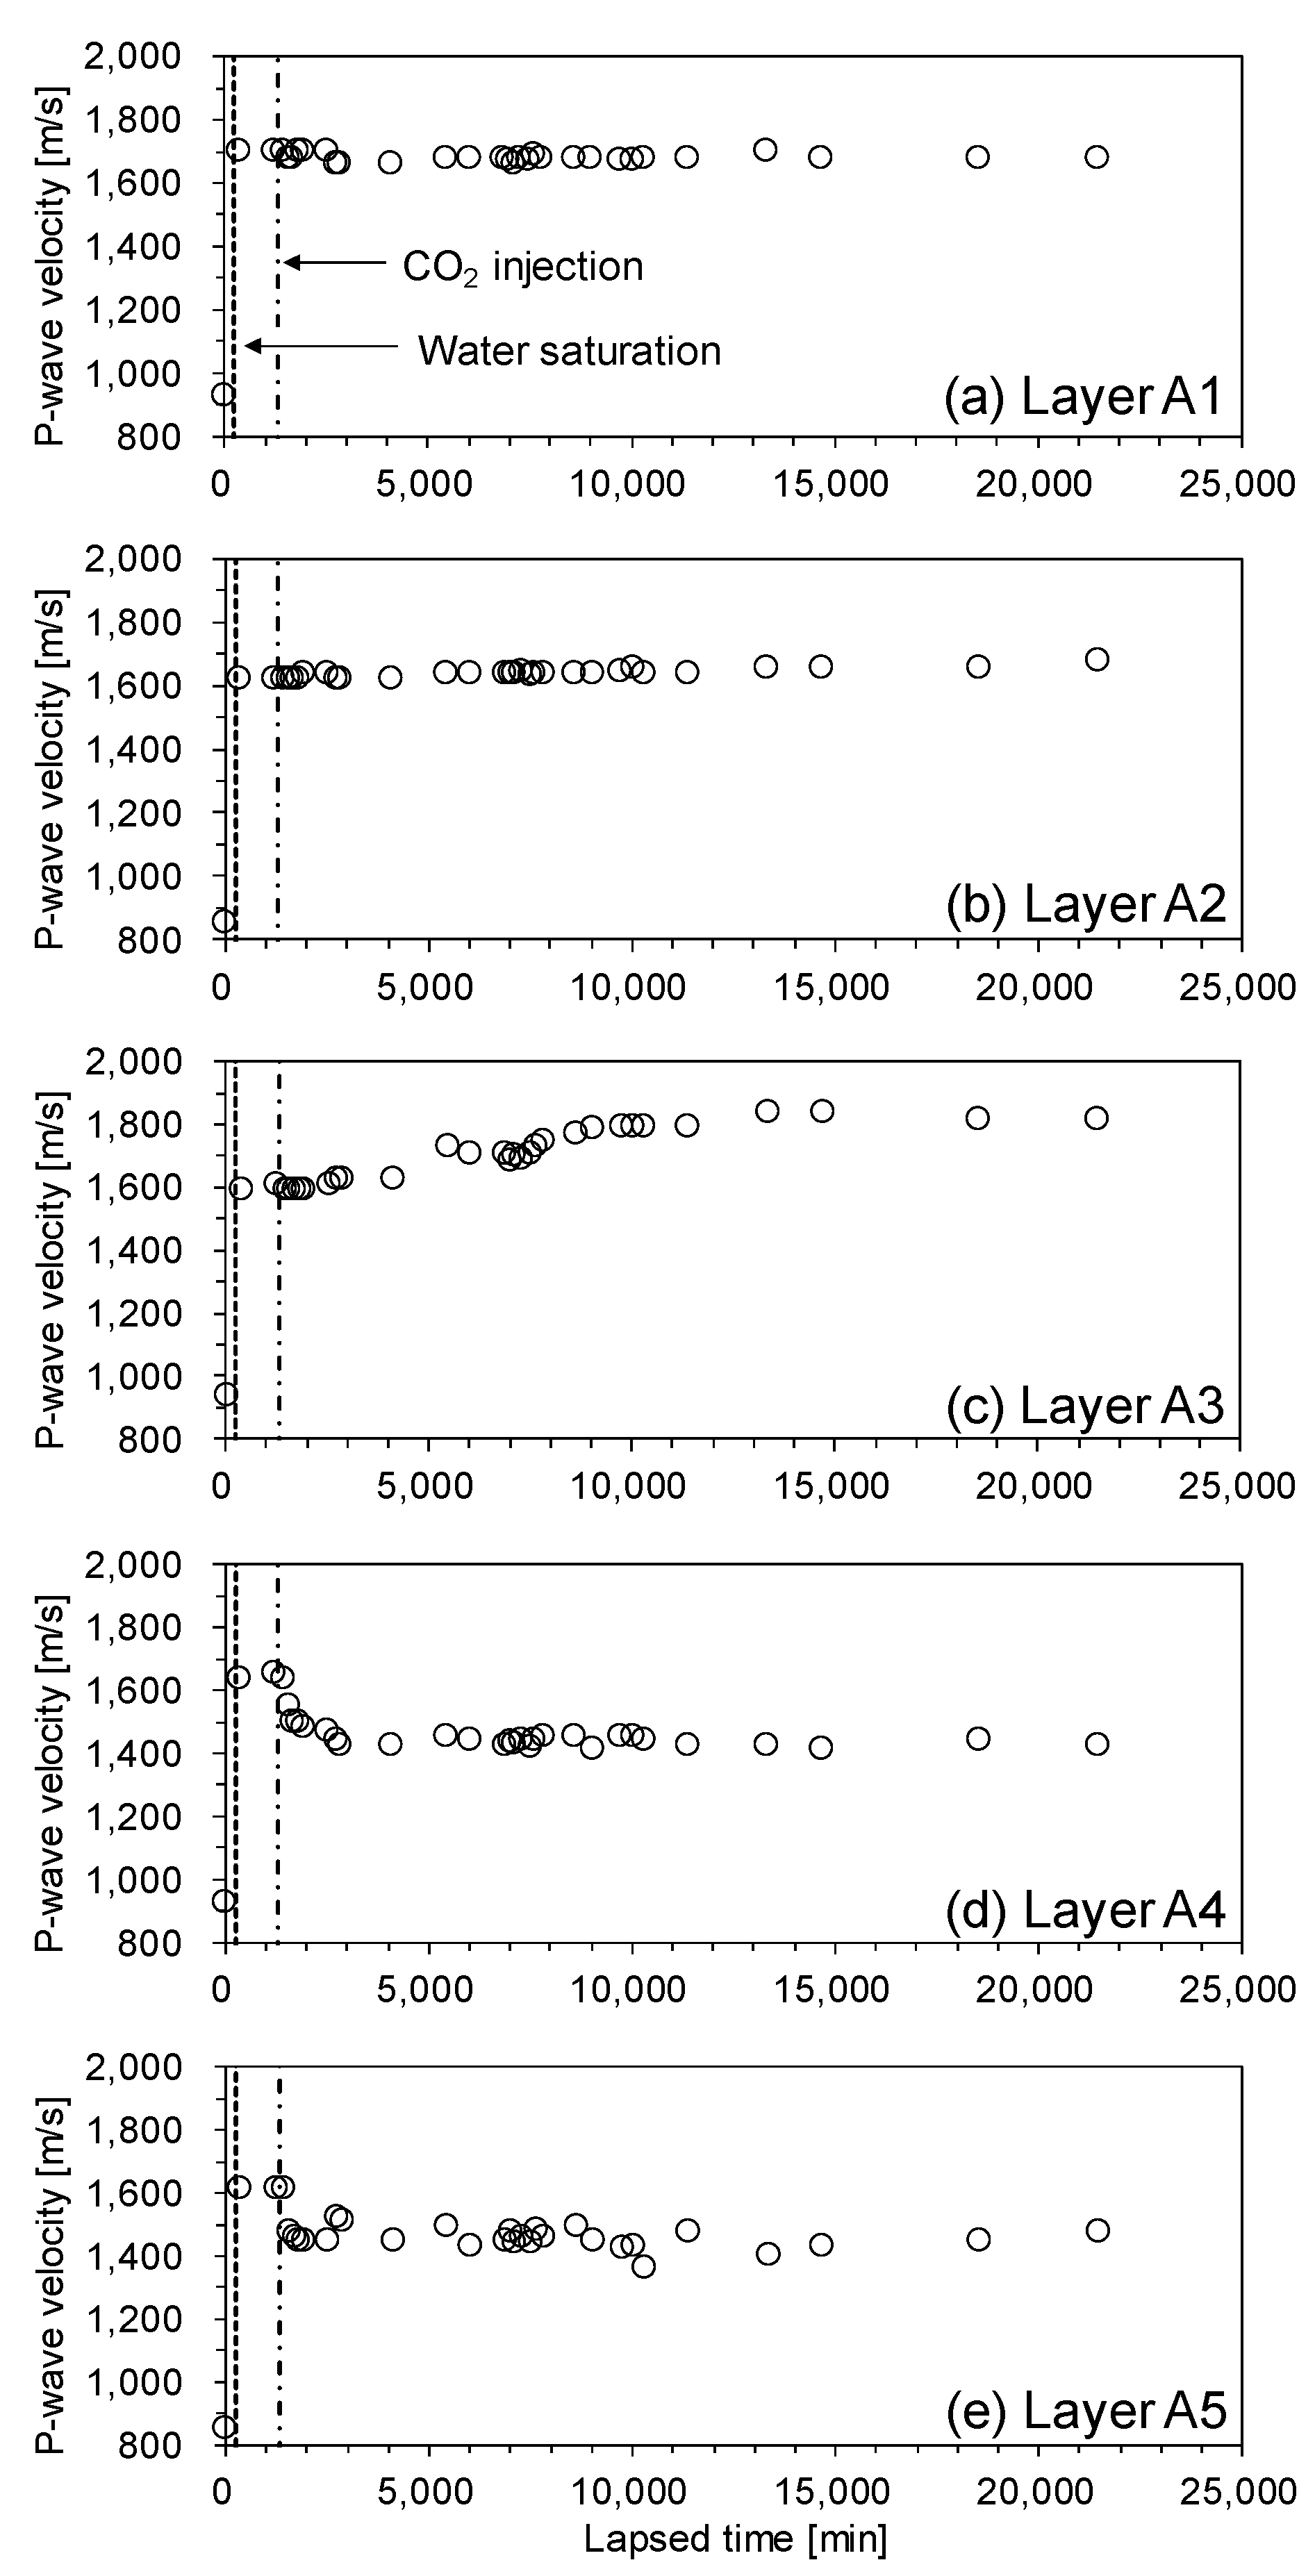
Figure 7.
Normalized electrical resistance R/R0 of the unconsolidated sediment sample during CO2 injection. (a) layer B1, (b) layer B2, (c) layer B3, (d) layer B4.
Figure 7.
Normalized electrical resistance R/R0 of the unconsolidated sediment sample during CO2 injection. (a) layer B1, (b) layer B2, (c) layer B3, (d) layer B4.

Figure 8.
Pressure of the cell with lapsed time during depressurization.

Figure 9.
The pressure–temperature relationship during depressurization. (a) 0–980 min, (b) 980–1770 min, (c) 1770–3300 min, (d) 3300–8700 min.
Figure 9.
The pressure–temperature relationship during depressurization. (a) 0–980 min, (b) 980–1770 min, (c) 1770–3300 min, (d) 3300–8700 min.
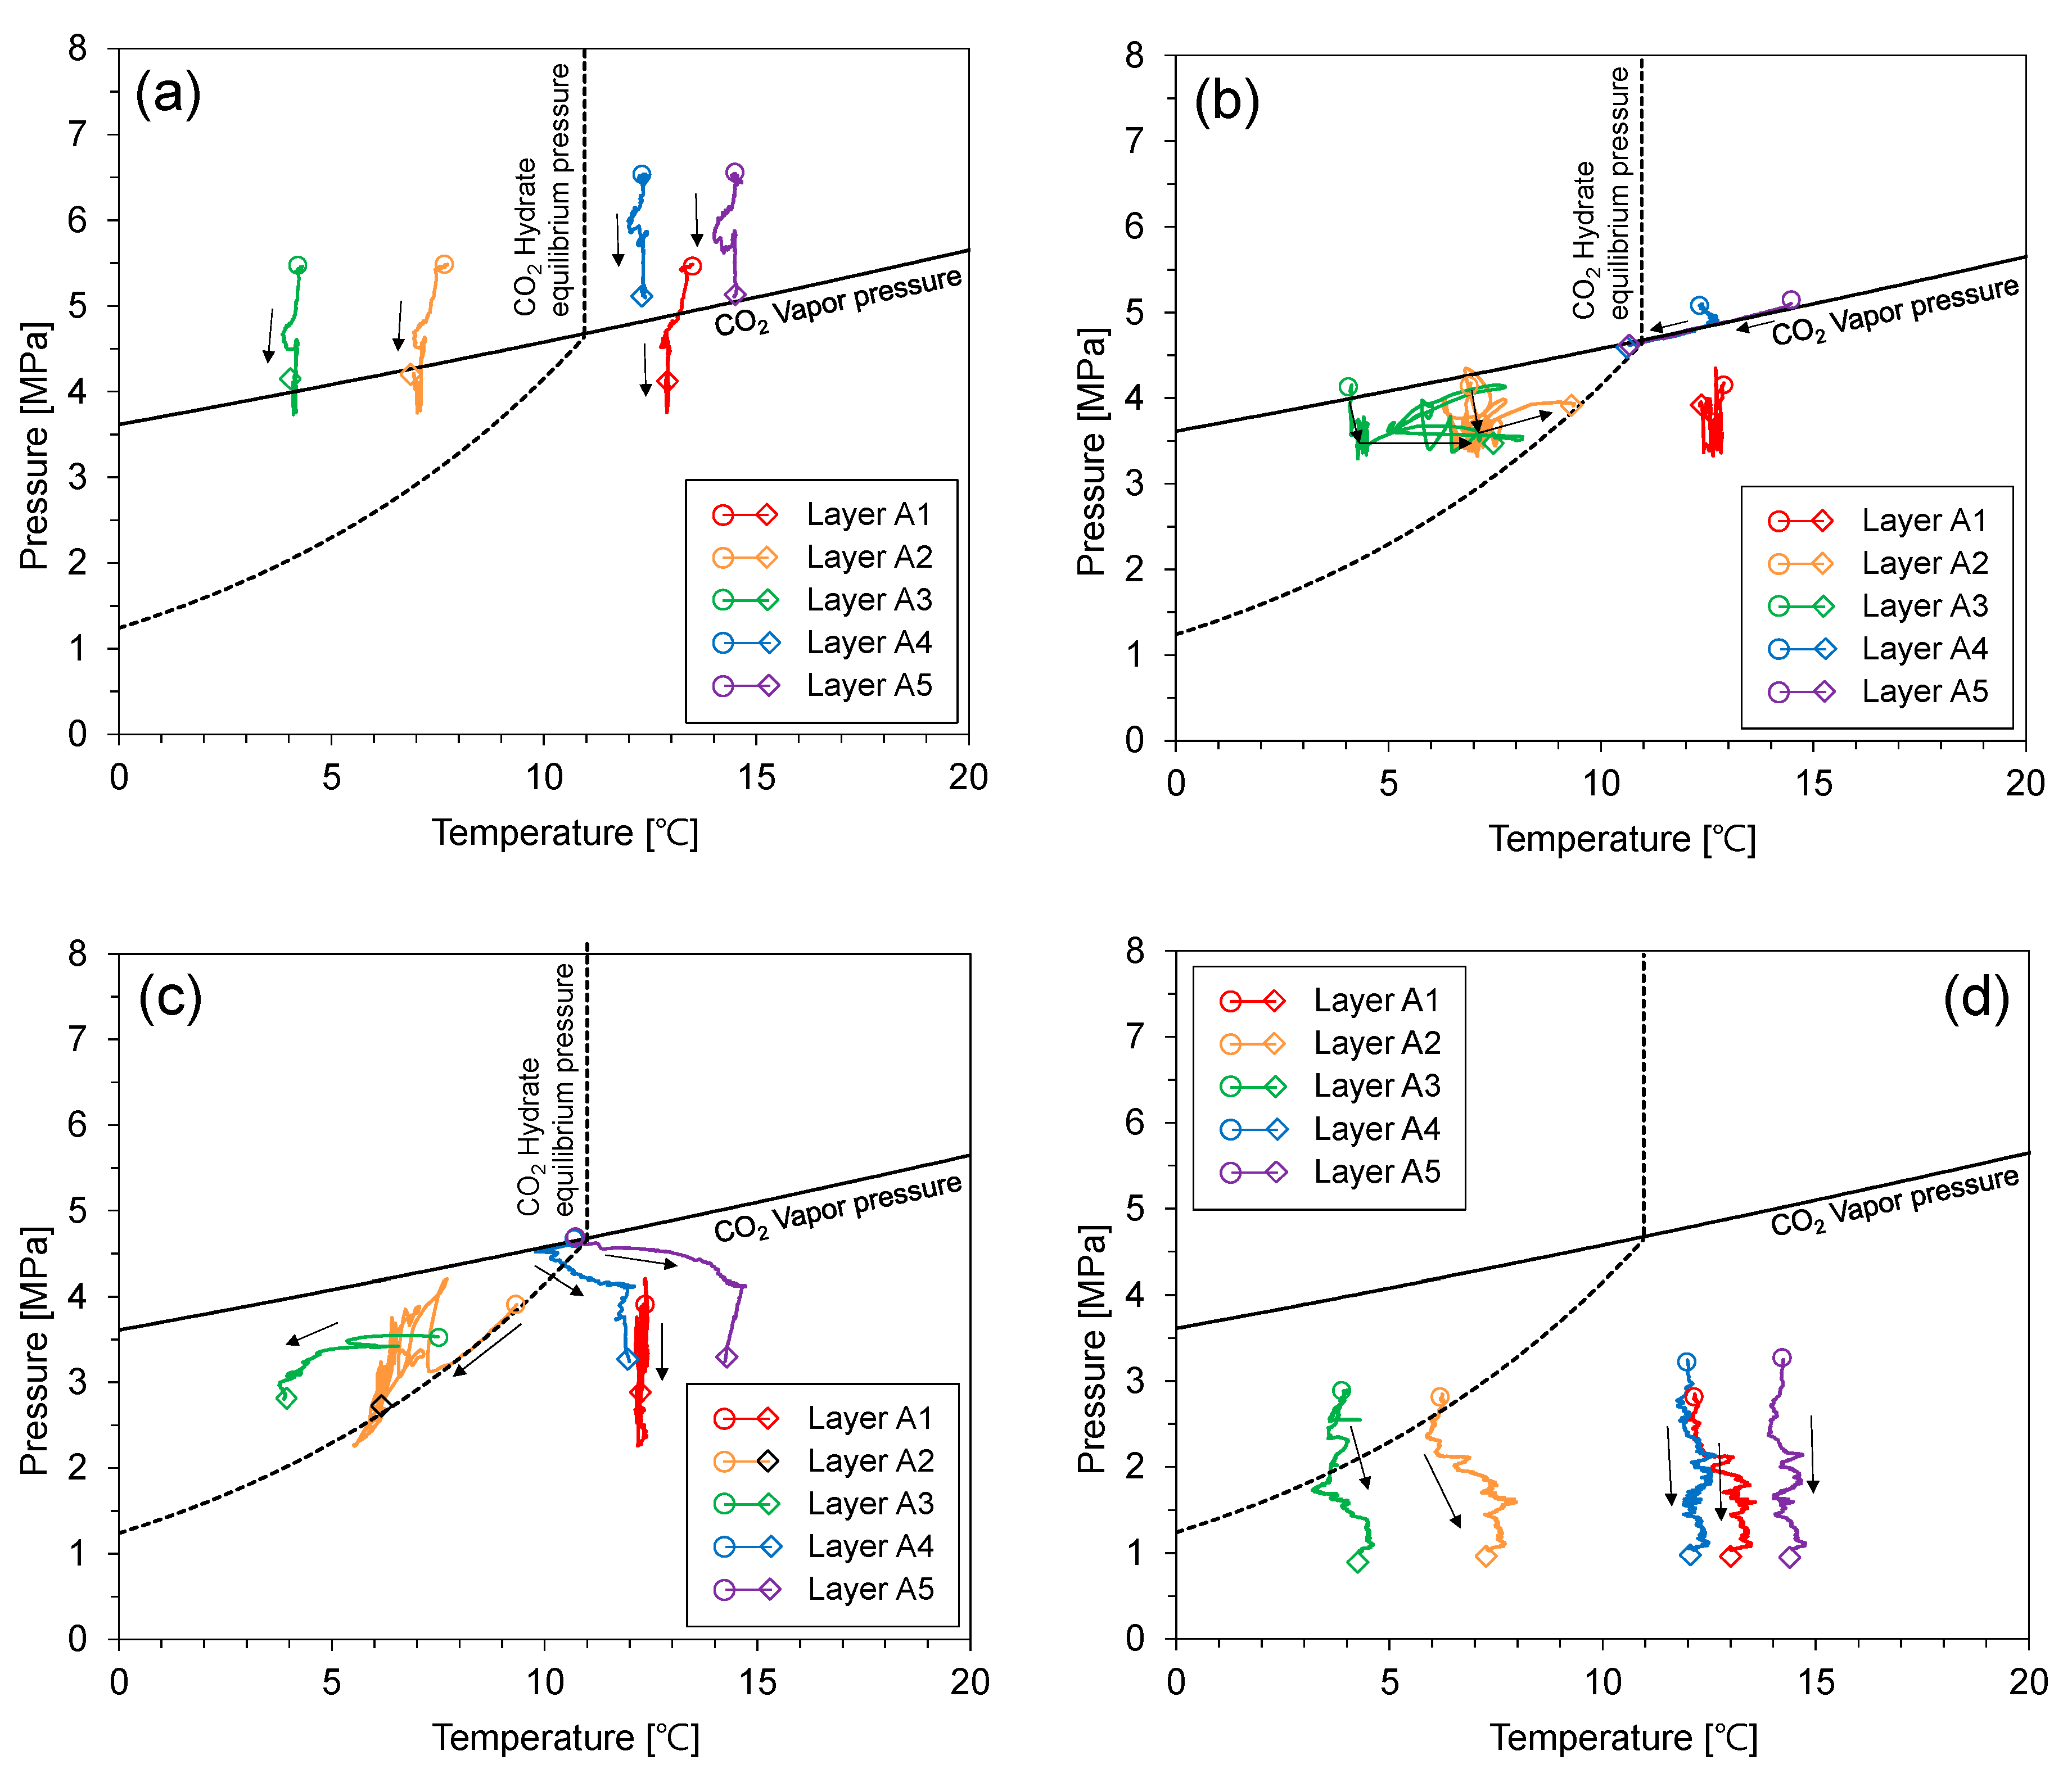
Figure 10.
P-wave velocity of the unconsolidated sediment sample during depressurization. (a) layer A1, (b) layer A2, (c) layer A3, (d) layer A4, (e) layer A5.
Figure 10.
P-wave velocity of the unconsolidated sediment sample during depressurization. (a) layer A1, (b) layer A2, (c) layer A3, (d) layer A4, (e) layer A5.
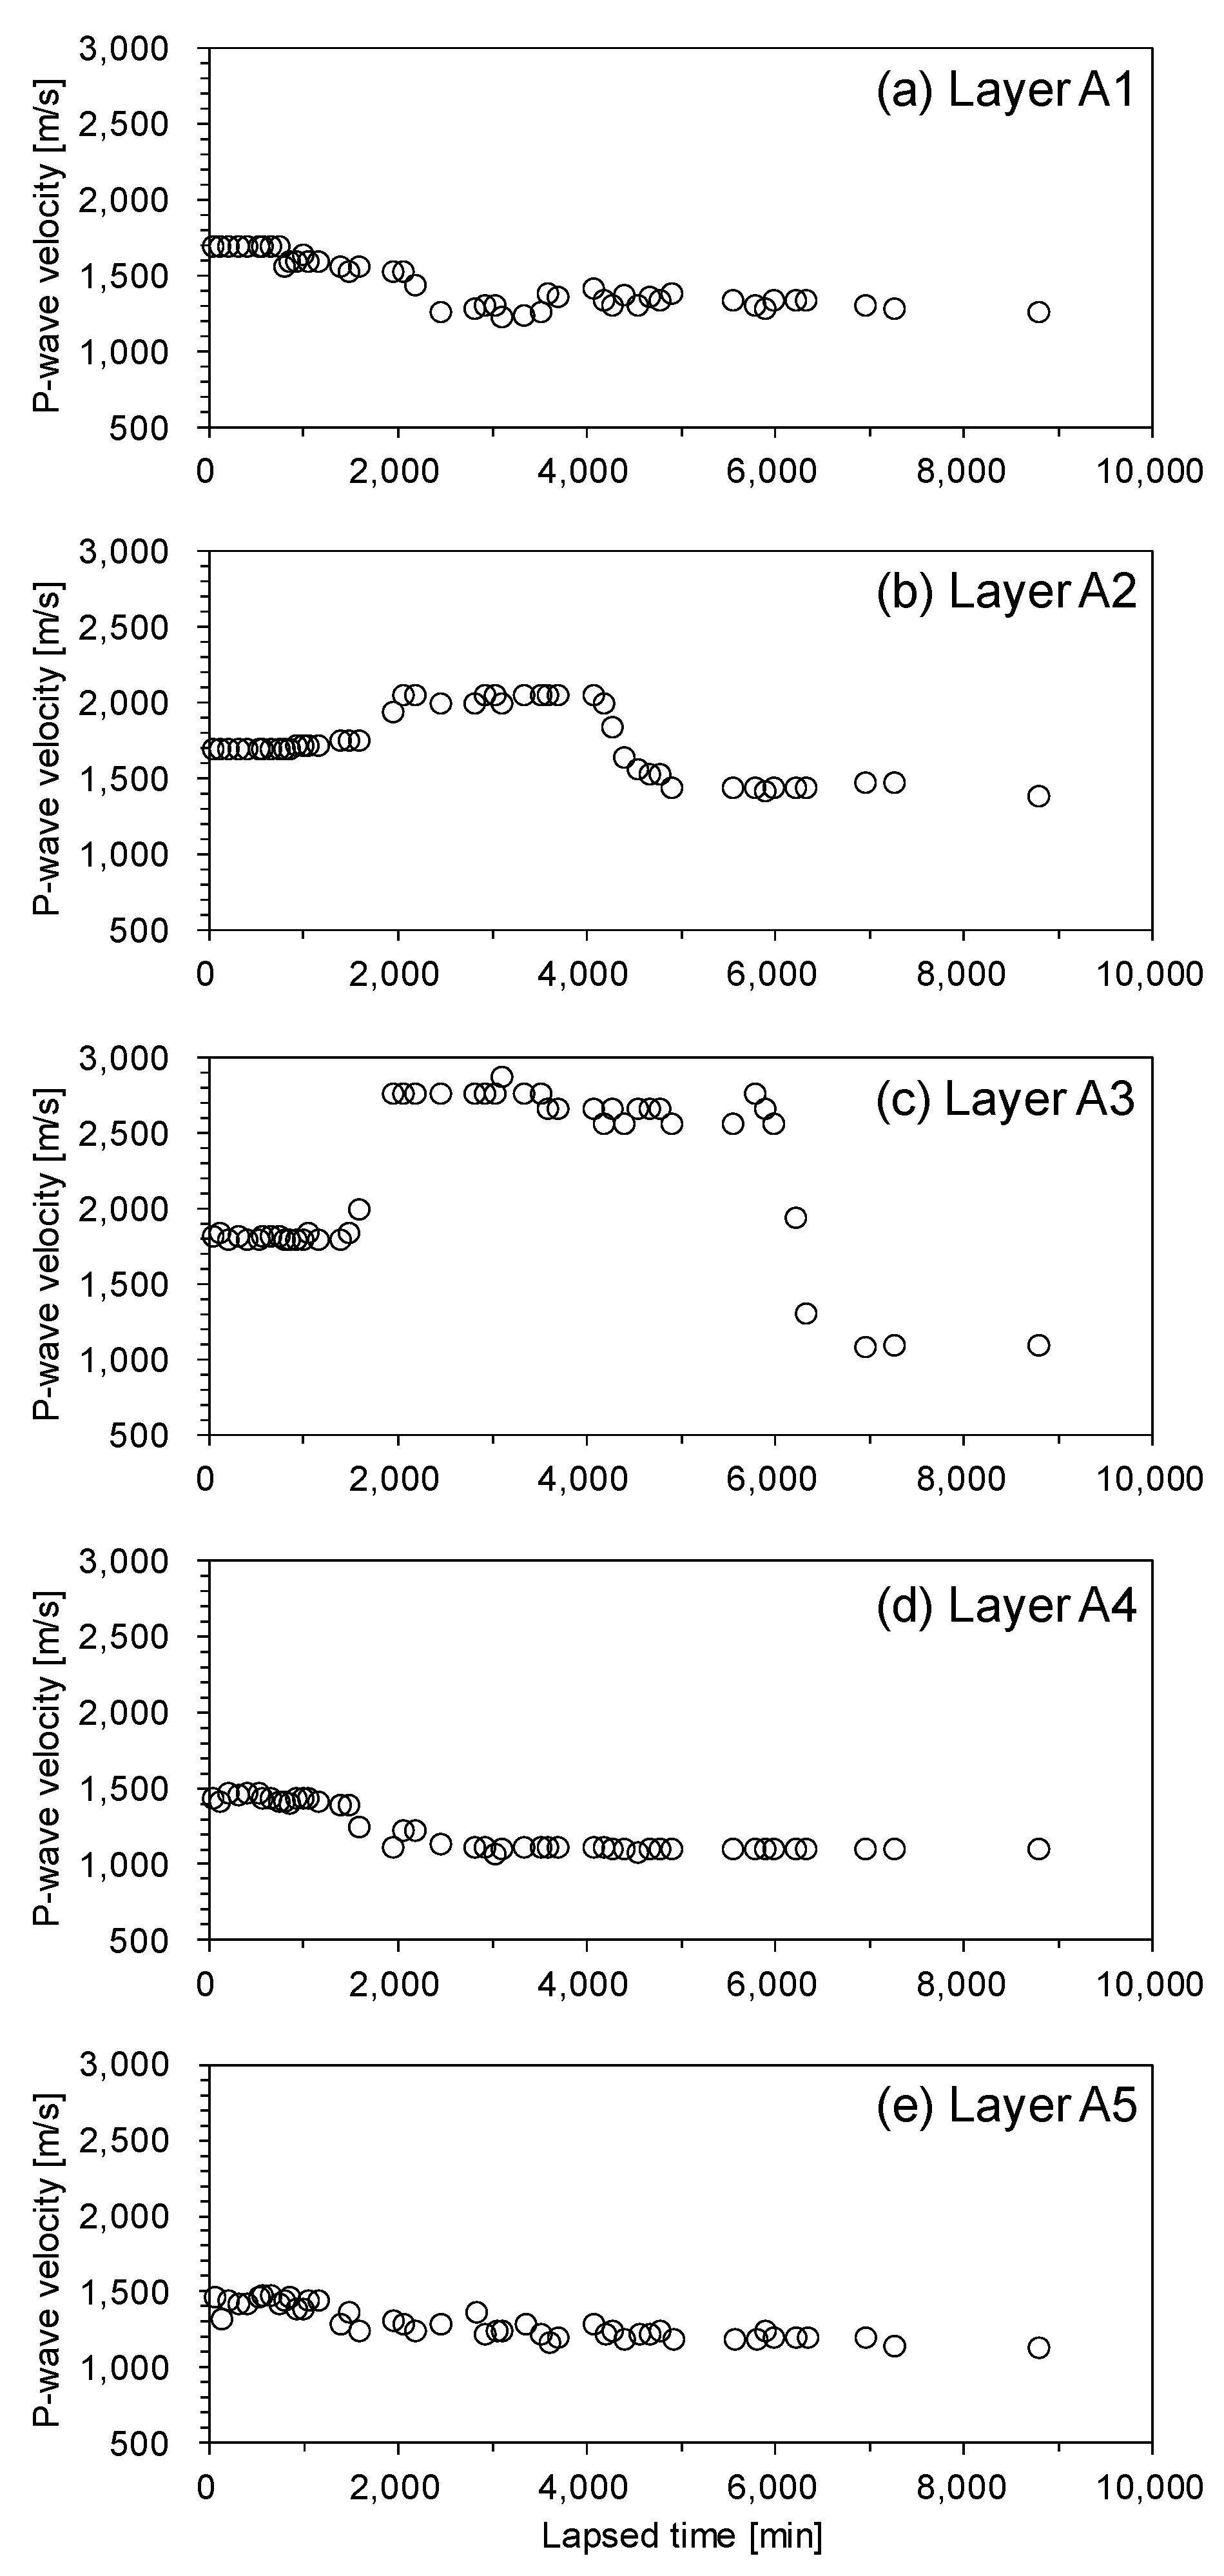
Figure 11.
Normalized electrical resistance R/R0 of the unconsolidated sediment sample during depressurization. (a) layer B1, (b) layer B2, (c) layer B3, (d) layer B4.
Figure 11.
Normalized electrical resistance R/R0 of the unconsolidated sediment sample during depressurization. (a) layer B1, (b) layer B2, (c) layer B3, (d) layer B4.

Figure 12.
Pressure differences between upper (layer A1, A2, and A3) and lower (layer A4 and A5) parts of the cell (ΔP). When the CO2 hydrates formed and stabilized, the average ΔP (ΔPaverage) was about 0.71 MPa.
Figure 12.
Pressure differences between upper (layer A1, A2, and A3) and lower (layer A4 and A5) parts of the cell (ΔP). When the CO2 hydrates formed and stabilized, the average ΔP (ΔPaverage) was about 0.71 MPa.

Figure 13.
Absolute permeability and breakthrough pressure of various consolidated and unconsolidated sediments and estimated values in this study. Filled circle represents estimated values of minimum breakthrough pressure and maximum permeability of CO2 hydrate-bearing sediments. Hollow circles represent F110 sand, kaolinite clay, and montmorillonite clay [42], hollow diamonds represent low-permeability sandstone cores [43], and hollow triangle represents shale [44]. The vertical and horizontal bars indicate the range of the measured values.


© 2019 by the authors. Licensee MDPI, Basel, Switzerland. This article is an open access article distributed under the terms and conditions of the Creative Commons Attribution (CC BY) license (http://creativecommons.org/licenses/by/4.0/).
Share and Cite
MDPI and ACS Style
Kim, H.-S.; Cho, G.-C. Experimental Simulation of the Self-Trapping Mechanism for CO2 Sequestration into Marine Sediments. Minerals 2019, 9, 579. https://doi.org/10.3390/min9100579
AMA Style
Kim H-S, Cho G-C. Experimental Simulation of the Self-Trapping Mechanism for CO2 Sequestration into Marine Sediments. Minerals. 2019; 9(10):579. https://doi.org/10.3390/min9100579
Chicago/Turabian StyleKim, Hak-Sung, and Gye-Chun Cho. 2019. "Experimental Simulation of the Self-Trapping Mechanism for CO2 Sequestration into Marine Sediments" Minerals 9, no. 10: 579. https://doi.org/10.3390/min9100579
Note that from the first issue of 2016, this journal uses article numbers instead of page numbers. See further details here.