Thermal Equation of State of Fe3C to 327 GPa and Carbon in the Core
by
 , and
, and
Suguru Takahashi
1, 
Eiji Ohtani
1,*,
Daijo Ikuta
1,
Seiji Kamada
1,
Tatsuya Sakamaki
1,
Naohisa Hirao
2 and
Yasuo Ohishi
2 1
Department of Earth Science, Graduate School of Science, Tohoku University, 6-3 Aza-Aoba, Aramaki, Aoba-ku, Sendai 980-8571, Japan
2
Japan Synchrotron Radiation Research Institute, 1-1-1 Kouto, Sayo 679-5198, Japan
*
Author to whom correspondence should be addressed.
Minerals 2019, 9(12), 744; https://doi.org/10.3390/min9120744
Submission received: 16 October 2019
/
Revised: 25 November 2019
/
Accepted: 26 November 2019
/
Published: 30 November 2019
(This article belongs to the Special Issue Mineral Physics—In Memory of Orson Anderson)
Abstract
:The density and sound velocity structure of the Earth’s interior is modeled on seismological observations and is known as the preliminary reference Earth model (PREM). The density of the core is lower than that of pure Fe, which suggests that the Earth’s core contains light elements. Carbon is one plausible light element that may exist in the core. We determined the equation of state (EOS) of Fe3C based on in situ high-pressure and high-temperature X-ray diffraction experiments using a diamond anvil cell. We obtained the P–V data of Fe3C up to 327 GPa at 300 K and 70–180 GPa up to around 2300 K. The EOS of nonmagnetic (NM) Fe3C was expressed by two models using two different pressure scales and the third-order Birch–Murnaghan EOS at 300 K with the Mie–Grüneisen–Debye EOS under high-temperature conditions. The EOS can be expressed with parameters of V0 = 148.8(±1.0) Å3, K0 = 311.1(±17.1) GPa, K0′ = 3.40(±0.1), γ0 = 1.06(±0.42), and q = 1.92(±1.73), with a fixed value of θ0 = 314 K using the KBr pressure scale (Model 1), and V0 = 147.3(±1.0) Å3, K0 = 323.0(±16.6) GPa, K0′ = 3.43(±0.09), γ0 = 1.37(±0.33), and q = 0.98(±1.01), with a fixed value of θ0 = 314 K using the MgO pressure scale (Model 2). The density of Fe3C under inner core conditions (assuming P = 329 GPa and T = 5000 K) calculated from the EOS is compatible with the PREM inner core.
1. Introduction
The density of the Earth’s interior has been determined using the preliminary reference Earth model (PREM) [1]. The Earth’s core is composed mainly of iron. The density of iron at specific pressure and temperature conditions has been determined in high-pressure and high-temperature experiments and from theoretical calculations (e.g., [2,3]). These studies implied that the density of pure hcp-Fe is higher than that obtained from seismological models such as PREM [1]. The density deficit is estimated to be ~10% for the outer core [4,5,6,7] and 2–5% for the inner core [8,9]. A recent study estimated the density of hcp-Fe to be 13.8–14.0 g/cm3 [10,11] under inner core conditions, which corresponds to a density deficit of the inner core of 3.5–5.1%. Therefore, light elements may be contained within the Earth’s inner core. Carbon is one candidate for these light elements, and Fe3C is thought to be a constituent of the inner core (e.g., [12]). There are several works on the phase relations of the Fe–C system. Liu et al. [13] reported that Fe3C is stable up to 150 GPa and that it melts incongruently into Fe7C3 and liquid at high temperatures in this pressure range and decomposes to Fe7C3 and Fe at higher pressures and temperatures. However, recent experiments report contradicting results. For example, Mashino et al. [14] reported Fe3C is stable up to 250 GPa, and they did not find any evidence for decomposition of Fe3C at around 150 GPa, as was reported by Liu et al. [13]. More recently, Takahashi et al. [15] studied the stability of Fe3C up to and above 300 GPa and showed that it was stable up to this pressure, whereas it melted incongruently into Fe7C3 and liquid under the pressure and temperature conditions studied. The stability of Fe3C is also supported by a recent shock experiment by Hu et al. [16]. They reported no evidence for decomposition of Fe3C to Fe7C3 and Fe in the pressure range from 80 GPa to 248 GPa along the Hugoniot, which is consistent with the results of Mashino et al. [14] and Takahashi et al. [15]. Therefore, Fe3C is an important potential constituent of the inner core.
The compression behavior of Fe and Fe alloys is related to their magnetic properties. The transition of magnetic Fe3C to a nonmagnetic (NM) phase is estimated to occur at 70 GPa [17]. However, based on X-ray emission spectroscopy data [18] and the Mössbauer spectroscopy data [19], it has been revealed that this magnetic transition finishes at 20–25 GPa. Although there is a discrepancy in the absolute pressure of this transition to an NM phase, Fe3C will be NM under inner core conditions. The compression behavior of NM Fe3C up to core pressure conditions was reported by Sata et al. [20], but these experiments were only carried out at room temperature. Litasov et al. [21] determined the compression behavior of ferromagnetic (FM) Fe3C up to about 30 GPa and estimated the density of NM Fe3C under inner core conditions by assuming that the compression behavior of NM Fe3C is similar to that of FM Fe3C, which they determined. Very recently, Hu et al. [16] conducted shock experiments of Fe3C and estimated the density of Fe3C under inner core conditions. However, it is not well resolved whether their data correspond to NM Fe3C. Presently, there are no high-temperature static compression experiments on NM Fe3C.
To precisely estimate the density of NM Fe3C in the inner core, it is necessary to understand the compression behavior of NM Fe3C under high-pressure and high-temperature conditions. In this study, we measured the compression behavior of NM Fe3C using in situ X-ray diffraction (XRD) experiments in a double-sided, laser-heated diamond anvil cell and determined the equation of state (EOS) to estimate the amount of carbon in the inner core.
2. Materials and Methods
2.1. Sample Preparation
The starting material was a powdered sample of Fe3C, which was synthesized from a mixture of iron and graphite powders that was heated to 1273 K at 3 GPa for 12 h using a 3000 ton, Kawai-type multianvil apparatus installed at Tohoku University, Japan. The high pressure was generated using a symmetric-type diamond anvil cell and a membrane diamond anvil cell. The culet sizes of the diamond anvils were 100 and 150 µm, respectively. A tungsten gasket was indented to a thickness of 25–40 µm, and a hole with a diameter of 30–50 µm was drilled into the indented gasket to form a sample chamber. A foil from the synthesized Fe3C sample was made using a cold-compression technique. KBr and MgO were used as the pressure marker [22,23] and the thermal insulator/pressure medium, respectively, for the high-pressure and high-temperature experiments up to 181.7 GPa. The pressure marker of KBr was sandwiched by the Fe3C layers, and then the KBr and Fe3C layers were sandwiched between MgO. We sandwiched the Fe3C foil between the SiO2 powder of the thermal insulator/pressure medium for the both the experiments above 298.9 GPa and those at room temperature.
2.2. In Situ XRD Experiments at the BL10XU Beamline at Spring-8
The in situ XRD experiments were conducted at the BL10XU beamline at the Spring-8 facility (Hyogo, Japan) [24]. The sample was heated using a double-sided laser heating technique [25] employing an SPI fiber laser (λ = 1.070 µm). The shape of the fiber laser beam was adjusted to a flattop beam using the beam-shaping system at the BL10XU beamline. This technique enabled us to decrease the temperature gradient across the sample and achieve a homogenous heated area with a diameter of approximately 30 µm. The temperature was determined by fitting the emission spectra from the surface of the heated sample to Planck’s radiation law as a grey body formula using the typical wavelength range between 600 and 800 nm. The wavelength of the monochromatic X-ray beam and the distance between the sample and the X-ray detector were calibrated using XRD patterns from CeO2 based on the double-cassette method. The typical wavelength of the X-rays was 0.4142(2)–0.4157(1) Å. The X-ray beam was collimated to a diameter of 15–20 µm. An imaging plate (IP) detector (RAXIS-IV; Rigaku, Tokyo, Japan) was used to collect the angle-dispersive XRD data. The exposure times for the IP were either 1 or 3 min. Each integrated XRD pattern, along with the 2θ angle (i.e., a one-dimensional XRD profile), was analyzed using an IP analyzer and PD Indexer software package [26].
The experimental pressures were determined using the EOS of KBr (B2) [22] and that of MgO [23] for the high-pressure and high-temperature experiments, whereas the compression curve of pyrite SiO2 at 300 K was used for determination of pressure for the experiments exceeding 298.9 GPa [27]. The temperature distribution in the pressure medium in the double-heated diamond anvil cell (DAC) was evaluated from 3-dimensional numerical modeling [28]. This model calculation indicates that with a thickness of 1–2 µm, the temperature difference between the inner and anvil surfaces in the MgO layer is around 100–200 K at 2000 K, which is equivalent to the temperature uncertainty in the present experiment. Therefore, the temperature of the MgO layer in the DAC was considered to be the same as the sample temperature. The pressure and temperature conditions for the present experiments, based on the KBr pressure scale [22] and MgO pressure scale [23], are shown in Table S1 in Supplementary Materials.
3. Results
3.1. X-ray Diffraction Patterns of Fe3C
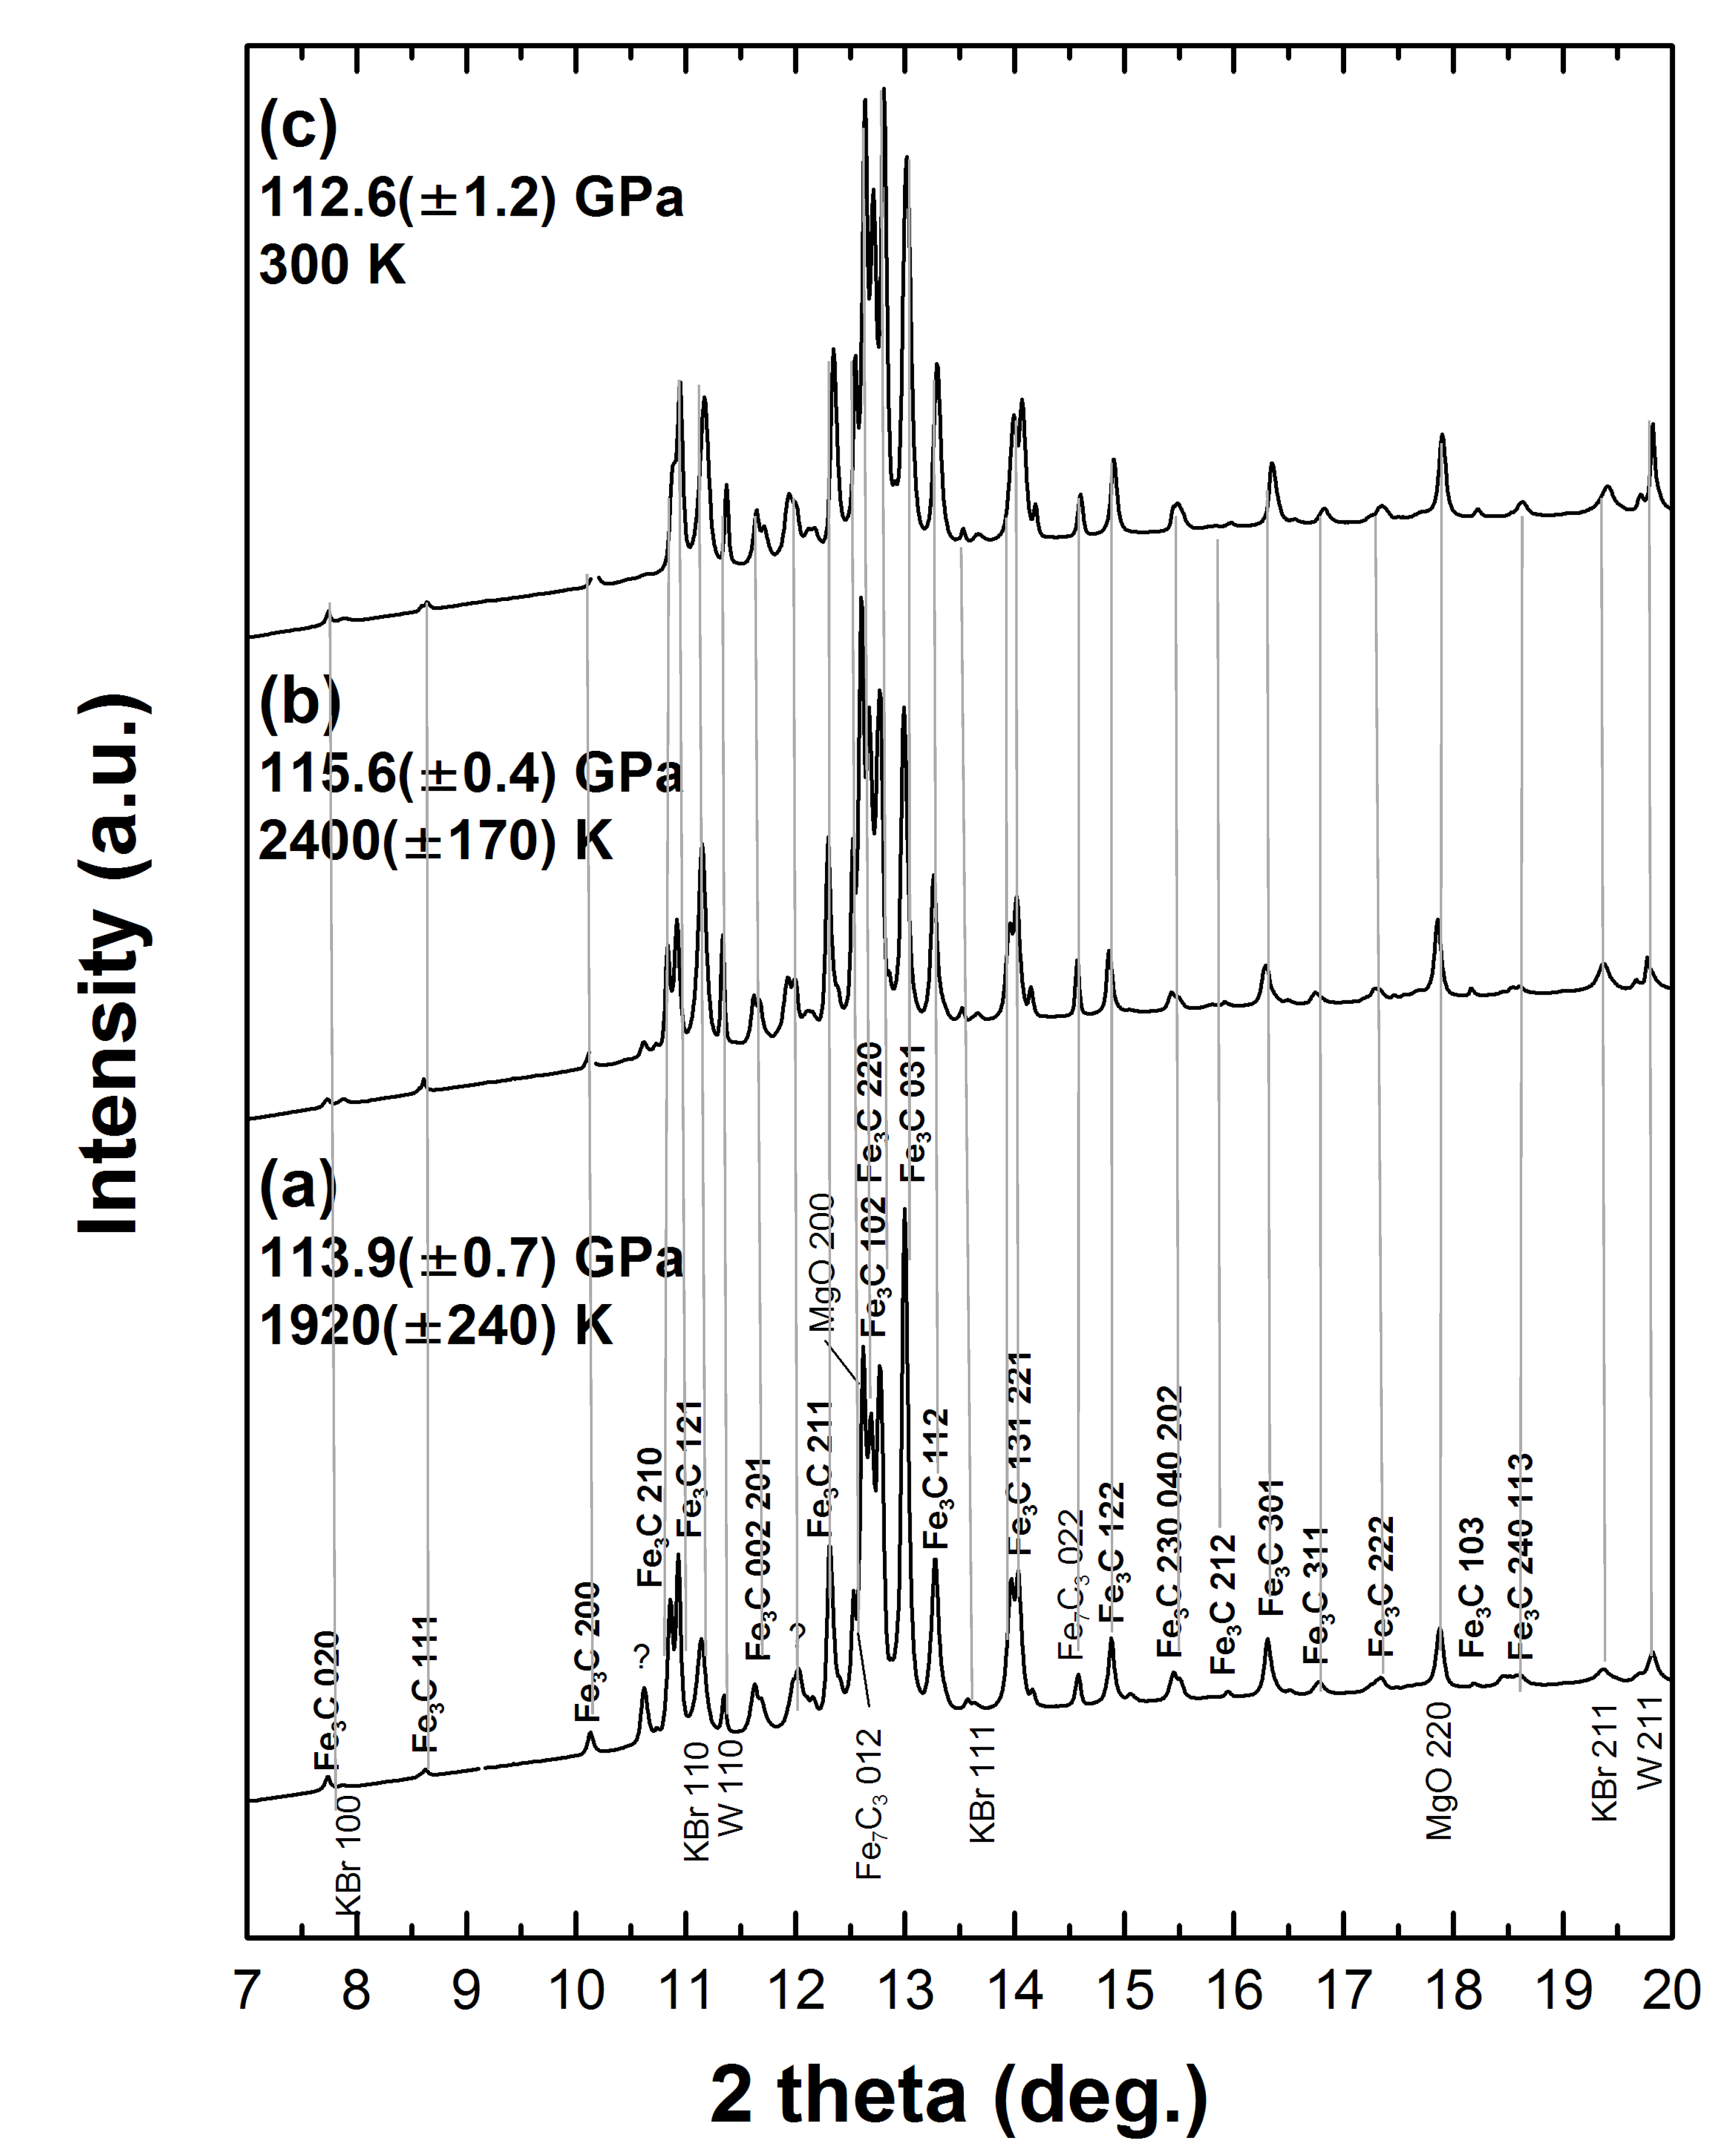
In situ X-ray diffraction experiments were carried out from 71 GPa up to 182 GPa, and samples were heated up to around 2000 K at each pressure condition. The compression behavior of Fe3C above 298.9 GPa at 300 K was obtained after quenching the sample from high temperatures above 1500 K, releasing stress during solid state compression. Its experimental pressures were determined by the equation of state of pyrite-type SiO2 [27]. Previous studies show that the magnetic transition of Fe3C to a nonmagnetic phase occurs at 20–25 GPa [13,19]. Therefore, Fe3C is considered to be nonmagnetic under the conditions of the present experiments. Our results are summarized in Table S1. XRD patterns at pressures of 113–116 GPa and high temperatures are shown in Figure 1. XRD patterns of Fe3C, KBr, and MgO were observed at all present experimental conditions. Fe3C with the cementite structure was stable at all present pressure–temperature conditions.
3.2. Compression Behavior and the Thermal Equation of State of Fe3C
The compressional data at 300 K was fitted to the third-order Birch–Murnaghan equation of state (3BM EOS) as follows:
where, V0, K0, and K0′ are the zero-pressure volume, the bulk modulus, and its pressure derivative, respectively. To investigate the thermoelastic parameters of Fe3C, the Mie–Grüneisen–Debye (MGD) EOS can be fitted to P–V–T data obtained at 71–326 GPa and 300–2450 K. The MGD EOS is represented as follows (e.g., [29]):
where the first and second terms denote the room temperature 3BM EOS (Equation (1)) pressure and the thermal pressure, respectively. The thermal pressure is expressed by the following expressions:
where E is internal thermal energy, is the Grüneisen parameter, θD is the Debye temperature, n is the number of atoms per formula unit, and R is the gas constant. The Debye temperature and the Grüneisen parameter are expressed as a function of volume:
where q is the volume dependence on the Grüneisen parameter. By fitting five parameters (V0, K0, K0′, γ0 and ) with the Debye temperature θ0 = 314 K [21], the following parameters were determined for NM-Fe3C for the model using the pressure scale of KBr: V0 = 148.8(1.0) Å3, K0 = 311.1(±17.1) GPa, K0′ = 3.40(±0.10), γ0 = 1.06(±0.42), and = 1.92(±1.73) [22] (Model 1). Our compression curve of Fe3C at 300 K and high temperatures (Model 1) is shown in Figure 2a,b. Using the MgO pressure scale [23], we obtained the following parameters for NM Fe3C: V0 = 147.3(±1.0) Å3, K0 = 323(±16.6) GPa, K0′ = 3.43(±0.09), γ0 = 1.37(±0.33), and q = 0.98(±1.01), with the Debye temperature of 314 K (Model 2). The compression curve of Fe3C at 300 K and high temperatures (Model 2) is shown in Figure 2c,d.
ΔPth = (γ/V) [E(T, θD) − E(300, θD)]
The values of K0 and K0′ obtained in this study are shown in Table 1, together with those of the previous works. These values are close to the NM Fe3C reported by Sata et al. [20]. On the other hand, the K0 of NM Fe3C is higher than that of ferromagnetic and paramagnetic (PM) Fe3C, and the K0′ of the NM Fe3C is lower than that of FM and PM Fe3C [17,20,21,30,31]. Ono and Mibe [32] reported a significant reduction in b-axis associated to the phase transition from FM to NM Fe3C at 55 GPa, although this discontinuity was assigned to the transition from PM to NM Fe3C by Litasov et al. [21]. However, since our experiments were performed at pressures above 69 GPa (at which NM-Fe3C is stable) and no magnetic transition exists in the present pressure range, we did not observe the discontinuity in any axis at high pressure. In this work, the MGD EOS parameters of our models (Models 1 and 2), together with those determined by Litasov et al. [21], are shown in Table 2.
4. Discussion
Although there are ambiguities concerning the thermal state of the core, the temperatures at the inner core boundary (ICB) and at the center of the Earth are in the range of 5000–6000 K (e.g., [33]). The density of Fe3C at the pressure of the ICB (329 GPa) has been calculated to be 12.83(±0.67) g/cm3 at 5000 K and 12.79(±0.73) g/cm3 at 6000 K, respectively. The density of Fe3C at the pressure of the center of the core (364 GPa) has been calculated to be 13.21(±0.70) g/cm3 at 5000 K and 13.18(±0.76) g/cm3 at 6000 K, respectively. PREM data give a density of 12.76 g/cm3 and 13.09 g/cm3 at the ICB (329 GPa) and the center of the core (364 GPa), respectively.
Figure 3a shows a comparison of the density of Fe [10], NM Fe3C at 300 K and 5000 K, and the PREM density [1] as a function of pressure. The thermal expansion of NM Fe3C with temperature is small compared to hcp-Fe. Our results indicate that the density of Fe3C is compatible with seismological data on the inner core, assuming T = ~5000 K at the ICB pressure. The present density values for NM Fe3C at 5000 K are different from those estimated by Litasov et al. [21] based on FM Fe3C. The estimation of the high-temperature density based on FM Fe3C could be different from that of the real NM Fe3C, although the recent density estimation of Fe3C based on shock compression [16] is close to the estimation by Litasov et al. [21]. In Figure 3b, we show the density of NM Fe7C3 at 5000 K, as described by Chen et al. [34] using thermal parameters for the PM phase [35]. The extrapolated densities of NM Fe3C are slightly greater than those of Fe7C3. However, we cannot quantitatively evaluate the difference in the present accuracy of the experiments.
We concluded that the density of the Earth’s inner core can be explained both by the Fe3C and Fe7C3 density data at 5000~6000 K. Fe and Ni are thought to be major components in the Earth’s core; however, the Earth’s core may also contain carbon and other elements. We need to investigate the effects of Ni and the other elements on the density and sound velocity to form a conclusive argument regarding the composition of the inner core.
Supplementary Materials
The following are available online at https://www.mdpi.com/2075-163X/9/12/744/s1, Table S1: Experimental conditions, volumes, and lattice parameters of Fe3C, KBr, MgO and SiO2.
Author Contributions
E.O. and S.T. devised the project. S.T. performed the sample preparation and managed the experimental plan. All authors participated in the experiments. S.T. and D.I. analyzed the data and performed the calculations. S.T. and E.O. wrote the manuscript with input from all authors.
Funding
This research was funded by Ministry of Education, Culture, Science, Sport, and Technology of Japanese Government, Kakenhi grant (JP22000002) and by Japan Society for the Promotion of Science, Kakenhi grant (JP15H05748) to Eiji Ohtani. Suguru Takahashi was supported by the Research Fellowship for Young Scientists of Japan Society for the Promotion of Science.
Acknowledgments
We thank Takeshi Sakai, Takanori Sakairi, Fumiya Maeda, Nanami Suzuki, and Akio Suzuki for their technical assistance and useful discussions. The in situ XRD experiments were performed with the approval of the Japan Synchrotron Radiation Research Institute (JASRI) (Proposal Nos 2013B0104, 2014A0104, and 2014B0104).
Conflicts of Interest
The authors declare no conflict of interest.
References
- Dziewonski, A.M.; Anderson, D.L. Preliminary reference Earth model. Phys. Earth Planet. Inter. 1981, 25, 297–356. [Google Scholar] [CrossRef]
- Dubrovinsky, L.S.; Dubrovinskaia, N.; Narygina, O.; Kantor, I.; Kuznetzov, A.; Prakapenka, A.B.; Vitos, L.; Johansson, B.; Mikhaylushkin, A.S.; Simak, S.I.; et al. Body-centered cubic iron-nickel alloy in Earth’s core. Science 2007, 316, 1880–1883. [Google Scholar] [CrossRef] [PubMed]
- Vočadlo, L.; Alfe, D.; Gillan, M.J.; Price, G.D. The properties of iron under core conditions from first principles calculations. Phys. Earth Planet. Inter. 2003, 140, 101–125. [Google Scholar] [CrossRef]
- Birch, F. Elasticity and constitution of the Earth’s interior. J. Geophys. Res. 1952, 57, 2199–2224. [Google Scholar] [CrossRef]
- Birch, F. Density and composition of mantle and core. J. Geophys. Res. 1964, 69, 4377–4388. [Google Scholar] [CrossRef]
- Brown, J.M.; McQueen, R.G. Phase transitions, Grüneisen parameter, and elasticity for shocked iron between 77 GPa and 400 GPa. J. Geophys. Res. 1986, 91, 7485–7494. [Google Scholar] [CrossRef]
- Anderson, W.W.; Ahrens, T.J. An equation of state for liquid iron and implications for the Earth’s core. J. Geophys. Res. 1994, 99, 4273–4284. [Google Scholar] [CrossRef]
- Mao, H.K.; Wu, Y.; Chen, L.C.; Shu, J.F. Static compression of iron to 300 GPa and Fe0.8Ni0.2 alloy to 260 GPa: Implications for composition of the core. J. Geophys. Res. 1990, 95, 21737–21742. [Google Scholar] [CrossRef]
- Dubrovinsky, L.S.; Saxena, S.K.; Tutti, F.; Rekhi, S.; LeBehan, T. In-situ X-ray study of thermal expansion and phase transition of iron at multimegabar pressure. Phys. Rev. Lett. 2000, 84, 1720–1723. [Google Scholar] [CrossRef]
- Dewaele, A.; Loubeyre, P.; Occelli, F.; Mezouar, M.; Dorogokupets, P.I.; Torrent, M. Quasihydrostatic equation of state of iron above 2 Mbar. Phys. Rev. Lett. 2006, 97, 215504–215507. [Google Scholar] [CrossRef]
- Sakai, T.; Takahashi, S.; Naoya Nishitani, N.; Mashino, I.; Ohtani, E.; Hirao, N. Equation of state of pure iron and Fe0.9Ni0.1 alloy up to 3 Mbar. Phys. Earth Planet. Inter. 2014, 228, 114–126. [Google Scholar] [CrossRef]
- Wood, B.J. Carbon in the core. Earth Planet. Sci. Lett. 1993, 117, 593–607. [Google Scholar] [CrossRef]
- Liu, J.; Lin, J.F.; Prakapenka, V.B.; Prescher, C.; Yoshino, T. Phase relations of Fe3C and Fe7C3 up to 185 GPa and 5200 K: Implication for the stability of iron carbide in the Earth’s core. Geophys. Res. Lett. 2016, 43, 12415–12422. [Google Scholar] [CrossRef]
- Mashino, I.; Miozzi, F.; Hirose, K.; Morard, G.; Sinmyo, R. Melting experiments on the Fe-C binary system up to 255 GPa: Constraints on the carbon content in the Earth’s core. Earth Planet. Sci. Lett. 2019, 515, 135–144. [Google Scholar] [CrossRef]
- Takahashi, S.; Ohtani, E.; Sakai, T.; Kamada, S.; Ozawa, S.; Sakamaki, T.; Ito, Y.; Hirao, N.; Ohishi, Y. Phase and melting relations of Fe3C to 300 GPa and carbon in the core. In Carbon in Earth’s Interior; AGU Monograph Volume; Manning, C.E., Lin, J.-F., Mao, W., Eds.; American Geophysical Union: Washington, DC, USA, 2019; Chapter 3; pp. 25–36. [Google Scholar]
- Hu, X.; Fei, Y.; Yang, J.; Cai, Y.; Ye, S.; Qi, M.; Liu, F.; Zhang, M. Phase stability and thermal equation of state of iron carbide Fe3C to 245 GPa. Geophys. Res. Lett. 2019. [Google Scholar] [CrossRef]
- Vočadlo, L.; Brodholt, J.; Dobson, D.P.; Knight, K.; Marshall, W.; Price, G.D.; Wood, I.G. The effect of ferromagnetism on the equation of state of Fe3C studied by first-principles calculations. Earth Planet. Sci. Lett. 2002, 203, 567–575. [Google Scholar] [CrossRef]
- Lin, J.F.; Struzhkin, V.V.; Mao, H.K.; Hemley, R.J.; Chow, P.; Hu, M.Y.; Li, J. Magnetic transition in compressed Fe3C from X-ray emission spectroscopy. Phys. Rev. B 2004, 70, 212405. [Google Scholar] [CrossRef]
- Prescher, C.; Dubrovinsky, L.; McCammon, C.; Glazyrin, K.; Nakajima, Y.; Kantor, A.; Merlini, M.; Hanfland, M. Structurally hidden magnetic transitions in Fe3C at high pressures. Phys. Rev. B 2012, 85, 10402. [Google Scholar] [CrossRef]
- Sata, N.; Hirose, K.; Shen, G.; Nakajima, Y.; Ohishi, Y.; Hirao, N. Compression of FeSi, Fe3C, Fe0.95O, and FeS under the core pressures and implication for light element in the Earth’s core. J. Geophys. Res. 2010, 115, B09204. [Google Scholar] [CrossRef]
- Litasov, K.D.; Sharygin, I.S.; Dorogokupets, P.I.; Shatskiy, A.; Gavryushkin, P.N.; Sokolova, T.S.; Ohtani, E.; Li, J.; Funakoshi, K. Thermal equation of state and thermodynamic properties of iron carbide Fe3C to 31 GPa and 1473 K. J. Geophys. Res. 2013, 118, 5274–5284. [Google Scholar] [CrossRef]
- Dewaele, A.; Belonoshko, A.B.; Garbarino, G.; Occelli, F.; Bouvier, P.; Hanfland, M.; Mezouar, M. High-pressure–high-temperature equation of state of KCl and KBr. Phys. Rev. B 2012, 85, 214105. [Google Scholar] [CrossRef]
- Kono, Y.; Irifune, T.; Higo, Y.; Inoue, T.; Barnhoon, A. P–V–T relation of MgO derived by simultaneous elastic wave velocity and in situ X-ray measurements: A new pressure scale for the mantle transition region. Phys. Earth Planet. Inter. 2010, 183, 196–211. [Google Scholar] [CrossRef]
- Ohishi, Y.; Hirao, N.; Sata, N.; Hirose, K.; Takata, M. Highly intense monochromatic X-ray diffraction facility for high-pressure research at SPring-8. High Press. Res. 2008, 28, 163–173. [Google Scholar] [CrossRef]
- Shen, G.; Mao, H.K.; Hemley, R.J. Laser-heated Diamond Anvil Cell Technique: Double-sided Heating with Multimode Nd:YAG Laser, in Advanced Materials ’96. In Proceedings of the 3rd NIRIM International Symposium on Advanced Materials, Tsukuba, Japan, 4–8 March 1996; pp. 149–152. [Google Scholar]
- Seto, Y.; Nishio-Hamane, D.; Nagai, T.; Sata, N. Development of a software suite on X-ray diffraction experiments. Rev. High Press. Sci. Technol. 2010, 20, 269–276. [Google Scholar] [CrossRef]
- Kuwayama, Y.; Hirose, K.; Sata, N.; Ohishi, Y. Pressure-induced structural evolution of pyrite-type SiO2. Phys. Chem. Miner. 2011, 38, 591–597. [Google Scholar] [CrossRef]
- Rainey, E.S.G.; Hernlund, J.W.; Kavner, A. Temperature distributions in the laser-heated diamond anvil cell from 3-D numerical modeling. J. Appl. Phys. 2013, 114, 204905. [Google Scholar] [CrossRef]
- Jackson, I.; Rigden, S.M. Analysis of P–V–T data: Constraints on the thermoelastic properties of high-pressure minerals. Phys. Earth Planet. Inter. 1996, 96, 85–112. [Google Scholar] [CrossRef]
- Li, J.; Mao, H.K.; Fei, Y.; Gregoryanz, E.; Eremets, M.; Zha, C.S. Compression of Fe3C to 30 GPa at room temperature. Phys. Chem. Miner. 2002, 29, 166–169. [Google Scholar] [CrossRef]
- Scott, H.P.; Williams, Q.; Knittle, E. Stability and equation of state of Fe3C to 73 GPa: Implications for carbon in the Earth’s core. Geophys. Res. Lett. 2001, 28, 1875–1878. [Google Scholar] [CrossRef]
- Ono, S.; Mibe, K. Magnetic transition of iron carbide at high pressures. Phys. Earth Planet. Inter. 2010, 180, 1–6. [Google Scholar] [CrossRef]
- Terasaki, H.; Kamada, S.; Sakai, T.; Ohtani, E.; Hirao, N.; Ohishi, Y. Liquidus and solidus temperature of a Fe-O-S alloy up to the pressures of the outer core: Implication for the thermal structure of the Earth’s core. Earth Planet. Sci. Lett. 2011, 232, 379–392. [Google Scholar] [CrossRef]
- Chen, B.; Gao, L.; Lavina, B.; Dera, P.; Alp, E.E.; Zhao, J.; Li, J. Magneto-elastic coupling in compressed Fe7C3 supports carbon in Earth’s inner core. Geophys. Res. Lett. 2012, 39, L18301. [Google Scholar] [CrossRef]
- Nakajima, Y.; Takahashi, E.; Sata, N.; Nishihara, Y.; Hirose, K.; Funakoshi, K.; Ohishi, Y. Thermoelastic property and high-pressure stability of Fe7C3: Implication for iron-carbide in the Earth’s core. Am. Mineral. 2011, 96, 1158–1165. [Google Scholar] [CrossRef]
Figure 1.
X-ray diffraction (XRD) patterns of Fe3C at (a) 113.9(±0.7) GPa and 1920(±240) K, (b) 115.6(±0.4) GPa and 2400(±170) K, and (c) 112.8(±1.2) GPa and 300 K. XRD peaks were assigned to Fe3C—KBr as a pressure marker, MgO as a thermal insulator, and W as a gasket. A few minor peaks derived from Fe7C3 were observed. 2 theta, a diffraction (Bragg) angle.

Figure 2.
Volume compression of NM Fe3C at 300 K and high temperatures. The compression at 300 K (a) and high temperatures based on the KBr pressure scale [22] (b) (Model 1). That at 300 K (c) and high temperatures based on the MgO pressure scale [23] (d) (Model 2). The pressure values above 290 GPa at 300 K in (a,c) are based on the equation of state of pyrite SiO2 [27]. Black solid diamond symbols show the volume at high pressure and 300 K. Solid and dashed lines in (a,c) show the compression curves from this study and the study of Sata et al. [20], respectively. Black, blue, green, and red diamond symbols in (b,d) show the volume data set at around 1700(±100) K, 2000(±200) K, and 2400(±200) K and high pressure, respectively. Black, blue, green, and red curves in (b,d) show the compression curves at 300 K, 1700 K, 2000 K, and 2400 K, respectively. The detailed volume data at high pressure and temperature are given in Table S1. The fitting parameters for the thermal equation of state (Models 1 and 2) are shown in each figure.

Figure 3.
Pressure and density curves of NM Fe3C (present), NM Fe7C3 [34], and hcp-Fe [10] at 300 K and 5000 K. The preliminary reference Earth model (PREM) density under the core conditions [1] is also shown in the figure. (a) The density curves for NM Fe3C at 300 K and 5000 K using the KBr scale (Model 1) [22] and the MgO scale (Model 2) [23] are shown as red-dashed and red-dotted curves, and blue-dashed and blue-dotted curves, respectively. The uncertainties of the density of the two models extrapolated to the inner core pressure and 5000 K are shown in this figure. The PREM density in the core is shown as a green dashed curve. The density curve at 5000 K estimated by Litasov et al. [21] is shown as a pink dotted curve. (b) The density curves for NM Fe7C3 at 300 K and 5000 K are shown as a pink dashed curve and a pink dotted curve, respectively. The uncertainty of the density [34] at 5000 K is shown in this figure. The PREM density is shown as a green dashed curve.


Table 1.
Fitting parameters of thermal equations of state of Fe3C.
| V0 (Å3) | K0 (GPa) | K0′ | EOS | Phase | Reference |
|---|---|---|---|---|---|
| 148.8 ± 1.0 | 311.1 ± 17.1 | 3.40 ± 0.10 | 3BM | NM | Model 1 (based on KBr EOS) |
| 147.3 ± 1.0 | 323 ± 16.6 | 3.43 ± 0.09 | 3BM | NM | Model 2 (based on MgO EOS) |
| 149.46 | 290 | 3.76 | 3BM | NM | Sata et al. [20] |
| 148.9 | 317 | 4.3 | 3BM | NM | Vočadlo et al. [17] |
| 155.3 | 174 | 4.8 | 3BM | - | Li et al. [30] |
| 155.2 | 175 | 5 | Vinet | PM | Litasov et al. [21] |
| 154.42 | 194 | 4.6 | Vinet | PM | Litasov et al., MGD [21] |
| 155.26 | 175.4 | 5.1 | 3BM | FM | Scott et al. [31] |
| 155.4 | 167 | 6.7 | Vinet | FM | Ono and Mibe [32] |
© 2019 by the authors. Licensee MDPI, Basel, Switzerland. This article is an open access article distributed under the terms and conditions of the Creative Commons Attribution (CC BY) license (http://creativecommons.org/licenses/by/4.0/).
Share and Cite
MDPI and ACS Style
Takahashi, S.; Ohtani, E.; Ikuta, D.; Kamada, S.; Sakamaki, T.; Hirao, N.; Ohishi, Y. Thermal Equation of State of Fe3C to 327 GPa and Carbon in the Core. Minerals 2019, 9, 744. https://doi.org/10.3390/min9120744
AMA Style
Takahashi S, Ohtani E, Ikuta D, Kamada S, Sakamaki T, Hirao N, Ohishi Y. Thermal Equation of State of Fe3C to 327 GPa and Carbon in the Core. Minerals. 2019; 9(12):744. https://doi.org/10.3390/min9120744
Chicago/Turabian StyleTakahashi, Suguru, Eiji Ohtani, Daijo Ikuta, Seiji Kamada, Tatsuya Sakamaki, Naohisa Hirao, and Yasuo Ohishi. 2019. "Thermal Equation of State of Fe3C to 327 GPa and Carbon in the Core" Minerals 9, no. 12: 744. https://doi.org/10.3390/min9120744
Note that from the first issue of 2016, this journal uses article numbers instead of page numbers. See further details here.