Origin of Smectite in Salinized Soil of Junggar Basin in Xinjiang of China


1
Key Laboratory of Arable Land Conservation (Middle and Lower Reaches of Yangtze River), Ministry of Agriculture, Huazhong Agricultural University, Wuhan, Hubei 430070, China
2
Agricultural College, Shihezi University, Shihezi, Xinjiang 832000, China
3
Xinjiang Academy of Agricultural Reclamation Science, Shihezi, Xinjiang 832000, China
*
Author to whom correspondence should be addressed.
†
These authors contributed equally to this work and should be considered co-first authors.
Minerals 2019, 9(2), 100; https://doi.org/10.3390/min9020100
Submission received: 13 December 2018
/
Revised: 3 February 2019
/
Accepted: 5 February 2019
/
Published: 10 February 2019
(This article belongs to the Special Issue Chemical-Physical Properties of Minerals and Minerogenesis in Supergene Environment)
Abstract
:In this paper, salinized soils with different degrees of salinity are sampled in Junggar Basin of Xinjiang of China. The X-ray diffraction, transmission electron microscopy, and inductively coupled plasma mass spectrometry are employed to investigate the morphology and distribution characteristics of smectite in salinized soil profiles. In the salinized soil profiles of this region, crystals of smectite are poor where lattice fringes are not parallel. In all soil layers, the content of smectite in the soil increases with the decrease in content of illite, which has demonstrated significant negative correlation (r = 0.79, n = 50, p < 0.01) between illite and smectite. This phenomenon has demonstrated that illite may be transformed into smectite in salinized soils of studied regions. In general, the transformation process of illite to smectite is affected by climate condition. The δ18O values of secondary carbonate in the 0–10 cm soil layers is higher than that in deep soil layers, which indicates that δ18O concentrates in surface soil and reflects temperature rise during soil layer formation. The δ13C values of secondary carbonate and soil organic matter in 0–10 cm soil layers are higher than that in deep soil layers. It indicates that C4 plants were the main plants, which reflects that the climate was relatively dry during the formation of the surface soil. Thus, the climate during the surface soil formation is arid, which is not conducive for leaching K+ from illite of the 0–10 cm soil to form smectite. As a result, the content of the smectite becomes lowest in the soil surface. In the relative humid condition of deep soil layers, the K+ of the illite of the soil would be relative easily leached and more smectite may be formed. Furthermore, the presence of salt in the salinized soil would promote the formation of smectite in Junggar Basin of Xinjiang. A lot of Ca2+, Na+ and Mg2+ in the soil solution of salinized soils would enter into the illite and occupy K+ positions. The studied result shows that the amount of smectite would increase with the increase of salt below 10 cm of the soil layer, where the amount of smectite would be significantly correlated with soil electrical conductivity (r = 0.64, n = 39, p < 0.01). In the Junggar Basin in Xinjiang, therefore, the salinized soil below 10 cm would have the necessary water conditions and chemical components for illite transformation to smectite.
1. Introduction
Smectite commonly exists in the soil, where there are different views on the formation and transformation of smectite in saline-alkali environments. Abtahi et al. [1] concluded that the arid and semi-arid areas of Iran with high concentrations of Si, Mg, and Ca are favorable for smectite to form from soil solutions. It has been suggested by Mahjoory [2] that Si and Al from feldspar were more easily dissolved under the high alkali and high electrolyte solutions of salinized soils. Subsequently, smectite was formed by combining Si with soluble salt ions from soil solutions. The seasonal drought would result in loss of K+, Fe2+ and Fe3+ in mica of the saline soil, which ultimately would lead to formation of smectite [3]. Aoudjit et al. [4] revealed that the formation and distribution of smectite in the soil would be affected by low-lying areas, rich in salt parent material, high pH value and high salt ions in the chemical environments. Thai researchers found that, smectite can be formed in tropical savannahs of Thailand, since a large number of soluble Si4+ is accumulated due to low leaching rate in those areas with arid climate. Then the Si4+ would enter into the kaolinite, and the resilication phenomenon would occur. As a result, there would exist not only kaolinite, but also smectite in the salinized soil of the tropics [5]. Furquim et al. [6,7] deduced that ferribeidellite in the upper zone that are rarely reached by the lake-level variation, originating from the transformation of mica and vermiculite, is an intermediate in this transformation. Within the lower zone, smectites were dominantly trioctahedral, Mg-rich, and are saponitic and stevensitic minerals that originated from chemical precipitation of the alkaline-saline lake. Clay minerals of the saline soil in Iran were reported that the illite/smectite mixed mineral and chlorite/smectite layer minerals are produced by transformation [8]. Therefore, in the literature, it is indicated that possible sources of smectite in saline soils include formation directly from the solution, and transformation from other mineralized sources, or from the parent material.
Apart from the research on the formation of smectite in the saline soil, researchers also found that the content of smectite in the surface soil of the saline-alkaline soil profiles was less than that in the deep soil layers. One opinion was that smectite was translocated by processes of lessivage from the Ae to Bnt horizons, which led to smectite as the major clay mineral in both the B and C horizons of solonetzic soil [9]. The justification of this result is based on the fact that clay content in B horizons of a soil profile is higher than that in the A horizons. In other literature, it was suggested that alkaline conditions may cause deformation or degradation of smectite in the surface layer of salinized soil. As a result, the content of smectite in the surface layer would be decreased. For example, smectite in salt-affected soils in North America would experience degradation due to the impact of high salt and soda content [10]. Smectite deformed in the surface horizons of solonetzic soils in Montana [11]. In these existing studies, the impact of high salinity on the formation of smectite was reported, whereas it was not reported anywhere on how the different salt content would influence the formation of smectite.
Salinization is a very acute problem in the arid region of the northwest of China, especially in Xinjiang Autonomous, China. The salt-affected arable soil accounts for about 31.1% area of this region [12]. Since the salinized land area is large and widely distributed with various types of salt, Xinjiang has been named “the world museum of saline-alkali soil” by the famous soil scientist V. A. Kovda [13]. In this work, the soils with different degree of salinization are sampled in the southern margin of Junggar Basin in Xinjiang. X-ray diffraction (XRD), scanning transmission electron microscopy/Energy-dispersive X-ray spectroscopy (STEM/EDS), and inductively coupled plasma mass spectrometry (ICP-MS) were used to study the formation and distribution characteristics of smectite in salinized soils of arid regions in Xinjiang, especially the influences of different salinization on the formation of smectite in arid regions. This paper evaluates climatic and environmental evolution of soil formation process by analyzing changes of δ13O and δ18C in carbonate and δ13C in soil organic matter. Then, from perspectives of climatic and environmental evolution to interpret smectite formation in soil and to analysis effect of soil salt content on smectite formation, these results can reveal the reason for formation of smectite in salinized soil of arid regions, promoting theory development on the formation of clay minerals in arid regions.
2. Materials and Method
2.1. Study Area
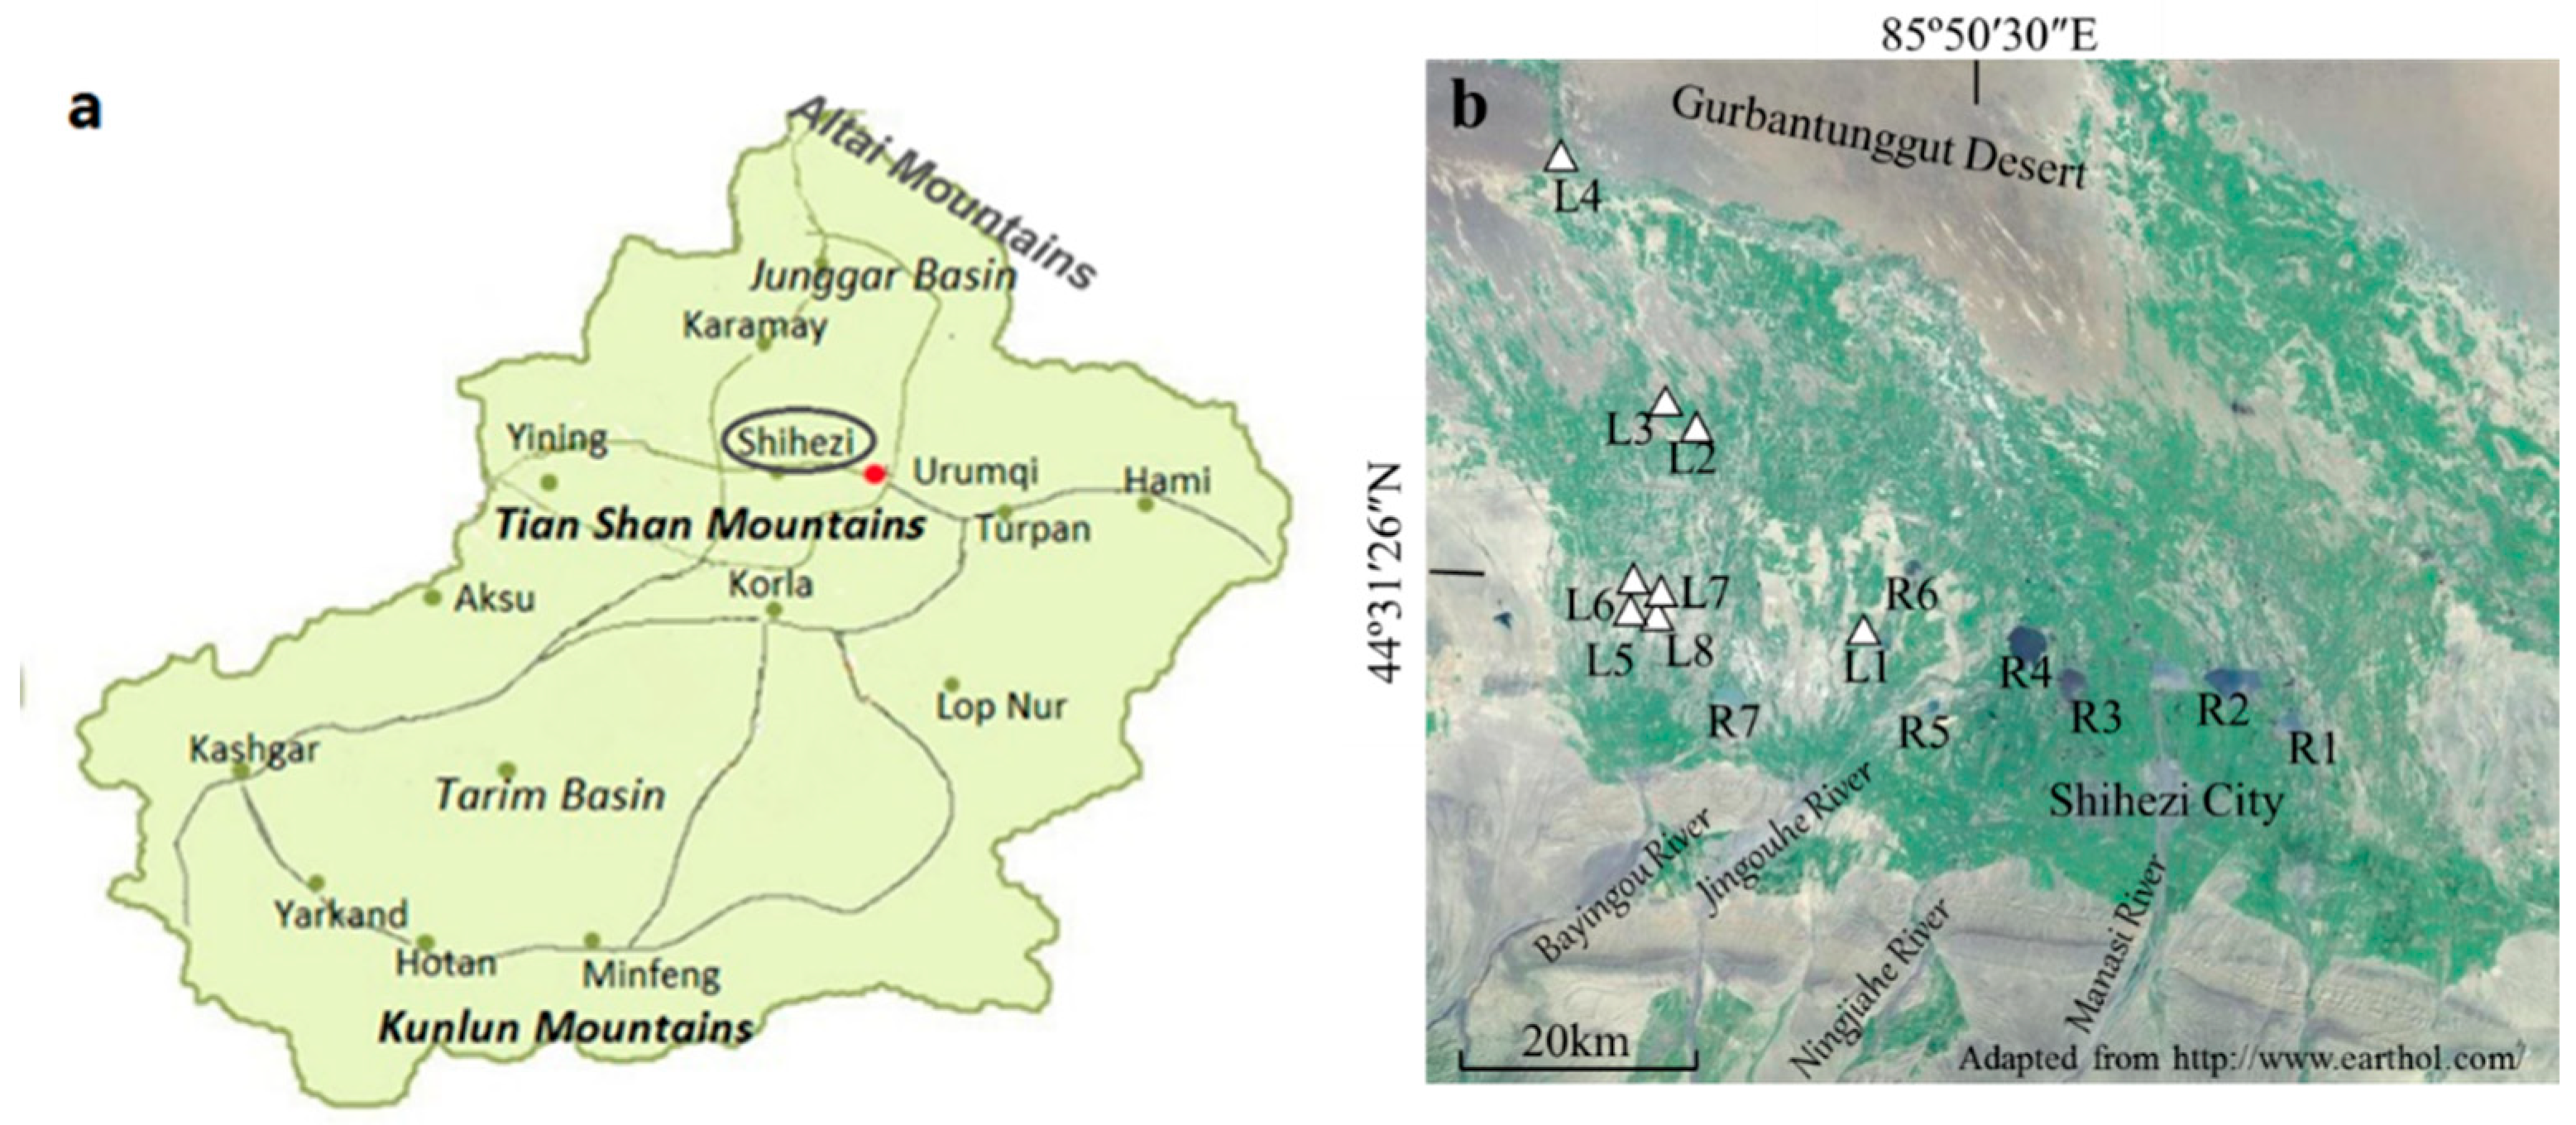
The Junggar Basin is located in the northern part of Xinjiang, which is located in a closed terrene topography formed by the Tianshan Mountains and the Altai Mountains. The parent rock is mainly salt rock and carbonate sediments [12]. The salinized soils in this basin are mainly distributed in Shihezi, Karamay and so on. In this study, Shihezi area of the southern Junggar Basin (84°58′–86°24′ E, 43°26′–45°20′ N) was selected as the sample collection area, as shown in Figure 1a.
The study area is characterized by a temperate continental climate where winter is long and cold, and summer results in drought. The annual average evaporation is around 1500–2000 mm and the annual average precipitation is around 180–270 mm. The climatic condition causes strong surface evaporation of soil, which leads vast amounts salt be accumulated in soil surface layer. Natural vegetation coverage is rather low with only 15–20, which are mainly salt-tolerant plants such as Salicornia europaea L., Tamarix chinensis Lour., Karelinia caspica (Pall.) Less., and so on. These halophytes also play a role in aggregating the salt in soil. The main cation of soil salt are Ca2+ and Mg2+, followed by Na+ and K+. These natural conditions cause the soil salinization problem to be severe in this region. The salinized soil is widely distributed in the edge of alluvial-proluvial fan, the alluvial plain and dry delta, especially in the edge of alluvial-proluvial fan and in the upper part of alluvial plain.
2.2. Soil Sample Collection and Analysis of Physical and Chemical Properties
According to the difference of soil salinity, fifty vertically oriented samples were taken from representative soil profiles at eight locations. Soil landscape characteristics of the sampling locations (Figure 1b) is described in detail (Table 1).
Soil samples were air-dried and crushed to pass through a 2 mm sieve for particle-size distribution measurement, through a 1 mm sieve for soil pH and electrical conductivity (EC) analysis and through a 0.25 mm sieve for soil organic matter (SOM) and carbonate measurement. Soil pH was measured at a soil to water mass ratio of 1:1 by using a pH-meter. EC at 25 °C was measured at a soil: to water mass ratio of 1:5 by a conductivity meter. Carbonate of samples was determined by a manometric method. Particle-size distribution was determined by the soil texture hydrometer method. Soil organic matter was determined with potassium dichromate and sulfuric acid digestion method [14].
2.3. Extraction and Determination of Soil Clay Minerals
The air-dried and crushed soil samples were first treated with, respectively, diluted H2O2 and 0.02 mol/L HCL (buffered with sodium acetate at pH = 5.0) to remove organic matter and calcium carbonate. To remove excess ions from these fractions, several washings with distilled water were applied. The clay fraction (<2 μm) was separated from of the bulk samples by a sedimentation technique according to Stokes’ law using repeated siphoning until the suspension withdrawn became clear. The obtained clay fractions were concentrated by flocculation and centrifugation and then dried at 50 °C [15].
2.3.1. Mineralogical Determination by XRD
The mineralogy of clay fractions were examined in detail by X-ray diffraction (XRD). Prior to the XRD analysis, free Al and Fe phases were dissolved using the DCB extraction method. Two types of XRD patterns were acquired: Mg-saturated with glycerol solvation, K-saturated, and heated for 2 h (350 ℃ and 550 ℃) samples. All of the X-ray diffraction was recorded by a D8 Advance-ray diffraction (XRD) equipped with CuKα radiation. Clay fractions were scanned from 3° to 30° 2θ, at a step size of a 0.02° 2θ and a scan speed of 0.04° 2θ s−1. Identification of clay minerals was mainly based on the comparison of the XRD patterns obtained under the four different conditions: Mg-glycerol, K-25 °C, K-350 °C and K-550 °C.
By removing the background of XRD patterns of Mg-glycerol, semi-quantitative estimates of peak areas of smectite (including mixed-layer minerals) (1.8 nm), illite (1.0 nm), and kaolinite + chlorite (0.7 nm). In this experiment, the ratio coefficient of illite was assumed to be 3.5, whereas the ratio coefficient of smectite, chlorite, and kaolinite was 2 [15]. Subsequently, the proportion of each peak to the total integrated area was calculated, to determine the mineral content of smectite, illite, chlorite + kaolinite. Relative proportions of kaolinite and chlorite were determined on the basis of the ratio at the 0.358/0.354 peak area by peak-differentiating and imitating analysis. The proportion of chlorite and kaolinite at 0.71 nm peak and their content were further calculated [16].
2.3.2. Mineralogical Determination by STEM/EDS
Transmission electron microscope (TEM) measurements were performed on JEM-2100F with an energy dispersive X-ray (EDS) facility. The sample was mixed with alcohol and deposited on a Cu grid covered with a perforated carbon membrane.
2.3.3. Chemical Determination by ICP-MS
After microwave digestion of soil clay mineral samples, the contents of SiO2, Fe2O3, Al2O3, CaO, MgO, K2O, Na2O, TiO2 and P2O5 were determined by inductively coupled plasma mass spectrometry (ICP-MS).
2.3.4. Determination of δ13C and δ18O in Secondary Carbonate
In the reference, it has been shown that carbonate in fine grained soil (<2 μm) can reveal the geochemical information of soil formation in the arid region of northwest China. This geochemical information can be effectively used to interpret the paleoclimatic and paleoenvironmental information during soil formation [17,18]. In this study, the sedimentation method is used to obtain soil particles of <2 μm according to Stokes’ law. These separated soil samples (<) were dried and crushed. Then, samples of about 2–4 mg were placed in tin cups and went through the autosampler to the element analyzer (vario PYRO cube, German Elementar Company), which ultimately became pure CO2 and N2 gas by the combustion (combustion temperature 1020 °C) and reduction (reduction furnace temperature 650 °C). Afterwards, the CO2 gas was diluted, then tested in the isotope mass spectrometer (IsoPrime100, British Isoprime Company, Manchester, UK) to determine the δ13C and δ18O in the soil carbonate. The results were calibrated with the international V-PDB standard as the reference.
2.3.5. Determination of δ13C in Organic Matter
After the inorganic carbon in soil was removed by acid treatment, δ13C in organic matter was determined by using isotope ratio mass spectrometer (IRMS), where the testing results were calibrated by the international standard V-PDB as the benchmark.
3. Results and Analysis
3.1. General Physicochemical Properties of Salinized Soil
The sampling location is in the temperate desert steppe zone where natural vegetation coverage is rather low and soil organic matter content is also low within only 1.0–16.2 g·kg−1. The soil texture is mostly loam, where strong soil capillary force can make the salt with water evaporation move from the lower layer of the soil profile to the upper layer. As a result, salt accumulation becomes very prominent in the soil surface, where the white salt crust mixed with yellow salt crystals would appear on the surface of soil as shown in Figure 2(S1,S3–S6). Moreover, there are also a large number of white salt crystals in the soil profiles, as shown Figure 3. There is no obvious difference in soil color, as shown Figure 2(SP5).
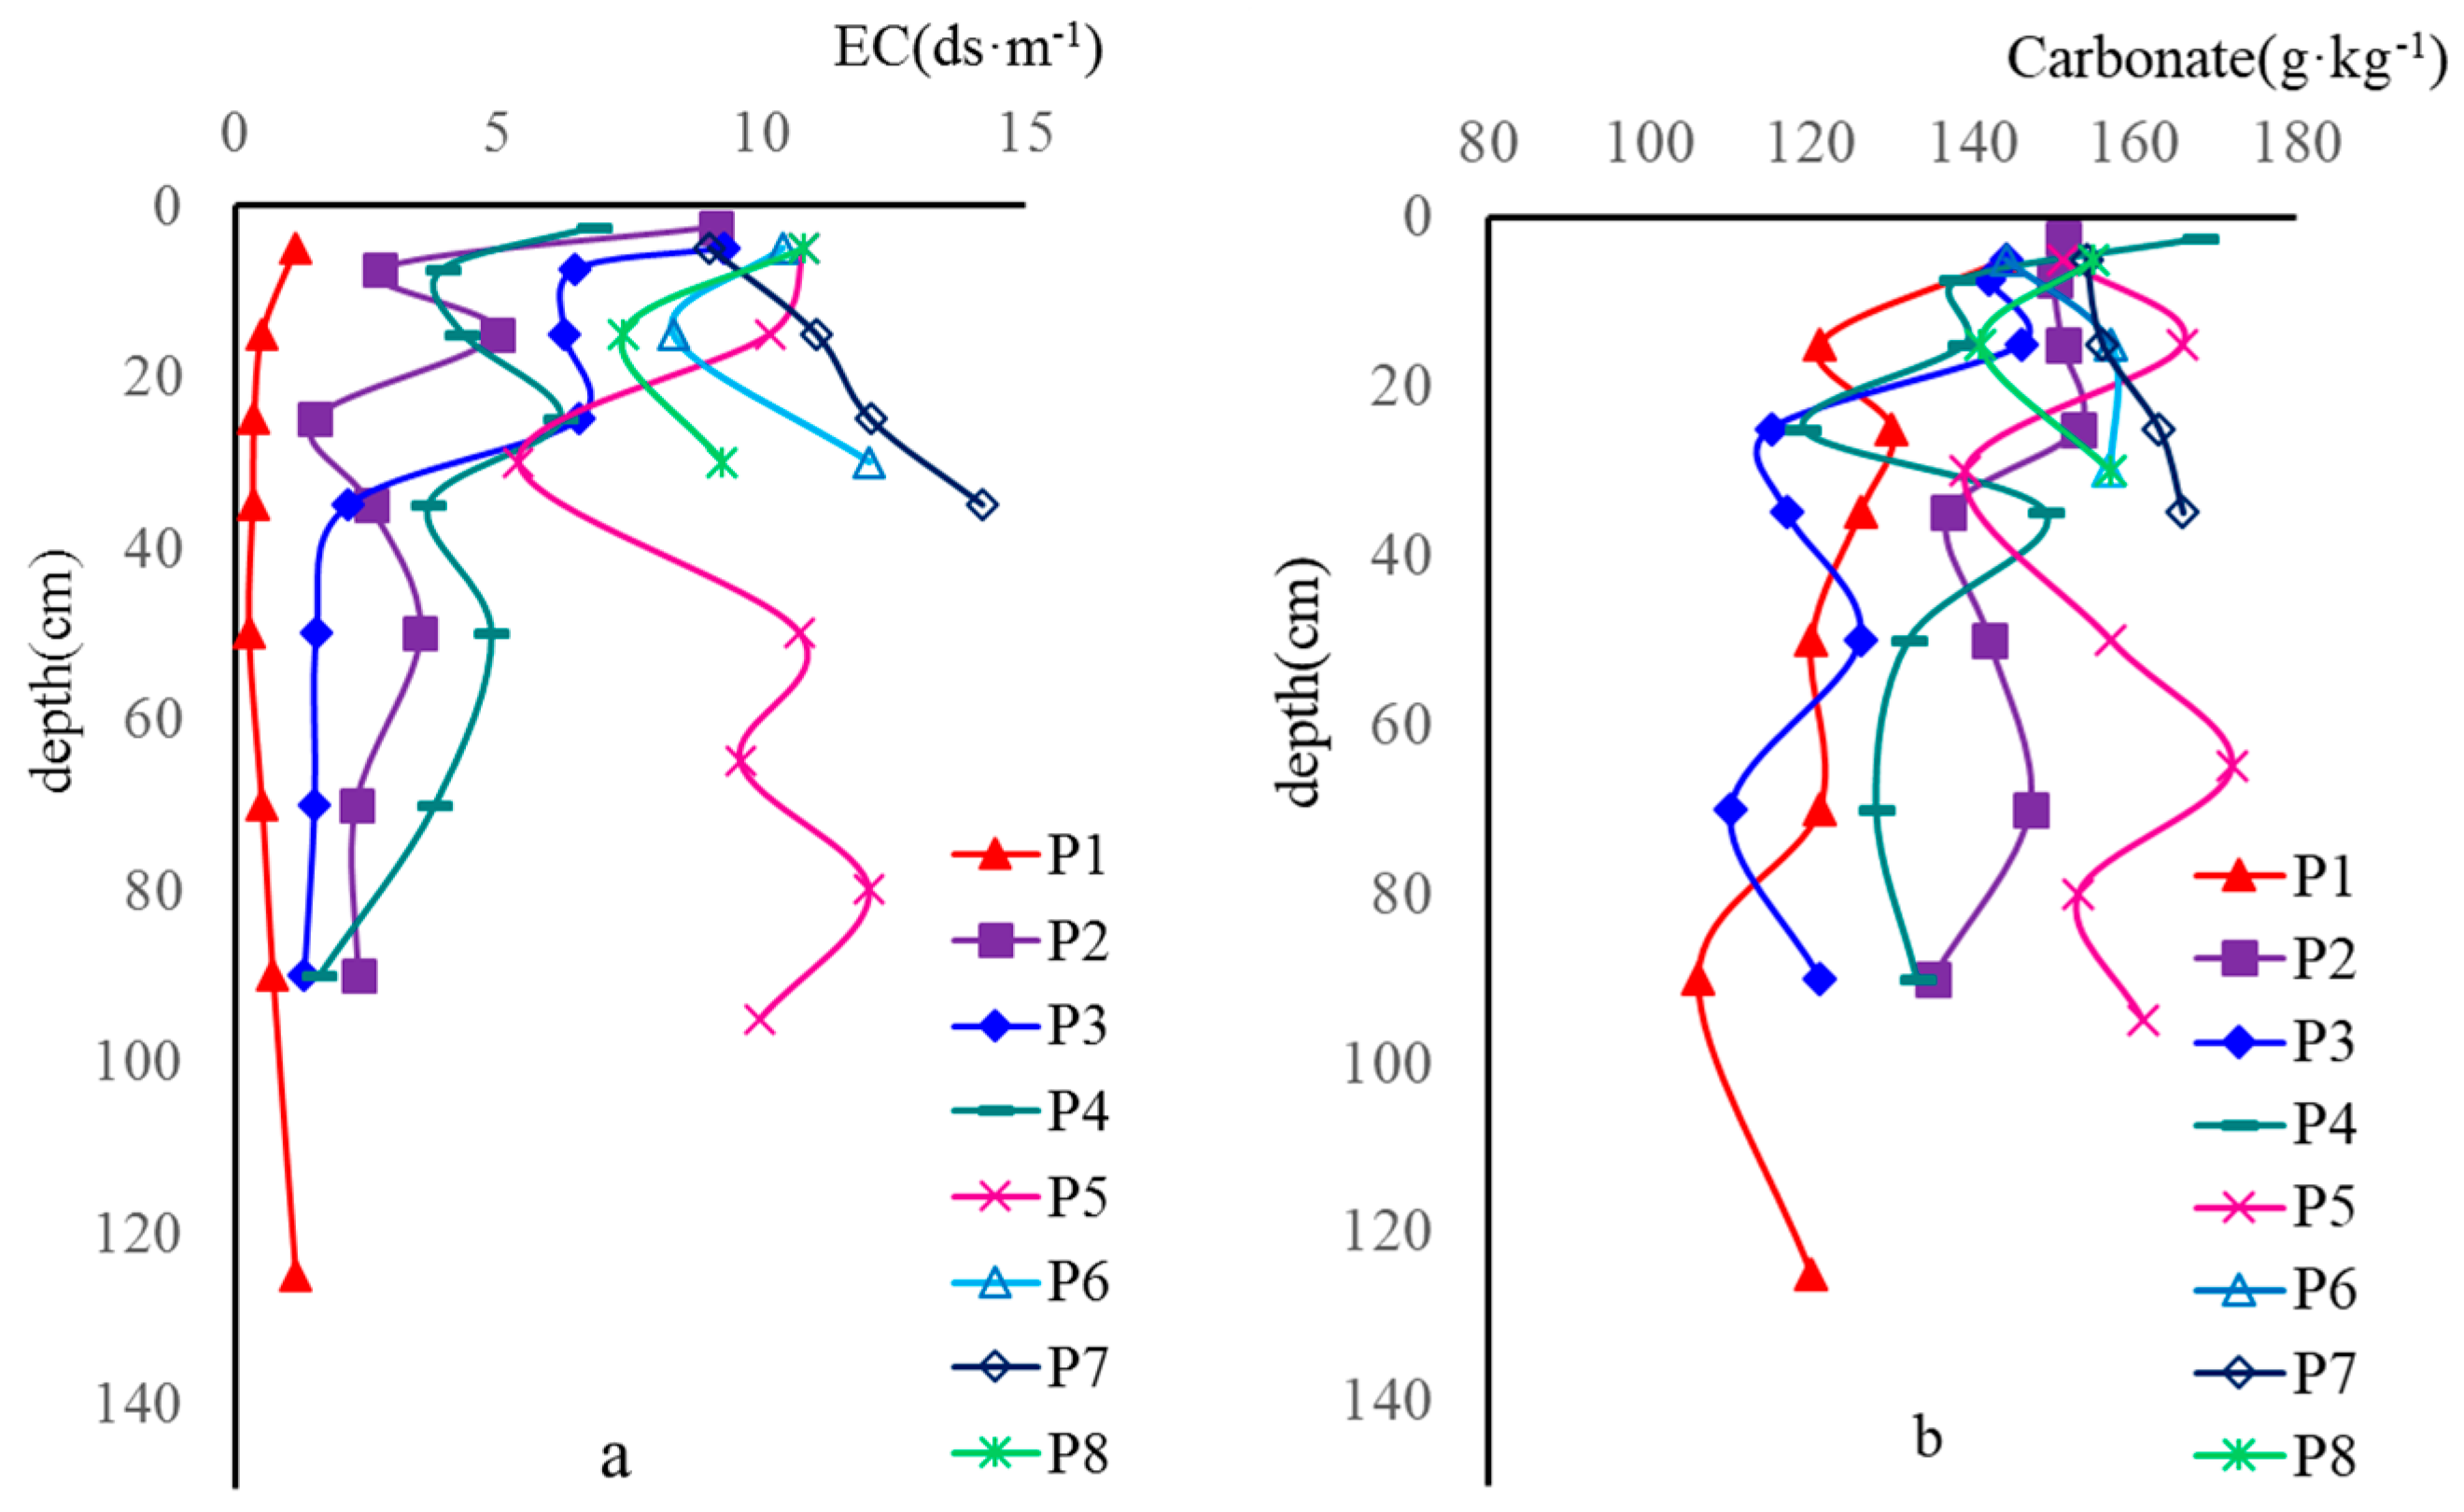
These soil profiles are somehow affected by salt in different degrees, except for P1, especially P5, P6, P7, and P8 with very high salt content (EC). The salt content (EC) is high in the surface soil of P2, P3, which rapidly decreases with increase depth as shown in Figure 4a. Due to the drought in the area, the leaching in soil is weak, where the carbonate content is high in the whole soil profile and is concentrated in the surface soil. The content of carbonate is around 106–172 g·kg−1. The content of carbonate is lower in P1 and P3 than that in other soil profiles as shown in Figure 4b. The high salt and carbonate content lead soil more alkaline, soil pH value in studied region is between 8.0 and 9.0.
3.2. Composition and Morphological Characteristics of Clay Minerals from Salinized Soils in Junggar Basin
All of the soil clay minerals in the salinized soils are analyzed by the X-ray diffraction (XRD). Take 40–60 cm soil layer of P1 for example, as shown in Figure 5. There is a wide and asymmetric 1.8 nm peak, accompanied by high background at low angles in a Mg-glycerol pattern, which indicates smectite crystals with poor crystallinity present in the soil. In all of the XRD patterns, the 1.0 nm peak is narrow and symmetrical and remains unchanged in different treatments, which indicates the existence of illite. The 1.4 nm peak in the Mg-glycerol pattern cannot be affected in K-25 °C and K-300 °C pattern. However, it slightly increases in the K-550 °C pattern, which implies that chlorite is contained in the sample. There is a weak peak between 1.0 and 1.4 nm in all curves, which correspond to the mixed–layer clay minerals illite/smectite and chlorite/smectite. The 0.71 nm peak in the Mg-glycerol pattern disappears at the K-550 °C. Meanwhile, a weak 0.472 nm peak indicates a small amount of kaolinite. Therefore, the main clay minerals in the soil include smectite, illite, chlorite, kaolinite, and subordinate mixed-layer clay minerals.
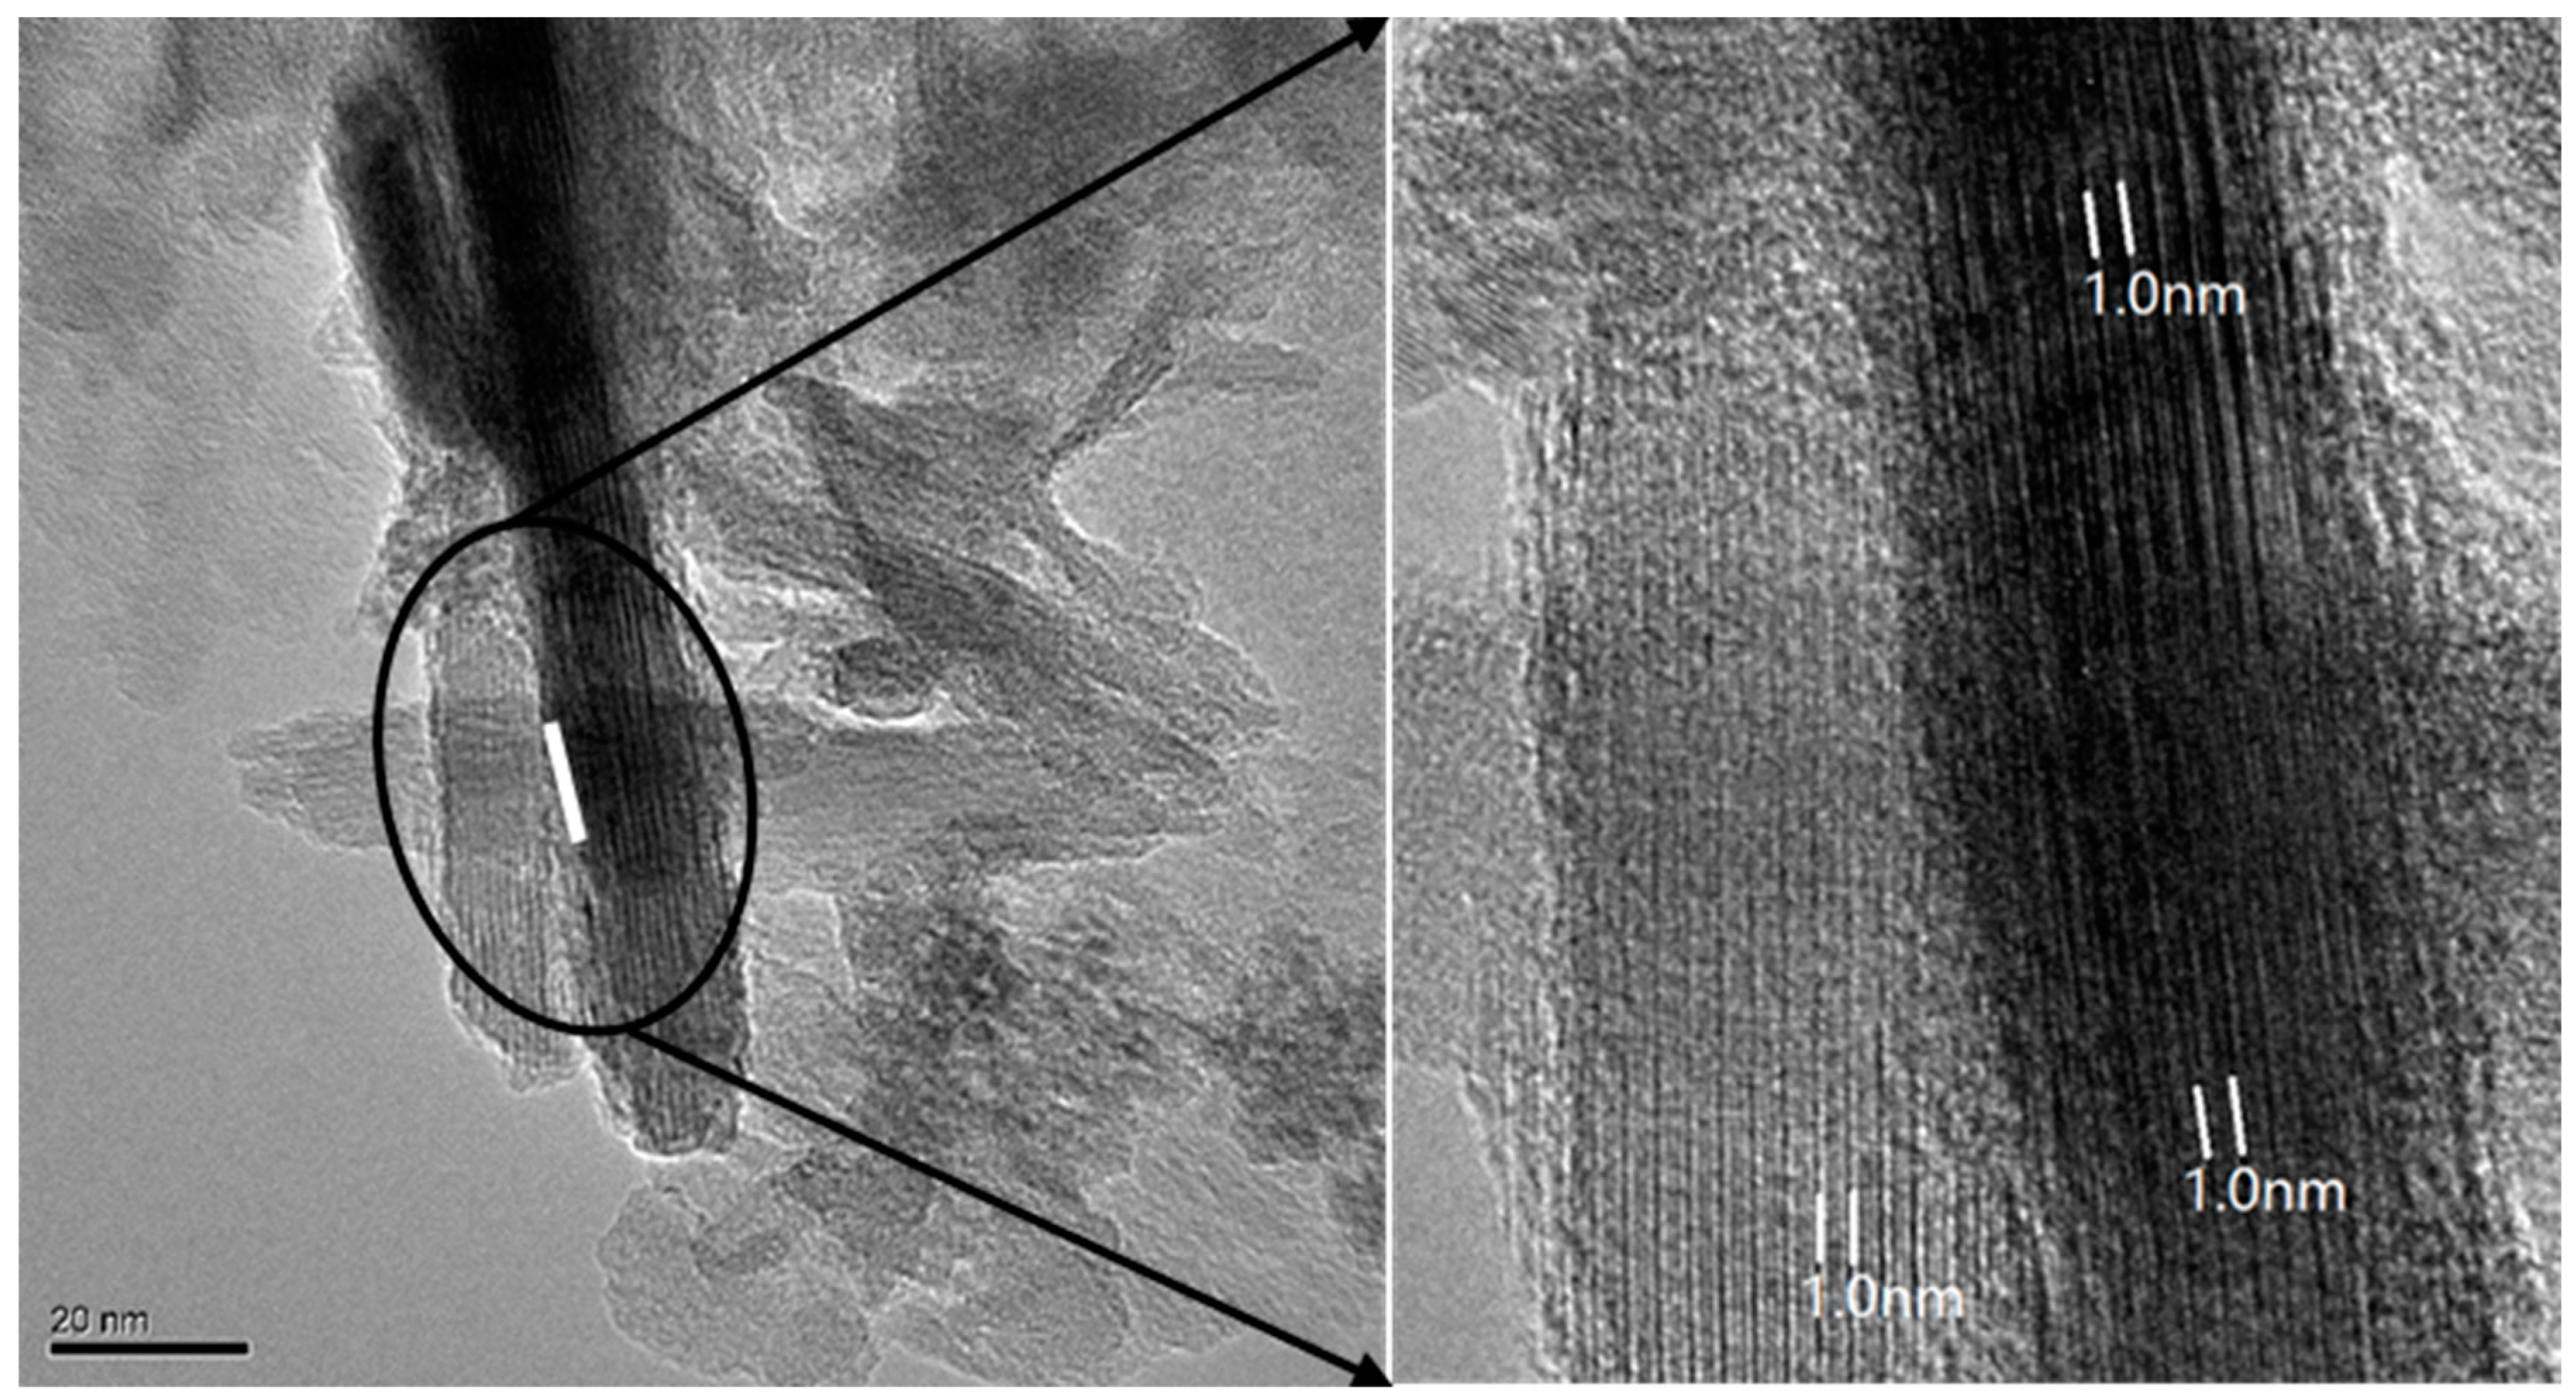
TEM images demonstrate that the 1.0 nm lattice fringes of illite are straight and without defect (Figure 6). There are discontinuous and interfingered 1.2 nm lattice fringes with a lack of parallelism (Figure 7A). This material was interpreted to be smectite [19,20]. TEM images also shows that 1.2 nm clay minerals with curved fringes grew at the edge of 1.0 nm illite (Figure 7B).
3.3. Distribution Characteristics of Smectite in Salinized Soil Profiles from Northern Xinjiang
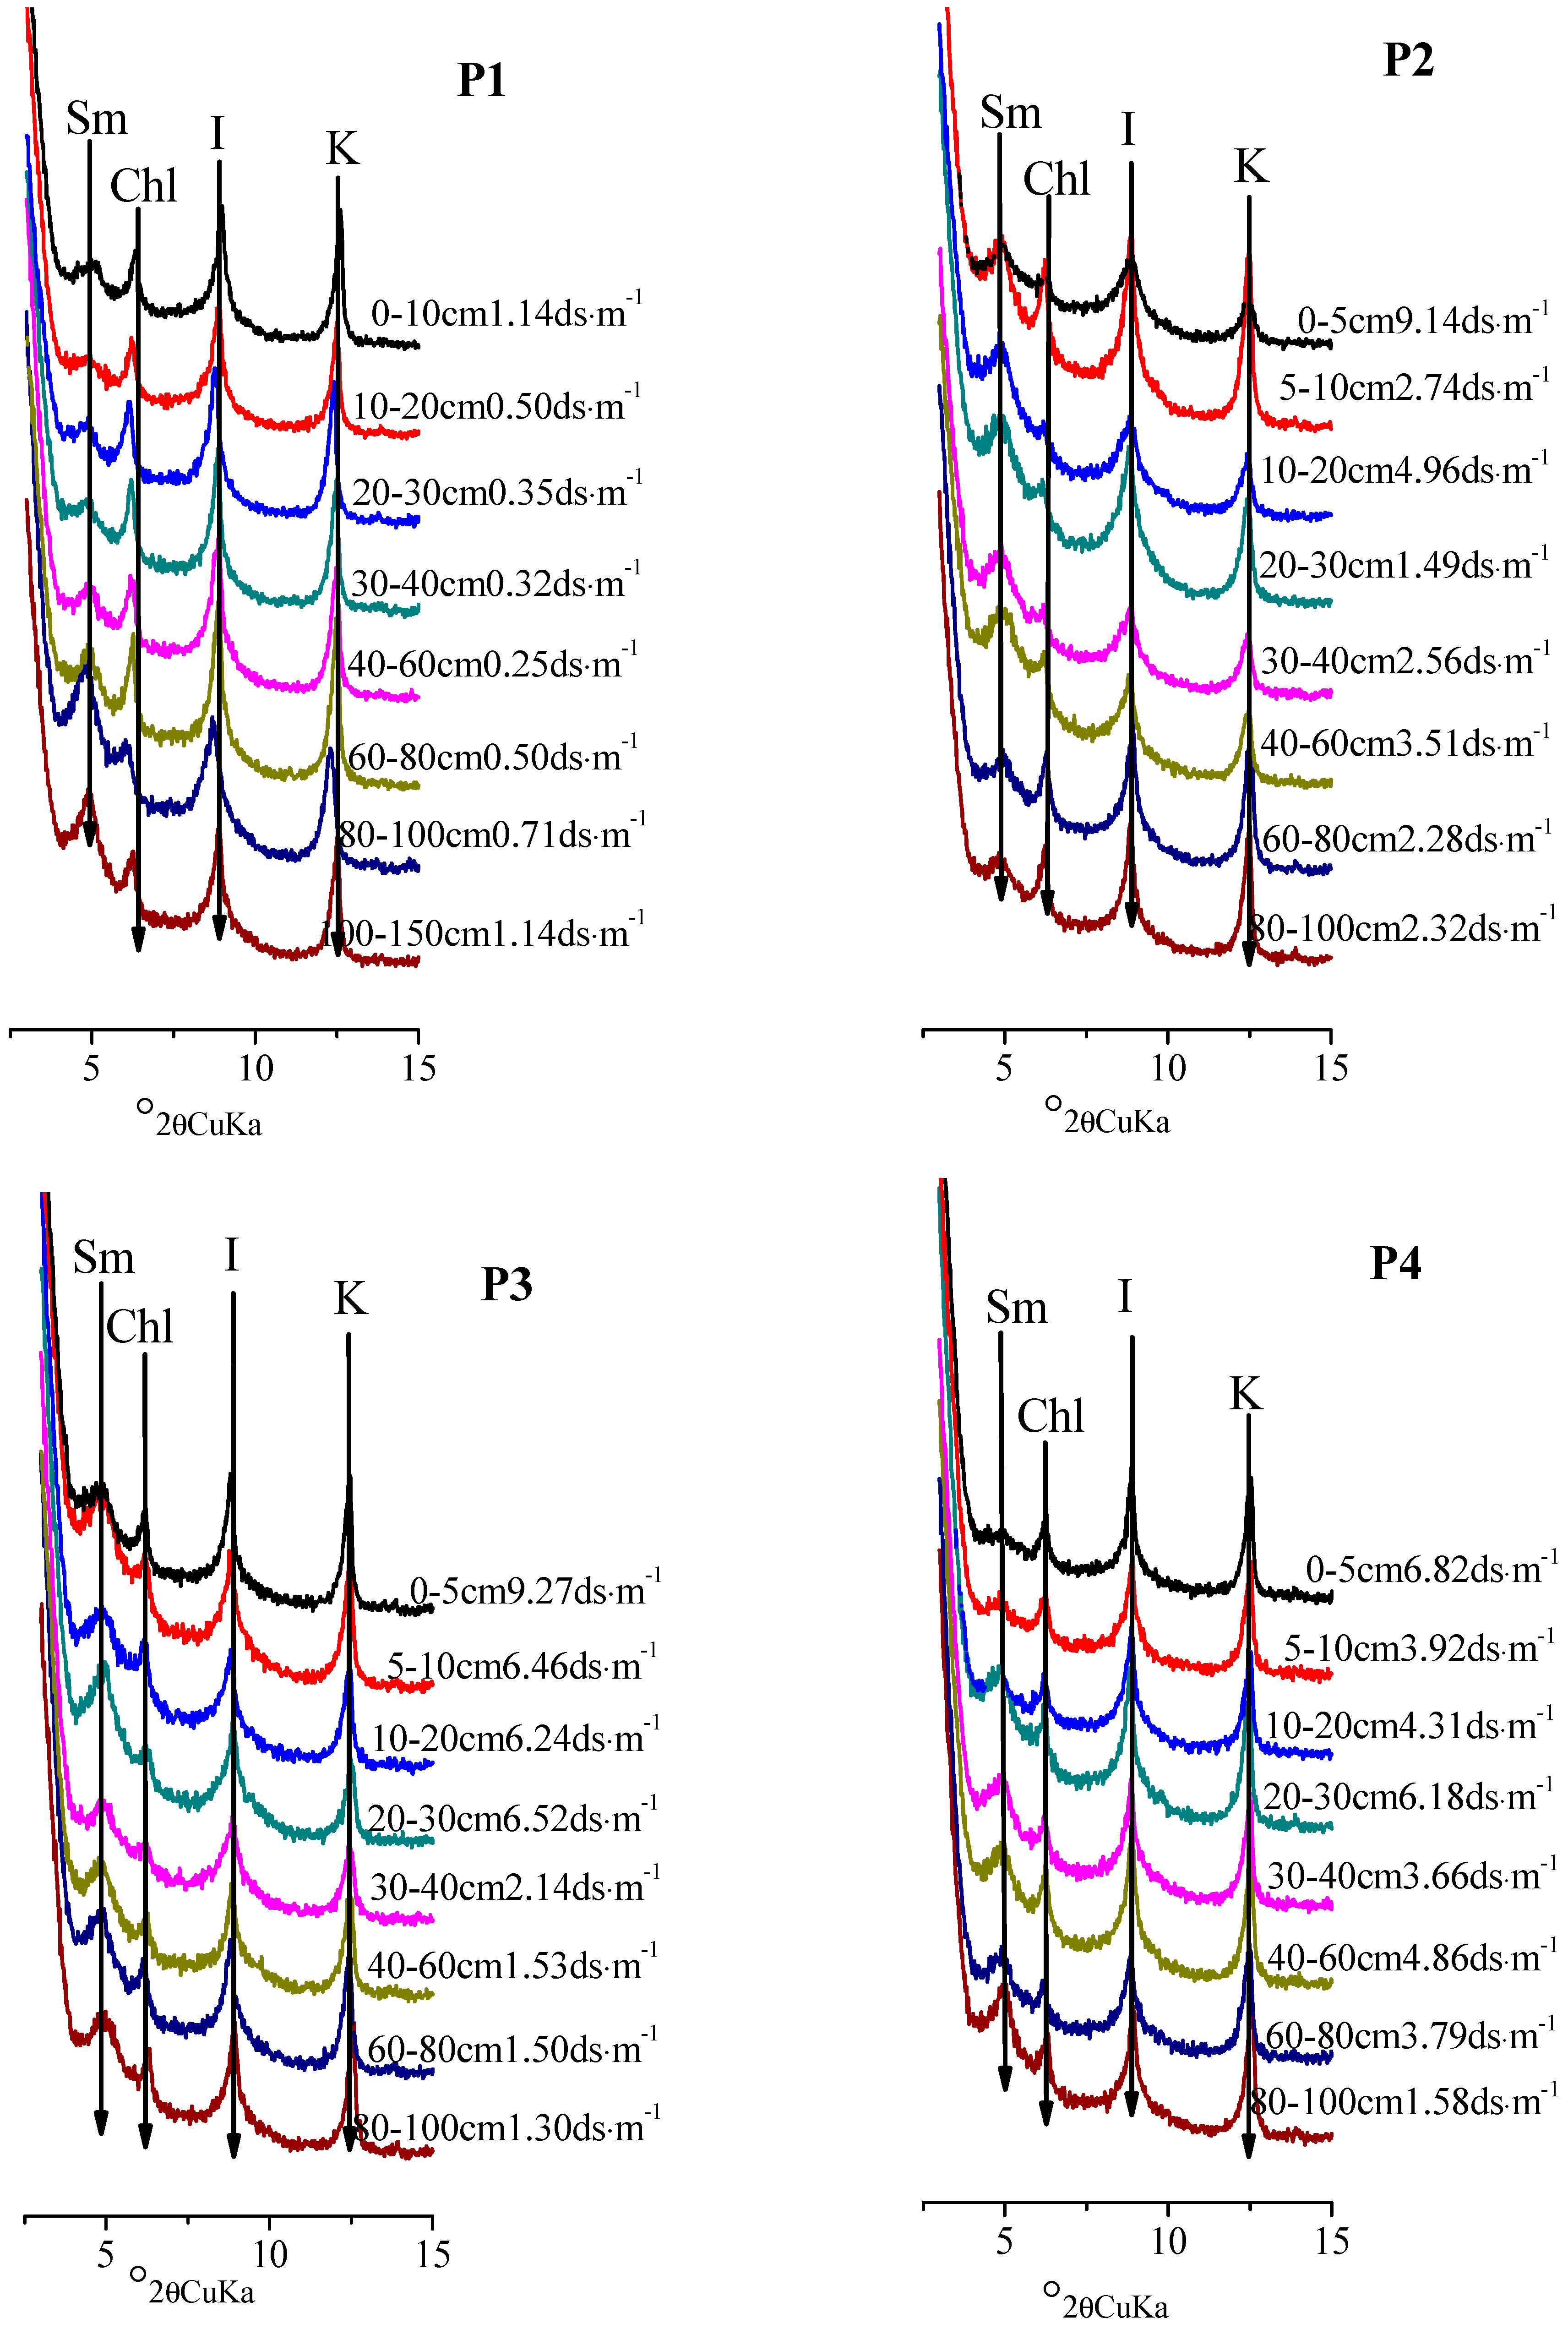
The 1.8 nm peaks of all samples are broad, and asymmetry peaks with high background at low angle (Figure 8) are present, which implies that the crystallinity of smectite in salinized soil is weak in Junggar Basin. For different soil layers of the same soil profile, it is noted that the diffraction peaks of smectite are all weak in the 0–10 cm soil layer. For example, the 0–10 cm soil layers in P1, P2, P3, and P7 have weaker diffraction peaks of smectite than the lower soil layers. The XRD patterns of soil clay minerals have no obvious 1.8nm peaks of the surface layer soil (0–10 cm) in P4, P5, P6, and P8. There are no obvious 1.8 nm peaks in XRD patterns of soil clay minerals in the surface layer soil (0–10 cm) of P4, P5, P6, and P8. For the lower soil layers (>10 cm) of the same soil profile, the smectite peak intensity in the XRD patterns is relatively strong when the salt content of soil layer is high, such as the 80–120 cm soil layer of P1, 10–40 cm soil layer of P2, 20–30 cm soil layer of P3, 40–60 cm soil layer of P5, 20–40 cm soil layer of P6.
The relative content of each mineral expressed as a percentage (%) are shown in Table 2. It is noted that the content of kaolinite in soil samples is only about 10%, whereas the content of chlorite is about 20%. There is no obvious change within different soil profiles and in different soil layers of the same soil profile. The content of illite in soil samples is about 33–71% and the content of smectite is less than 39%. The change of clay minerals content indicates that illite and smectite offset each other in all of the soil layers. Conversely, the content of illite decreases as the content of smectite increases. In the other soil profiles affected by high salt content, the content of smectite in the 0–10 cm soil layer is lower than that in subsoil. In P5, P6, and P8, there is almost no smectite in the 0–10 cm surface layer. For the soil layers below 10 cm, smectite content increases with the increase of salt content, such as the 10–20 cm soil layer of P2, the 20–30 cm layer in P3 in, the 70–90 cm layer in P5, the 20–40 cm layer in P6, and the 10–40 cm layer in P7 and P8.
3.4. Chemical Composition of Clay Minerals
In this study, P1 and P5 are chosen due to the differences of salt content and smectite content. By ICP-MS, the chemical composition of soil clay minerals can be determined. The results show that the clay minerals are mainly composed of SiO2 (44–72%), Al2O3 (15.94–42.30%), and Fe2O3 (7.54–9.44%) (Table 3). The contents of Al2O3, K2O, and CaO of soil clay minerals are obviously different in these two soil profiles. Soil profile 1 has high a content of Al2O3 and K2O, 21.02–42.30% and 1.33–2.23%, respectively. Soil profile 5 has lower contents of Al2O3 and K2O, 15.94–35.13% and 0.59–1.38%, respectively.
3.5. The δ13C and δ18O Contents in Soil Secondary Carbonates and the δ13C Values of Soil Organic Matter
In the literature, the carbon isotopes of soil organic carbon, the carbon and oxygen isotopes of soil secondary carbonates, and the hydrogen and oxygen isotopes of soil clay minerals are used to interpret the climate and plant information of soil formation [21,22,23,24,25,26]. Then, the soil development, the landscape history of soils, and the paleoclimatic and paleoenvironmental changes during soil formation should be studied.
The carbon and oxygen isotopic composition of soil carbonate depends on local climate and vegetation types, so it can be used as an indication of paleoclimate and paleovegetation types. The Junggar Basin is located in the hinterland of the Eurasian continent, and its soil is rich in secondary carbonates (Figure 4b), which supplies favorable conditions to study paleoclimatic and paleoenvironmental characteristics during soil formation. In this study, the δ13C and δ18O contents of soil secondary carbonates are measured (Table 4). The δ18O values of the secondary carbonate in the 0–10 cm and 10–20 cm soil layers are −9.44‰ and −9.24‰, respectively. The δ18O value in the deeper soil carbonate is reduced, which indicates that δ18O is rich in the carbonate of the 0–20 cm soil layer. Once H218O is enriched in the carbonate of the soil, which shows that the water evaporation becomes strong and the drought index increases. Thus, it can be concluded that the climate was more a drought during formation of 0–10 cm soil layer of P5.
Soil carbon isotope is controlled by vegetation ecological changes. There are two types of photosynthesis C3 and C4 among terrestrial higher plants. C3 and C4 plants have no similar δ13C values, with average values of −27‰ and −13‰, respectively. The δ13C value of soil carbonate is from −9‰ to −13‰ in the C3 plant-growing environment, while it is from 1‰ to 3‰ in the C4 plant-growing environment. In P5, the δ13C values of soil organic matter and secondary carbonate are negative and have significant changes in different soil layers. The δ13C values of organic matter is decreased from −16.3‰ to −22.1‰. The δ13C values of secondary carbonate are also decreased from −1.45‰ to −5.0‰. According to the δ13C values of the soil organic matter and the secondary carbonates, the symbiosis of the C3 and C4 plants can be determined in studied region. However, the δ13C of secondary carbonate and organic matter in 0–20 cm soil layers is larger than deeper soil layers, which shows that the vegetation types are mainly C4 plants in period of formation of 0–20 cm soil layer. C4 plants are more resistant to drought, which mainly grow in extremely arid environments. It can be determined that the climate is relatively dry in period of formation of 0–20 cm soil layer. Lin et al. studied the sediment composition and sporopollen assemblage; Sun et al. used the pollen data to study the climate change in the sampling area. Their results also testified that Junggar Basin in Xinjiang can be mainly characterized by a warm, dry climate since 3.0–2.5 ka BP [27,28,29].
4. Discussions
There are some reports about the formation of smectite in the saline-alkaline soil environment. It is noted that the sources of smectite in the salinized soil include: (1) soluble silica and alumina, which may combine with soluble bases to form smectite [2], (2) residual enrichment from parental material [30], and (3) illite transform into smectite [9,31]. In the study region, Wang et al. confirmed that the parent rock is composed mostly of illite, so smectite is not residual enrichment from parental material [32].
Smectite contents in the salt-affected soil profiles (P5, P6, P7, P8) are higher than that in the none-saline soil profile (P1). To further analyze the relationship of illite content and smectite, the significant negative correlation (r = 0.79, n = 50, p < 0.01) (Figure 9a) suggests that illite might transform into smectite in the salt-affected soils. Soil profile 5 has lower content of Al2O3 and K2O than P1 (Table 3). The contents of Al2O3 and K2O decrease in clay minerals under the salinization condition, which also show that there existed conversion of smectite from illite [4].
The peak intensity of smectite in the 0–10 cm soil layer of soil profile is lower than that in deeper soil layers. The content of smectite in the surface soil of salinized soil profile is low or next to nothing. Similar study results have been reported in the literature with different interpretations for this phenomenon. Arshad et al. reported that the low content of smectite of the surface soil is the result of preferential translocation [9,33,34]. However, the study area is located in the arid region under the climatic conditions of low rainfall and high evaporation. The accumulation of carbonate and salt in the surface soil (Figure 4) indicates that there is no leaching condition of substance. Furthermore, there is no regular increase of clay particle effects under the soil surface. Thus, the extremely low content of smectite in the soil surface cannot be explained by the downward shift of clay due to be leached. It is noted that the lower soil layers of all soil profiles have high pH in this study. The content of smectite increases with the increase of salt content. This phenomenon can refute the argument that an environmental condition with high alkali and high salt can cause the smectite to be deformed or degraded so that the content of smectite is reduced in surface soil [10,11]. Wakindiki et al. believed the soils containing smectite have a weaker resistance to the impact of raindrops [35]. Levy and Watt confirmed the chemical dispersion of smectite due to sodicity is also an important factor in determining infiltration in smectitic soils [36]. Thus, the decrease of smectite in 0–10 cm soil layer can be attributed to water erosion processes and are probably also susceptible to chemical dispersion of smectite in high soil pH values of the study region.
Transformation processes of illite into smectite requires K+ to be leached, which is closely related to climate condition during pedogenic processes and to soil moisture distribution in the different soil layers of soil profiles. In the study region, the δ13C and δ18O contents in soil secondary carbonates and δ13C of organic matter in soils show that the soil formation period of the 0–10 cm soil layer was more arid than that in the deeper soil formation stage. Due to the dry climate during the formation of the surface soil, the water condition is not conducive to K+ leaching in illite, which influences transformation of illite and causes little or no smectite in the surface soil. By contrast, in the soil formation period of the deeper part of soil, C3 and C4 plants coexist with the moist climate relative to the surface, which causes more smectite to be formed in deeper soil layers. Thus, from the time scale of soil forming, the dry climate during the formation period of the soil surface would cause low smectite content at the soil surface soil. From the spatial scale of the vertical distribution of soil profiles, the study area is in an arid climate zone with strong soil evaporation. The water content in surface soil is lower than that of the deeper part of the soil. With the increase of soil depth, soil moisture increases in the deeper soil, which also provides suitable water conditions for K+ leaching in illite [31]. Therefore, the relatively humid water condition in the deeper part of the soil in the study area is favorable for the formation of smectite.
The results of correlation analysis (r = 0.64, n = 39, p < 0.01) (Figure 9b) between the soil salt content (EC) and smectite content indicates that the salt content of the deeper salinized soil layers contributes to the formation of smectite. As we now know, the charge in smectite was generally satisfied in geologic systems by Na+, Ca2+ and K+ on the interlayer sites and in contrast, the layer charge in illite is more negative with interlayer sites that are nearly all occupied by K+ [37]. Robert has demonstrated that illite can be easily converted to smectite based on laboratory experiments. The conversion process requires hydration cations, such as Na+, and Ca2+, to replace the interlayer K+ in the illite structure. The mineral interlayer can be increased from 1.0 nm to 1.2–1.4 nm to form smectite [38]. In general, the transformation illite into smectite requires depotassification, dealumination, and silication, which can be expressed by
Thus, low activity of K+ and Al3+ and high Si(OH)4 activity were essential requirements for this transformation. Velde and Church have also reported that the process of illite transformation into smectite were affected by pH and the high salt content in deeper zones at the Delaware salt marsh [39]. In the temperate zone, the transformation of smectite from illite depends on the local microenvironment. In particular, it requires the environment to provide Ca2+ and Na+ and other ions [4]. Besides, the environment with rich Mg2+ can also contribute to this transformation [6,7,40]. Soil solution of salinized soil contains a large amount of Ca2+ and Na+ with pH > 8.5. In this study, some of the soil samples are analyzed by the X-ray diffraction (XRD). There are the peaks of feldspar, including 0.636 nm, 0.402 nm, 0.385 nm, 0.375 nm, 0.366 nm, 0.347 nm, 0.323 nm as shown as Figure 10. The soil high pH value and high salt content of salinized soil profiles would promote dissolution of Si4+ perhaps from feldspar [2].
Moreover, there is a large amount of carbonate in soil, which can also provide much Mg2+ to smectite formation [41]. Higher contents of Mg and Si in the carbonate environment can contribute to the formation of smectite from illite [31]. Based on the element composition of soil clay minerals, the content of CaO and Na2O in clay minerals of P5 is higher than that of P1, which proves there is more of the content of CaO and Na2O in clay minerals of salinized soils. In P1 with low salt content, the content of K2O is high in the element composition of the clay minerals. In salinized soil, the soluble salt base ions Ca2+ and Na+ in the soil solution go into the illite lattice to form smectite with non-parallel lattice fringes, as shown in Figure 7. Thus, salinized soils in the Junggar Basin, Xinjiang, possess necessary conditions for the transformation of illite into smectite.
5. Conclusions
In the salinized soil of Junggar Basin of Xinjiang, China, there is transformation of illite into smectite. The soil environment with high pH value (>8.5), content of salt, and carbonate provides beneficial conditions for this transformation. Nevertheless, transformation of illite into smectite is very weak in the 0–10 cm soil layer of salinized soil. The reason is that the 0–10 cm soil layer does not have the water condition for K+ leaching from illite. Thus, the salinized soil below 10 cm would have the necessary water conditions and chemical components for illite transformation into smectite.
Author Contributions
W.T. and H.X. conceived and designed the experiments; S.H. performed the experiments; H.X. and C.H. analyzed the data; H.X. wrote this paper and W.T. corrected it.
Acknowledgments
This work was supported by Natural Science Foundation of China (allotment grant numbers 41361051) The authors thank Guo Y. for the STEM/EDS observation, Yan Y. P. for the ICP-MS measurement, and especially to the Editor, and the anonymous reviewer for their insightful reviews, valuable comments and suggestions.
Conflicts of Interest
The authors declare no conflict of interest.
References
- Abtahi, A. Effect of a saline and alkaline ground water on soil genesis in semiarid southern Iran. Soil Sci. Soc. Am. J. 1977, 41, 583–588. [Google Scholar] [CrossRef]
- Mahjoory, R.A. The nature and genesis of some salt-affected soils in Iran. Soil Sci. Soc. Am. J. 1979, 43, 1019–1024. [Google Scholar] [CrossRef]
- Kapoor, B.S.; Singh, H.B.; Goswami, S.C.; Abrol, I.P. Weathering of micaceous minerals in some salt affected soils. J. Indian Soc. Soil Sci. 1981, 29, 486–492. [Google Scholar]
- Aoudjit, H.; Robert, M.; Elsass, F.; Curmi, P. Detailed study of smectite genesis in granitic saprolites by analytical electron microsopy. Clay Miner. 1995, 30, 135–147. [Google Scholar] [CrossRef]
- Wongpokhom, N.; Kheoruenromne, I.; Suddhiprakarn, A.; Gilkes, R.J. Micromorphological properties of salt affected soils in northeast Thailand. Geoderma 2008, 144, 158–170. [Google Scholar] [CrossRef]
- Furquim, S.A.C.; Graham, R.C.; Barbiero, L.; Queiroz Neto, J.P.; Vidal-Torrado, P. Soil mineral genesis and distribution in a saline lake landscape of the Pantanal wetland, Brazil. Geoderma 2010, 154, 518–528. [Google Scholar] [CrossRef]
- Furquim, S.A.C.; Barbiéro, L.; Graham, R.C. Neoformation of micas in soils surrounding an alkaline-saline lake of Pantanal wetland, Brazil. Geoderma 2010, 158, 331–342. [Google Scholar] [CrossRef]
- Abbaslou, H.; Abtahi, A. Origin and distribution of clay minerals in calcareous, gypsiferous, saline soils and sediments of Bakhtegan lake bank, southern Iran. Iran Agric. Res. 2007, 25, 71–86. [Google Scholar]
- Spiers, G.A.; Pawluk, S.; Dudas, M.J. Authigenic mineral formation by solodization. Can. J. Soil Sci. 1984, 64, 515–532. [Google Scholar] [CrossRef]
- Klages, M.G.; Southard, A.R. Weathering of montmorillonite during formation of a solodic soil and associated soils. Soil Sci. 1968, 106, 363–368. [Google Scholar] [CrossRef]
- Munn, L.C.; Boehm, M.M. Soil genesis in a Natrargid-Haplargid complex in northern Montana. Soil Sci. Soc. Am. J. 1983, 47, 1186–1192. [Google Scholar] [CrossRef]
- Tian, C.Y.; Zhou, H.F.; Liu, G.Q. The proposal on control of soil salinizing and agricultural sustaining development in 21′s century in Xinjiang. Arid Land Geogr. 2000, 23, 177–181. [Google Scholar]
- Wen, Z.W. Xinjiang Soil Geography; Science Press: Beijing, China, 1965. [Google Scholar]
- Lu, R.K. Soil Agricultural Chemical Analysis Method; China’s Agricultural Science and Technology Press: Beijing, China, 1999. [Google Scholar]
- Li, X.Y. Soil Chemistry and Experiment Instructor; China Agriculture Press: Beijing, China, 1997. [Google Scholar]
- Liu, Z.F.; Colin, C.; Huang, W.; Le, K.P.; Tong, S.Q.; Chen, Z.; Trentesaux, A. Climatic and tectonic controls on weathering in south China and the Indochina Peninsula: Clay mineralogical and geochemical investigations from the Pearl, Red, and Mekong drainage basins. Geochem. Geophys. Geosyst. 2007, 8, 1525–2027. [Google Scholar] [CrossRef]
- Wang, N.; Liu, W.G. Carbonate content and oxygen and carbon isotope composition of different grain size samples from the surface soil of arid land in northwest China. Arid Land Geogr. 2010, 33, 158–163. [Google Scholar]
- Sheng, X.F.; Chen, J.; Yang, J.D.; Ji, J.F. Carbon and oxygen isotopic composition of carbonate in different grain size fractions from losess-paleosol sequences, China. Geochemica 2002, 31, 105–112. [Google Scholar]
- Ahn, J.H.; Peacor, D.R. Illite/smectite from gulf coast shales: A reappraisal of transmission electron microscope images. Clay Clay Miner. 1989, 37, 542–546. [Google Scholar]
- Amouric, M.; Olives, J. Transformation mechanisms and interstratification in conversion of smectite to kaolinite: An HRTEM study. Clay Clay Miner. 1998, 46, 521–527. [Google Scholar] [CrossRef]
- Poage, M.A.; Chamberlain, C.P. Empirical relationships between elevation and the stable isotope composition of precipitation and surface waters: Considerations for studies of paleoelecation change. Am. J. Sci. 2001, 301, 1–15. [Google Scholar] [CrossRef]
- Liu, B.L.; Phillips, F.M.; Campbell, A.R. Stable carbon and oxygen isotopes of pedogenic carbonates, Ajo Mountains, southern Arizona: Implications for paleoenvironmental change. Palaeogeogr. Palaeoclimatol. Palaeoecol. 1996, 124, 233–246. [Google Scholar] [CrossRef]
- Wang, D.L.; Anderson, D.W. Stable carbon isotopes of carbonate pendants from Chernozemic soils of Saskatchewan, Canada. Geoderma 1998, 84, 309–322. [Google Scholar] [CrossRef]
- Yang, S.L.; Ding, Z.L.; Wang, X.; Tang, Z.H. Negative δ18O–δ13C relationship of pedogenic carbonate from northern China indicates a strong response of C3/C4 biomass to the seasonality of Asian monsoon precipitation. Palaeogeogr. Palaeoclimatol. Palaeoecol. 2012, 317–318, 32–40. [Google Scholar] [CrossRef]
- Peters, N.A.; Huntington, K.W.; Hoke, G.D. Hot or not? Impact of seasonally variable soil carbonate formation on paleotemperature and O-isotope records from clumped isotope thermometry. Earth Planet. Sci. Lett. 2013, 361, 208–218. [Google Scholar] [CrossRef]
- Levin, N.E.; Brown, F.H.; Behrensmeyer, A.K.; Bobe, R.; Cerling, T.E. Paleosol carbonates from the Omo group: Isotopic records of local and regional environmental change in east Africa. Palaeogeogr. Palaeoclimatol. Palaeoecol. 2011, 307, 75–89. [Google Scholar] [CrossRef]
- Shi, X.M.; Li, Y.L.; Yang, J.C. Climatic and tectonic analysis of Manas Lake changes. Sci. Geogr. Sin. 2008, 28, 266–271. [Google Scholar]
- Lin, R.F.; Wei, K.Q.; Cheng, Z.Y.; Wang, Z.X. A palaeoclimatic study on lacustrine cores from Manas Lake, Xinjiang, western China. Geochemica 1996, 25, 63–70. [Google Scholar]
- Sun, X.J.; Du, N.Q.; Weng, C.Y.; Lin, R.F. Paleovegetation and paleoenvironment of Manas Lake, Xinjiang, N. W. China during the last 14000 years. Quat. Sci. 1995, 3, 239–248. [Google Scholar]
- Singh, J.; Sawhney, J.S. Clay mineralogy of some salt-affected soils of south–west Punjab. J. Indian Soc. Soil Sci. 2006, 54, 461–464. [Google Scholar]
- Khormali, F.; Abtahi, A. Origin and distribution of clay minerals in calcareous arid and semi-arid soils of Fars Province, southern Iran. Clay Miner. 2003, 38, 511–527. [Google Scholar] [CrossRef]
- Zhang, L.Q.; Luo, X.R.; Liu, L.J.; He, D.F.; Xiang, B.L. Controls on clay mineral distribution in the Cenozoic sediments of the southern Junggar Basin, N.W. China. Chin. J. Geol. 2005, 40, 363–375. [Google Scholar]
- Proust, D.; Eymery, J.P.; Beaufort, D. Supergene vermiculitization of a mangnesan chlorite: Iron and magnesium removal processes. Clay Clay Miner. 1986, 34, 572–580. [Google Scholar] [CrossRef]
- Arshad, M.A.; Pawluk, S. Characteristics of some solonezic soils in the Glacial Lake Edmonton basin of Alberta II. Mineralogy. J. Soil Sci. 1966, 17, 48–55. [Google Scholar] [CrossRef]
- Omdi, F.E.; Daoudi, L.; Fagel, N. Origin and distribution of clay minerals of soils in semi-arid zones: Example of Ksob watershed (Western High Atlas, Morocco). Appl. Clay Sci. 2018, 163, 81–91. [Google Scholar] [CrossRef]
- Levy, G.J.; van der Watt, H.V. Effects of clay mineralogy and soil sodicity on soil infiltration rate. S. Afr. J. Plant Soil 1988, 52, 92–96. [Google Scholar] [CrossRef]
- Ransom, B.; Helgeson, H.C. Compositional and members and thermodynamic components of illite and dioctahedral aluminous smectite solid solutions. Clay Clay Miner. 1993, 41, 537–550. [Google Scholar] [CrossRef]
- Robert, M. The experimental transformation of mica toward smectite; relative importance of total charge and tetrahedral substitution. Clay Clay Miner. 1973, 21, 167–174. [Google Scholar] [CrossRef]
- Velde, B.; Church, T. Rapid clay transformations in Delaware salt marshes. Appl. Geochem. 1999, 14, 559–568. [Google Scholar] [CrossRef]
- Furquim, S.A.C.; Graham, R.C.; Barbiero, L. Mineralogy and genesis of smectites in an alkaline-saline environment of Pantanal wetland, Brazil. Clay Clay Miner. 2008, 56, 579–595. [Google Scholar] [CrossRef]
- Velde, B. Origin and Mineralogy of Clays: Clays and the Environment; Springer-Verlag: Heidelberg, Germany, 1995. [Google Scholar]
Figure 1.
(a) Geographical location of Shihezi, Xinjiang, China, (b) Soil sampling sites. In figure, L1–L8: eight soil sampling sites, R1—Yuejin reservoir, R2—Jiahezi reservoir, R3—Daquangou reservoir, R4—Moguhu reservoir, R5—Honghou reservoir, R6—Haiziwan reservoir, R7—Anjihai Reservoir.
Figure 1.
(a) Geographical location of Shihezi, Xinjiang, China, (b) Soil sampling sites. In figure, L1–L8: eight soil sampling sites, R1—Yuejin reservoir, R2—Jiahezi reservoir, R3—Daquangou reservoir, R4—Moguhu reservoir, R5—Honghou reservoir, R6—Haiziwan reservoir, R7—Anjihai Reservoir.

Figure 2.
Characteristics of soil salt landscape in soil sampling location of L1, L3, L4, L5, and L6 in Figure 1 and soil profile photo of P5.
Figure 2.
Characteristics of soil salt landscape in soil sampling location of L1, L3, L4, L5, and L6 in Figure 1 and soil profile photo of P5.

Figure 3.
White salt crystallization in the soil.

Figure 4.
Electrical conductivity and carbonate content in eight soil profiles (P1–P8).

Figure 5.
XRD spectra of clay minerals in soil samples (EC = 0.248 ds·cm−1).

Figure 6.
TEM images of slate-type illite in the salinized soil. I, illite.

Figure 7.
TEM images of clay minerals. (A) discontinuous and curving 1.2 nm lattice fringes, (B) 1.2 nm lattice fringes presents at the boundary of the 1.0 nm lattice fringes.
Figure 7.
TEM images of clay minerals. (A) discontinuous and curving 1.2 nm lattice fringes, (B) 1.2 nm lattice fringes presents at the boundary of the 1.0 nm lattice fringes.

Figure 8.
XRD patterns after Mg-glycerol solvation. Sm-smectite, Chl-chlorite, I-illite, and K-kaolinite.
Figure 8.
XRD patterns after Mg-glycerol solvation. Sm-smectite, Chl-chlorite, I-illite, and K-kaolinite.


Figure 9.
Correlations. (a) The correlation between smectite and illite, (b) the correlation between smectite and soil electrical conductivity.
Figure 9.
Correlations. (a) The correlation between smectite and illite, (b) the correlation between smectite and soil electrical conductivity.

Figure 10.
XRD patterns of soil sample.


Table 1.
Description of soil pedons studied in Shihezi, Xinjiang Autonomous region, China.
| Pedon | Elevation (m) | Parents Material | Characteristics of Soil Pedon | Agricultural Utilization |
|---|---|---|---|---|
| P1 | 387 | Diluvium | There is a small amount of white sulphate crystals on the surface of the soil as shown in Figure 2, S1, where no salt crystals are present in the lower soil layer. | This area has been used for planting beets and equipped with drip irrigation. |
| P2 | 298 | Alluvium | The surface soil is hard white sulphate crust, where there are a small amount of salt crystals in the lower soil layers. | Uncultivated land with few natural vegetation. |
| P3 | 290 | Alluvium | The soil surface is white sulphate crust, mixed with a small amount of yellow carbonate as shown in Figure 2, S3. There are white salt crystals in the upper part of the soil, where there are no obvious salt crystals in the lower part. | Uncultivated land with only a small amount of Salsola collina Pall. growing. |
| P4 | 250 | Alluvium | There are white thin sulphate crystals in soil surface as shown in Figure 2, S4. | Uncultivated land with a small amount of Tamarix chinensis and Alhagi sparsifolia growing. |
| P5 | 346 | Diluvium | There is thick white loose sulphate crust on the surface of the soil, without yellow salt crystals as shown in Figure 2, S5. | Uncultivated land with a small amount of Karelinia caspica growing. |
| P6 | 345 | Diluvium | There is thick white sulphate crust on the surface of the soil, mixed with a small amount of yellow salt crystals as shown in Figure 2, S6. There are a lot of salt crystals in the soil. | Uncultivated land with a small amount of Karelinia caspica growing. |
| P7 | 348 | Diluvium | There is thick white loose sulphate crust. | Uncultivated land with a small amount of Karelinia caspica growing. |
| P8 | 341 | Diluvium | There is thick white loose sulphate crust. There is a lot of salt crystals in the soil. | Uncultivated land with a small amount of Karelinia caspica growing. |
Table 2.
Clay mineral compositions in each soil layer of the salinized soil profiles (%).
| Pedon | Soil Layer (cm) | EC (ds·m−1) | Smectite | Illite | Kaolinite | Chlorite |
|---|---|---|---|---|---|---|
| P1 | 0–10 | 1.14 | 7 | 65 | 6 | 22 |
| 10–20 | 0.50 | 5 | 66 | 4 | 25 | |
| 20–30 | 0.35 | 8 | 62 | 4 | 26 | |
| 30–40 | 0.32 | 6 | 64 | 5 | 25 | |
| 40–60 | 0.25 | 8 | 65 | 3 | 24 | |
| 60–80 | 0.50 | 10 | 61 | 11 | 18 | |
| 80–100 | 0.71 | 24 | 50 | 2 | 24 | |
| 100–150 | 1.14 | 24 | 50 | 6 | 20 | |
| P2 | 0–5 | 9.14 | 6 | 69 | 6 | 19 |
| 5–10 | 2.74 | 13 | 60 | 8 | 19 | |
| 10–20 | 4.96 | 28 | 54 | 2 | 16 | |
| 20–30 | 1.49 | 16 | 60 | 3 | 21 | |
| 30–40 | 2.56 | 27 | 51 | 1 | 21 | |
| 40–60 | 3.51 | 26 | 51 | 3 | 20 | |
| 60–80 | 2.28 | 11 | 56 | 5 | 28 | |
| 80–100 | 2.32 | 8 | 57 | 8 | 27 | |
| P3 | 0–5 | 9.27 | 14 | 54 | 7 | 25 |
| 5–10 | 6.46 | 22 | 50 | 6 | 22 | |
| 10–20 | 6.24 | 22 | 49 | 5 | 24 | |
| 20–30 | 6.52 | 29 | 49 | 4 | 18 | |
| 30–40 | 2.14 | 14 | 60 | 6 | 20 | |
| 40–60 | 1.53 | 19 | 51 | 8 | 22 | |
| 60–80 | 1.50 | 18 | 52 | 9 | 21 | |
| 80–100 | 1.30 | 15 | 56 | 7 | 22 | |
| P4 | 0–5 | 6.82 | 3 | 61 | 6 | 30 |
| 5–10 | 3.92 | 4 | 60 | 11 | 25 | |
| 10–20 | 4.31 | 5 | 69 | 6 | 20 | |
| 20–30 | 6.18 | 13 | 58 | 9 | 20 | |
| 30–40 | 3.66 | 17 | 53 | 8 | 22 | |
| 40–60 | 4.86 | 13 | 59 | 5 | 23 | |
| 60–80 | 3.79 | 14 | 50 | 8 | 28 | |
| 80–100 | 1.58 | 19 | 53 | 6 | 22 | |
| P5 | 0–10 | 10.80 | 0 | 57 | 5 | 38 |
| 10–20 | 10.16 | 0 | 55 | 2 | 43 | |
| 20–30 | 9.59 | 17 | 48 | 7 | 28 | |
| 30–40 | 9.97 | 23 | 42 | 6 | 29 | |
| 40–60 | 12.04 | 34 | 36 | 5 | 25 | |
| 60–80 | 10.73 | 17 | 42 | 9 | 32 | |
| 80–100 | 5.38 | 18 | 48 | 7 | 27 | |
| 100–150 | 4.99 | 13 | 56 | 8 | 23 | |
| P6 | 0–10 | 10.40 | 0 | 71 | 4 | 25 |
| 10–20 | 8.31 | 24 | 40 | 6 | 30 | |
| 20–40 | 12.05 | 39 | 33 | 8 | 20 | |
| P7 | 0–10 | 9.00 | 15 | 49 | 9 | 27 |
| 10–20 | 11.03 | 33 | 40 | 8 | 19 | |
| 20–30 | 12.07 | 24 | 39 | 6 | 31 | |
| 30–40 | 14.20 | 28 | 38 | 7 | 27 | |
| P8 | 0–10 | 10.80 | 0 | 50 | 8 | 42 |
| 10–20 | 7.35 | 24 | 37 | 7 | 32 | |
| 20–40 | 9.26 | 23 | 39 | 6 | 32 |
Table 3.
The chemical composition of soil clay minerals (%).
| Pedons | Soil Layer | SiO2 | Fe2O3 | Al2O3 | MgO | CaO | Na2O | K2O | TiO2 | MnO | P2O5 |
|---|---|---|---|---|---|---|---|---|---|---|---|
| 1 | 0–10 | 51 | 8.62 | 35.08 | 0.74 | 0.27 | 1.11 | 2.00 | 0.73 | 0.08 | 0.09 |
| 10–20 | 55 | 8.70 | 31.14 | 0.73 | 0.27 | 1.08 | 2.02 | 0.71 | 0.08 | 0.11 | |
| 20–30 | 51 | 8.81 | 34.71 | 0.83 | 0.26 | 1.10 | 2.13 | 0.73 | 0.08 | 0.13 | |
| 30–40 | 44 | 8.51 | 42.30 | 0.97 | 0.28 | 1.10 | 2.23 | 0.73 | 0.08 | 0.10 | |
| 40–60 | 48 | 8.48 | 38.30 | 0.80 | 0.24 | 1.06 | 2.10 | 0.75 | 0.07 | 0.09 | |
| 60–80 | 65 | 9.44 | 21.02 | 0.21 | 0.30 | 1.08 | 1.54 | 0.75 | 0.09 | 0.10 | |
| 80–100 | 66 | 8.51 | 21.23 | 0.23 | 0.28 | 1.05 | 1.35 | 0.75 | 0.08 | 0.09 | |
| 100–150 | 66 | 8.55 | 21.50 | 0.24 | 0.24 | 1.00 | 1.33 | 0.74 | 0.07 | 0.10 | |
| 5 | 0–10 | 53 | 7.93 | 35.13 | 0.11 | 0.42 | 1.22 | 1.38 | 0.75 | 0.07 | 0.08 |
| 10–20 | 58 | 8.33 | 29.84 | 0.35 | 0.40 | 1.12 | 0.59 | 0.78 | 0.08 | 0.08 | |
| 20–30 | 70 | 7.97 | 18.68 | 0.10 | 0.23 | 0.96 | 0.89 | 0.68 | 0.06 | 0.11 | |
| 30–40 | 65 | 7.59 | 22.79 | 0.34 | 0.48 | 1.22 | 1.26 | 0.65 | 0.06 | 0.09 | |
| 40–60 | 69 | 7.97 | 19.38 | 0.26 | 0.34 | 1.06 | 1.24 | 0.72 | 0.07 | 0.08 | |
| 60–80 | 70 | 7.54 | 18.76 | 0.28 | 0.40 | 0.95 | 1.08 | 0.67 | 0.06 | 0.08 | |
| 80–100 | 70 | 7.84 | 18.45 | 0.21 | 0.46 | 1.09 | 1.07 | 0.71 | 0.07 | 0.08 | |
| 100–150 | 72 | 7.99 | 15.94 | 0.20 | 0.28 | 0.95 | 1.20 | 0.72 | 0.06 | 0.07 |
Table 4.
The Carbon Isotopic in Organic Matter and Carbonate Isotopic Composition.
| Profile | Soil Layer | Organic Matter | CaCO3 | |
|---|---|---|---|---|
| δ13C (‰, VPDB) | δ18O (‰) | δ13C (‰, VPDB) | ||
| P5 | 0–10 | −17.6 | −9.44 | −1.53 |
| 10–20 | −20.3 | −9.54 | −1.76 | |
| 20–30 | −19.8 | −10.56 | −1.80 | |
| 30–40 | −20.6 | −10.31 | −3.13 | |
| 40–60 | −21.6 | −11.04 | −3.73 | |
| 60–80 | −21.4 | −10.32 | −3.19 | |
| 80–100 | −22.1 | −9.67 | −3.48 | |
| 100–150 | −21.2 | −10.17 | −5.00 | |
© 2019 by the authors. Licensee MDPI, Basel, Switzerland. This article is an open access article distributed under the terms and conditions of the Creative Commons Attribution (CC BY) license (http://creativecommons.org/licenses/by/4.0/).
Share and Cite
MDPI and ACS Style
Xie, H.; He, S.; Huang, C.; Tan, W. Origin of Smectite in Salinized Soil of Junggar Basin in Xinjiang of China. Minerals 2019, 9, 100. https://doi.org/10.3390/min9020100
AMA Style
Xie H, He S, Huang C, Tan W. Origin of Smectite in Salinized Soil of Junggar Basin in Xinjiang of China. Minerals. 2019; 9(2):100. https://doi.org/10.3390/min9020100
Chicago/Turabian StyleXie, Haixia, Shuai He, Chuanqin Huang, and Wenfeng Tan. 2019. "Origin of Smectite in Salinized Soil of Junggar Basin in Xinjiang of China" Minerals 9, no. 2: 100. https://doi.org/10.3390/min9020100
Note that from the first issue of 2016, this journal uses article numbers instead of page numbers. See further details here.