Ore Genesis at the Jinchang Gold–Copper Deposit in Heilongjiang Province, Northeastern China: Evidence from Geology, Fluid Inclusions, and H–O–S Isotopes


1
College of Earth Sciences, Jilin University, Changchun 130061, China
2
College of Geology and Mining Engineering, Xinjiang University, Urumqi 830047, China
*
Author to whom correspondence should be addressed.
Minerals 2019, 9(2), 99; https://doi.org/10.3390/min9020099
Submission received: 18 December 2018
/
Revised: 5 February 2019
/
Accepted: 8 February 2019
/
Published: 10 February 2019
(This article belongs to the Special Issue Fluid Inclusion Characteristic of the Gold Deposits and Its Implication for Ore Genesis)
Abstract
:The Jinchang gold–copper deposit is located in Eastern Heilongjiang Province, Northeastern China. The orebody comprises primarily hydrothermal breccias, quartz veins, and disseminated ores within granite, diorite, and granodiorite. Three paragenetic stages are identified: early quartz–pyrite–arsenopyrite (Stage 1), quartz–pyrite–chalcopyrite (Stage 2), and late quartz–pyrite–galena–sphalerite (Stage 3). Gold was deposited during all three stages and Stage 1 was the major gold-producing stage. Copper is associated with the mineralization but has low economic value. Fluid inclusions (FIs) within the deposit are liquid-rich aqueous, vapor-rich aqueous, and daughter-mineral-bearing types. Microthermometric data for the FIs reveal decreasing homogenization temperatures (Th) and salinities of the ore-forming fluids over time. The Th for Stages 1–3 of the mineralization are 421–479, 363–408, and 296–347 °C, respectively. Stage 1 fluids in vapor-rich and daughter-mineral-bearing inclusions have salinities of 5.7–8.7 and 49.8–54.4 wt% NaCl equivalent, respectively. Stage 2 fluids in vapor-rich, liquid-rich, and daughter-mineral-bearing inclusions have salinities of 1.2–5.4, 9.5–16.0, and 43.3–48.3 wt% NaCl, respectively. Stage 3 fluids in liquid-rich and daughter-mineral-bearing inclusions have salinities of 7.9–12.6 and 38.3–42.0 wt% NaCl equivalent, respectively. The estimated trapping pressures are 160–220 bar, corresponding to an entrapment depth of 1.6–1.2 km in the paleo-water table. Oxygen and hydrogen isotope data (δ18OV-SMOW = 8.6‰ to 11.4‰; δDV-SMOW = −92.2‰ to −72.1‰) suggest that the ore-forming fluids were derived from magmatic fluids during the early stages of mineralization and subsequently incorporated meteoric water during the late stages. The sulfide minerals have δ34SVCDT values of 0.2‰–3.5‰, suggesting that the sulfur has a magmatic origin. The Jinchang deposit is a typical gold-rich gold–copper porphyry deposit.
1. Introduction
Most metallic ore deposits are associated with hydrothermal fluids. The genesis of the deposits is closely related to the temperature, pressure, and composition of the hydrothermal fluid. Different types of deposits form in different geological environments, and their fluid inclusion (FI) characteristics also differ [1,2,3]. Therefore, FIs can be used to identify the deposit type. For example, most orogenic gold deposits contain low-salinity H2O–CO2 inclusions [4], whereas porphyry copper deposits are characterized by high-salinity daughter-mineral-bearing and vapor-rich inclusions [5]. Epithermal deposits are typically characterized by low-salinity aqueous inclusions [6,7], but the FIs of Mississippi Valley-type deposits are generally higher in salinity, do not contain daughter minerals, and belong to the H2O–NaCl–CaCl2 system [8]. FI analysis is one of the main approaches used to identify the geochemical properties of ore-forming fluids and determine the physical and chemical conditions of hydrothermal deposit formation.
The Jinchang gold–copper deposit, located in Heilongjiang Province, Northeastern China, was first identified in the 1990s. Ongoing exploration has provided 96,725 m of drill core from >200 holes and led to the development of 6339 m of underground tunnels. The results of this exploration indicate that the deposit represents an 80.4 t gold resource with a grade of 8 g/t Au, and a 4683 t copper resource with a grade of 1.44% Cu. Previous studies of this deposit have focused on its geological features, alteration, geochemistry, FI systematics, and geochronology [9,10,11,12]. However, the fluids of the different mineralization stages have not been investigated in detail, and the genesis of the deposit remains controversial. The deposit has been variously described as a crypto-explosion breccia deposit [13], a medium- to high-temperature magmatic–hydrothermal deposit [14], a low- to medium-temperature magmatic–hydrothermal deposit [15], a porphyry deposit [16], and an orogenic gold deposit [17]. Additional data are required to better characterize the mineralizing fluids and understand the processes of ore deposition.
In this study, detailed field observations were used to select representative quartz and sulfide minerals from the ore veins for analysis. FI petrography and microthermometry were used to determine the phase ratios, compositions, and trapping temperatures of the ore-forming fluids. New H–O–S isotope data enable the investigation of the source of the mineralizing fluids and ore materials, which allows us to propose a model for the formation of the Jinchang deposit.
2. Geological Background
2.1. Geological Setting
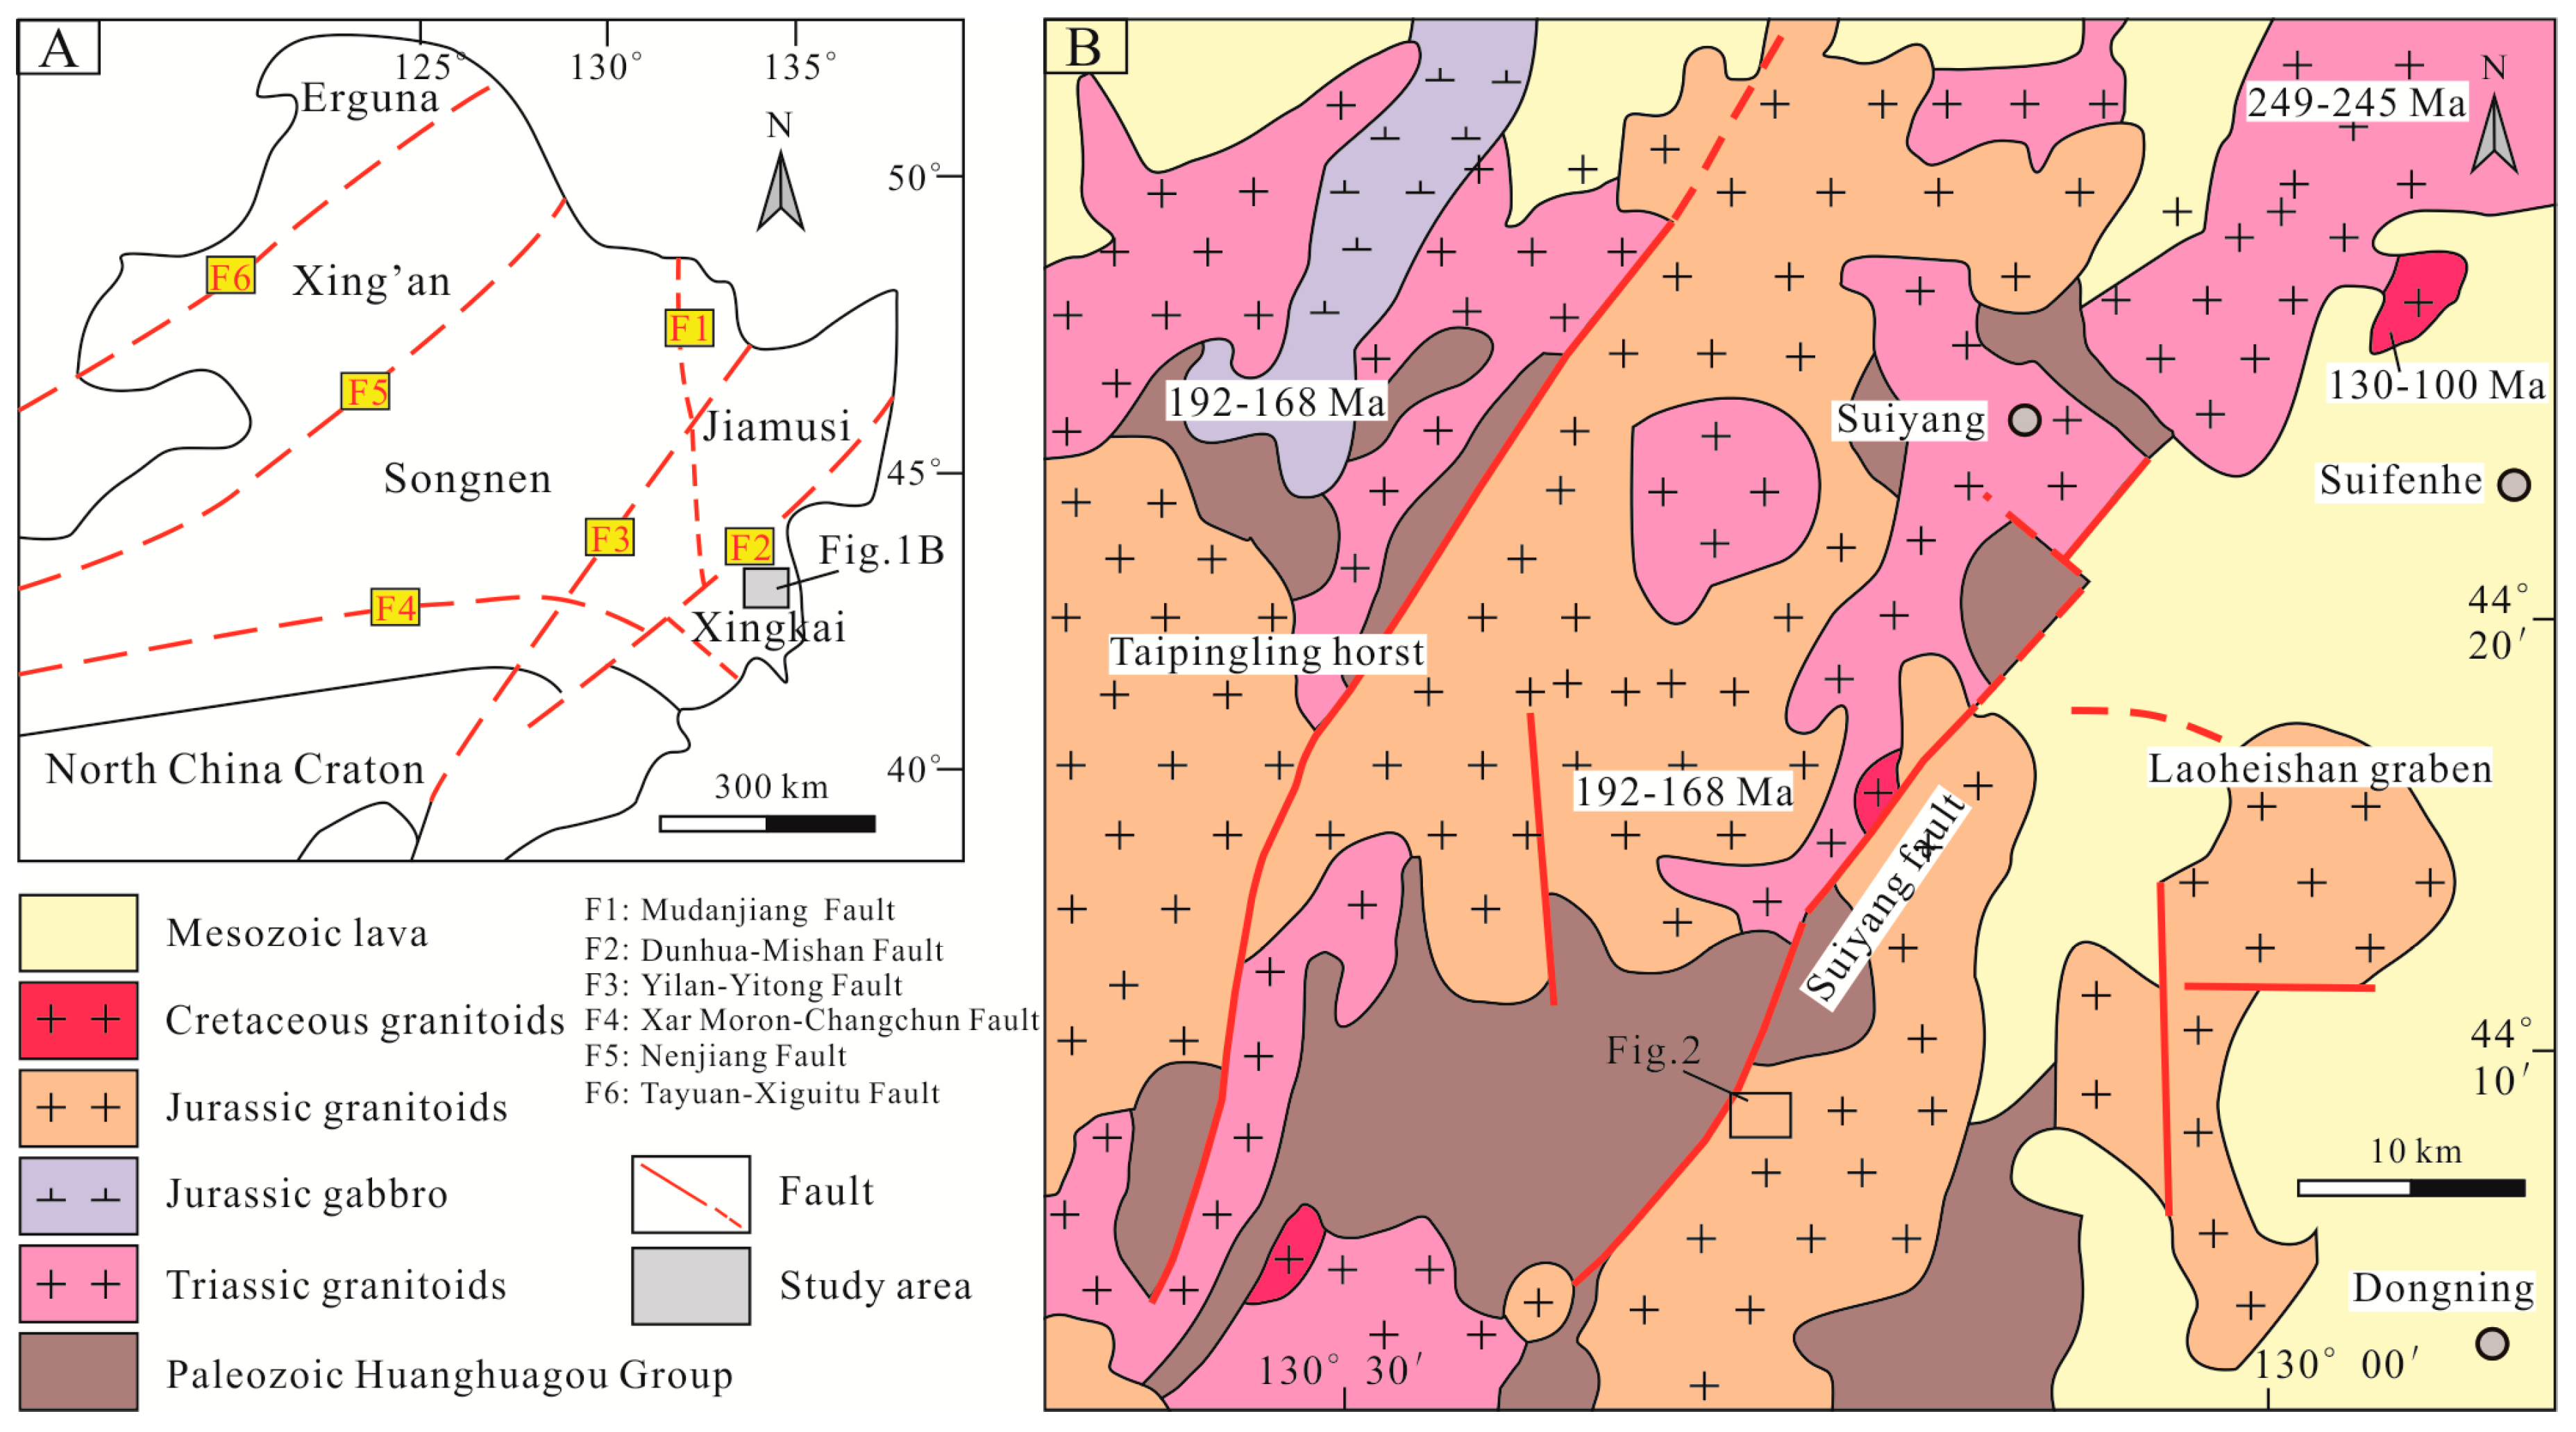
The study area is located in northeast China at the boundary between the Siberian and North China cratons. Northeast China forms the eastern section of a Phanerozoic accretionary orogen known as the Central Asian Orogenic Belt. From west to east, Northeast China can be further separated into the Erguna, Xing’an, Songnen, and Jiamusi–Xingkai blocks (Figure 1A). The Jinchang district is within the Xingkai Block, which abuts against the eastern margin of the Songnen Block to the south of the Jiamusi Block [18]. The region records the prolonged tectonomagmatic evolution of the Paleo-Asian Ocean during the Paleozoic, and the subsequent Mesozoic subduction of the paleo-Pacific Plate [19].
The mineralization district is located at the boundary between the Laoheishan graben and Taipingling horst, which are separated by the NNE–SSW-trending transcurrent Suiyang Fault (Figure 1B) [9,19,20]. The main fault groups trend NE–SW, NW–SE, and E–W. Intrusive rocks in this region comprise granodiorite, monzogranite, syenogranite, and alkali feldspar granite, with minor diorite and gabbro. Zircon laser ablation–inductively coupled plasma–mass spectrometry (LA-ICP-MS) U–Pb data [21,22] suggest that these rocks were emplaced in three discrete pulses: Early Triassic (249–245 Ma), Jurassic (192–168 Ma), and Early Cretaceous (130–100 Ma). The Paleozoic Huangsong Group, which consists mainly of mica schist, gneiss, amphibolite, marble, and Mesozoic volcanic and volcaniclastic rocks (the Tianqiaoling and Tuntianying formations), crops out amongst the Mesozoic granitoids.
2.2. Ore Deposit Geology
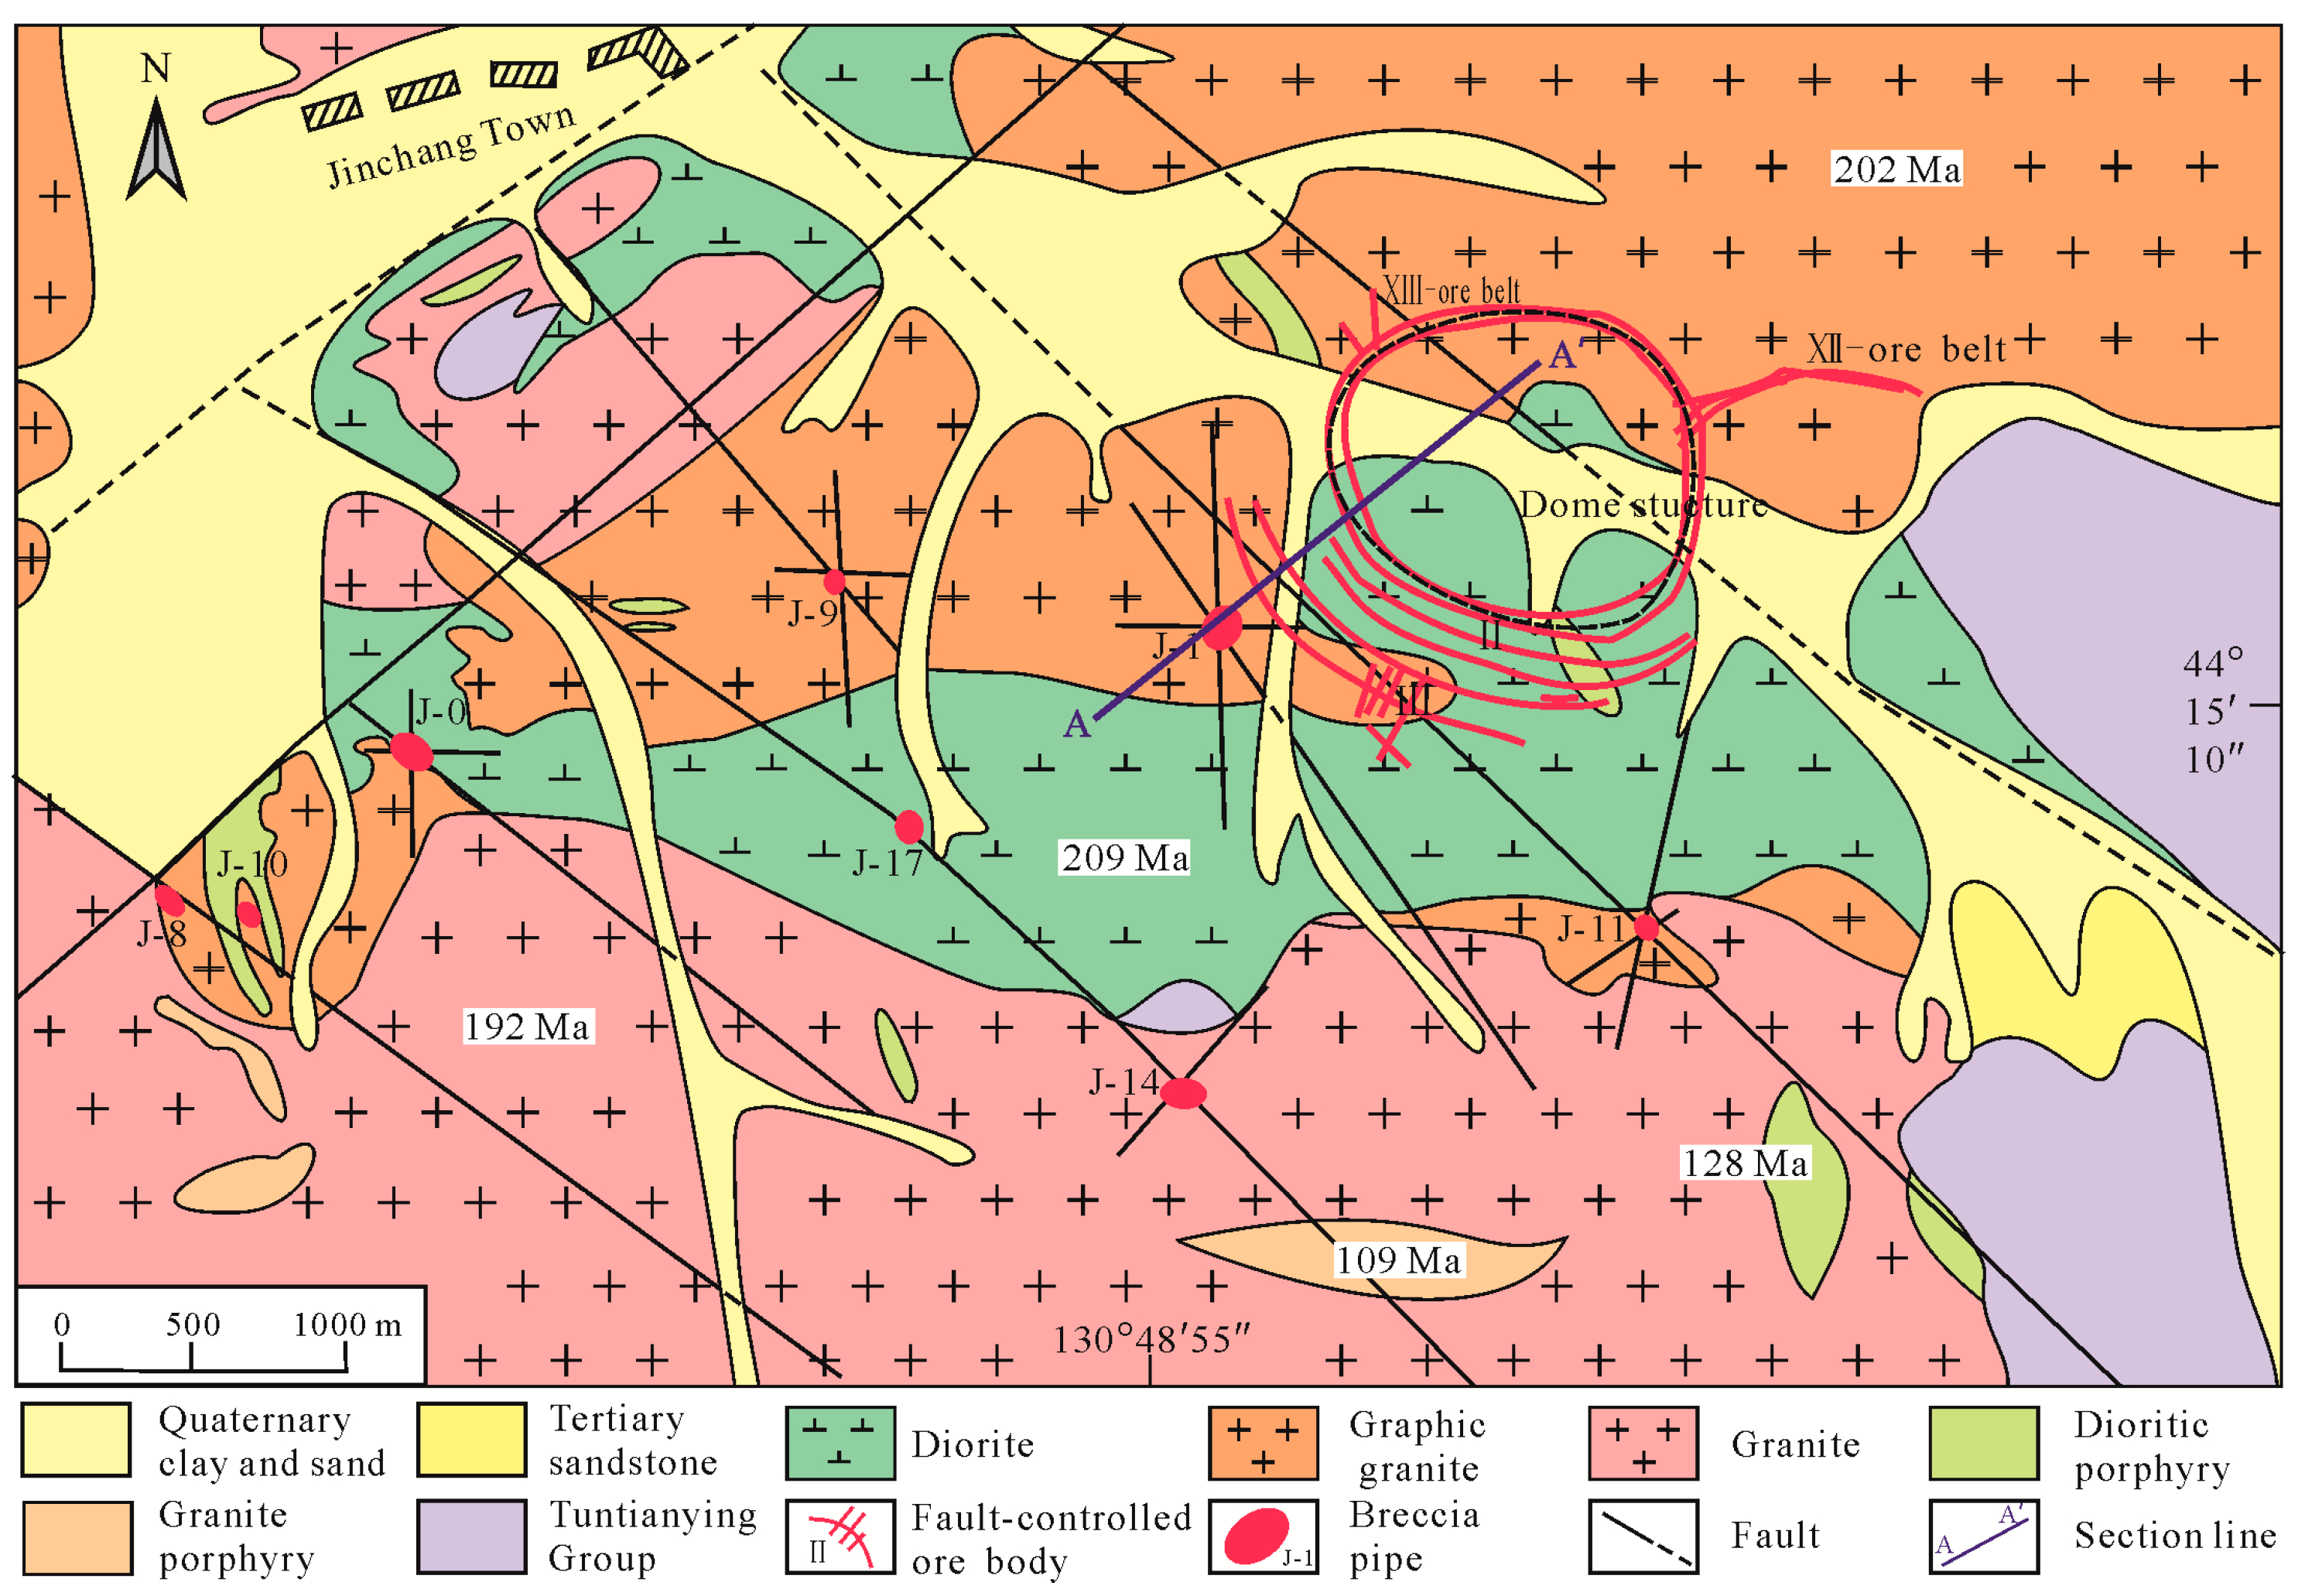
The strata exposed in the mining area are the Middle–Upper Jurassic Tuntianying Group. The lithologies include andesite, basaltic andesite, andesitic porphyry, and tuff, which are mainly restricted to the southeastern parts of the mineralized domain (Figure 2).
The dominant structures are NW–SE- and NE–SW-trending faults, along with secondary E–W- and N–S-trending faults. The intersections of these early structures provided fluid transportation channels that led to brecciation. Ring fractures, radial fractures, and dome structures (Figure 2), all caused by magma intrusion (granodiorite) concealed in the central part of the ore field, control the spatial distribution of the vein-type orebodies.
Tectonomagmatism occurred frequently from the late Indosinian to late Yanshanian, and the resulting igneous rocks formed during six stages. The oldest of these rocks is a large diorite stock in the middle of the deposit, which yields a U–Pb age of 209 ± 1.4 Ma [23]. A separate graphic granite stock with a U–Pb age of 202.1 ± 3.0 Ma [24] is situated in the northern part of the deposit. The largest of the intrusions, an Early Jurassic granite stock in the southern part of the deposit, has a U–Pb age of 192.1 ± 5.8 Ma [25]. Dioritic porphyry dikes that yield a U–Pb age of 127.9 ± 2.6 Ma [26] and granite porphyry dikes that have a U–Pb age of 109 ± 2.4 Ma [27] are scattered throughout the ore field. A concealed granodiorite stock beneath ring and radial fractures has a U–Pb age of 106.8 ± 2.0 Ma [28].
2.3. Mineralization Characteristics
There are three types of orebody in the Jinchang mine (Figure 2): breccia-hosted ore (No. J-0, J-1, J-8, J-9, J-10, J-11, J-14, and J-17 pipes), ring/radial-fault-controlled veins (No. II, III, VII, and VIII vein swarms), and disseminated ore (No. 18 orebody), which account for 41%, 39%, and 20% of total gold production, respectively.
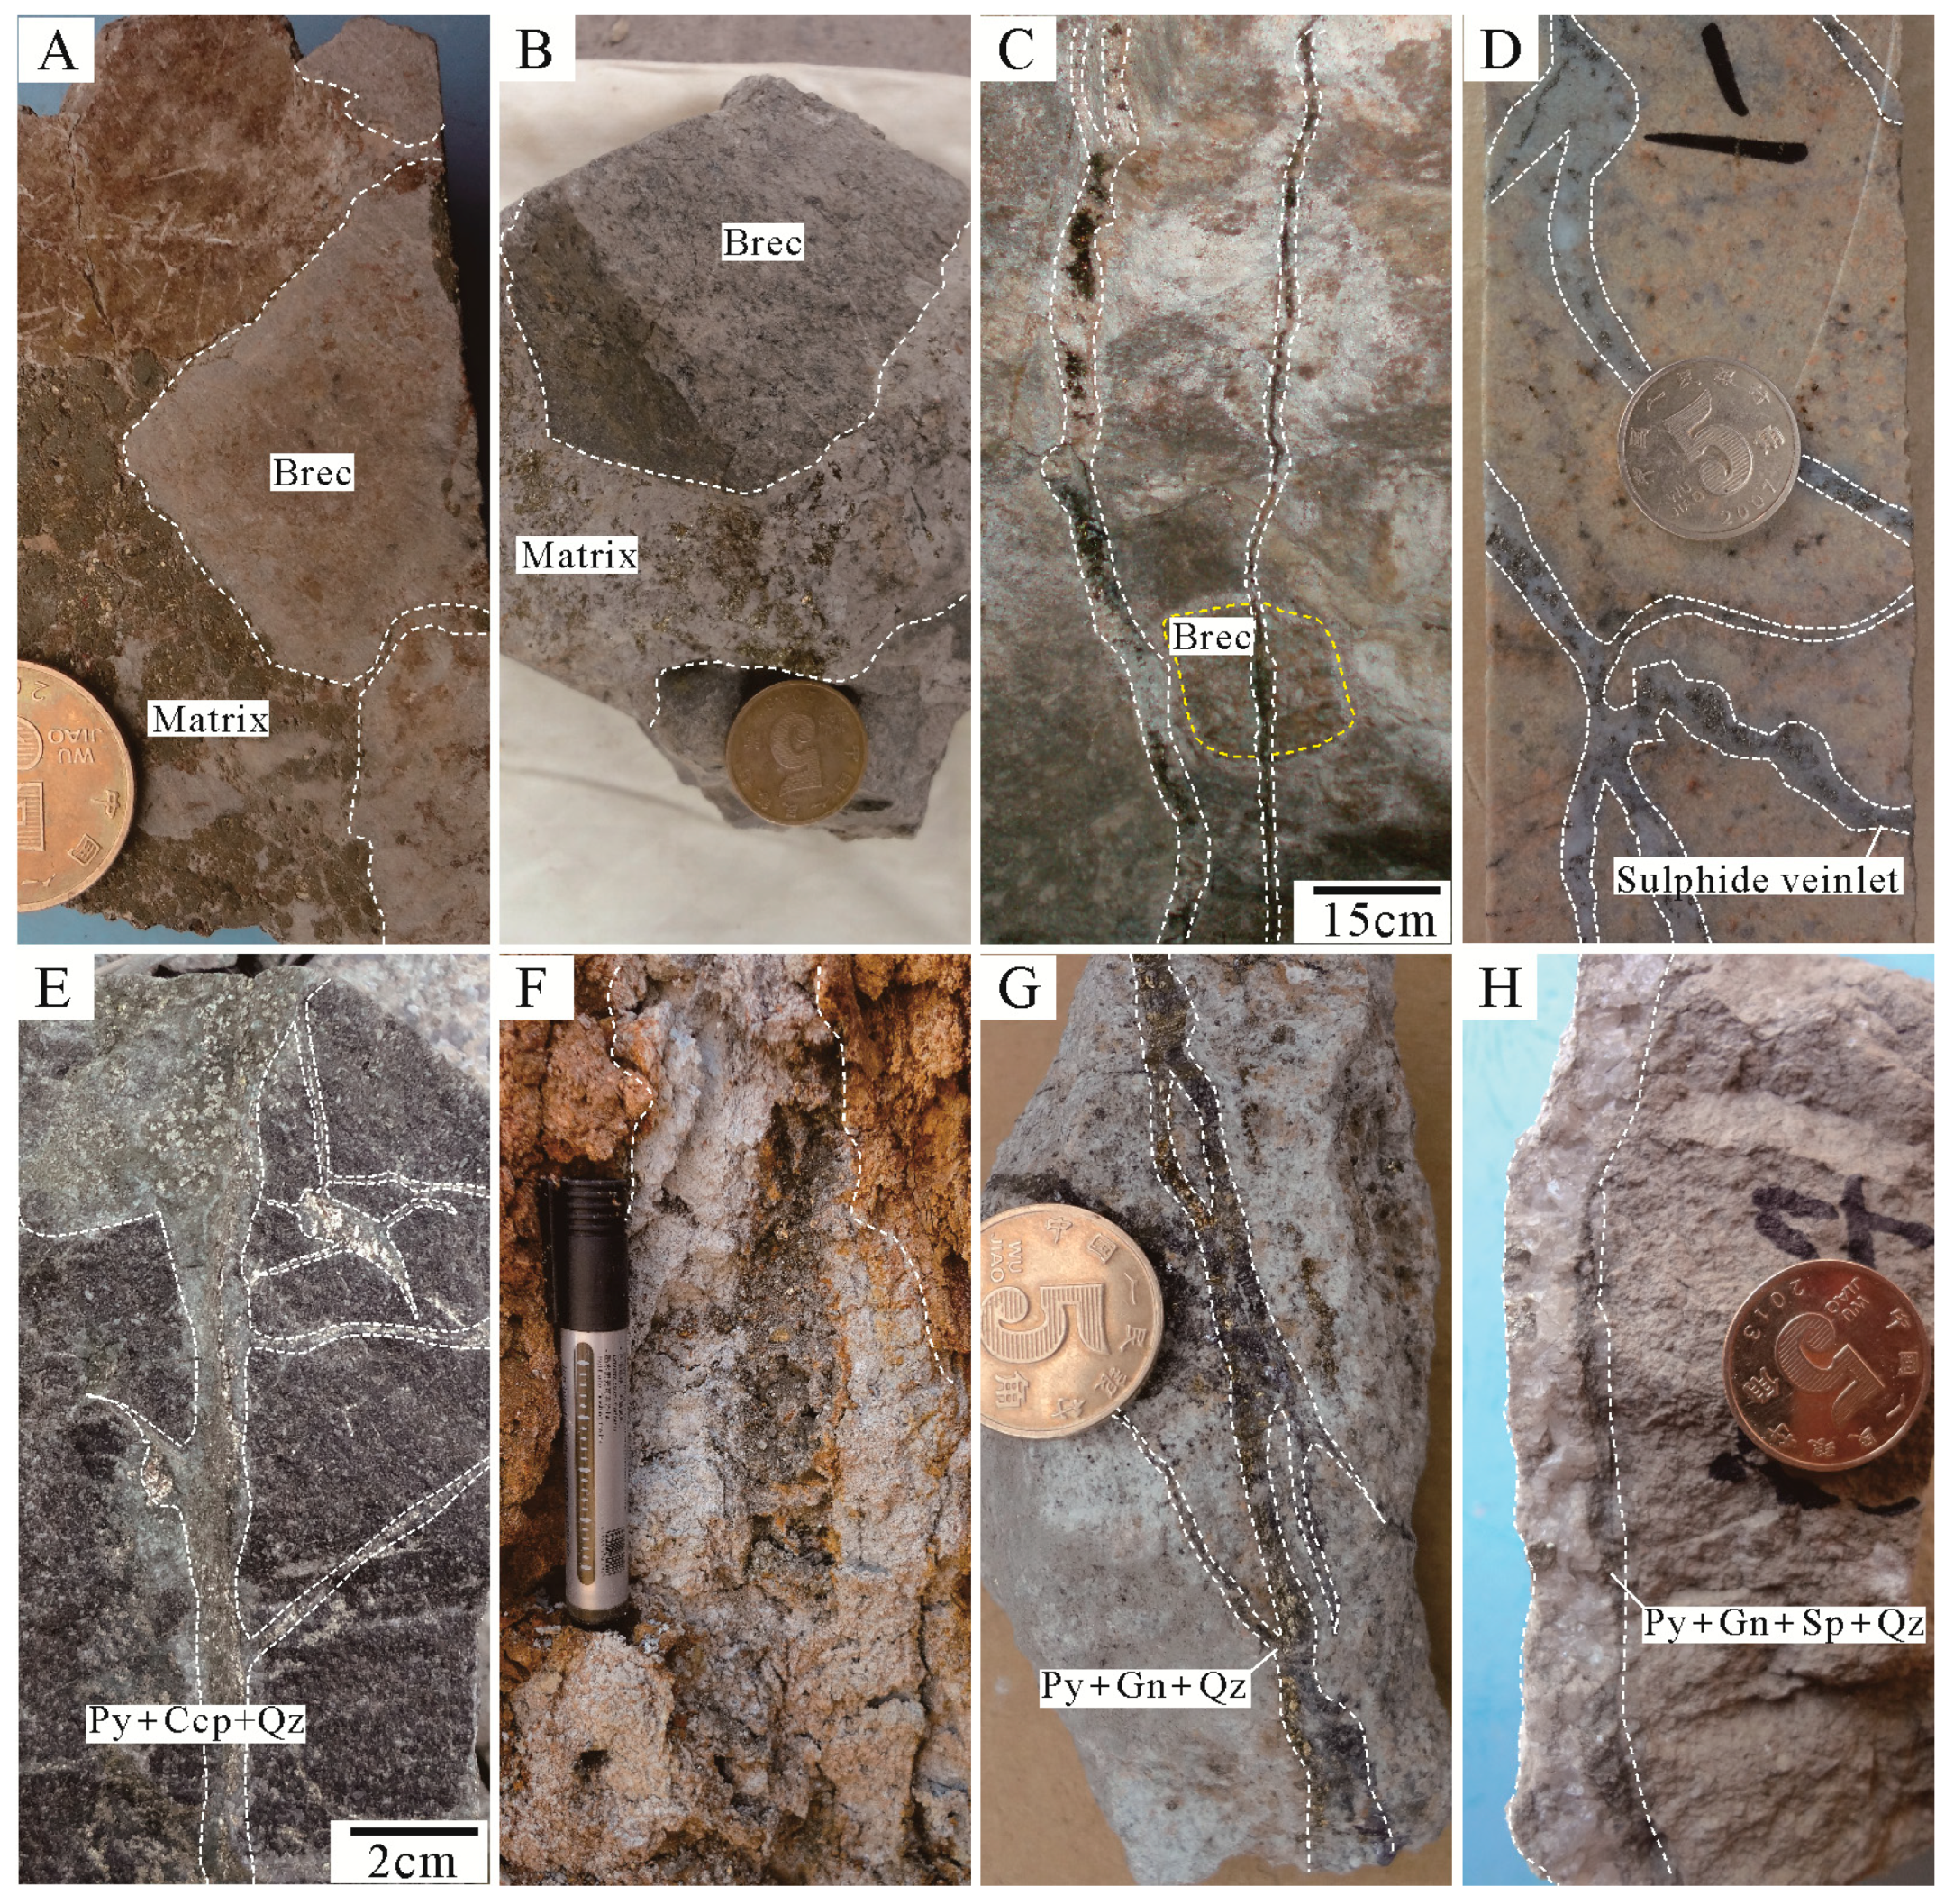
The breccia pipes occur at fault intersections. Eight large breccia pipes are presently documented, extending in a rough line from east to west, controlled by a major NW–SE-trending fault (Figure 2). The breccia pipes have an elliptical shape in plan view and are approximately columnar in section view, plunging towards the NE or SE at 65°–85°. Breccia-hosted orebodies occur in these pipes (Figure 3A). The ore host rock is composed mainly of matrix and breccia (Figure 4A,B). The breccia consists of clasts of diorite, granite, and diorite and granite porphyries that are lenticular or angular in shape. The matrix consists of sulfide and alteration minerals. The proportions of sulfides and alteration minerals in the matrix are 10%–30% and 70%–90%, respectively. These breccia-hosted orebodies are 46–100 m long and 3.9–23.4 m wide, and contain 3.3–20.9 g/t Au.
The disseminated orebodies occur below the ring faults, concentrated mainly in intensively altered granitic wall-rock (Figure 3A). The orebodies, delineated according to the gold grade (>3.0 g/t), are lenticular or layered. These orebodies are characterized by veinlets and stockworks (Figure 4D,E), which are generally 300–800 m long and 0.6–7.9 m wide, and have a grade of 3.2–15.8 g/t Au.
The vein-type orebodies are hosted in ring and radial faults, and consist mostly of gold-bearing quartz–sulfide veins (Figure 4F–H). The ring structure is 1 km in diameter and dips outward at 40°–50°. The radial faults are perpendicular to the ring fault around the dome structure. The vein-type orebodies are 220–1600 m long and 0.2–3.2 m wide and have a grade of 3.7–22.2 g/t Au (Figure 3A).
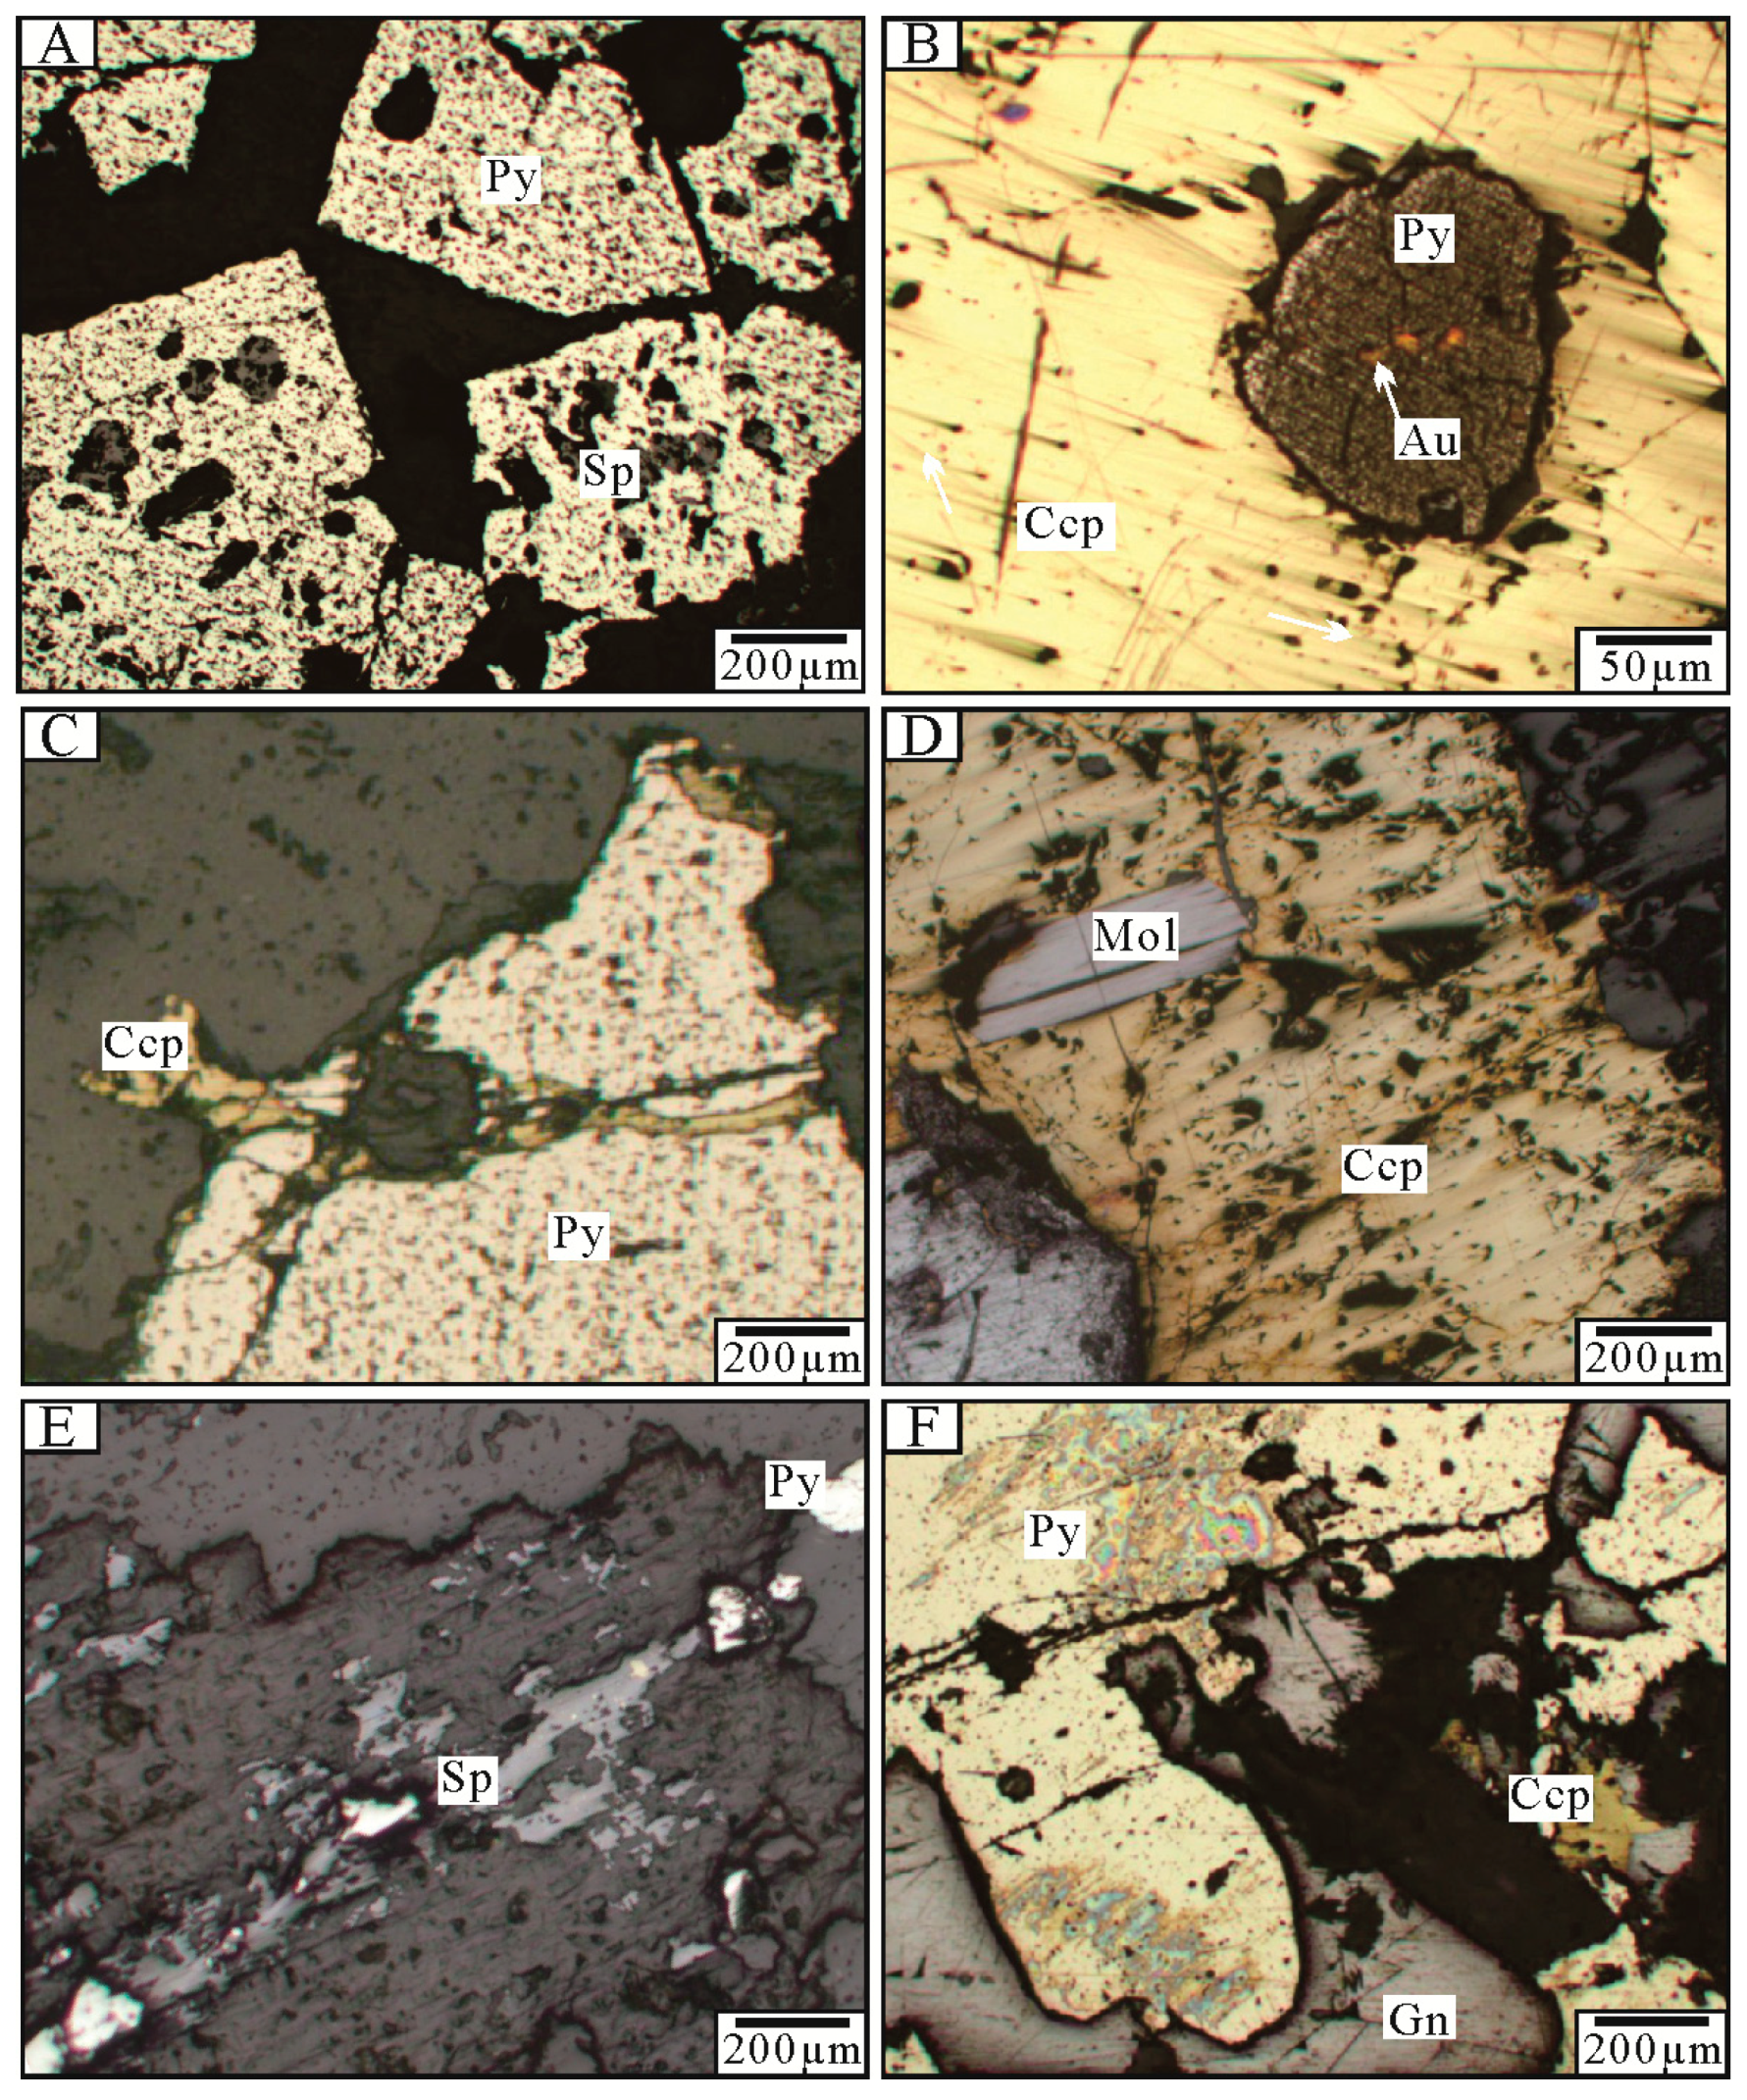
The hypogene minerals are pyrite, chalcopyrite, galena, sphalerite, and arsenopyrite, as well as minor molybdenite, chalcocite, bornite, and gold. The supergene minerals are azurite, malachite and limonite. The gangue minerals comprise quartz, sericite, K-feldspar, epidote, chlorite, kaolinite, and calcite (Figure 4 and Figure 5). Gold occurs primarily within pyrite and quartz as crystal interface gold, crack gold, or inclusion gold (Figure 5B).
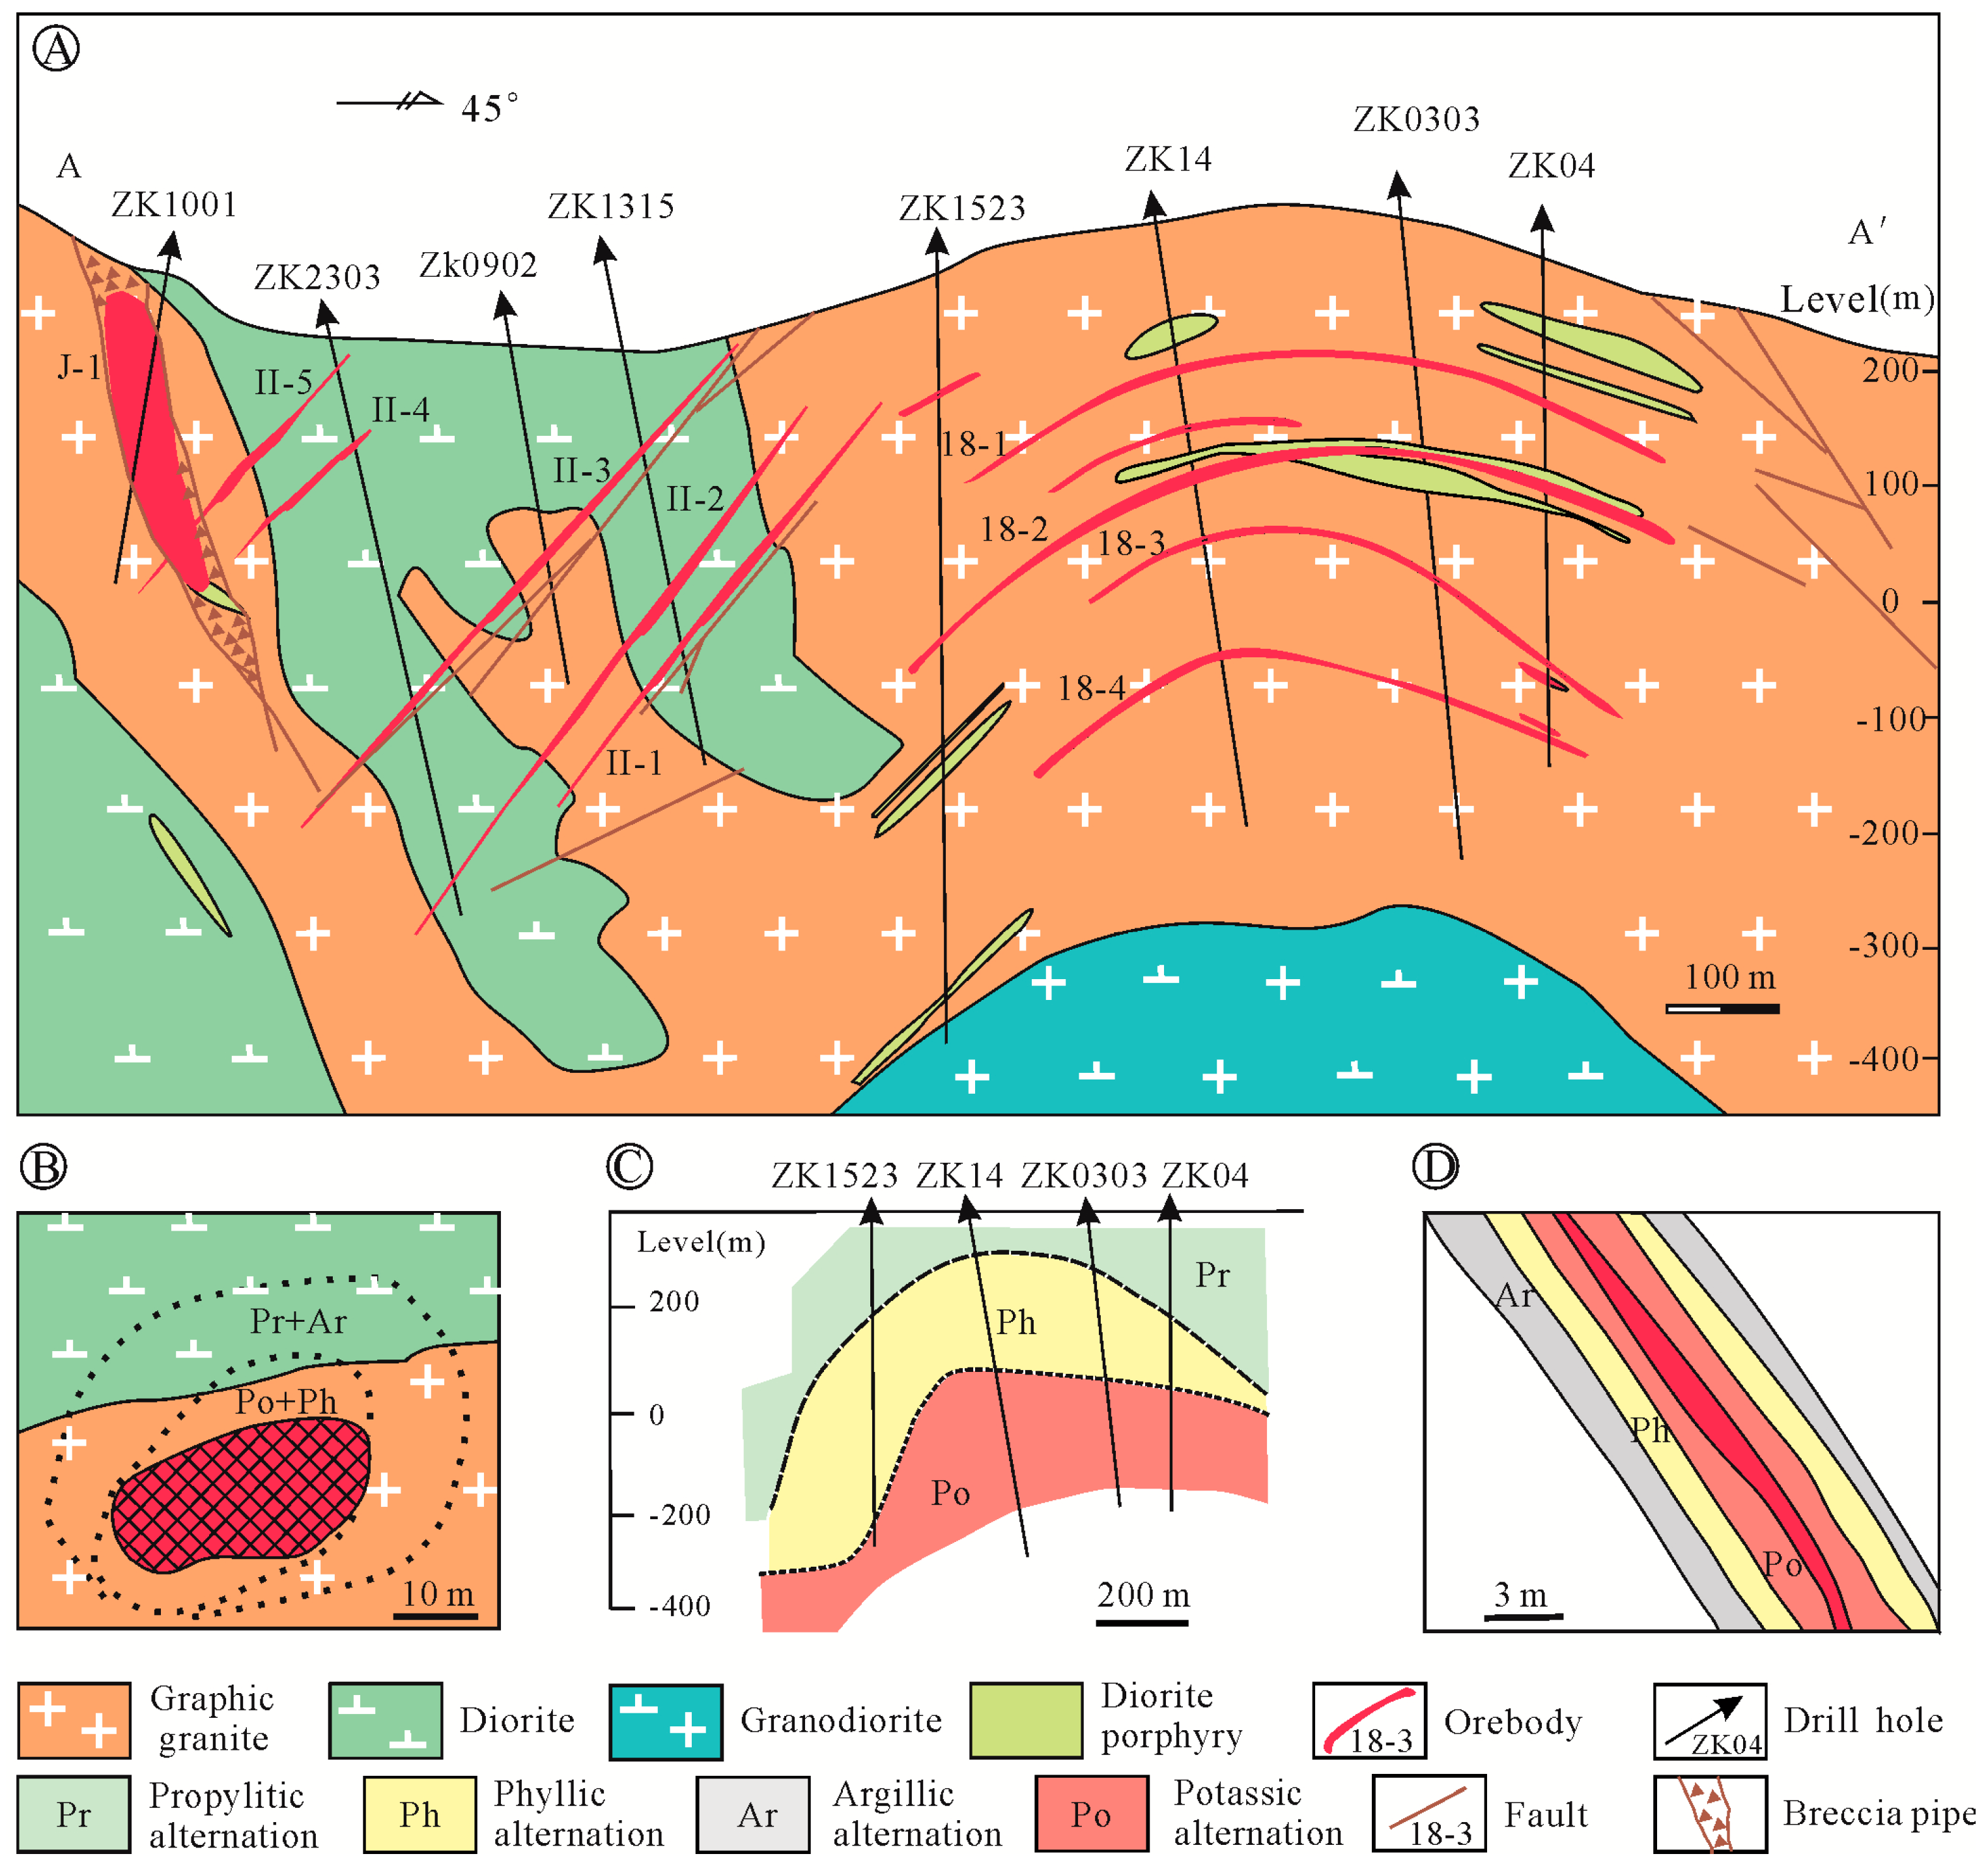
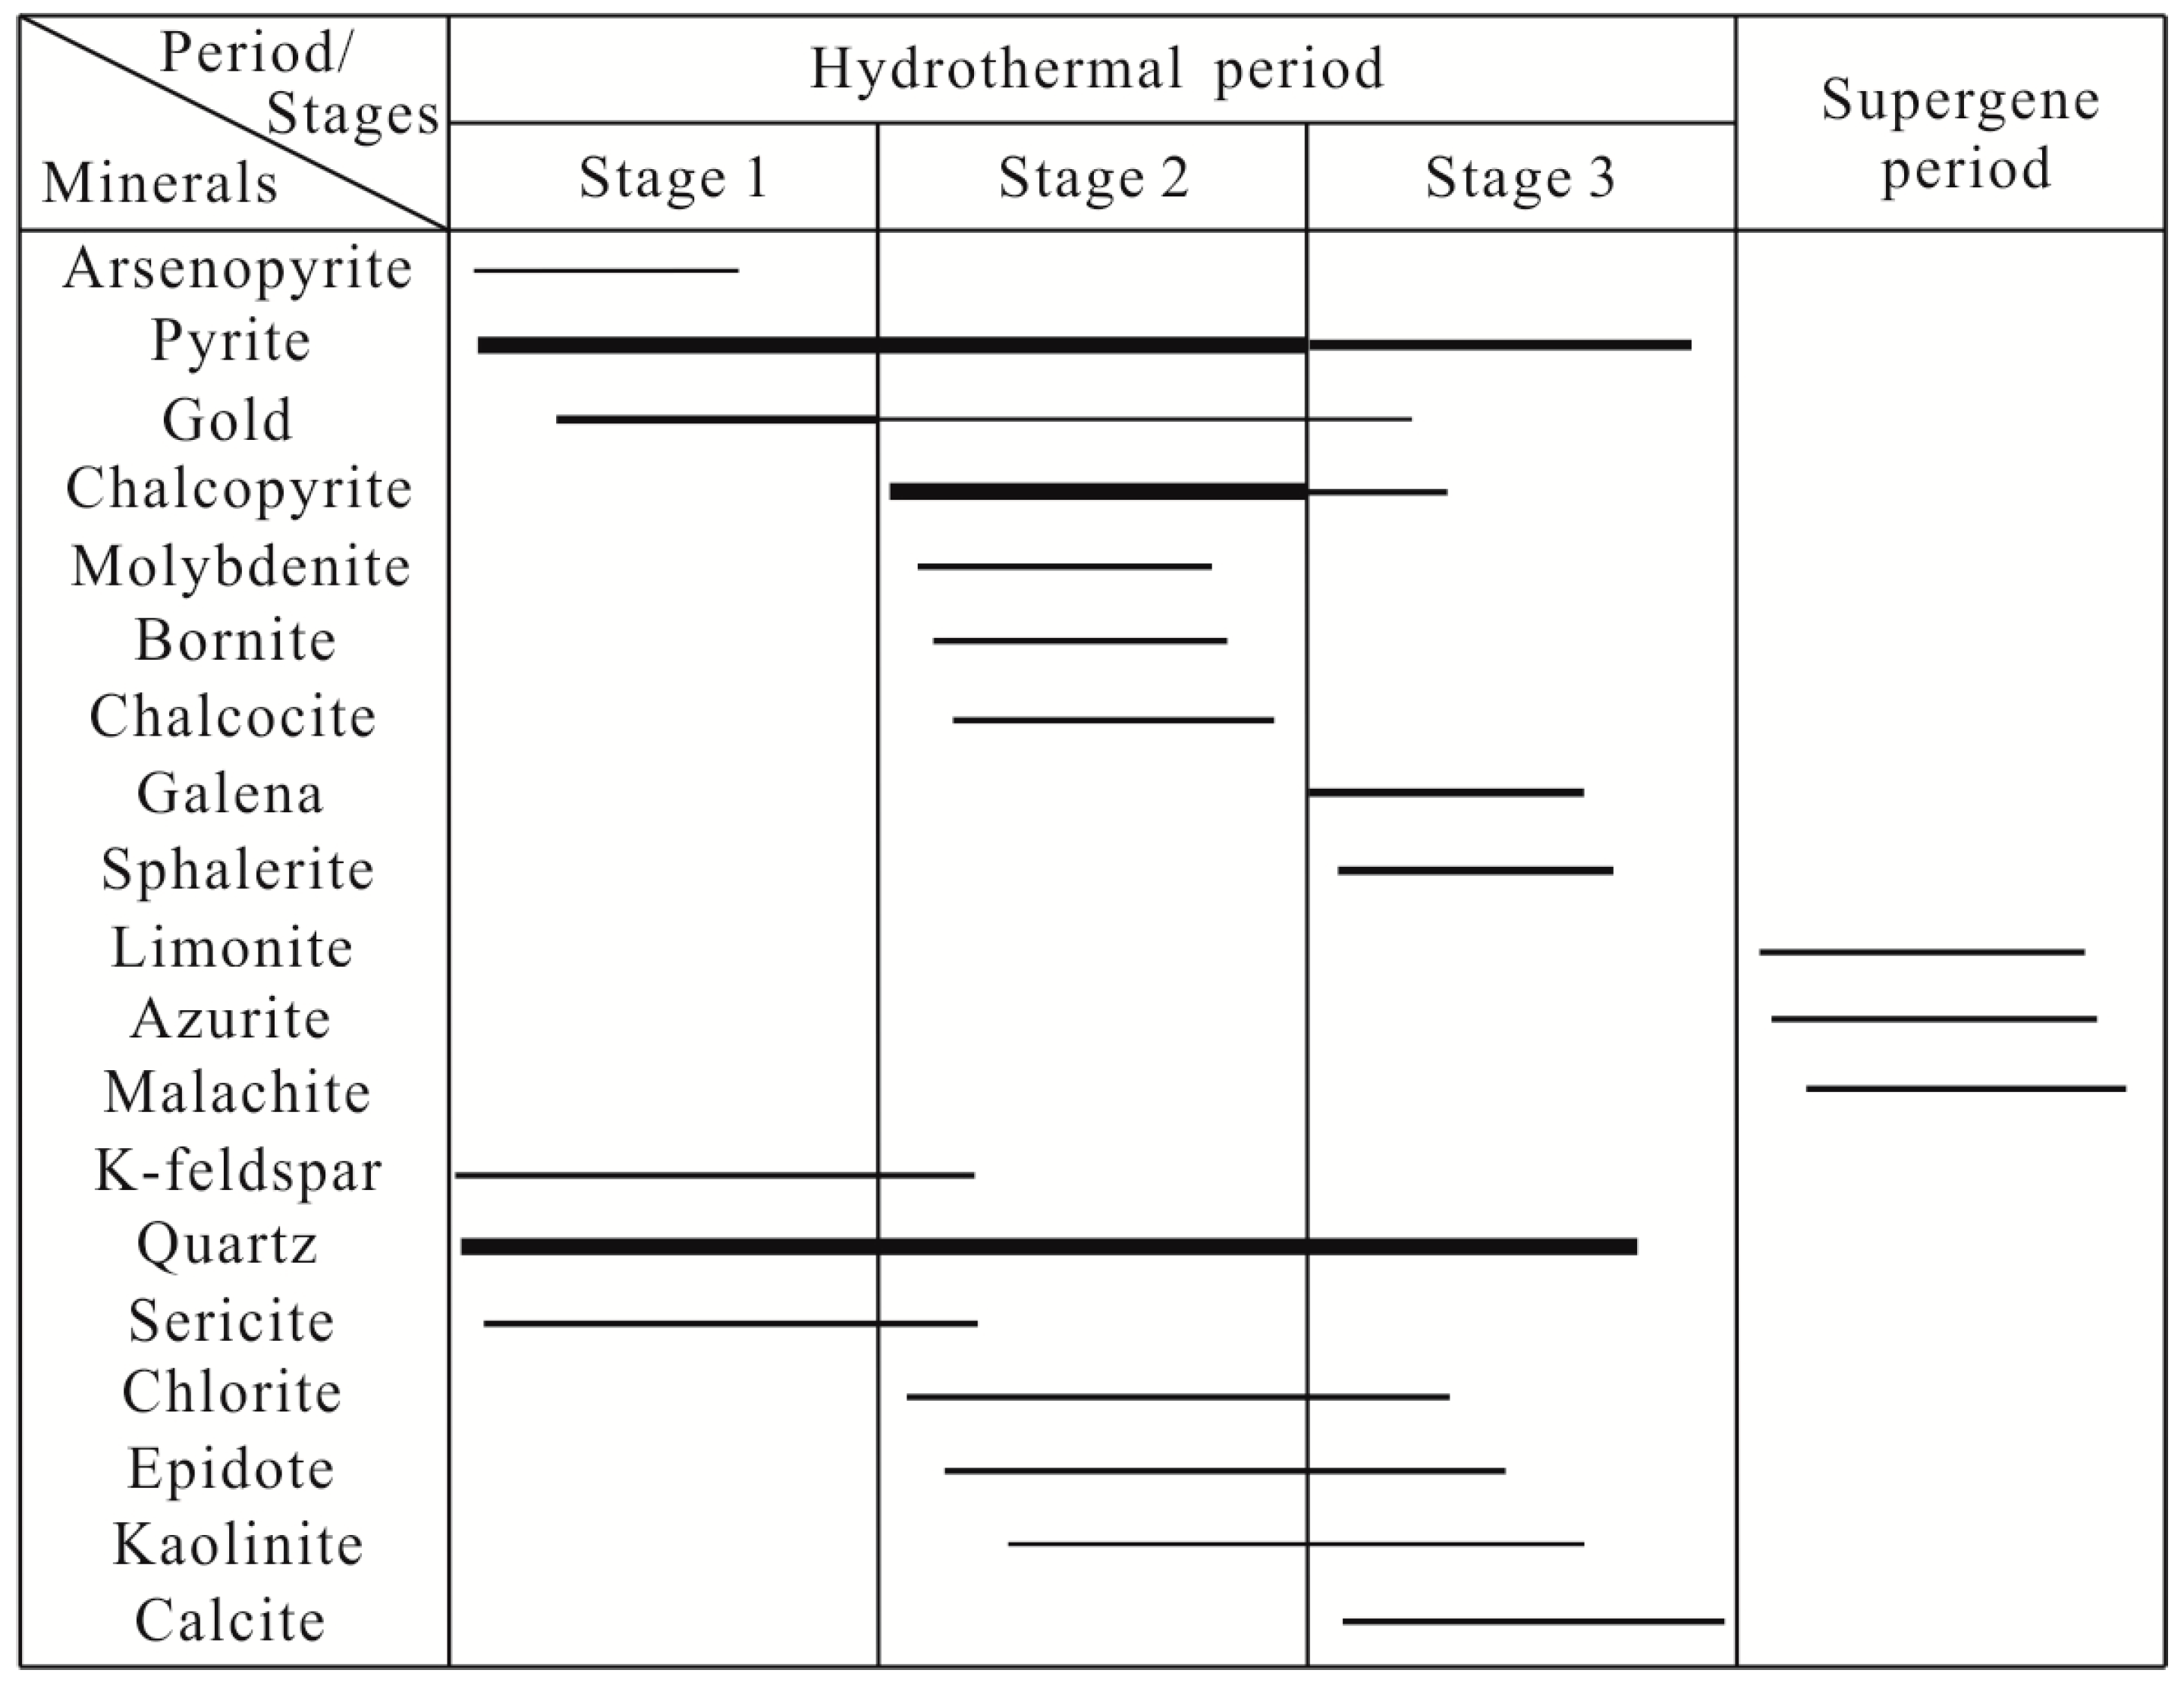
Alteration of the wall-rock is pervasive and characterized by potassic, phyllic, argillic, and propylitic alteration, similar to porphyry deposit systems elsewhere [29]. Potassic alteration is extensive and is dominant in the mine, as indicated by the pervasive development of K-feldspar, biotite, and quartz. The potassic alteration is overprinted by later stages of alteration (e.g., phyllic). The phyllic alteration assemblage consists of quartz, sericite, and pyrite. Plagioclase is completely or partially altered to sericite. The argillic alteration is locally controlled by fractures and characterized by kaolinite and montmorillonite. Argillic alteration overprints the phyllic and potassic alteration assemblages. Propylitic alteration assemblages are characterized by epidote, chlorite, calcite, and quartz, which replaced plagioclase and mafic minerals. The alteration zones are different around the three types of orebody. For breccia-hosted orebodies, potassic and phyllic alteration are observed adjacent to the mineralized breccia pipe, whereas argillic and propylitic alteration occurs farther from the mineralized domain, in the outermost part of the northern breccia pipe [19,20] (Figure 3B). For disseminated orebodies, from depth to surface, the alteration varies from potassic to phyllic, and finally to propylitic [19,20] (Figure 3C). The economic ores in the No. 18 orebody occur mainly in phyllic alteration zones. For vein-type orebodies, with increasing distance from the orebody the wall-rock has been affected by potassic, phyllic, and subsequently argillic alteration, although the boundaries between these domains are gradational [19,20] (Figure 3D). Based on the paragenetic sequences (Figure 6) and cross-cutting relationships, three stages of mineralization are identified. The hydrothermal veins of each stage are as follows.
Stage 1 mineralization is the most important ore-forming stage and occurs primarily within the breccia-hosted ore. This stage involved the deposition of abundant native gold within the matrix of the breccia-hosted ore. The mineral assemblage associated with this stage is milky white quartz, pyrite, and subordinate arsenopyrite, K-feldspar, and sericite. Pyrite is the most abundant ore mineral, commonly occurring as coarse-grained euhedral crystals within the matrix (Figure 5A). The quartz grains are heterogeneous in size and show no preferential growth orientation. Stage 2 mineralization is widespread and resulted in the development of quartz–pyrite–chalcopyrite veins (Figure 4D,E). The Stage 2 mineral assemblage includes molybdenite, chalcocite, bornite, azurite, gold, chlorite, and epidote (Figure 5C,D). The dominant ore-forming mineral is chalcopyrite, which occurs as anhedral crystals intergrown with pyrite. The quartz–pyrite–chalcopyrite veins of this stage cross-cut the breccia-hosted ore (Figure 4C).
Stage 3 mineralization produced quartz–pyrite–galena–sphalerite veins of limited distribution (Figure 5E,F). These veins are observed to cross-cut the quartz–pyrite–chalcopyrite veins of Stage 2, indicating that they formed during the latter part of ore genesis. The Stage 3 veins contain minor gold, and the mineral assemblage includes chlorite, epidote, kaolinite, and calcite.
2.4. Timing of Metallogenesis
The metallogenic age of the gold is controversial, and previous dating results range from 129 to 100 Ma [9,19,30,31]. However, the granodiorite concealed under the No. 18 orebody is considered the intrusive body most likely to have generated the mineralization and has yielded a U–Pb age of 106.8 ± 2.0 Ma (MSWD = 0.65; N = 20) [28]. The granodiorite belongs to the calc-alkaline series, and I-type granitoids are thought to form in a volcanic arc environment [28]. The age of mineralization should be slightly younger, or similar to, the age of the igneous rocks. The newest radiometric age data for pyrite minerals, using the Re–Os method, give an isochron age of 102 Ma [18]. The geochronological data demonstrate that magmatism and hydrothermal activity were contemporaneous, which suggests that the granodiorite played an important role in gold mineralization. Sericite and pyrite from altered granite in drill holes ZK14 and ZK04 in the No. 18 orebody yield a Rb–Sr age of 104 ± 6 Ma [19]. This alteration is considered to reflect the initial stage of mineralization in the deposit. Based on the evidence presented above, we suggest that the Jinchang deposit mineralization occurred at ca. 102 Ma.
3. Sample Selection and Analytical Methods
Samples for analysis were collected mainly from drill holes (ZKE01, ZK1001, ZK1523, ZK14, ZK0303, ZK2303, ZK0902, and ZK1315) and an underground mining tunnel (30 m level, middle section) in the Jinchang deposit (Figure 3).
3.1. Fluid Inclusions
The three generations of quartz are representative of Stages 1–3 of the mineralization. This ore-stage quartz occurs mainly in association with pyrite and chalcopyrite, and commonly coexists with other metallic minerals, indicating that the formation of the quartz and sulfide minerals was coeval.
Forty-five samples of quartz were polished to a thickness of 0.20–0.25 mm, soaked in acetone for 3–4 h, rinsed with clean water, and dried thoroughly. FI petrography involved careful observation of the shapes, spatial distribution, genetic and composition types, and vapor/liquid ratios. Twenty samples with abundant and representative FIs were selected for microthermometric measurements.
FI analysis was undertaken at the Geological Fluid Laboratory, College of Earth Science, Jilin University, Changchun, China, using the FIA methodology of Goldstein and Reynolds [32]. Petrography was undertaken with an Olympus BX-50 microscope (Olympus Corporation, Tokyo, Japan). Microthermometry was undertaken using a Linkam THMS600 heating–freezing stage (Linkam Scientific Instruments Ltd, Tadworth, UK) with a temperature range of −196 to 600 °C. The accuracy of the measured temperatures is ±0.1 °C for temperatures of <31 °C and ±0.2 °C for temperatures of >300 °C. The salinities of the liquid-rich NaCl–H2O FIs were calculated using the final melting temperatures of ice with the equation of Bodnar [33]. Salinities of the daughter-mineral-bearing inclusions were estimated using the data and methodology of Bodnar and Vityk [34].
3.2. H–O–S Isotopes
Quartz, pyrite, chalcopyrite, and galena grains of the different ore-forming stages were handpicked from crushed and sieved (40–60 mesh) samples under a binocular microscope (purity > 99%). Hydrogen, oxygen, and sulfur analyses were undertaken with a MAT253 mass spectrometer (Thermo Finnigan, Silicon Valley, CA, USA) at the Analytical Laboratory in the Beijing Research Institute of Uranium Geology, China National Nuclear Corporation, Beijing, China.
Oxygen isotope analysis was conducted on 10–20 mg of quartz using the bromine pentafluoride method of Clayton and Mayeda [35], with oxygen converted to CO2 on a platinum-coated carbon rod. The H isotopic composition of water within the FIs was determined by decrepitation. The water was reduced to H2 by passing over a uranium-metal-bearing tube and transferred to the mass spectrometer. The results are reported relative to Vienna Standard Mean Ocean Water (VSMOW), and the analytical precisions are ±0.2‰ for δ18O and ±2‰ for δD. Stage 1–3 sulfide samples were analyzed for S isotopes. The sulfides were reacted with Cu2O until transformation into pure SO2 [36]. The results are reported as δ34S relative to Vienna Canyon Diablo Troilite (VCDT), and the analytical precision is ±0.2‰. The analysis of isotopes was carried out in a closed environment. External heating and the decrepitation of inclusions did not affect the isotope measurements. The analyzed samples were carefully selected, and the primary inclusions were dominant in the quartz grains, whereas secondary inclusions were minor.
4. Results
4.1. Fluid Inclusion Petrography
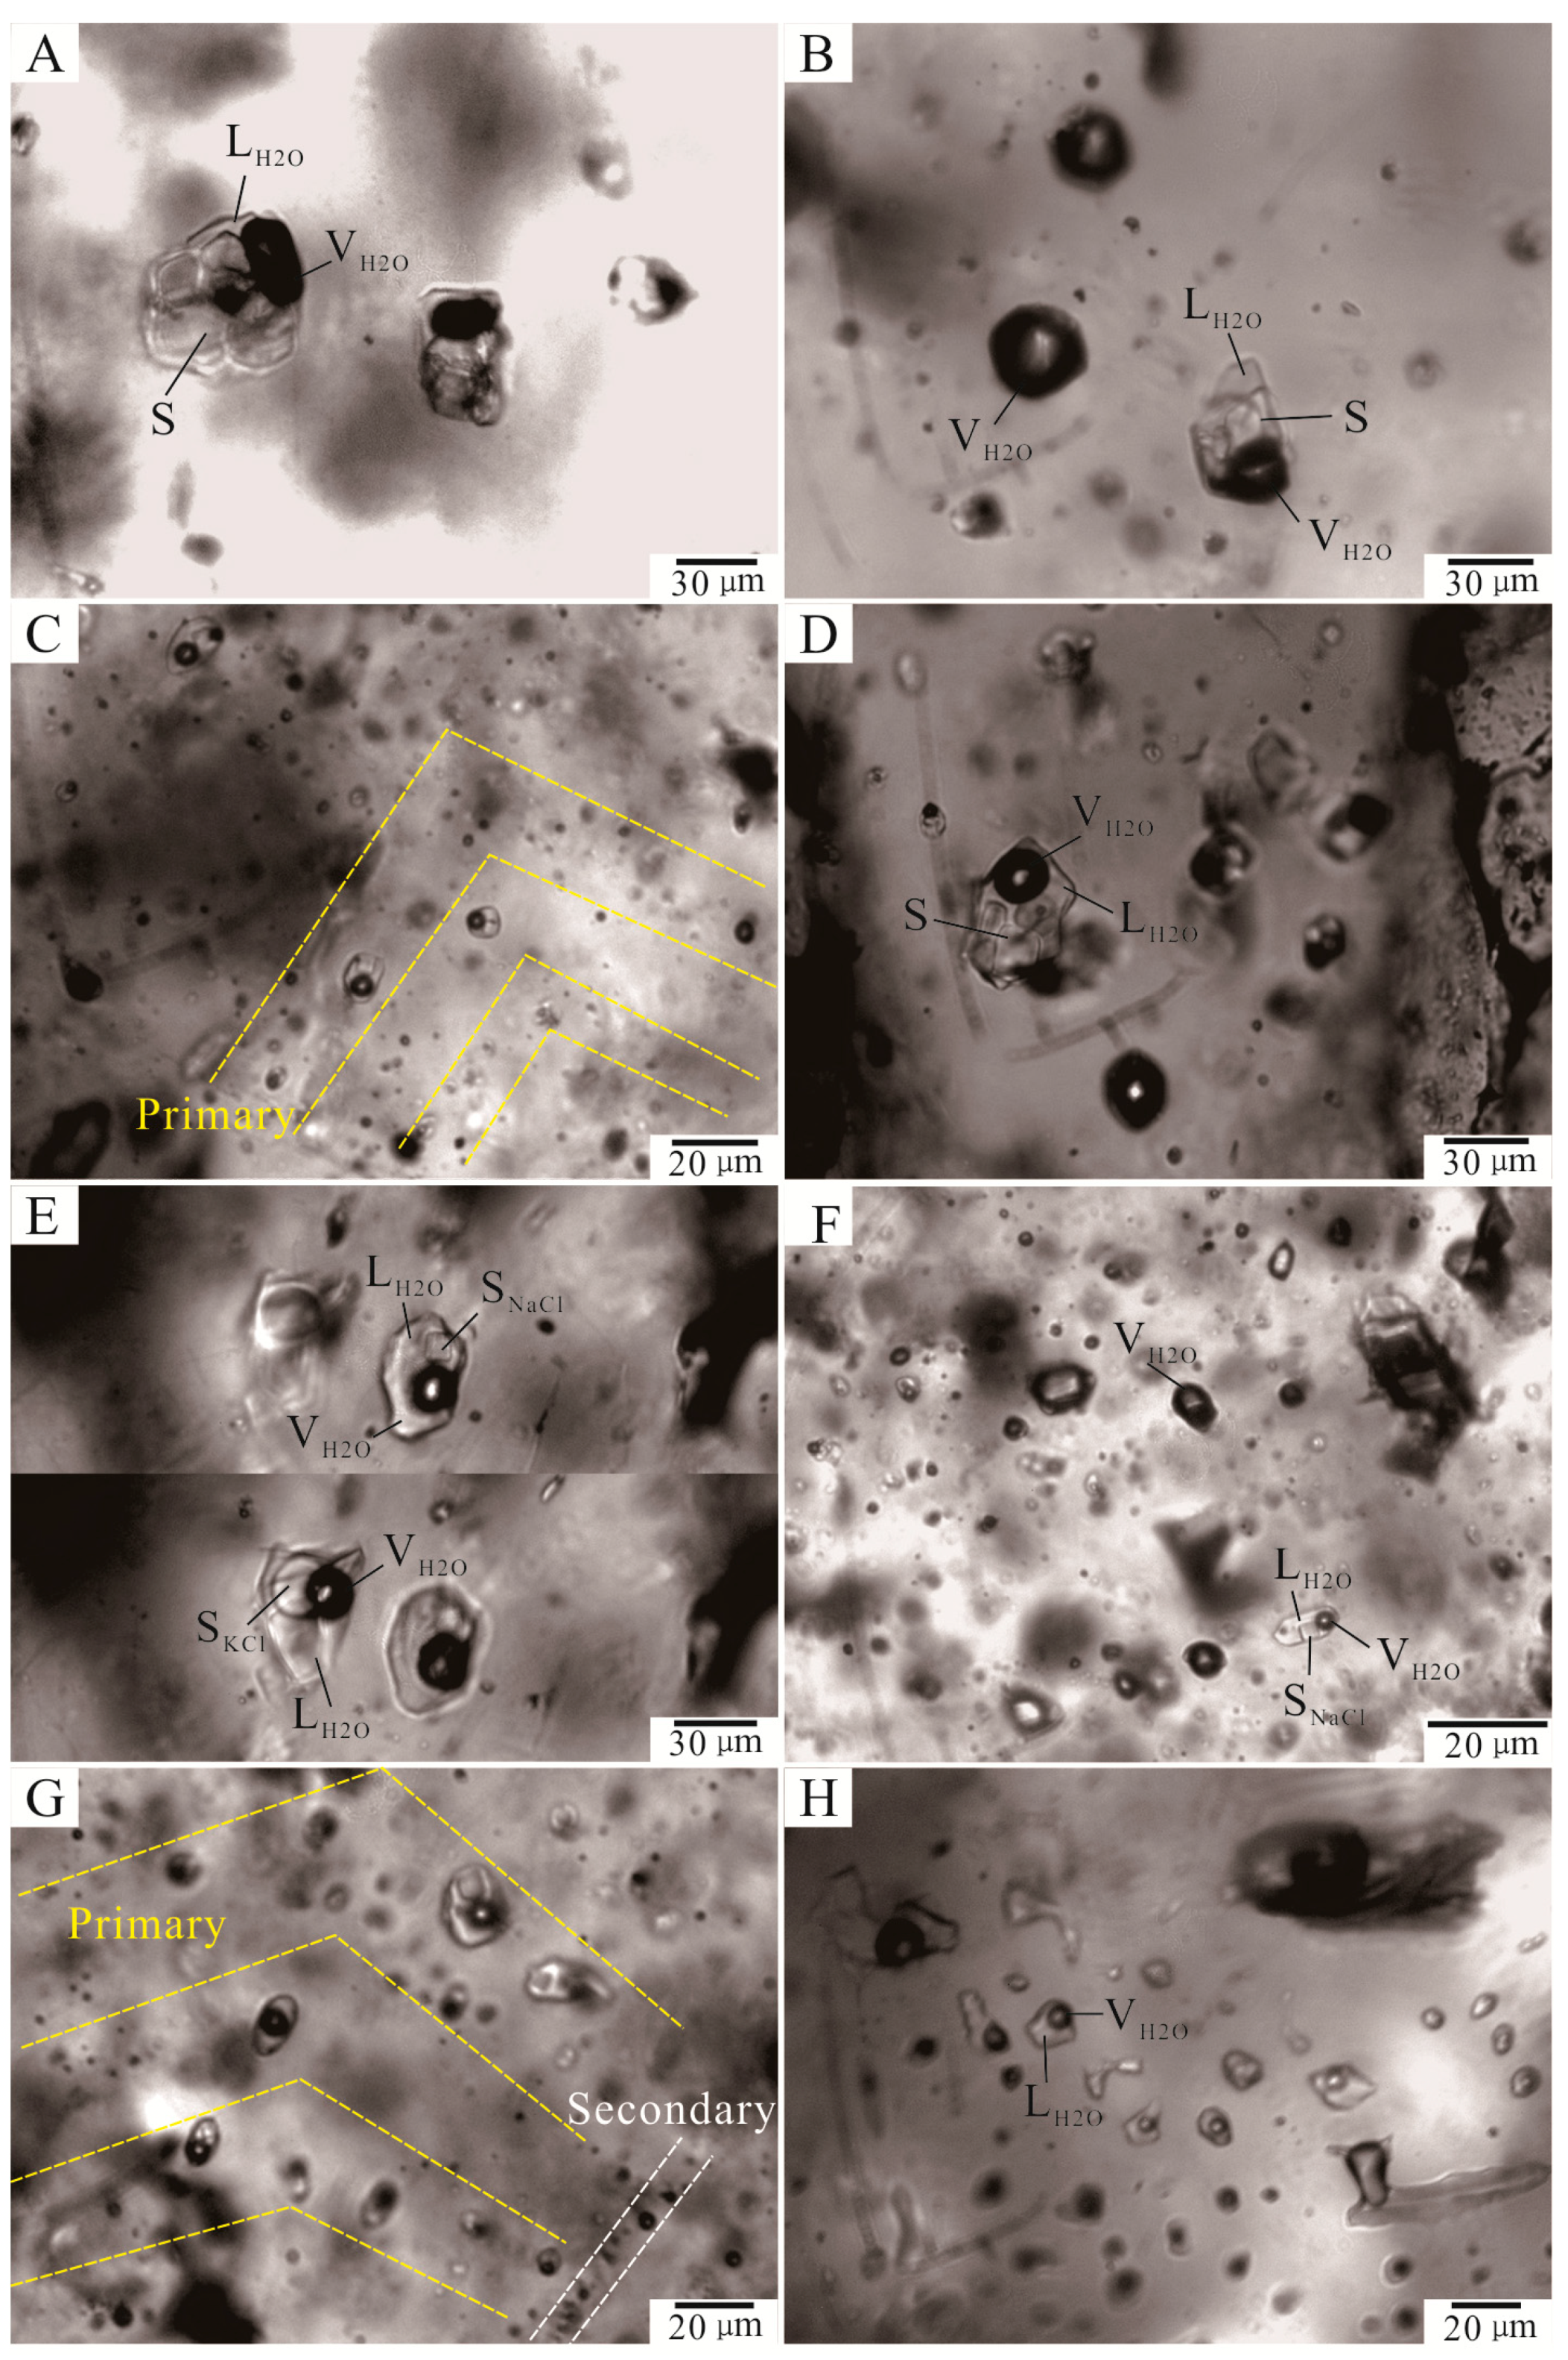
FIs in Stage 1–3 quartz grains were analyzed using microthermometry. The criteria of Roedder [2] and Hollister and Burruss [37] were used to distinguish the different generations of FIs in the hydrothermal quartz. Primary, pseudo-secondary, and secondary FIs were observed. Primary inclusions are distributed randomly and along the growth zones of the crystals. The pseudo-secondary inclusions occur as trails in healed fractures, which do not cut grain boundaries. The planes of secondary inclusions cross-cut the mineral grains. Each cluster or group of inclusions along the growth bands is considered to represent a separate FI assemblage (FIA) [32,38]. These secondary inclusions were not analyzed using microthermometry, as it is possible that they formed late relative to the mineralization.
Three major types of inclusion were revealed based on phase assemblages at room temperature (21 °C): daughter-mineral-bearing (S-type), vapor-rich aqueous (V-type), and liquid-rich aqueous (LV-type) (Figure 7).
S-type FIs comprise a vapor bubble, liquid phase, and one or more daughter minerals in crystalline form at room temperature. These inclusions are subdivided into two sub-types. S1-type inclusions contain several daughter minerals with a specific shape that account for 30%–70% of the total volume of the inclusion. The crystalline inclusions are multi-sided and 10–40 µm in size, and contain vapor bubbles that account for 15%–50% of the total volume. Rarely, opaque daughter minerals occur within the inclusions and are considered to be metallic minerals. Primary S1-type inclusions are abundant in Stage 1, rarely observed in Stage 2, and absent from Stage 3 quartz.
S2-type inclusions contain only one daughter mineral with a cubic or globular form, which is identified as NaCl or KCl. The inclusions typically exhibit a diamond, elliptical, or sub-rounded shape and are 6–35 µm in size. Vapor bubbles account for 10%–25% of the total volume of the inclusions. These inclusions are ubiquitous in Stage 1–3 quartz from the Jinchang deposit, typically occurring as planar arrays within the growth bands of the quartz grains. Primary S2-type inclusions commonly coexist with V-type FIs in quartz of Stages 1–2.
V-type FIs comprise a single vapor phase or a liquid with a vapor bubble that accounts for 60%–95% of the total volume. These FIs are typically elliptical to sub-rounded in shape and 10–30 µm in size. V-type FIs are not observed in Stage 3 quartz, but they occur in both isolation and as clusters in Stage 1–2 quartz.
LV-type FIs comprise a vapor bubble and liquid phase at room temperature. These FIs are typically rectangular or elliptical and 8–20 µm in size. The vapor bubbles account for 10%–30% of the total volume. LV-type FIs are not observed in Stage 1 quartz. They occur primarily as clusters along the growth bands of Stages 2 and 3 quartz grains, but are more abundant in the latter stage.
4.2. Microthermometry
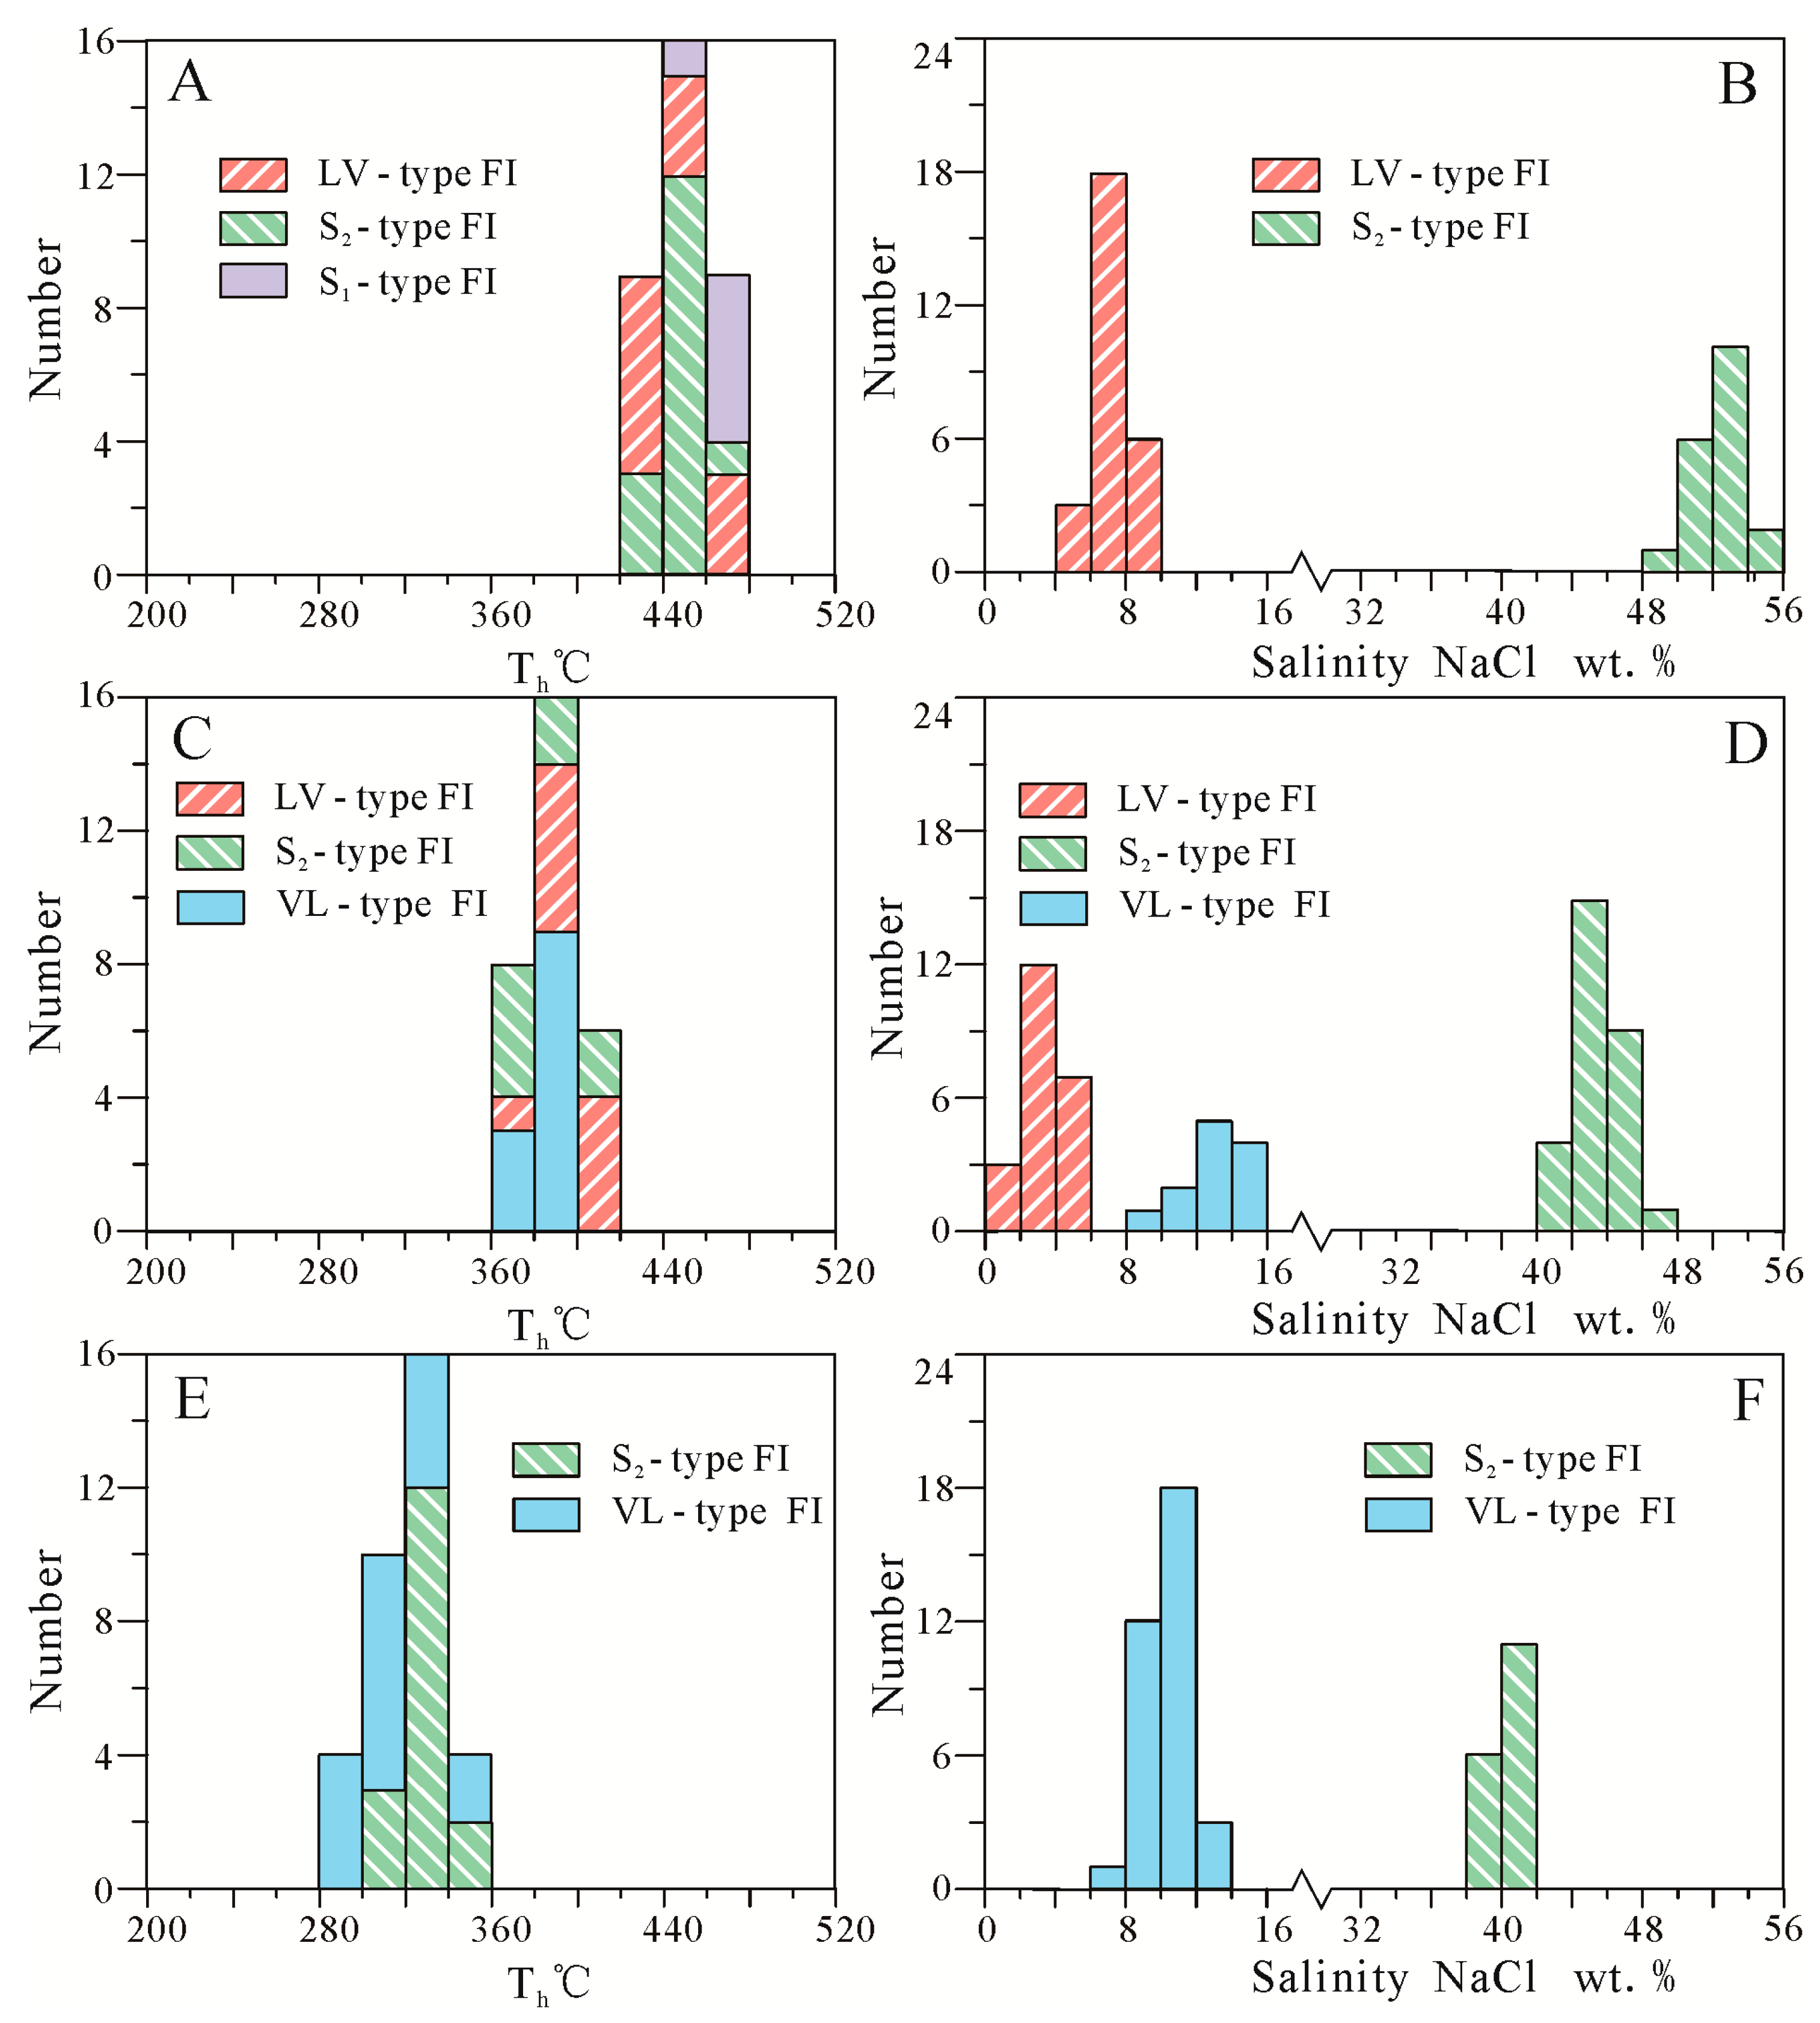
The results of microthermometry analyses of >190 FIs and 20 FIAs are presented in Table 1. Primary and pseudo-secondary FIs of >5 μm in size, with a regular crystal shape and without evidence of necking, were chosen for microthermometry. Only a few V-type FIs could be analyzed, owing to their low vapor-to-liquid ratio. The salinity of S1-type inclusions could not be analyzed because of the variable melting temperatures of the daughter minerals and the inability to measure salinity accurately. Histograms of the Th and salinities of the different FI types in quartz crystals of Stages 1–3 are presented in Figure 8.
4.2.1. S1-, S2-, and V-Type FIs in Stage 1 Quartz
S1-type inclusions are most abundant in Stage 1 quartz grains, accounting for 45% of the total number of inclusions. S2- and V-type FIs account for 30% and 25% of the total inclusions, respectively.
Upon heating, the first change observed in S1-type inclusions was the dissolution of the daughter minerals. Total homogenization of the FIs to a single phase typically occurred at 447–479 °C, although in a few instances both transparent and opaque sulfide daughter minerals remained unaffected at temperatures up to 600 °C. S2-type FIs were homogenized via three homogenization modes during heating. In the first mode, the vapor phase disappeared and then the daughter minerals dissolved. In the second mode, the daughter minerals dissolved, followed by the vapor phase. In the third mode, the vapor phase and daughter minerals disappeared simultaneously. The third homogenization mode is considered the most important. Ultimately, the FIs were homogenized to a single liquid phase at 431–469 °C. The daughter minerals within the inclusions dissolved at temperatures of 421–459 °C and yielded salinities of 49.8–54.4 wt% NaCl. The final ice-melting temperatures of the V-type FIs range between −5.6 and −3.8 °C, corresponding to salinities of 6.2–8.7 wt% NaCl equivalent. Total homogenization of V-type FIs to a vapor phase occurred at temperatures of 421–463 °C.
4.2.2. S2-, V-, and LV-Type FIs in Stage 2 Quartz
S2-type FIs typically account for >50% of the total number of inclusions in all minerals. V- and LV-type FIs are less abundant (typically ~25% and ~20%, respectively). S1-type inclusions are rarely observed within quartz grains and were not analyzed.
Similarly to Stage 1 quartz, S2-type FIs in Stage 2 quartz were homogenized by three mechanisms at temperatures of 365–408 °C, corresponding to salinities of 43.3–48.3 wt% NaCl. The final ice-melting temperatures of V-type FIs range between −3.3 and −0.7 °C, corresponding to salinities of 1.2–5.4 wt% NaCl equivalent. Total homogenization of the V-type FIs to a vapor phase occurred at 364–407 °C. The final ice-melting temperatures of LV-type FIs range between −12.0 and −6.2 °C, corresponding to salinities of 9.5–16.0 wt% NaCl equivalent. Total homogenization of the LV-type FIs to a liquid phase occurred at temperatures of 363–394 °C.
4.2.3. S2- and LV-Type FIs in Stage 3 Quartz
FIs in Stage 3 quartz grains yielded lower salinities and temperatures than those of Stage 1 and 2 quartz. S2- and LV-type FIs account for ~20% and ~80% of the total number of inclusions, respectively.
Daughter minerals in S2-type FIs dissolved at temperatures between 302 and 346 °C, indicating salinities of 38.3–42.0 wt% NaCl equivalent. Final homogenization of the FIs to a liquid phase occurred at 312–346 °C. The final ice-melting temperatures of the LV-type FIs range between −8.8 and −5.0 °C, corresponding to salinities of 7.9–12.6 wt% NaCl equivalent. Total homogenization of the LV-type FIs to a liquid phase occurred at temperatures of 296–347 °C.
4.3. Oxygen and Hydrogen Isotope Analysis
Isotope data for 12 quartz samples that are representative of Stages 1–3 of mineralization in the Jinchang deposit are reported as δ18OVSMOW and δDVSMOW. The δ18OVSMOW and δDVSMOW values range from 8.6‰ to 11.4‰ and −92.2‰ to −72.1‰, respectively (Table 2). The δ18OH2O-SMOW values range between 2.5‰ and 8.5‰, as calculated using the formula of Clayton et al. (1000lnαqz–water = 3.38 × 10⁶ × T−2 − 3.4) [39] and the Th values of the FIs.
4.4. Sulfur Isotope Analysis
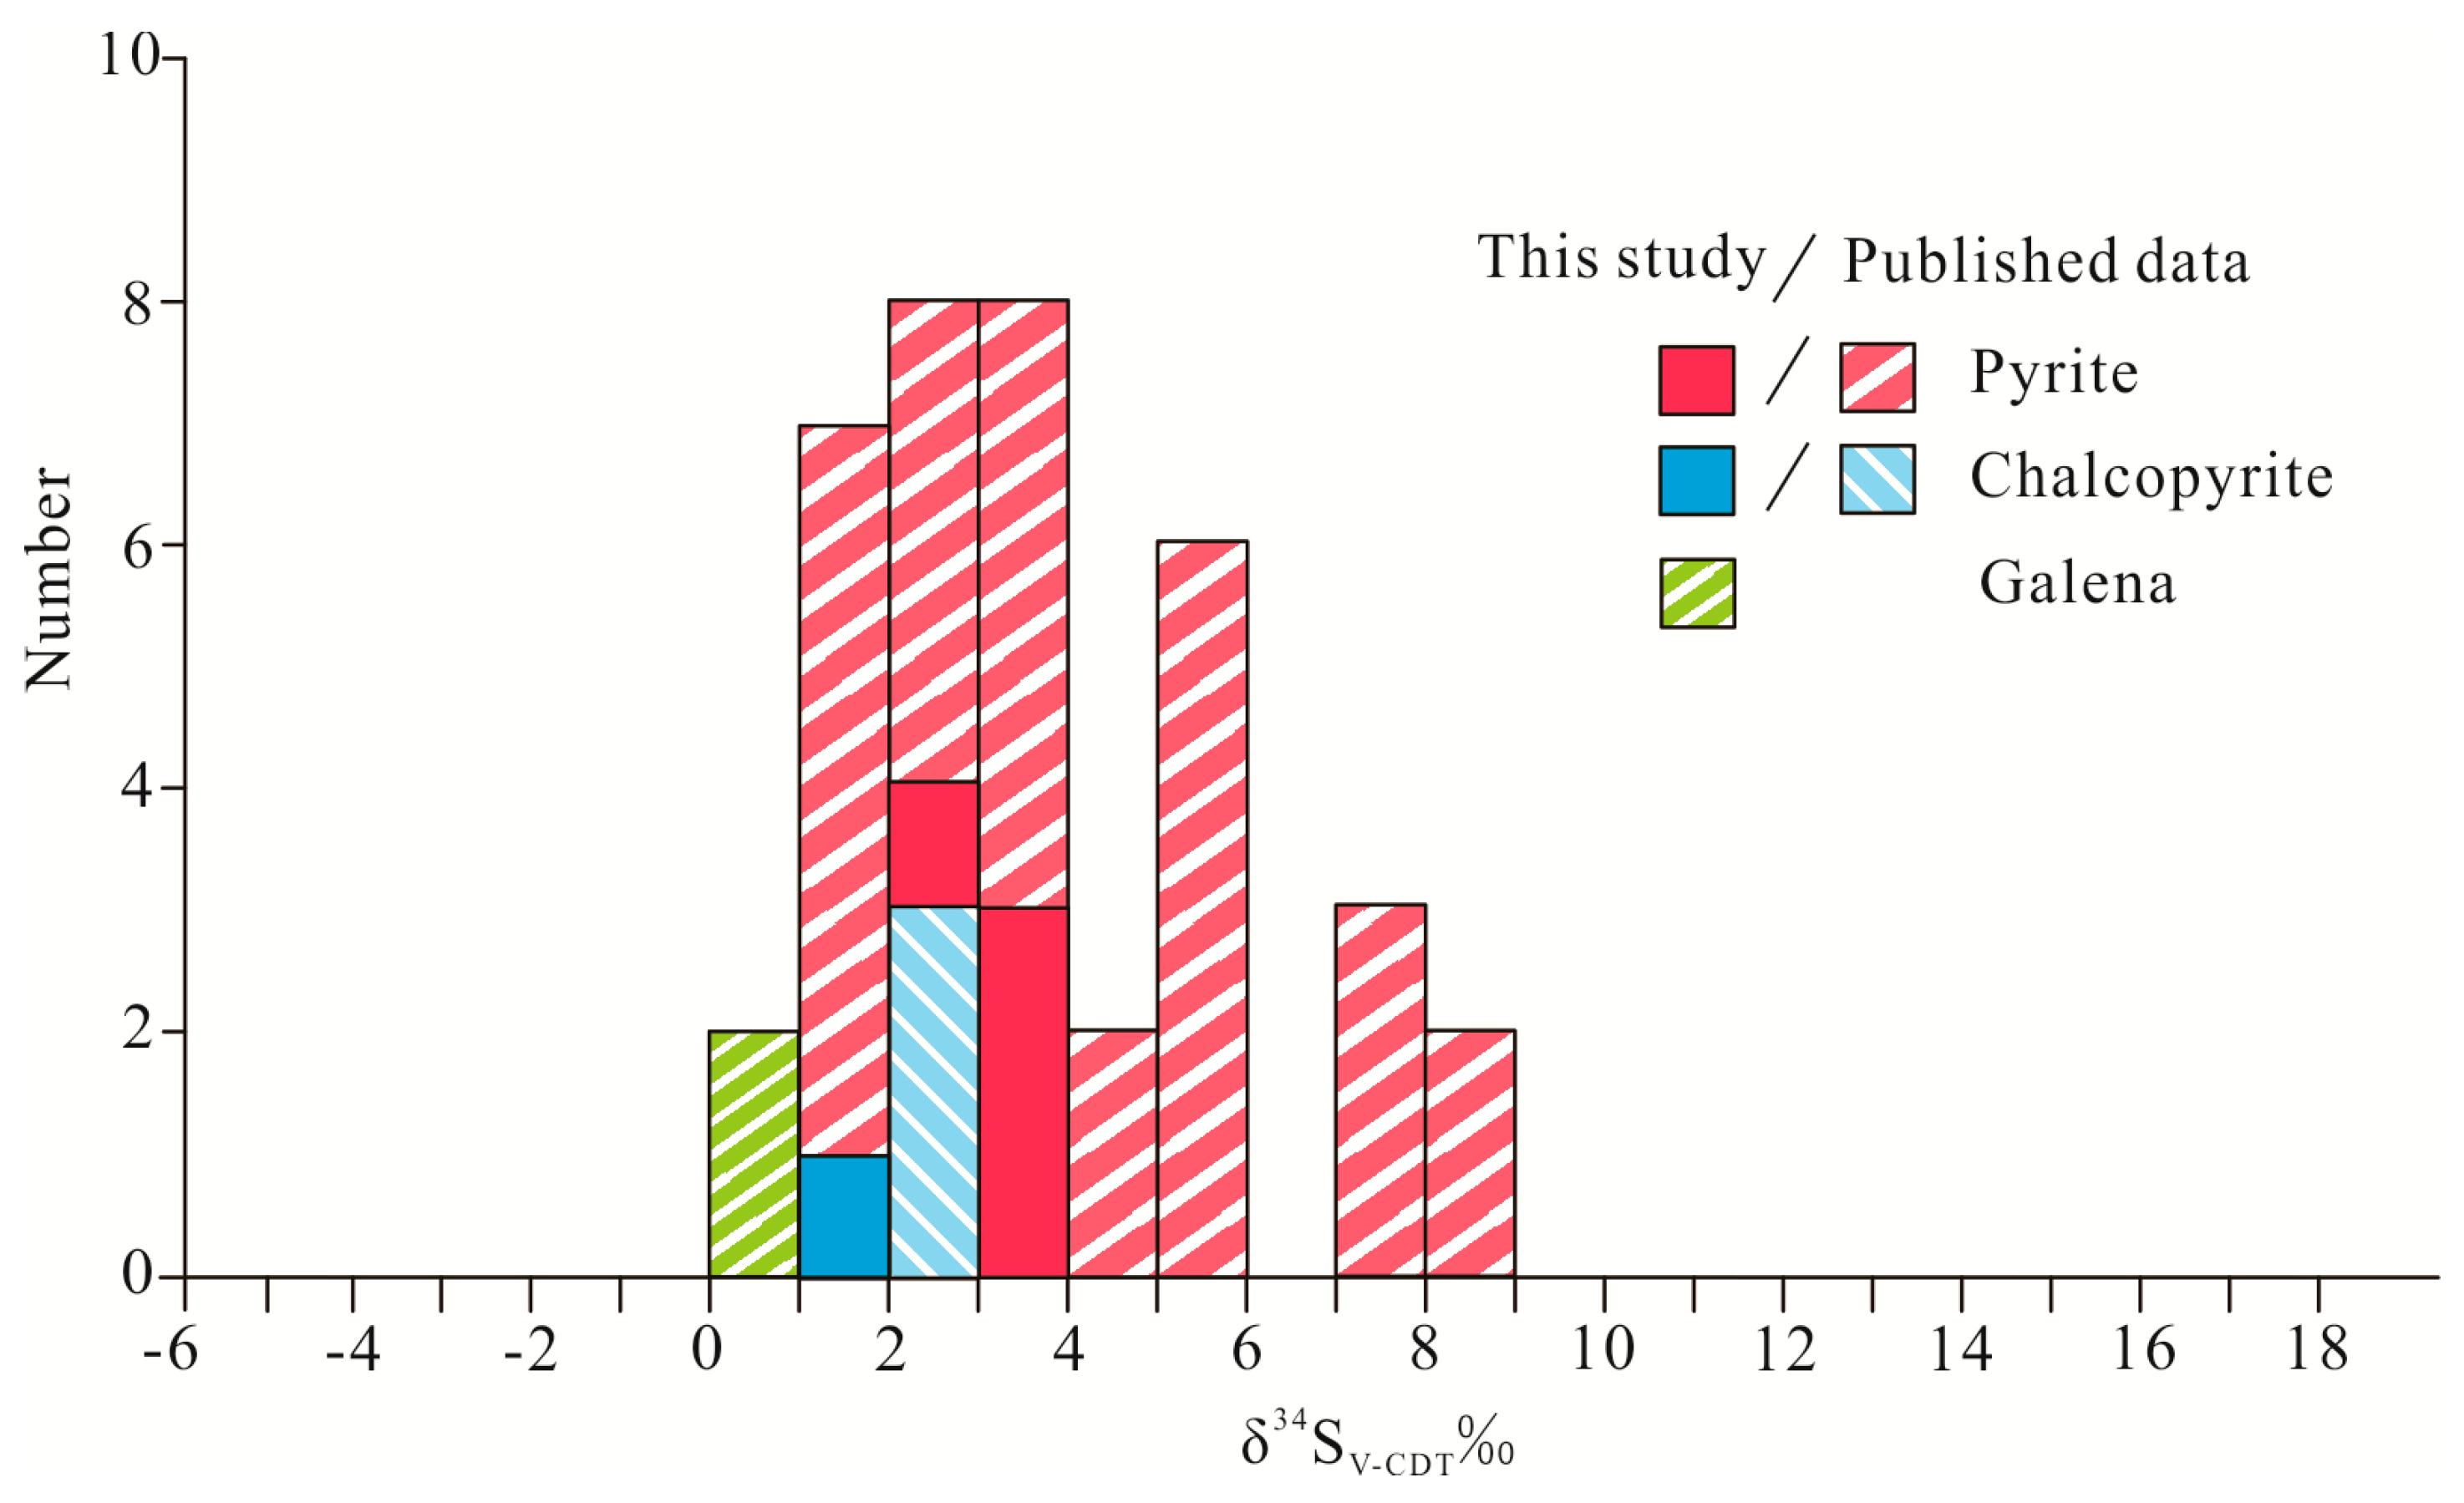
Sulfur isotope analysis was undertaken on pyrite, chalcopyrite, and galena from the Jinchang orebody. All data are reported as δ34SVCDT values. Sulfide minerals from different structural levels of the deposit have δ34SVCDT values between 0.2‰ and 3.5‰ (Table 3), which are consistent with previously published data [9,14,40]. The mean isotopic composition of sulfur in the ore-forming fluid (δ34S∑S) was 1.0‰–2.5‰, as calculated from the δ34Ssulfide values of sulfide minerals and the sulfide–H2S fractionation factor of Ohmoto [41].
5. Discussion
5.1. Fluid Boiling and Pressure Estimates
The Jinchang deposit shows evidence of fluid boiling, which is a type of fluid immiscibility [42]. First, the abundance of V-type FIs in Stages 1−2 indicates significant volumes of the vapor phase during fluid trapping. Second, co-occurring LV- and S-type FIs were found to homogenize at similar temperatures, indicating that they were trapped simultaneously and, therefore, represent a boiling FIA. Partitioning of fluid into vapor-rich and high-salinity fluids was caused by the boiling of parental magmatic fluid. Third, most S2-type FIs are homogenized by the simultaneous disappearance of the vapor phase and daughter minerals.
The Th of the boiling FIA are close to quartz crystallization temperatures and are similar to the temperatures of ore formation in the Jinchang deposit. Trapping pressures can be estimated using the lowest (or lower) Th and salinities of the boiling FIA (LV- and S2-types) in Stages 1–2, and by using the isobar equations of Hedenquist et al. [43] and Redmond et al. [44]. However, S2-type FIs that homogenized by halite disappearance are excluded from this calculation, as they were not trapped from boiling fluids [45,46]. These FIs might have re-equilibrated under higher pressures. A lack of evidence of fluid boiling from the Stage 3 quartz crystals allows only the minimum trapping temperatures and pressures of the late ore-forming fluids to be estimated [47].
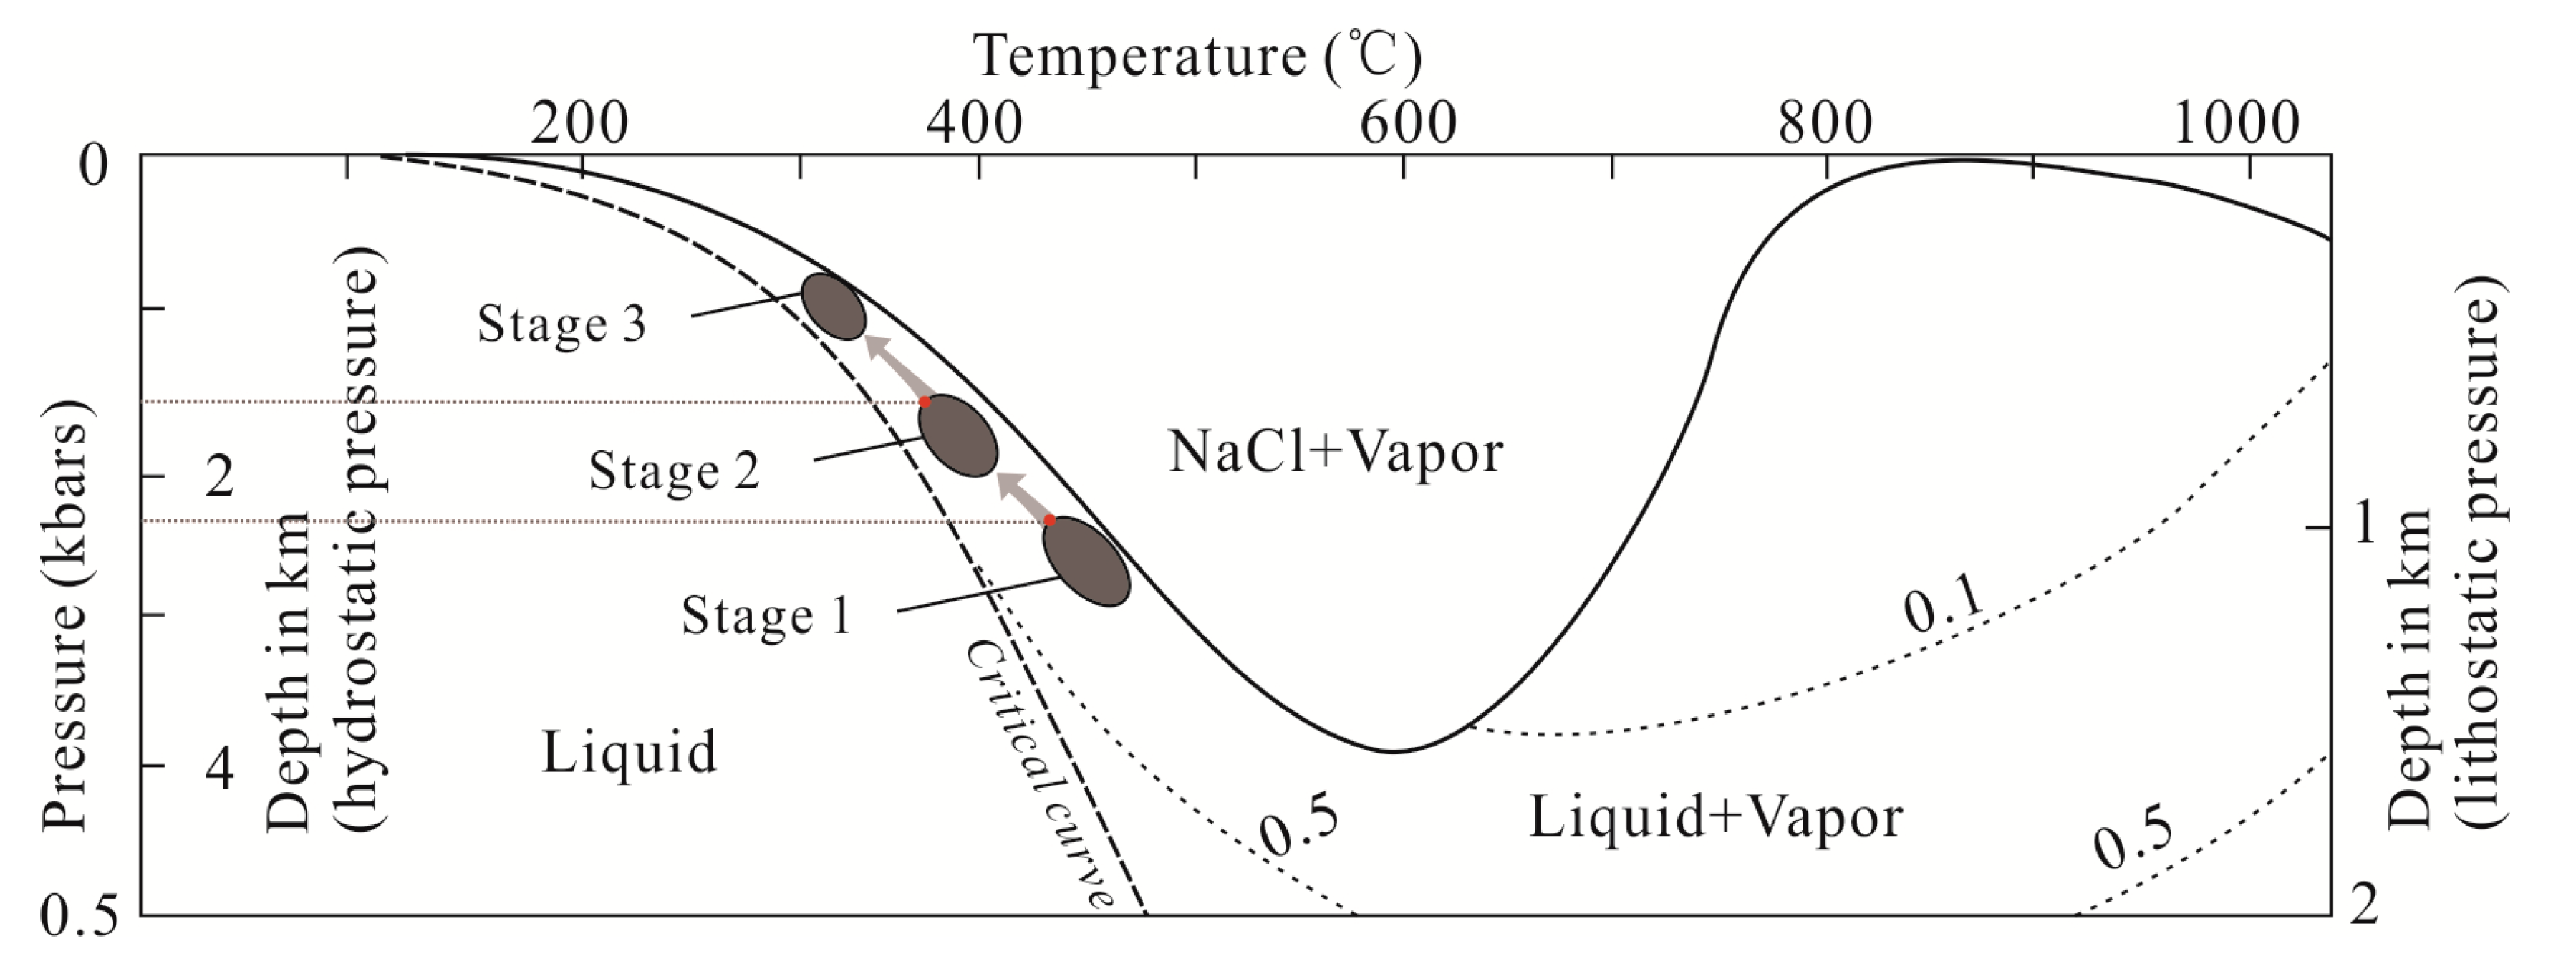
The estimated trapping pressures for the coexisting LV- and S2-type inclusions of Stages 1–2 are 160–220 bar (Figure 9). The mineralized domains have distinct boundaries with the surrounding rocks, indicating that mineralization took place under hydrostatic pressures [43,48]. Assuming hydrostatic pressure, these results suggest that the mineralization occurred mainly at depths of 1.6–2.2 km.
5.2. Source and Evolution of the Hydrothermal Fluid
FI microthermometric data, combined with the different types of inclusion in quartz of Stages 1–3 in the Jinchang deposit, highlight distinct changes in the hydrothermal system over time. These observations suggest that at least two types of fluid with contrasting temperature and salinity were present in the ore-forming system. The likelihood of fluids from different sources coexisting in a single hydrothermal system can be investigated using O and H isotopes.
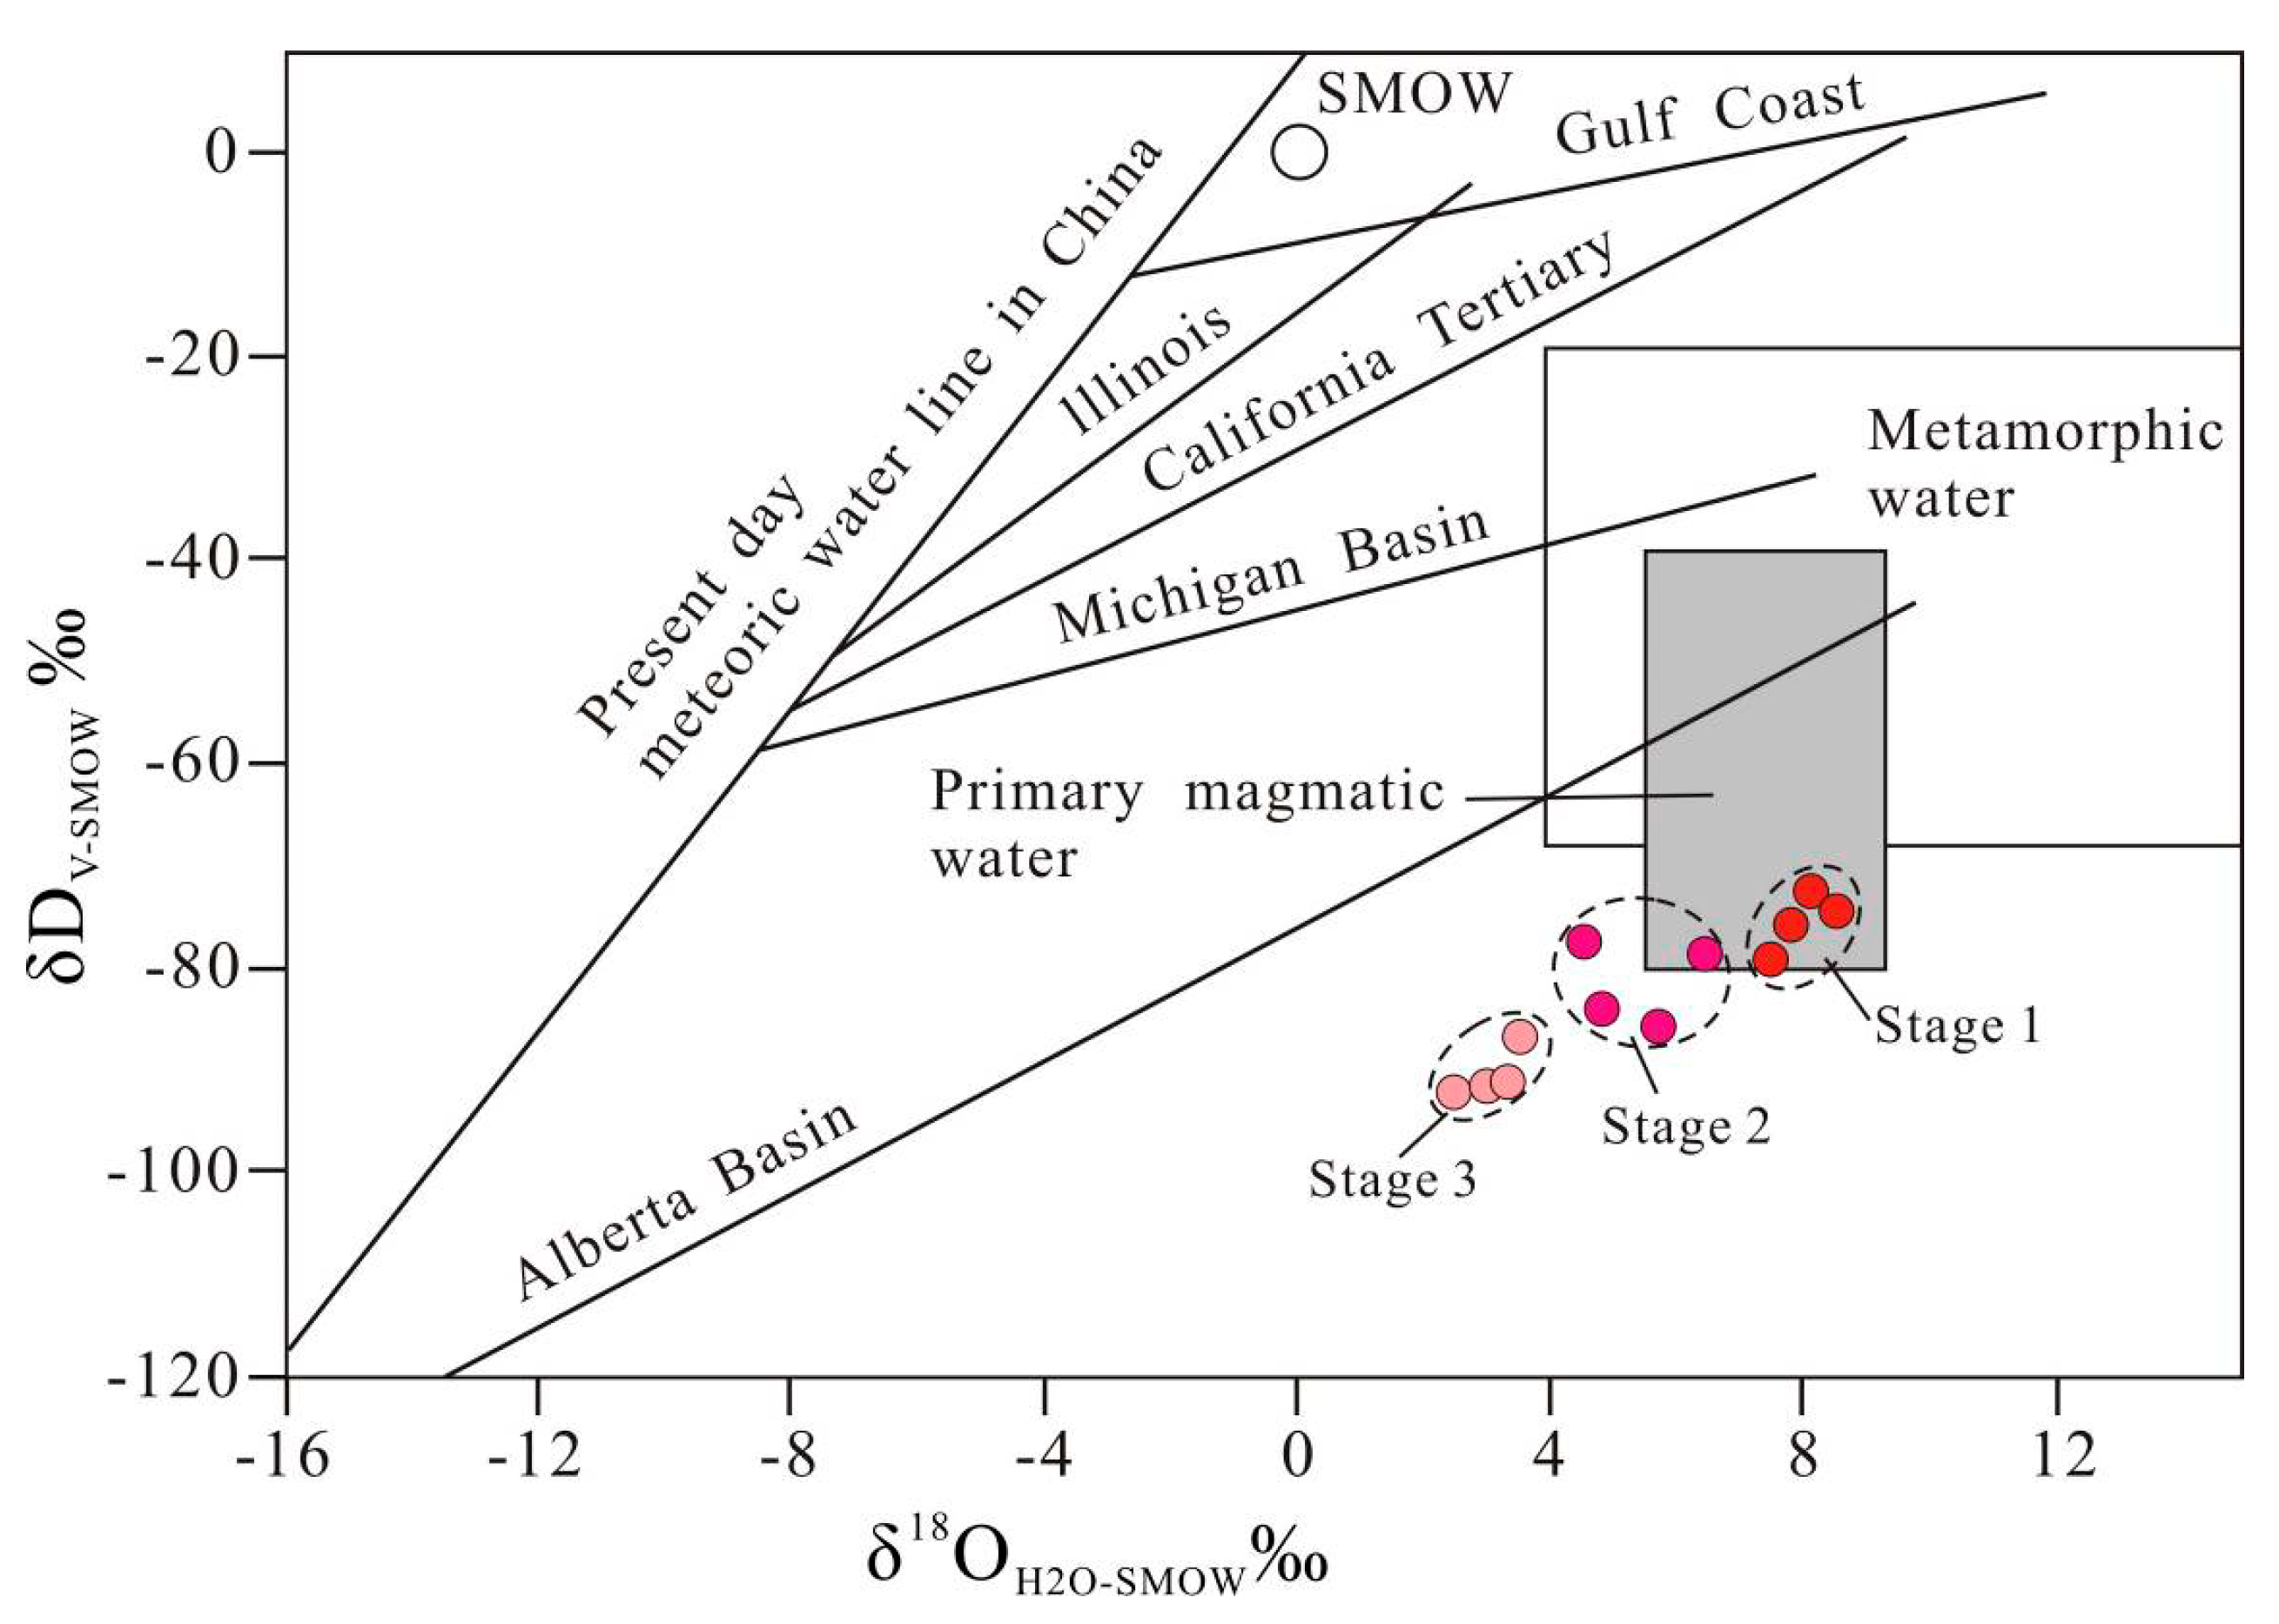
Data for Stage 1 samples plot in the field of primary magmatic water on the δD versus δ18O diagram in Figure 10, suggesting that the ore-forming fluid of the main gold mineralization stage was predominantly magmatic in origin, with no addition of meteoric water.
This inference is supported by the abundance of S1- and V-type inclusions, their high Th (>421 °C), and absence of LV-type FIs. Raman spectroscopy and scanning electron microscope analysis indicate the presence of a wide range of daughter minerals within S1-type inclusions, including NaCl, KCl, quartz, feldspar, pyrite, chalcopyrite, etc. [11,54]. The presence of melt (silicate) and fluid phases in a single inclusion indicates it is typical of a fluid–melt inclusion [55,56,57]. The fluid–melt inclusions represent the intermediate process of silicate melt being converted to a saline solution, and these inclusions have properties that are transitional between those of melt and solution [58]. A cooling and/or decompressing magma will become saturated with respect to an aqueous phase once it reaches the limit of water solubility in the silicate melt, resulting in exsolution of a metal- and volatile-bearing aqueous fluid phase. Saline magmatic fluids, which can attain extremely high concentrations of transition metals, have clear ore-forming potential. These fluids have metal budgets derived almost entirely from their parental magma [59]. When physico-chemical conditions have attained equilibrium (e.g., pressure, temperature, fluid composition, fluid–melt partition coefficients), the potential of a magma to exsolve a more-or-less metal-rich fluid depends primarily on the initial metal concentration in the silicate melt: the richer the magma in metals, the richer the exsolved fluid in metals. As such, the presence of metallic daughter minerals in Stage 1 quartz indicates that the parental magma contained abundant metals. From the above, we suggest that the early ore-forming fluids were hyperthermal magmatic–hydrothermal transitional fluids.
The O–H isotope data for Stage 2 quartz plot adjacent to the primary magmatic water field on the δD versus δ18O plot in Figure 10. Unlike Stage 1, liquid-rich aqueous (LV-type) FIs are observed in the Stage 2 samples. The number of S2-type inclusions is higher than in Stage 1, and S1-type inclusions are rarely observed. These differences might signify the beginning of fluid mixing during mineralization. The most abundant Stage 2 inclusions in the deposit are halite-bearing FIs that typically yield Th of 365−408 °C. These observations suggest that the fluids are solution-dominated intermediate-stage magmatic–hydrothermal ore fluids.
In contrast to Stage 1 and 2 samples, the O–H isotope data for Stage 3 quartz define a clear trend towards the meteoric water line (Figure 10). Only S2- and abundant LV-type FIs are observed in Stage 3 samples, suggesting a low-temperature ore-forming fluid. These features might reflect increasing contributions of meteoric water over time. The Stage 3 inclusions are predominantly liquid-rich FIs with a variable vapor-to-liquid ratio, but also include rare halite-bearing FIs. This observation is consistent with late-stage interaction between a highly evolved magma and meteoric water.
Collectively, the O–H isotope data for the fluids of the Jinchang deposit suggest that the ore fluids were originally derived from exsolved fluids during the magmatic–hydrothermal transition. The ore fluids were subsequently diluted by meteoric water during the final stage of mineralization. The trend of the data parallel to the basinal water lines provides further evidence of mixing.
He–Ar isotopic compositions also provide clues to the fluid source. The FIs in pyrite crystals yielded 3He/4He ratios of 0.13–2.42 and 40Ar/36Ar ratios of 308.9–336.7 [60], indicating that the ore-forming fluids of the Jinchang deposit were a mixture of crust- and mantle-derived fluids. These fluids were subsequently contaminated by meteoric water.
5.3. Source of Ore-Forming Materials
Sulfur isotopes are an important tool for determining the source of metals in ore deposits [11,61,62,63]. Previous studies have reported that the δ34SCDT composition of pyrite in the Jinchang deposit ranges from 1.1‰ to 8.8‰, with an average value of 3.5‰ (n = 38) [9,14,40]. These values are consistent with sulfur being derived from a deep-seated magma source (Figure 11).
In the present study, the δ34S values of sulfides in the Jinchang deposit have a narrow range (0.2‰–3.5‰; n = 12; Figure 11). The Stage 1–3 mineral assemblages lack oxidized phases and sulfate minerals, suggesting that the sulfur present in the hydrothermal fluid was in a reduced form and consequently that the fluid had a low SO42−/H2S ratio [64]. The dominant form of sulfur species was, therefore, H2S, which implies that δ34SH2S = δ34Sfluid. The δ34SVCDT values of H2S (δ34SH2S) in equilibrium with the sulfide minerals were estimated from the δ34SVCDT values of the sulfides and the mineralization temperatures, using the formula of Ohmoto and Goldhaber [65] (A × 106/T2 = δ34SVCDT − δ34SH2S, where T = mineralization temperature, A = equilibrium isotopic fractionation factor, A(pyrite) = 0.40, A(chalcopyrite) = –0.05, and A(galena) = −0.63). For Stages 1–2, we chose the lowest Th of the boiling FIA (428 °C for Stage 1 and 364 °C for Stage 2) to represent the mineralization temperature. For Stage 3, as the range of Th of FIs is limited, we selected the modal value to represent the mineralization temperature. The calculated δ34SH2S values of H2S in the hydrothermal fluids are 1.0–2.5‰ (Table 3). The δ34SVCDT values of sulfides and estimated δ34Sfluid values are broadly consistent with the δ34S values of magmatic–hydrothermal deposits (−3‰ to 3‰) [63,66], suggesting that mantle-derived materials contributed to the mineralization.
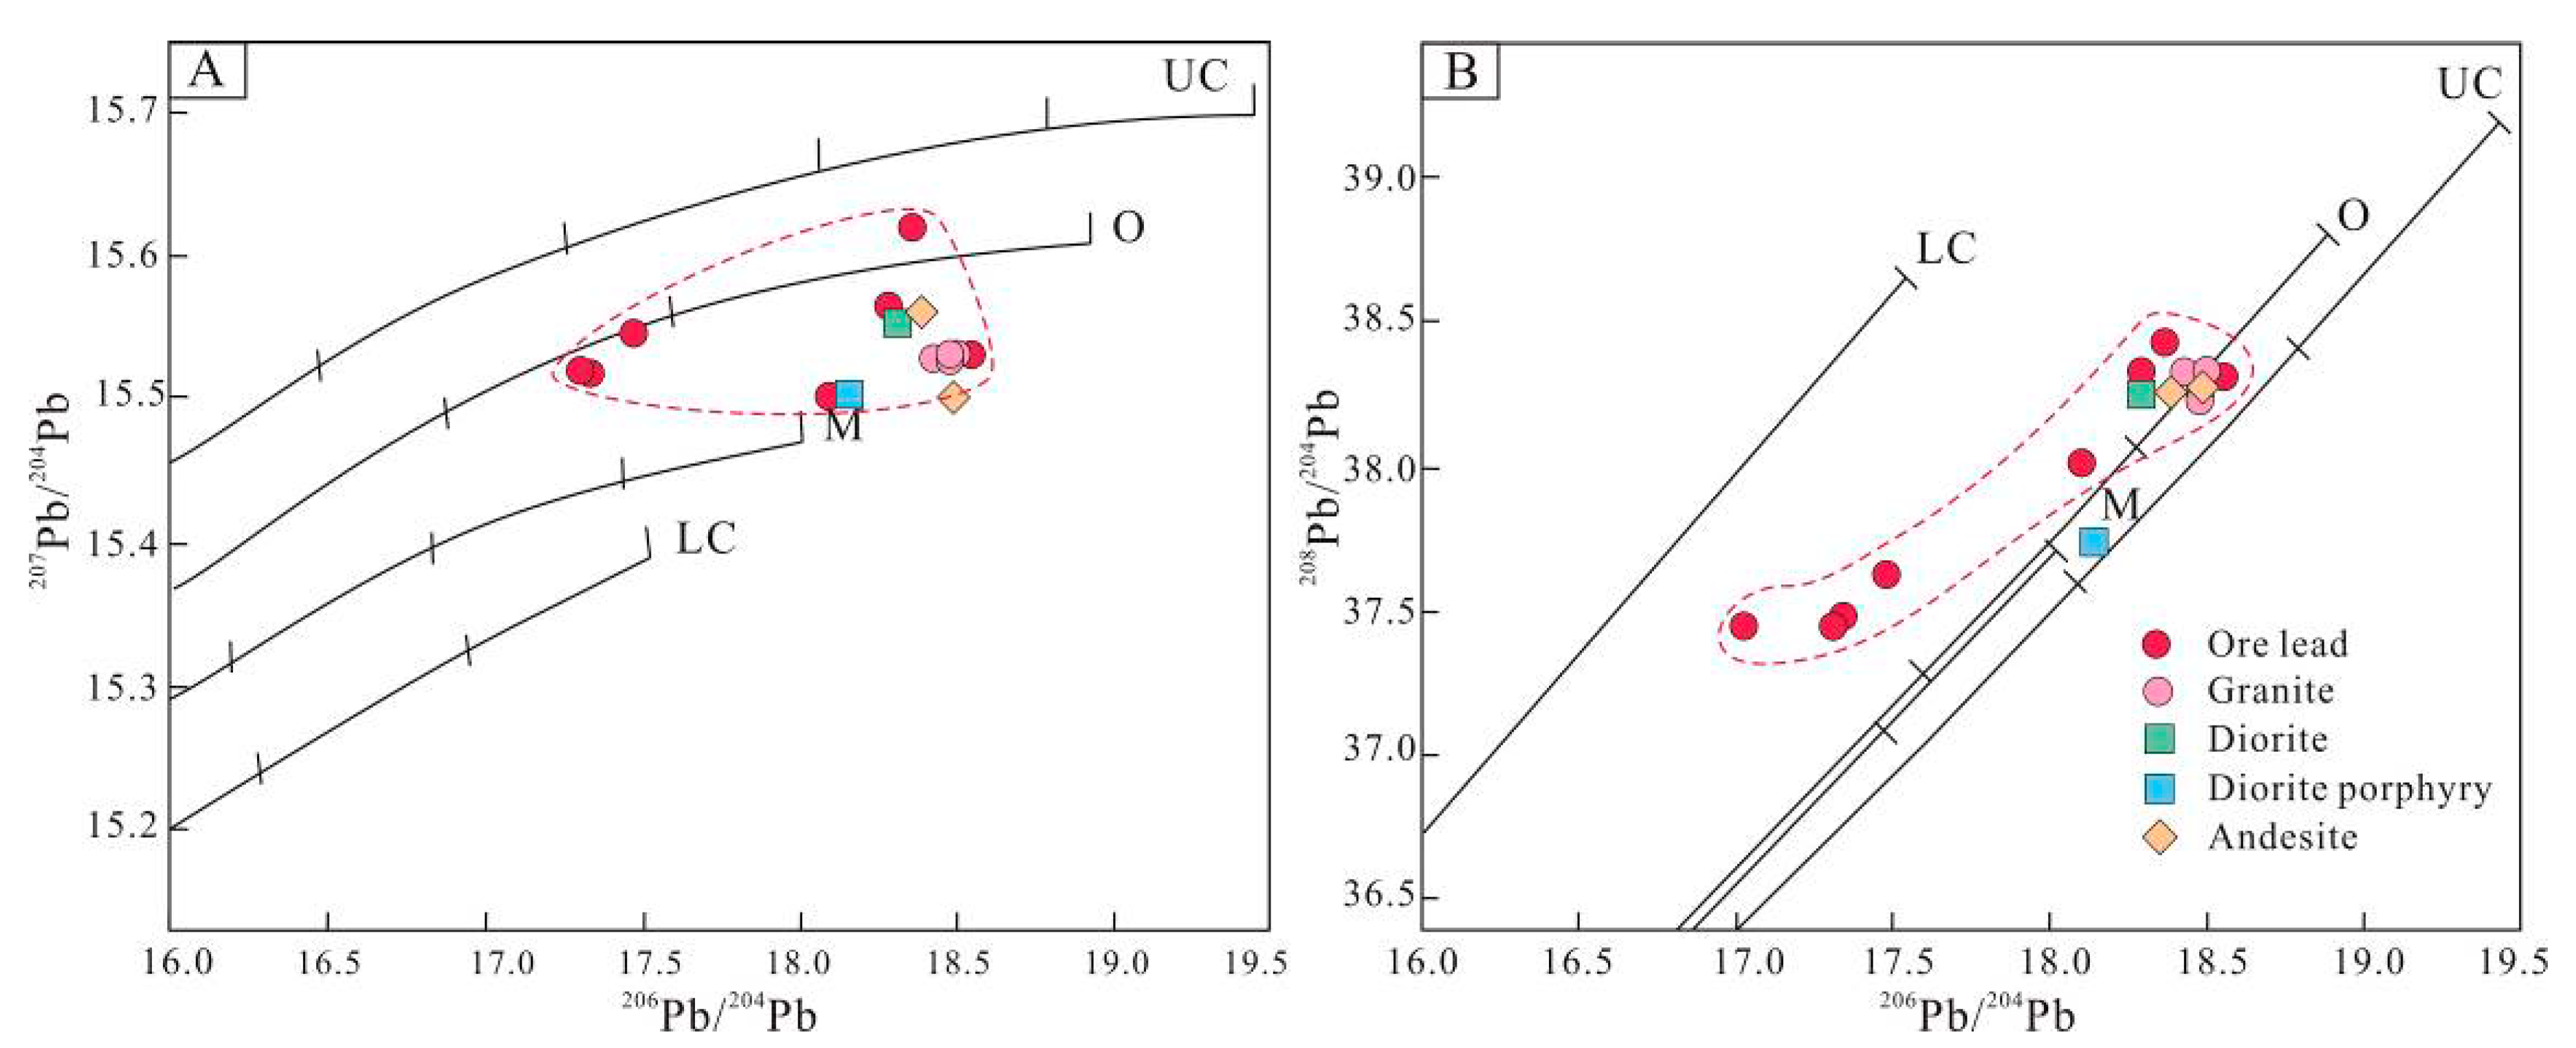
Lead isotopes provide additional constraints on the source of metals in ore deposits [66,67]. A compilation of data for sulfide minerals from the Jinchang deposit yields 206Pb/204Pb, 207Pb/204Pb, and 208Pb/204Pb values of 17.3–18.5, 15.2–15.6, and 37.4–38.4, respectively [9,14]. These data indicate that the sulfide minerals are enriched in uranogenic Pb and depleted in thorogenic Pb. The majority of Pb isotope data for the sulfides cluster between the orogenic and mantle growth curves on the uranogenic plot (Figure 12A). The thorogenic plot in Figure 12B shows that the Pb isotope data for the ore sulfides plot close to the orogenic growth line. We interpret these data to reflect a hybrid crustal–mantle source for the Pb. Existing Pb isotope data for non-mineralized wall-rock in the region [14] are consistent with the composition of ore sulfides from the Jinchang deposit (Figure 12A,B), which suggests that the wall-rock and ore sulfides have a similar Pb source.
The Re–Os isotopic compositions of 15 pyrite samples from breccia, vein, and stockwork mineralization yield Re concentrations of 1185–10,475 ppt and Os concentrations of 3–15 ppt. The 187Re/188Os ratios range from 3527 to 42,853, and the initial 187Os/188Os ratio ranges from 0.04 to 0.60 [18], indicating that the ore-forming materials were a mixture of crust- and mantle-derived fluids.
Based on the S, Pb, O–H, He–Ar, and Re–Os isotope data presented above, we suggest that the ore constituents and hydrothermal fluids of the Jinchang deposit were derived from a mixture of crust and mantle sources.
5.4. Genesis and Metallogenic Model for the Jinchang Deposit
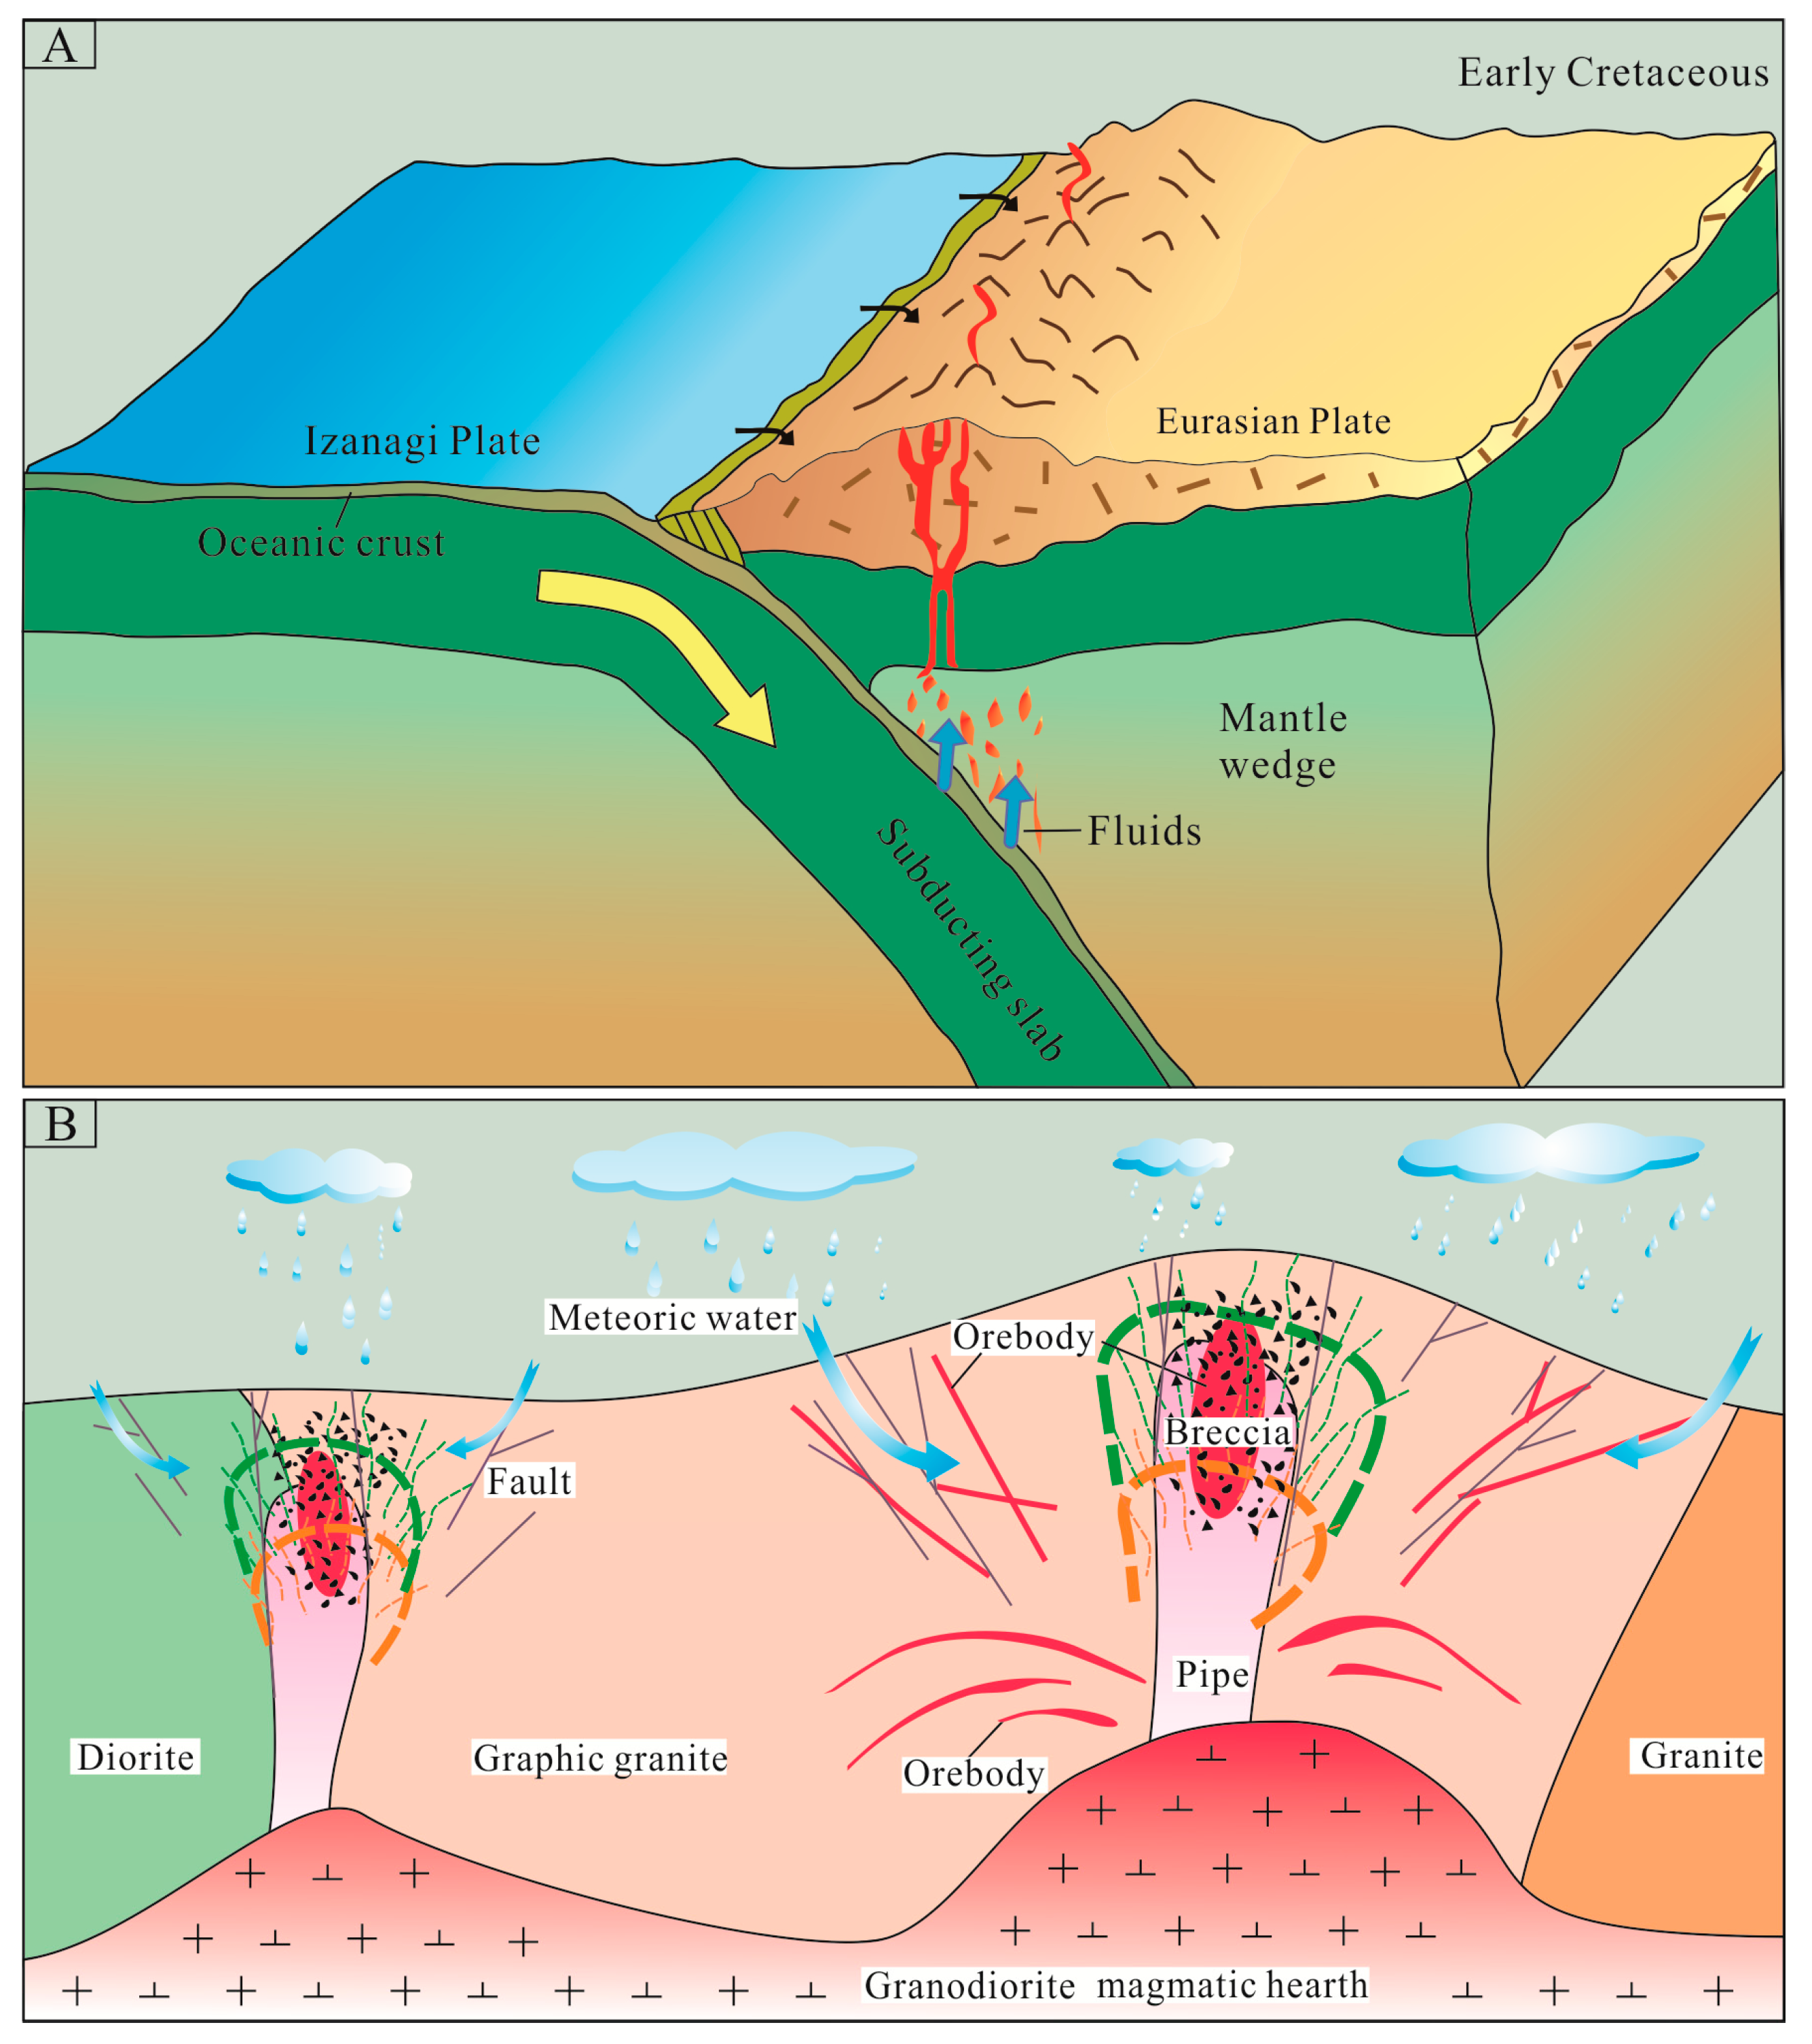
The study area forms part of the Pacific Ocean tectonic domain, and mineralization of the Jinchang deposit occurred during the Early Cretaceous [18]. During this period, the Izanagi Plate was being subducted beneath the Eurasian Plate. Deep subduction of the Izanagi Plate resulted in progressive metamorphism of the oceanic crust, releasing large amounts of fluid that led to partial melting of the mantle wedge (Figure 13A). FI microthermometry data and H–O–S compositions for the Jinchang deposit suggest that the ore-forming fluids and metals were derived from magmas. These magmas, generated by partial melting of a mantle wedge and injected into, or contaminated by, the lower crust during upwelling, were crucial to the formation of the deposit. The magmas released volatiles into the upper crust, generating gold-rich fluids. The close spatial association between orebodies and brittle faults and breccias also indicates that the faults and breccias acted as pathways for the upward flow of deep-seated ore-forming fluids. A magmatic origin is further supported by the broadly similar ages of Au mineralization and magmatism [28].
The early intrusive magmas (209–192 Ma) were viscous, and clogged the magma pathways. This impeded the upwelling of subsequent magmas (106 Ma; granodiorite) and transport of ore-bearing hydrothermal fluids. The temperature and pressure would have gradually increased, resulting in crypto-explosions and the formation of dome structures and ring faults. Instantaneous depressurization of the system would have changed the properties of the ore-forming fluids, thereby initiating the ore-forming process (Figure 13B). Ore precipitation was controlled by cooling and decompression, as fluids were expelled from lithostatic conditions in the magma to hydrostatic conditions closer to the surface, where they interacted with meteoric water to variable degrees [69,70]. Our results also show that low-temperature, meteoric fluids mixed with the deeply sourced magmatic fluids at Jinchang. The upwelling magma provided heat that might have driven the circulation of meteoric fluids. The meteoric fluid could have leached certain ore metals from the surrounding country rock and carried them into the ore-forming system.
Localized depressurization, fluid boiling, and fluid mixing in the Jinchang area led to the breakdown of metal–ligand complexes and precipitation of metallic minerals. William and Bowell [71] proposed two modes of Au migration and precipitation that are represented by the following equations:
Au(s) + 2HS− + H+ + ¼O2 = [Au(HS)2]− + ½H2O
Au(s) + 2Cl− + H+ + ¼O2 = [AuCl2]− + ½H2O
Fluid boiling reduces the pressure of the system, leading to a decrease in the solubility of metal complexes and the precipitation of metallic minerals [72]. During this process, some of the acidic volatile components (e.g., CO2, HCl) are lost, increasing the pH of the solution and thereby accelerating the decomposition of metal complexes and the precipitation of gold [72]. The incorporation of meteoric water may cause the temperature of the mineralizing fluid to drop sharply, leading to a decrease in the solubility of metal complexes and the precipitation of gold. Meteoric water will also decrease the concentrations of HS−, Cl− and H+ in the system, accelerating the reaction and promoting the precipitation of gold.
Extensional structures that formed in the upper crust provided channels for the transport of mineralizing fluids and sites for the precipitation of metallogenic materials. Fluid boiling produces a large amount of volatiles. When the fluid pressure exceeded the pressure of the overlying rocks, crypto-explosions, and fractures occurred. The drop in fluid pressure following upward extension of the fracture, in turn, results in increased effervescence of the magma at depth, increased energy release, and increased rate of gas streaming, all of which may lead to rafting of wall-rock fragments hundreds of meters upward and thereby forming the breccia pipe mineralization [73]. Disseminated mineralization mainly occurred within the phyllic alteration zone adjacent to the granodiorite. Magma intrusion caused ring and radial faults to form around the magma dome, creating space for hydrothermal migration and fault-controlled vein mineralization.
Taking into consideration the ore geology, degree of alteration, types and properties of FIs, and source of ore-forming fluids and materials, we consider that the Jinchang deposit is a typical gold-rich Au–Cu porphyry deposit.
6. Conclusions
- (1)
- Fluid inclusions in Stage 1–3 quartz crystals record a gradual change from a magmatic–hydrothermal transitional fluid to a mixed magmatic–meteoric fluid.
- (2)
- Fluids derived from deep-seated magmas supplied abundant ore-forming materials to the deposit.
- (3)
- Fluid boiling and mixing were able to effectively trigger fluid saturation and deposition of ore minerals.
- (4)
- The Jinchang gold deposit is a typical gold-rich Au–Cu porphyry deposit.
Author Contributions
Conceptualization: S.L.; methodology: X.Z.; software: L.G.; validation: S.L.; formal analysis: X.Z.; investigation: S.L.; resources: S.L.; data curation: S.L.; writing—original draft preparation: S.L.; writing—review and editing: X.Z.; visualization: S.L; supervision: L.G.; project administration: X.Z.; funding acquisition: S.L.
Funding
This work was supported by the China Geological Survey and Chinese Ministry of Science and Technology (2017YFC0601304).
Acknowledgments
We are grateful to the staff of the No. 1 Party of Gold Geology, China People’s Armed Force, for conducting fieldwork in the Jinchang Mine.
Conflicts of Interest
The authors declare no conflict of interest.
References
- Spooner, E.T.C. Fluid inclusion studies of hydrothermal ore deposits. In Short Course in Fluid Inclusion; Hollister, L.S., Crawford, M.L., Eds.; Mineralogical Association of Canada: Ottawa, ON, Canada, 1981; Volume 6, pp. 209–240. [Google Scholar]
- Roedder, E. Fluid inclusions. In Reviews in Mineralogy; Ribbe, P.H., Ed.; Mineralogical Society of America: Chantilly, VA, USA, 1984; Volume 12, p. 644. [Google Scholar]
- Wilkinson, J.J. Fluid inclusions in hydrothermal ore deposits. Lithos 2001, 55, 229–272. [Google Scholar] [CrossRef]
- Li, X.F.; Wang, C.; Hua, R.; Wei, X. Fluid origin and structural enhancement during mineralization of the Jinshan orogenic gold deposit, south china. Miner. Depos. 2010, 45, 583–597. [Google Scholar] [CrossRef]
- Calagari, A.A. Fluid inclusion studies in quartz veinlets in the porphyry copper deposit at sungun, east-azarbaidjan, Iran. J. Asian Earth Sci. 2004, 23, 179–189. [Google Scholar] [CrossRef]
- Izawa, E.; Urashima, Y.; Ibaraki, K.; Suzuki, R.; Yokoyama, T.; Kawasaki, K. The Hishikari gold deposit: High-grade epithermal veins in quaternary volcanics of southern Kyushu, Japan. J. Geochem. Explor. 1990, 36, 1–56. [Google Scholar] [CrossRef]
- Etoh, J.; Izawa, E.; Taguchi, S. A fluid inclusion study on columnar adularia from the Hishikari low-sulfidation epithermal gold deposit, Japan. Resour. Geol. 2010, 52, 73–78. [Google Scholar] [CrossRef]
- Kesler, S.E.; Appold, M.S.; Martini, A.M.; Walter, L.M.; Huston, T.J.; Kyle, J.R. Na-Cl-Br systematics of mineralizing brines in Mississippi Valley–Type deposits. Geology 1995, 23, 641–644. [Google Scholar] [CrossRef]
- Jia, G.Z.; Chen, J.R.; Yang, Z.G.; Bian, H.Y.; Wang, Y.Z.; Liang, H.J.; Jin, T.H.; Li, Z.H. Geology and genesis of the superlarge Jinchang gold deposit. Acta Geol. Sin. 2005, 79, 661–670, (In Chinese with English Abstract). [Google Scholar]
- Zhang, D.H.; Wang, Y.; Wang, D.; Xu, W.X.; Wang, Y.Z.; Zhang, W.Z. Geochemistry of ore forming fluids and genesis of gold ore bodies in the dome-shaped magmatic body-hosted Jinchang gold deposit, Heilongjiang province. Miner. Depos. 2006, 25, 155–158, (In Chinese with English Abstract). [Google Scholar]
- Wang, Y.; Xi, B.B.; Zhang, D.H.; Zhang, W.H. Geochemical characteristics of fluid inclusions in Jinchang gold deposit, Heilongjiang Province. Miner. Depos. 2007, 26, 184–194, (In Chinese with English Abstract). [Google Scholar]
- Zhao, Y.S.; Yang, L.Q.; Chen, Y.F.; Qing, M.; Yan, J.P.; Ge, L.S. Geochemisry and zircon U-Pb geochronology of the diorite porphyry associated with the Jinchang Cu-Au deposit, Heilongjiang Province. Acta Petrol. Sin. 2012, 28, 451–467, (In Chinese with English Abstract). [Google Scholar]
- Liu, L.D.; Li, Y.; Lan, X. A discussion on breccia/stockwork-porphyry type gold deposits. Miner. Depos. 1999, 18, 29–36, (In Chinese with English Abstract). [Google Scholar]
- Mu, T.; Liu, G.G.; Xu, K.C. The geological-geochemical characteristics and ore genesis of Jinchang gold deposit in Heilongjiang. Gold Geol. 2000, 6, 57–64, (In Chinese with English Abstract). [Google Scholar]
- Zhu, C.W.; Chen, J.R.; Li, T.G.; Cui, B.; Jin, B.Y.; Wang, K.Q. Geology and ore genesis of the Jinchang gold deposit, Heilongjiang province. Miner. Depos. 2003, 22, 56–64, (In Chinese with English Abstract). [Google Scholar]
- Zhang, D.H.; Wang, Y.; Wang, D.; Xu, W.X.; Wang, Y.Z.; Zhang, W.H. Geochemical characters of fluid inclusions of the orebody in the magma domal structure and the argument on the genesis of the deposit in Jinchang gold deposit, Heilongjiang. Miner. Depos. 2006, S1, 155–158, (In Chinese with English Abstract). [Google Scholar]
- Zhang, Y.; Lai, Y.; Qing, M.; Wang, Y.Z.; Xu, J.J. Ore fluid geochemistry of J0 orebody, Jinchang gold deposit, Heilongjiang province China. Acta Petrol. Sin. 2008, 24, 1131–1144, (In Chinese with English Abstract). [Google Scholar]
- Li, S.D.; Wang, Z.G.; Wang, K.Y.; Cai, W.Y.; Peng, D.W.; Xiao, L.; Li, J. Re–Os Pyrite Geochronological Evidence of Three Mineralization Styles within the Jinchang Gold Deposit, Yanji–Dongning Metallogenic Belt, Northeast China. Minerals 2018, 8, 448. [Google Scholar] [CrossRef]
- Zhang, H.F.; Li, S.R.; Santosh, M.; Liu, J.J.; Diwu, C.R.; Zhang, H. Magmatism and metallogeny associated with mantle upwelling: zircon U–Pb and Lu–Hf constraints from the gold-mineralized Jinchang granite, NE China. Ore Geol. Rev. 2013, 54, 138–156. [Google Scholar] [CrossRef]
- Chen, J.R.; Li, H.G.; Jin, B.Y.; Wu, Y.H.; Wang, Y.Z.; Yu, W.Q. Geological features and the deep metallogenic forecast of the No. J-1 gold body in the Jinchang gold deposit, Heilongjiang. Gold Geol. 2002, 8, 8–12, (In Chinese with English Abstract). [Google Scholar]
- Zhang, Y.B.; Wu, F.Y.; Wilde, S.A.; Zhai, M.G.; Lu, X.P. Zircon U–Pb ages and tectonic implications of Early Paleozoic granitoids at Yanbian, Jilin Province, northeast China. Isl. Arc. 2004, 13, 484–505. [Google Scholar] [CrossRef]
- Wu, F.Y.; Sun, D.Y.; Ge, W.C.; Zhang, Y.B.; Grant, M.L.; Wilde, S.A.; Jahn, B.M. Geochronology of the Phanerozoic granitoids in northeastern China. J. Asian Earth Sci. 2011, 41, 1–30. [Google Scholar] [CrossRef]
- Zhao, Y.S. Porphyry Gold System of the Jinchang Camp in the Yanbian-Dongning Metallogenic Belt, NE China. Ph.D. Thesis, China University of Geosciences, Beijing, China, 2013. [Google Scholar]
- Lu, Y.H.; Zhang, Y.; Lai, Y.; Wang, Y.Z. LA–ICP-MS zircon U–Pb dating of magmatism and mineralization in the Jinchang gold ore-field, Heilongjiang province. Acta Petrol. Sin. 2009, 25, 2902–2912, (In Chinese with English Abstract). [Google Scholar]
- Zhang, H.F. Wall-Rock Alteration, Mineralization Time and Deposit Type of the Jinchang Gold Deposit from Dongning, Heilongjiang Province, China; Post-Doctor Research Report; China University of Geosciences: Beijing, China, 2007. [Google Scholar]
- Xu, W.X. Geological Characters, Metallogeic Regularity and Model of the Gold (Copper) Ore Fields in Jinchang, Heilongjiang Province. Ph.D. Thesis, China University of Geosciences, Beijing, China, 2009. [Google Scholar]
- Han, S.J. Metallogenic Epoch and Its Geodynamic Significance of the Jinchang Gold Deposit, Heilongjiang Province. M.Sc. Thesis, Jilin University, Changchun, China, 2010. [Google Scholar]
- Wang, Z.G. Mineralization and Metallogenic Prediction of Jinchang Cu-Au Deposit in Dongning, Heilongjiang Province. Ph.D. Thesis, Jilin University, Changchun, China, 2018. [Google Scholar]
- Lowell, J.D.; Guilbert, J.M. Lateral and vertical alteration-mineralization zoning in porphyry ore deposits. Econ. Geol. 1970, 65, 373–408. [Google Scholar] [CrossRef]
- Qing, M.; Tang, M.G.; Xiao, L.; Zhao, Y.S.; Han, X.J. Automatic Laser Probe 40Ar/39Ar isochron ages of the quatrz and sphalerite from the Jinchang gold deposit, Dongning County, Heilongjiang Province, and their prospecting implications. Geol. Prospect 2012, 48, 991–999. (In Chinese) [Google Scholar]
- Zhang, P.; Huang, X.W.; Cui, B.; Wang, B.C.; Yin, Y.F.; Wang, J.R. Re-Os isotopic and trace element compositions of pyrite and origin of the Cretaceous Jinchang porphyry Cu-Au deposit, Heilongjiang Province, NE China. J. Asian Earth Sci. 2016, 129, 67–80. [Google Scholar] [CrossRef]
- Goldstein, R.H.; Reynolds, T.J. Systematics of Fluid Inclusions in Diagenetic Minerals; SEPM: Tulsa, OK, USA, 1994; Volume 31, p. 199. [Google Scholar]
- Bodnar, R.J. Revised equation and table for determining the freezing point depression of H2O–NaCl solutions. Geochim. Cosmochim. Acta 1993, 57, 683–684. [Google Scholar] [CrossRef]
- Bodnar, R.J.; Vityk, M.O. Interpretation of microthermometric data for H2O-NaCl fluid inclusions. In Fluid Inclusions in Minerals: Methods and Applications; Virginia Tech: Blackberg, VA, USA, 1994; Volume 9, pp. 117–130. [Google Scholar]
- Clayton, R.N.; Mayeda, T.K. The use of bromine pentafluoride in the extraction of oxygen from oxides and silicates for isotopic analysis. Geochim. Cosmochim. Acta 1963, 27, 43–52. [Google Scholar] [CrossRef]
- Robinson, B.W.; Kusakabe, M. Quantitative preparation of sulfur dioxide, for 34S/32S analyses, from sulfides by combustion with cuprous oxide. Anal. Chem. 1975, 47, 1179–1181. [Google Scholar] [CrossRef]
- Hollister, L.S.; Burruss, R.C. Phase equilibria in fluid inclusions from the Khtada Lake metamorphic complex. Geochim. Cosmochim. Acta 1976, 40, 163–175. [Google Scholar] [CrossRef]
- Goldstein, R.H. Petrographic analysis of fluid inclusions. In Fluid Inclusions: Analysis and Interpretation; Mineralogical Association of Canada: Ottawa, ON, Canada, 2003; Volume 32, pp. 9–53. [Google Scholar]
- Clayton, R.N.; O’Neil, J.R.; Mayeda, T.K. Oxygen isotope exchange between quartz and water. J. Geophys. Res. 1972, 77, 3057–3067. [Google Scholar] [CrossRef]
- Li, Z.Z.; Li, S.R.; Zhang, H.F. Wall rock alteration and metallogenic chronology of Jinchang gold deposit in Dongning County, Heilongjiang Province. Miner. Depos. 2009, 1, 83–92, (In Chinese with English Abstract). [Google Scholar]
- Ohmoto, H. Systematics of Sulfur and Carbon Isotopes in Hydrothermal Ore Deposits. Econ. Geol. 1972, 67, 551–578. [Google Scholar] [CrossRef]
- Ramboz, C.; Pichavant, M.; Weisbrod, A. Fluid immiscibility in natural processes: Use and misuse of fluid inclusion data: II. Interpretation of fluid inclusion data in terms of immiscibility. Chem. Geol. 1982, 37, 29–48. [Google Scholar] [CrossRef]
- Hedenquist, J.W.; Arribas, A.; Reynolds, T.J. Evolution of an intrusion-centered hydrothermal system; Far Southeast-Lepanto porphyry and epithermal Cu-Au deposits, Philippines. Econ. Geol. 1998, 93, 373–404. [Google Scholar] [CrossRef]
- Redmond, P.B.; Einaudi, M.T.; Inan, E.E.; Landtwing, M.R.; Heinrich, C.A. Copper deposition by fluid cooling in intrusion-centered systems: New insights from the Bingham porphyry ore deposits, Utah. Geology 2004, 32, 217–220. [Google Scholar] [CrossRef]
- Audétat, A.; Günther, D. Mobility and H2O loss from fluid inclusions in natural quartz crystals. Contrib. Mineral. Petr. 1999, 137, 1–14. [Google Scholar] [CrossRef]
- Becker, S.P.; Fall, A.; Bodnar, R.J. Synthetic fluid inclusions. XVII PVTX properties of high salinity H2O-NaCl soluitons (>30 wt% NaCl): Application to fluid inclusion that homogenize by disappearance from porphyry copper and other hydrothermal ore deposits. Econ. Geol. 2008, 103, 539–544. [Google Scholar] [CrossRef]
- Zhu, J.J.; Hu, R.Z.; Richards, J.P.; Bi, X.W.; Zhong, H. Genesis and magmatic-hydrothermal evolution of the Yangla skarn Cu deposit, Southwest China. Econ. Geol. 2015, 110, 631–652. [Google Scholar] [CrossRef]
- Siahcheshm, K.; Calagari, A.A.; Abedini, A. Hydrothermal evolution in the Maher–Abad porphyry Cu–Au deposit, SW Birjand, Eastern Iran: Evidence from fluid inclusions. Ore Geol. Rev. 2014, 58, 1–13. [Google Scholar] [CrossRef]
- Clayton, R.N.; Friedman, I.; Graf, D.L.; Mayeda, T.K.; Meents, W.F.; Shimp, N.F. The origin of saline formation waters: 1. Isotopic composition. J. Geophys. Res. Atmos. 1966, 71, 3869–3882. [Google Scholar] [CrossRef]
- Hitchon, B.; Friedman, I. Geochemistry and origin of formation waters in the western Canada sedimentary basin-I. Stable isotopes of hydrogen and oxygen. Geochim. Cosmochim. Acta 1969, 33, 1321–1349. [Google Scholar] [CrossRef]
- Kharaka, Y.K.; Berry, F.A.F.; Friedman, I. Isotopic composition of oil-field brines from Kettleman North Dome, California, and their geologic implications. Geochim. Cosmochim. Acta 1973, 37, 1899–1908. [Google Scholar] [CrossRef]
- Taylor, H.P. The application of oxygen and hydrogen isotope studies to problems of hydrothermal alteration and ore deposition. Econ. Geol. 1974, 69, 843–883. [Google Scholar] [CrossRef]
- Chen, J.; Wang, H.N. Geochemistry; Science Press: Beijing, China, 2004. (In Chinese) [Google Scholar]
- Wang, K.Y.; Qing, M.; Zhang, X.N.; Wan, D.; Xiao, L. Study on the characteristics of fluid inclusions and metallogenic evolution of Jinchang gold deposit, Heilongjiang Province. Acta Petrol. Sin. 2011, 27, 1275–1286, (In Chinese with English Abstract). [Google Scholar]
- Bureau, H.; Métrich, N.; Pineau, F.; Semet, M.P. Magma–conduit interaction at Piton de la fournaise volcano (Réunion island): A melt and fluid inclusion study. J. Volcanol. Geoth. Res. 1998, 84, 39–60. [Google Scholar] [CrossRef]
- Wang, L.; Wang, J.; Wang, Y.; Mao, Q. Fluid-melt inclusions in fluorite of the Huanggangliang skarn iron-tin deposit and their significance to mineralization. Acta Geol. Sin. 2010, 75, 204–211. [Google Scholar]
- Xie, Y.L.; Hou, Z.; Yin, S.; Dominy, S.C.; Xu, J.; Tian, S. Continuous carbonatitic melt—fluid evolution of a ree mineralization system: Evidence from inclusions in the Maoniuping ree deposit, western Sichuan, China. Ore Geol. Rev. 2009, 36, 90–105. [Google Scholar] [CrossRef]
- Hedenquist, J.W.; Lowenstern, J.B. The role of magmas in the formation of hydrothermal ore deposits. Nature 1994, 370, 519–527. [Google Scholar] [CrossRef]
- Cline, J.S.; Bodnar, R.J. Can economic porphyry copper mineralization be generated by a typical calc-alkaline melt? JGR Solid Earth 1991, 96, 8113–8126. [Google Scholar] [CrossRef]
- Yu, B.; Zeng, Q.; Wang, Y.; He, H.; Su, F. The Sources of Ore-forming Fluids from the Jinchang Gold Deposit, Heilongjiang Province, NE China: Constraints from the He–Ar Isotopic Evidence. Resour. Geol 2017, 67, 330–340. [Google Scholar] [CrossRef]
- Doe, B.; Stacey, J. The application of lead isotopes to the problems of ore genesis and ore prospect evaluation: A review. Econ. Geol. 1974, 9, 757–776. [Google Scholar] [CrossRef]
- Rye, R.O.; Ohmoto, H. Sulfur and carbon isotopes and ore genesis: A review. Econ. Geol. 1974, 69, 826–842. [Google Scholar] [CrossRef]
- Hoefs, J. Stable Isotope Geochemistry, 6th ed.; Springer: Berlin, Germany, 2009. [Google Scholar]
- Bastrakov, E.N.; Skirrow, R.G.; Davidson, G.J. Fluid evolution and origins of iron oxide Cu-Au prospects in the Olympic Dam district, Gawler craton, South Australia. Econ. Geol. 2007, 102, 1415–1440. [Google Scholar] [CrossRef]
- Ohmoto, H.; Goldhaber, M. Sulphur and carbon isotopes. In Geochemistry of Hydrothermal Ore Deposits; Barnes, H.L., Ed.; Wiley: New York, NY, USA, 1997; pp. 517–611. [Google Scholar]
- Ohmoto, H.; Rye, R.O. Isotopes of Sulfur and Carbon; John Wiley and Sons: New York, NY, USA, 1979. [Google Scholar]
- Zartman, R.E.; Doe, B.R. Plumbotectonics-The model. Tectonophysics 1981, 75, 135–162. [Google Scholar] [CrossRef]
- Sun, J.G.; Zhang, Y.; Xing, S.W.; Zhao, K.Q.; Zhang, Z.J.; Bai, L.A.; Ma, Y.B.; Liu, Y.S. Genetic types, ore-forming age and geodynamic setting of endogenic molybdenum deposits in the eastern edge of Xing-Meng orogenic belt. Acta Petrol. Sin. 2012, 28, 1317–1332, (In Chinese with English Abstract). [Google Scholar]
- Fournier, R.O. Hydrothermal processes related to movement of fluid from plastic into brittle rock in the magmatic-epithermal environment. Econ. Geol. 1999, 94, 1193–1211. [Google Scholar] [CrossRef]
- Weis, P.; Driesner, T.; Heinrich, C.A. Porphyry-copper ore shells form at stable pressure-temperature fronts within dynamic fluid plumes. Science 2012, 338, 1613–1616. [Google Scholar] [CrossRef]
- Williams, A.E.; Bowell, R.J. Gold in solution. Elements 2009, 5, 281–287. [Google Scholar] [CrossRef]
- Drummond, S.E.; Ohmoto, H. Chemical evolution and mineral deposition in boiling hydrothermal systems. Econ. Geol. 1985, 80, 126–147. [Google Scholar] [CrossRef]
- Burnham, C.W. Energy release in subvolcanic environments; implications for breccia formation. Econ. Geol. 1985, 80, 1515–1522. [Google Scholar] [CrossRef]
Figure 1.
(A) Simplified tectonic map of northeast China [19]. (B) Regional geological sketch map (after Zhang et al. [19]. Ages of igneous rocks are annotated on the map).

Figure 2.
Geological map of the Jinchang gold–copper deposit (ages of igneous rocks are annotated on the map) [18].
Figure 2.
Geological map of the Jinchang gold–copper deposit (ages of igneous rocks are annotated on the map) [18].

Figure 3.
(A) Geological sections of the different orebodies. (B) Alteration patterns of breccia-hosted orebody [19]. (C) Alteration patterns of disseminated orebody [19]. (D) Alteration patterns of vein-type orebody [19].

Figure 4.
Photographs of ore from the Jinchang deposit. (A–B) Breccia-hosted ore; (C) breccia-hosted ore cross-cut by a quartz–pyrite–chalcopyrite vein; (D) veinlets and stockwork–vein mineralization; (E) quartz–pyrite–chalcopyrite veinlet; (F) fault–controlled orebody; and (G,H) quartz–pyrite–galena–(sphalerite) vein. Abbreviations: Brec, breccia; Qz, quartz; Py, pyrite; Ccp, chalcopyrite; Gn, galena; Sp, sphalerite.

Figure 5.
Photomicrographs of key mineral assemblages in the Jinchang deposit. (A) Subhedral pyrite replaced by sphalerite; (B) native gold in pyrite; (C) pyrite cross-cut by chalcopyrite; (D) chalcopyrite–molybdenite assemblage; (E) pyrite–sphalerite veinlet; (F) pyrite–chalcopyrite–galena assemblage. Abbreviations: Py, pyrite; Ccp, chalcopyrite; Gn, galena; Sp, sphalerite; Mol, molybdenite; Au, gold.

Figure 6.
Mineral paragenesis for the Jinchang deposit.

Figure 7.
Photomicrographs of fluid inclusions in Stage 1–3 quartz crystals from the Jinchang gold–copper deposit. (A–D) S1-, S2-, and V-type FIs in Stage 1 quartz grains; (E,F) S2-, V-, and LV-type FIs in Stage 2 quartz grains; (G,H) S2- and LV-type FIs in Stage 3 quartz grains. Abbreviations: L, liquid phase; V, vapor phase; S, daughter mineral.

Figure 8.
Histograms of microthermometric data for fluid inclusions in hydrothermal quartz from the Jinchang deposit. (A) Homogenization temperatures of S1-, S2-, and V-type FIs in Stage 1 quartz; (B) salinity data for S2- and V-type FIs in Stage 1 quartz; (C) homogenization temperatures of S2-, V-, and LV-type FIs in Stage 2 quartz; (D) salinity data for S2-, V-, and LV-type FIs in Stage 2 quartz; (E) homogenization temperatures of S2- and LV-type FIs in Stage 3 quartz; (F) salinity data for S2- and LV-type FIs in Stage 3 quartz.

Figure 9.
Pressure estimates for fluid inclusions in the Jinchang deposit (adapted from Hedenquist et al. [43] and Redmond et al. [44]).

Figure 10.
δD versus δ18O diagram for quartz from different stages of mineralization in the Jinchang deposit. Trend lines shown for reference are data from the Gulf Coast, Illinois, and Michigan basins [49], Alberta Basin [50], and Californian Tertiary geothermal brines [51]. The fields for metamorphic and primary magmatic waters are from Taylor [52]. Data used to derive a present-day meteoric water line for China are from Chen and Wang [53].

Figure 11.
Histogram of S isotopic compositions for the Jinchang deposit and existing S isotopic data from Jia et al. [9], Mu et al. [14], and Li et al. [40].

Figure 12.
Lead isotopic compositions for sulfides and host rocks in the Jinchang deposit. (A) 207Pb/204Pb versus 206Pb/204Pb plot; (B) 208Pb/204Pb versus 206Pb/204Pb plot. Abbreviations: UC, upper crust; O, orogen; M, mantle; LC, lower crust. The average growth curve is from Zartman and Doe [67]. Lead isotope data are from Mu et al. [14].

Figure 13.
(A) Tectonic model of Early Cretaceous gold deposits in the Jinchang area (after Sun et al. [68]). (B) Metallogenic model for the Jinchang deposit.
Figure 13.
(A) Tectonic model of Early Cretaceous gold deposits in the Jinchang area (after Sun et al. [68]). (B) Metallogenic model for the Jinchang deposit.


Table 1.
Microthermometric data for fluid inclusions in hydrothermal quartz of the Jinchang deposit.
Table 1.
Microthermometric data for fluid inclusions in hydrothermal quartz of the Jinchang deposit.
| Sample | Sample Location | Host Mineral | FIAs | Inclusion Type | No. | V–L Ratio | Tm (Ice) (°C) | Tm (NaCl) (°C) | Salinity (NaCl wt%) | Th (°C) |
|---|---|---|---|---|---|---|---|---|---|---|
| JC-01 | ZKE01, 80 m level | Quartz–pyrite–arsenopyrite veins (Stage 1) | V | V | 7 | 70–80 | −5.4 to −3.8 | 6.2–8.4 | 421–453 | |
| JC-02 | ZKE01, 60 m level | V and S2 | V | 6 | 80–90 | 5.7–7.8 | 428–462 | |||
| S2 | 9 | 15–25 | 425–459 | 50.3–54.4 | 431–459 | |||||
| JC-04 | ZKE01, 65 m level | S1 | S1 | 10 | 20–30 | 447–466 | ||||
| JC-06 | ZKE01, 70 m level | S1 | S1 | 7 | 25–30 | 457–479 | ||||
| JC-07 | ZK1001, 120 m level | V and S2 | V | 5 | 75–85 | −5.6 to −4.1 | 6.6–8.7 | 432–463 | ||
| S2 | 10 | 10–20 | 421–456 | 49.8–54.0 | 435–469 | |||||
| JC-10 | ZK1001, 122 m level | V | V | 9 | ~95 | 425–455 | ||||
| JC-12 | ZK1001, 100 m level | S1 | S1 | 8 | 20–30 | 453–469 | ||||
| JC-15 | ZK1001, 110 m level | S1 | S1 | 9 | 20–30 | >600 | ||||
| JC-16 | ZK1523, –60 m level | Quartz–pyrite–chalcopyrite veins (Stage 2) | V and S2 | V | 9 | 75–85 | −3.3 to −1.4 | 2.4–5.4 | 369–407 | |
| S2 | 8 | 15–20 | 363–395 | 43.6–46.9 | 375–402 | |||||
| JC-17 | ZK14, 120 m level | V and LV | V | 7 | ~70 | −3.1 to −0.7 | 1.2–5.1 | 372–395 | ||
| LV | 5 | 20–25 | −12.0 to −9.9 | 13.8–16.0 | 376–389 | |||||
| JC-20 | ZK14, –40 m level | V and S2 | V | 6 | 70–80 | −2.7 to −1.4 | 2.4–4.5 | 364–399 | ||
| S2 | 7 | 15–20 | 365–408 | 43.5–48.3 | 372–408 | |||||
| JC-22 | ZK0303, 120 m level | LV | LV | 7 | 15–25 | −8.9 to −6.2 | 9.5–12.7 | 363–394 | ||
| JC-24 | ZK0303, 20 m level | S2 | S2 | 6 | 20–25 | 359–383 | 43.3–45.6 | 365–392 | ||
| JC-25 | ZK04, 100 m level | S2 | S2 | 9 | 15–25 | 381–392 | 45.4–46.6 | 381–400 | ||
| JC-31 | ZK2303, 162 m level | Quartz–pyrite–galena–sphalerite veins (Stage 3) | LV | LV | 8 | 20–25 | −8.6 to −7.2 | 10.7–12.4 | 305–347 | |
| JC-32 | ZK2303, 160 m level | S2 | S2 | 9 | 20–25 | 302–343 | 38.3–41.8 | 315–343 | ||
| JC-35 | ZK0902, 70 m level | LV | LV | 11 | 75–85 | −8.8 to −7.1 | 10.6–12.6 | 302–342 | ||
| JC-38 | ZK0902, 72 m level | S2 | S2 | 8 | 20–25 | 310–346 | 38.9–42.0 | 312–346 | ||
| JC-42 | ZK1315, 20 m level | LV | LV | 9 | 15–20 | −7.3 to −5.8 | 8.9–10.9 | 296–323 | ||
| JC-43 | ZK1315, –20 m level | LV | LV | 6 | 10–25 | –6.5 to −5.0 | 7.9–9.9 | 297–338 |
Table 2.
Oxygen and hydrogen isotopic data for Stage 1–3 hydrothermal quartz from the Jinchang deposit.
Table 2.
Oxygen and hydrogen isotopic data for Stage 1–3 hydrothermal quartz from the Jinchang deposit.
| Stages | Sample | Sample Description | δ18OV-SMOW (‰) | δDV-SMOW (‰) | Th (°C) | δ18OH2O–SMOW (‰) | Sample Location |
|---|---|---|---|---|---|---|---|
| Stage 1 | J1-1 | Quartz from quartz–pyrite–arsenopyrite veins | 11.4 | −74.3 | 460 | 8.5 | ZKE01 at 84 m level |
| J1-2 | 11.3 | −72.1 | 440 | 8.1 | ZKE01 at 64 m level | ||
| J1-3 | 10.8 | −79.0 | 460 | 7.9 | 30 m level middle section | ||
| J1-4 | 10.7 | −75.9 | 440 | 7.5 | 30 m level middle section | ||
| Stage 2 | J18-1-1 | Quartz from quartz–pyrite–chalcopyrite veins | 10.5 | −78.9 | 400 | 6.4 | ZK1523 at –60 m level |
| J18-3-1 | 9.4 | −83.1 | 380 | 4.9 | ZK14 at 120 m level | ||
| J18-1-2 | 9.8 | −85.8 | 400 | 5.7 | ZK0303 at 20 m level | ||
| J18-3-2 | 9.1 | −77.2 | 380 | 4.6 | ZK04 at 100 m level | ||
| Stage 3 | Jh-4-1 | Quartz from quartz–pyrite–galena–sphalerite veins | 9.1 | −87.1 | 340 | 3.5 | ZK0902 at 72 m level |
| Jh-5-1 | 9.5 | −90.9 | 320 | 3.3 | ZK1315 at –20 m level | ||
| Jh-4-2 | 8.6 | −91.8 | 340 | 3.0 | ZK2303 at 162 m level | ||
| Jh-5-2 | 8.7 | –92.2 | 320 | 2.5 | ZK4702 at 287 m level |
Table 3.
Sulfur isotope data for ore minerals of the Jinchang deposit.
| Stages | Sample | Mineral | δ34SVCDT (‰) | T (°C) | δ34SH2S (‰) | Sample Location |
|---|---|---|---|---|---|---|
| Stage 1 | J1-1 | Pyrite | 1.8 | 428 | 1.0 | ZKE01 at 84 m level |
| J1-2 | Pyrite | 2.4 | 428 | 1.6 | ZKE01 at 64 m level | |
| J1-3 | Pyrite | 2.9 | 428 | 2.1 | 30 m level middle section | |
| J1-4 | Pyrite | 2.8 | 428 | 1.0 | 30 m level middle section | |
| Stage 2 | J18-1-1 | Pyrite | 3.0 | 364 | 2.0 | ZK1523 at –62 m level |
| J18-3-1 | Pyrite | 3.2 | 364 | 2.0 | ZK14 at 119 m level | |
| J18-1-2 | Chalcopyrite | 2.1 | 364 | 2.2 | ZK0303 at 19 m level | |
| J18-3-2 | Chalcopyrite | 2.2 | 364 | 2.3 | ZK04 at 100 m level | |
| Stage 3 | Jh-4-1 | Pyrite | 3.3 | 330 | 2.2 | ZK0902 at 70 m level |
| Jh-5-1 | Pyrite | 3.5 | 330 | 2.4 | ZK1315 at –21 m level | |
| Jh-4-2 | Galena | 0.2 | 330 | 1.9 | ZK2303 at 160 m level | |
| Jh-5-2 | Galena | 0.8 | 330 | 2.5 | ZK4702 at 287 m level |
© 2019 by the authors. Licensee MDPI, Basel, Switzerland. This article is an open access article distributed under the terms and conditions of the Creative Commons Attribution (CC BY) license (http://creativecommons.org/licenses/by/4.0/).
Share and Cite
MDPI and ACS Style
Li, S.; Zhang, X.; Gao, L. Ore Genesis at the Jinchang Gold–Copper Deposit in Heilongjiang Province, Northeastern China: Evidence from Geology, Fluid Inclusions, and H–O–S Isotopes. Minerals 2019, 9, 99. https://doi.org/10.3390/min9020099
AMA Style
Li S, Zhang X, Gao L. Ore Genesis at the Jinchang Gold–Copper Deposit in Heilongjiang Province, Northeastern China: Evidence from Geology, Fluid Inclusions, and H–O–S Isotopes. Minerals. 2019; 9(2):99. https://doi.org/10.3390/min9020099
Chicago/Turabian StyleLi, Shunda, Xuebing Zhang, and Lingling Gao. 2019. "Ore Genesis at the Jinchang Gold–Copper Deposit in Heilongjiang Province, Northeastern China: Evidence from Geology, Fluid Inclusions, and H–O–S Isotopes" Minerals 9, no. 2: 99. https://doi.org/10.3390/min9020099
Note that from the first issue of 2016, this journal uses article numbers instead of page numbers. See further details here.