
Numerical Investigation of Some Reductions for the Gatenby–Gawlinski Model

1
Dipartimento di Matematica G. Castelnuovo, Sapienza Università di Roma, Piazzale Aldo Moro 2, 00185 Rome, Italy
2
Convitto Nazionale G.B. Vico, Corso Marrucino, 135, 66100 Chieti, Italy
3
Laboratoire de Mathématiques J.A. Dieudonné CNRS UMR 7351, Université Côte D’Azur, Parc Valrose, 06108 Nice Cedex 2, France
*
Author to whom correspondence should be addressed.
†
These authors contributed equally to this work.
Axioms 2024, 13(5), 281; https://doi.org/10.3390/axioms13050281
Submission received: 20 February 2024
/
Revised: 15 April 2024
/
Accepted: 16 April 2024
/
Published: 23 April 2024
(This article belongs to the Section Mathematical Analysis)
Abstract
:Two (consecutive) reductions of the complete Gatenby–Gawlinski model for cancer invasion are proposed in order to investigate the mathematical framework, mainly from a computational perspective. After a brief overview of the full model, we proceed by examining the case of a two-equations-based and one-equation-based reduction, both obtained by means of a quasi-steady-state assumption. We focus on invasion fronts, exploiting a numerical strategy based on a finite volume approximation, and perform corresponding computational simulations to study the sharpness/smoothness of the traveling waves. Then, we employ a space-averaged wave speed estimate—referred to as the LeVeque–Yee formula—to quantitatively approach the propagation phenomenon. Concerning the one-equation-based model, we propose a scalar degenerate reaction-diffusion equation, which proves to be effective in order to qualitatively recover the typical trends arising from the Gatenby–Gawlinski model. Finally, we carry out some numerical tests in a specific case where the analytical solution is available.
Keywords:
Warburg effect; acid-mediated tumor invasion; reaction-diffusion systems; traveling fronts; wave speed estimate; finite volume method; data analysisMSC:
35K57; 35Q92; 35C07; 65M06; 65M08; 92C371. Introduction
The contribution of mathematical modeling as an effective investigation tool in the biomedical field is becoming more and more relevant to the present time. Cancer research undoubtedly provides several interesting research paths, whose mathematical exploration is currently taking place on the back of promising results [1]. In this scenario, the so-called Warburg effect [2,3] plays a significant role within the phenomenological framework, which is worth carefully examining in order to accomplish a better understanding of the dynamics that tumor growth is ruled by. In the 1920s, Otto Warburg [2] experimentally determined that cancerous cells essentially rely on the glycolytic metabolism, regardless of oxygen availability. As a matter of fact, oxygen turns out to be the principal resource to allow normal cells to perform glucose metabolism, due to the best yield of adenosine triphosphate (ATP) production using oxidative phosphorylation. On the other hand, tumor cells appear to lean more towards glycolysis, leading to lactic acid fermentation. This is crucial for the so-termed acid-mediated invasion hypothesis [4,5,6,7,8,9,10], whose key point consists in assuming that acidification induced by lactic acid sets up a toxic microenvironment for normal cells and favors cancer cells spreading.
From a mathematical point of view, all these qualitative statements are properly framed by the Gatenby–Gawlinski reaction-diffusion model [11], the investigation of which has been carried out following both numerical and analytical approaches [11,12,13,14,15]. Essentially, the model describes tumor cell proliferation at the expense of local healthy tissue, utilizing the framework of species evolution and assuming that carcinogenesis has already occurred. The focal point is the interaction involving cancerous and healthy species at the tumor–host interface, through lactic acid mediation.
The main purpose of this article concerns achieving a better understanding of the mathematical features the model is characterized by, specifically employing a suitable hypothesis for building some model reductions, following from what was previously introduced in [15] for the one-dimensional case. By means of numerical simulations, the traveling waves phenomenon is analyzed with an emphasis on the qualitative structure of the fronts.
The contents of this paper are organized as follows: In Section 2, a brief overview on the general form of the Gatenby–Gawlinsky model is provided, along with the two-equations reduction previously proposed in [15]. Afterwards, an investigation of the fronts is carried out by means of numerical simulations and a sensitivity analysis with respect to some system parameters is also performed, considering as unknown the wave speed of the front. For this goal, a suitable space-averaged wave speed approximation is taken into account [16]. Section 3 is aimed at building a one-equation-based reduction, theoretically framed in the degenerate reaction-diffusion equations field [17,18,19,20,21,22]. The degenerate diffusion arising from the model reduction is almost everywhere differentiable in so that the sharpness of the fronts is to be checked by means of numerical simulations, due to the requirement for more regularity needed by the corresponding analytical results [17,18,20,21]. Moreover, numerical simulations are performed in order to qualitatively retrieve the dynamics represented by the Gatenby–Gawlinski model and several tests are carried out involving the related exact solution when its availability is ensured. Finally, in Section 4, we discuss the conclusions of the manuscript and provide perspectives on future research.
2. Two-Equations-Based Model Reduction
A natural approach for reducing some evolution equation (when it is too complicated) with the aim of providing a rigorous analytic basis for a simpler model is based on the so-called quasi-steady-state assumption (QSSA).
Starting from chemical kinetic modeling—specifically, from Michaelis–Menten enzyme kinetics—the QSSA has now become a cornerstone. In general, the approach is based on two consecutive steps:
- finding the time-scales that are pertinent to the model (usually, this should be determined by looking at the size of the parameters);
- substituting a sub-group of the evolution equations with the corresponding equilibrium relation.
Next, we apply the method to the above model to move from a model with three variables to a corresponding one reduced to two variables. Later, we will iterate the same procedure to pass from a system to a scalar reaction-diffusion equation. The key role played by the model parameters in finding a reliable reduction is made clear.
2.1. Derivation and Previous Achievements
The original Gatenby–Gawlinski model [11] is composed of three equations (two PDEs plus one ODE) that are chosen to be non-dimensional, so that we obtain the system
where the interval is the one-dimensional domain, with , while u, v, and w are the unknown scaled functions, which stand for the healthy tissue density, the tumor tissue density, and the extracellular lactic acid concentration in excess, respectively (see [14] for a generalized version). The densities u and v follow logistic growth with normalized carrying capacities, d is a death rate proportional to w, which relates to reproducing healthy cell degradation brought on by lactic acid, while r is a growth rate. With regard to the second equation, it is important to note the structure of the degenerate diffusion term, in which D is the diffusion constant for cancerous cells when the healthy tissue has already been degraded; however, when the local healthy cells concentration is equal to its normalized ceiling, the tumor cannot spread out as a consequence of a defense process of confinement [11,20]. Finally, the parameter c plays the role of both a growth rate for acid production (proportional to v) and a physiological reabsorption rate. For the boundary conditions, the homogeneous Neumann problem is set out.
With respect to the dynamics provided by (1), essentially, the results can be condensed through two different kinds of behaviors [11,14,15], both being framed within the propagating fronts theory. The first, which happens in the regime , is called heterogeneous invasion because of the coexistence of tumor and healthy tissues behind the wave front; if, instead, , we face a more aggressive invasion, so-called homogeneous invasion, due to the complete destruction of the healthy tissue by the cancerous cells wave front. In this last regime, we identify the presence of a tumor–host hypocellular interstitial gap, namely, a separation zone between the healthy and cancer cell densities.
Information about the wave speed is an object of analysis as well, showing that, consistent with its more aggressive nature, homogeneous invasion turns out to happen faster than heterogeneous invasion. Nevertheless, the existence of invasion fronts for the Gatenby–Gawlinski reaction-diffusion model is supported mainly by numerical experiments (among others, see [14,15]), while to our knowledge, rigorous mathematical results are still lacking (see [13] for a partial result based on a singular perturbation approach).
As far as the possibility of relying on a simplified version of the model (1) is concerned, we take advantage of what has been proposed in [15] and afterwards try to go further. The assumption allowing a two-equations-based reduction is , which leads to
The hypothesis is justified considering the limit as the parameter c in the third equation of the complete model (1) approaches infinity.
With regards to the qualitative aspect, the simplified model accomplishes the purpose of correctly reproducing both the heterogeneous and homogeneous configurations, although the gap formation is no longer observable. Indeed, in order to detect this phenomenon, it is necessary to exploit independent evolution for the lactic acid concentration.
Let us stress that (2) fits into the more general reaction-diffusion system in two variables
with the choice
A model for melanoma cells invading human skin with the structure (3) was proposed in [23] (see also [24,25])
for some .
In (3), the dynamics of the variable u are driven by a simple ordinary differential equation (thus, being hyperbolic); however, the dynamics of v are parabolic, with possible degeneracy at the states where the function H—required to be non-negative to accomplish well-posedness—vanishes.
2.2. The Numerical Algorithm
With regard to the numerical strategy, we refer to the explanation provided in [15]. For the sake of convenience, we provide the reader with the key points underlying the system discretization.
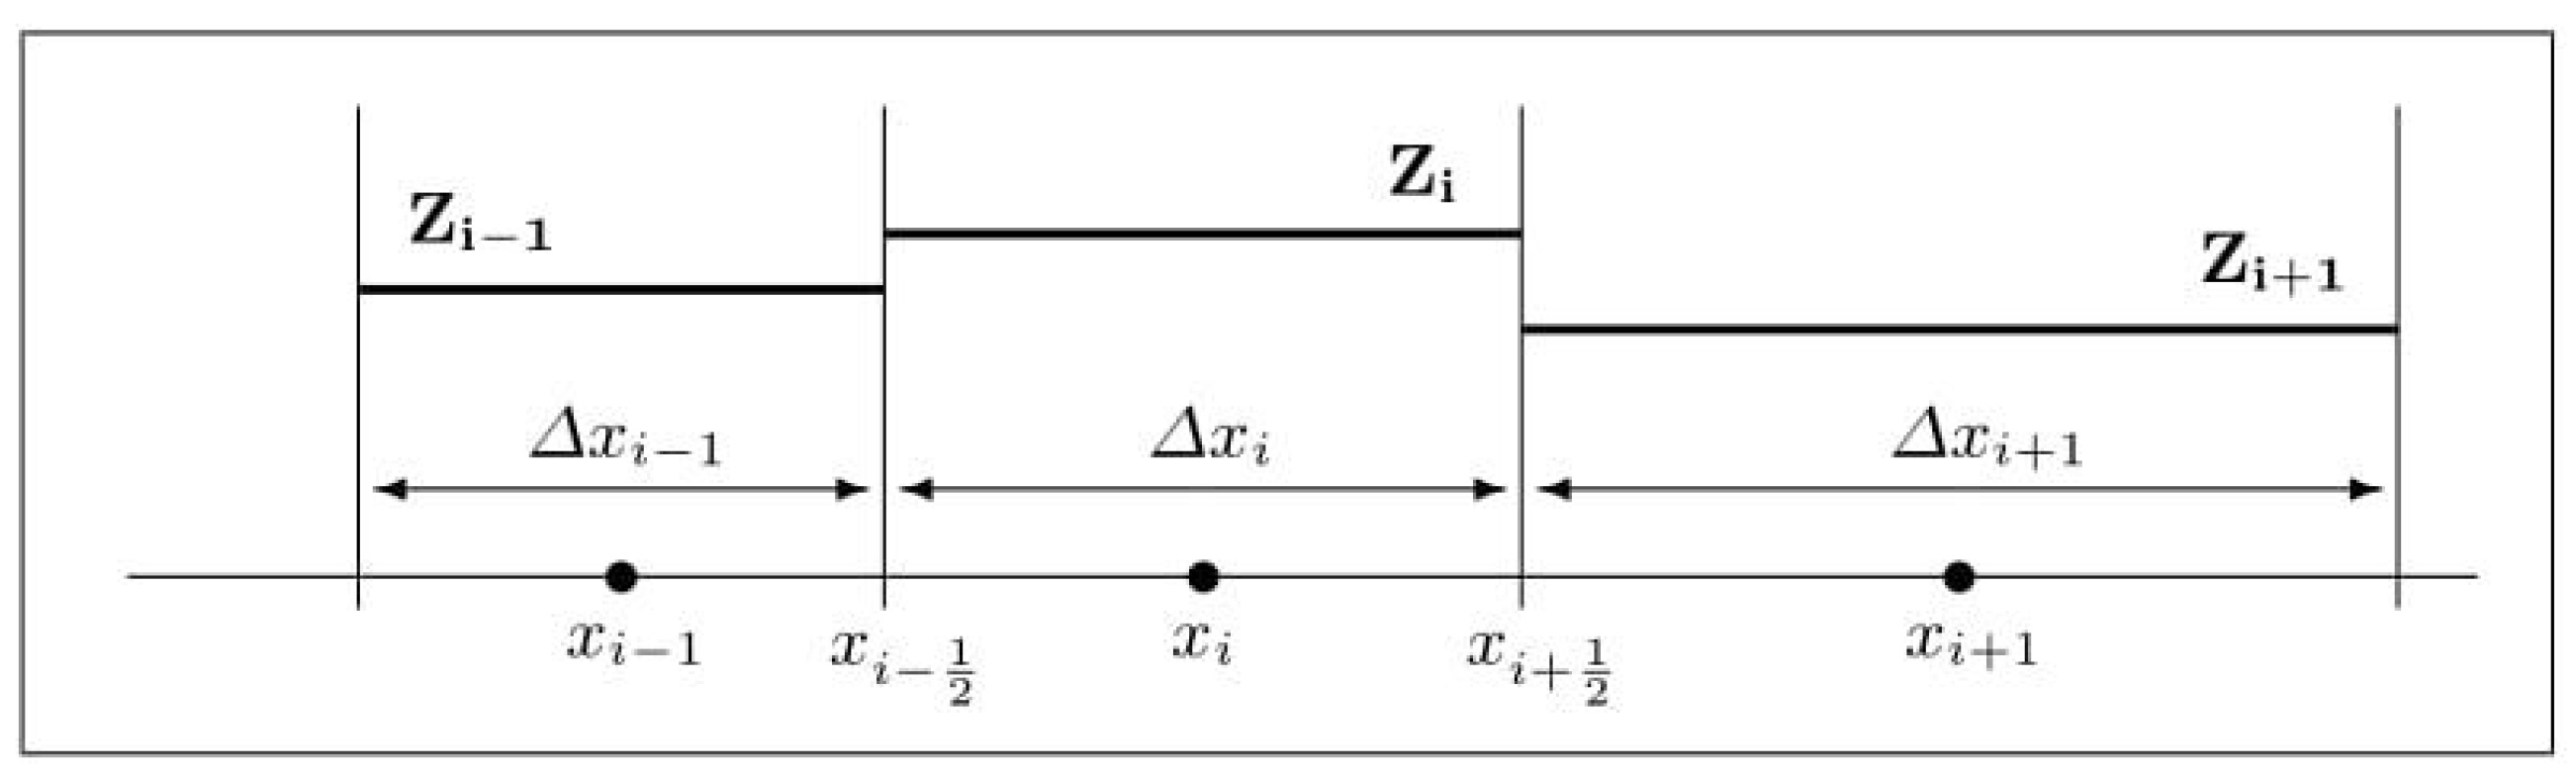
We employ a cell-centered finite volume approximation for the spatial discretization (see [29], for example) and proceed by considering a non-uniform grid. Thus, let be the finite volume centered at , for , where N is a fixed number of vertices on the one-dimensional grid. Let us assume that is the spatial grid size, from which is the length for an interfacial interval (see Figure 1).
The finite volume integral version for the healthy cell density in (2) leads to
which, by exploiting the standard notation , becomes
The equation for the tumor cell density in (2) reads as
where the finite volume integral average of the diffusion term is to be properly approached, as follows:
where the approximations for the interfacial quantities are realized by means of weighted averages whose weights are the size of the adjacent finite volumes; thus, and are employed at the interfaces and , respectively. The first-order derivatives of v are discretized through an upwind formula which relies on the function evaluations at the neighboring vertices.
From now on, we simply impose that the quantity is constant, so that for all . That is why, from (5), the semi-discrete version for the equation of cancerous cell density reads as
which can be rearranged to obtain
As already pointed out in [15], we stress that the approximation (6) produces a discrete Laplace operator and extra terms consisting of products of upwind discretizations, arising from the degenerate diffusion in the second equation of (2). It is important to note that the finite volume strategy allows to split the diffusion by autonomously choosing the first- and second-order contributions, while, as in the case of finite difference schemes [30], a central discretization for the first-order terms would be required, so causing a less stable scheme.
Finally, for the time discretization of (4) and (6), we adopt a semi-implicit strategy considering a fixed time step . Thus, , for . The reaction terms are treated explicitly, while the differential terms on the right-hand sides are approximated implicitly, as follows:
and Neumann-type boundary conditions and , for are implemented.
2.3. Simulation Results
In continuity with [15], we perform simulations aimed at better characterizing the solutions produced by (2). First of all, we want to figure out if the corresponding traveling waves exhibit a sharp-type or front-type trend. Technically, taking as the main guideline the traveling waves problem defined by the following one-dimensional, degenerate, reaction-diffusion equation:
where is such that and positive in between (in short, of logistic type), is such that ; then, the definition of sharpness, according to [20], reads as follows:
Definition 1
(sharp-type front). If there exist a value of the wave speed s, let us call it , and a value of ξ, let it be , such that , satisfying
- 1.
- ,
- 2.
- ,
- 3.
- ,
where the superscript is meant to denote differentiation with respect to ξ; then, the function is called a traveling wave solution of sharp-type for (8).
We point out that the other possibility allowed happens when the function turns out to be a traveling wave of front-type, whose typical smoother trend means that this front is known as a smooth-type wave as well. The former statement about the smoothness of the front-type traveling waves is easily understandable when thinking about the implications framed by Definition 1. As a consequence, a sharp-type wave attains the equilibrium located at 0 in a finite time , with negative slope [17], thus resulting in a discontinuous derivative in , since the left derivative tends to , while the right derivative tends to [20]. By contrast, a smooth-type front exhibits a continuous derivative in . This last observation provides us with a useful tool in order to quickly, qualitatively detect the distinctive trend for a given traveling wave, especially when the dynamics are ruled by more complex configurations with respect to (8), as happens for a system of equations. With regards to the scalar case, in which the problem (8) is framed, theoretical results [17,18,20,21] are available for ensuring the existence and uniqueness of sharp/smooth-type traveling waves, provided that some hypotheses about the regularity of the v-dependent functions g and h are satisfied; other results are achieved in [19] for a specific choice of h and in [22] if g is a generalization of the Nagumo equation.
With respect to the strictly theoretical framework (8), we consider this in the next section, when the one-equation reduction for the Gatenby–Gawlinski model is introduced. First, instead, we focus on the sharpness for (2), without neglecting observations concerning (1) too.
The first step, consists in evaluating the traveling fronts arising from the full model: in this regard, we take as a sample (see Figure 2) the results related to the homogeneous invasion considered in [15], but initialized with the Riemann problem whose states are suitable stationary points [14] of the full model. The parameters used for the experiment are listed in Table 1. Moreover, T is the final time instant, while the spatio-temporal mesh is realized by fixing and . With regard to the numerical algorithm, we exploit the strategy previously described considering the equation for the lactic acid concentration.
Now, in order to obtain information about the shape of the fronts, we show a zoom-in for both the healthy cell density, shown in Figure 3a, and the tumor cell density, shown in Figure 3b, plotted at equally spaced time instants. This qualitative analysis clearly proves the traveling waves to be smooth-type for the complete Gatenby–Gawlinski model. We have omitted to report data concerning the lactic acid concentration, due to the similarity with the evolution of the cancerous cell density.
Let us proceed by focusing on the two-equations-based model (2). Before going ahead with the numerical simulations, it is useful to make a further simplification, allowing to normalize the coefficient D for the second equation (it should be noted that the resulting spatial window is wider). This goal is accomplished by imposing the following rescaling:
by which, by renaming the variable y to x, it is possible to obtain a two-parameters-dependent reduction that reads as
Afterwards, it is helpful to compute the stationary points for (10), namely, (2), and to check the related stability, so that the final outcome looks like
- , absence of species, unstable;
- , healthy state, unstable;
- , homogeneous state, stable if and unstable if ;
- , heterogeneous state, stable if and unstable if .
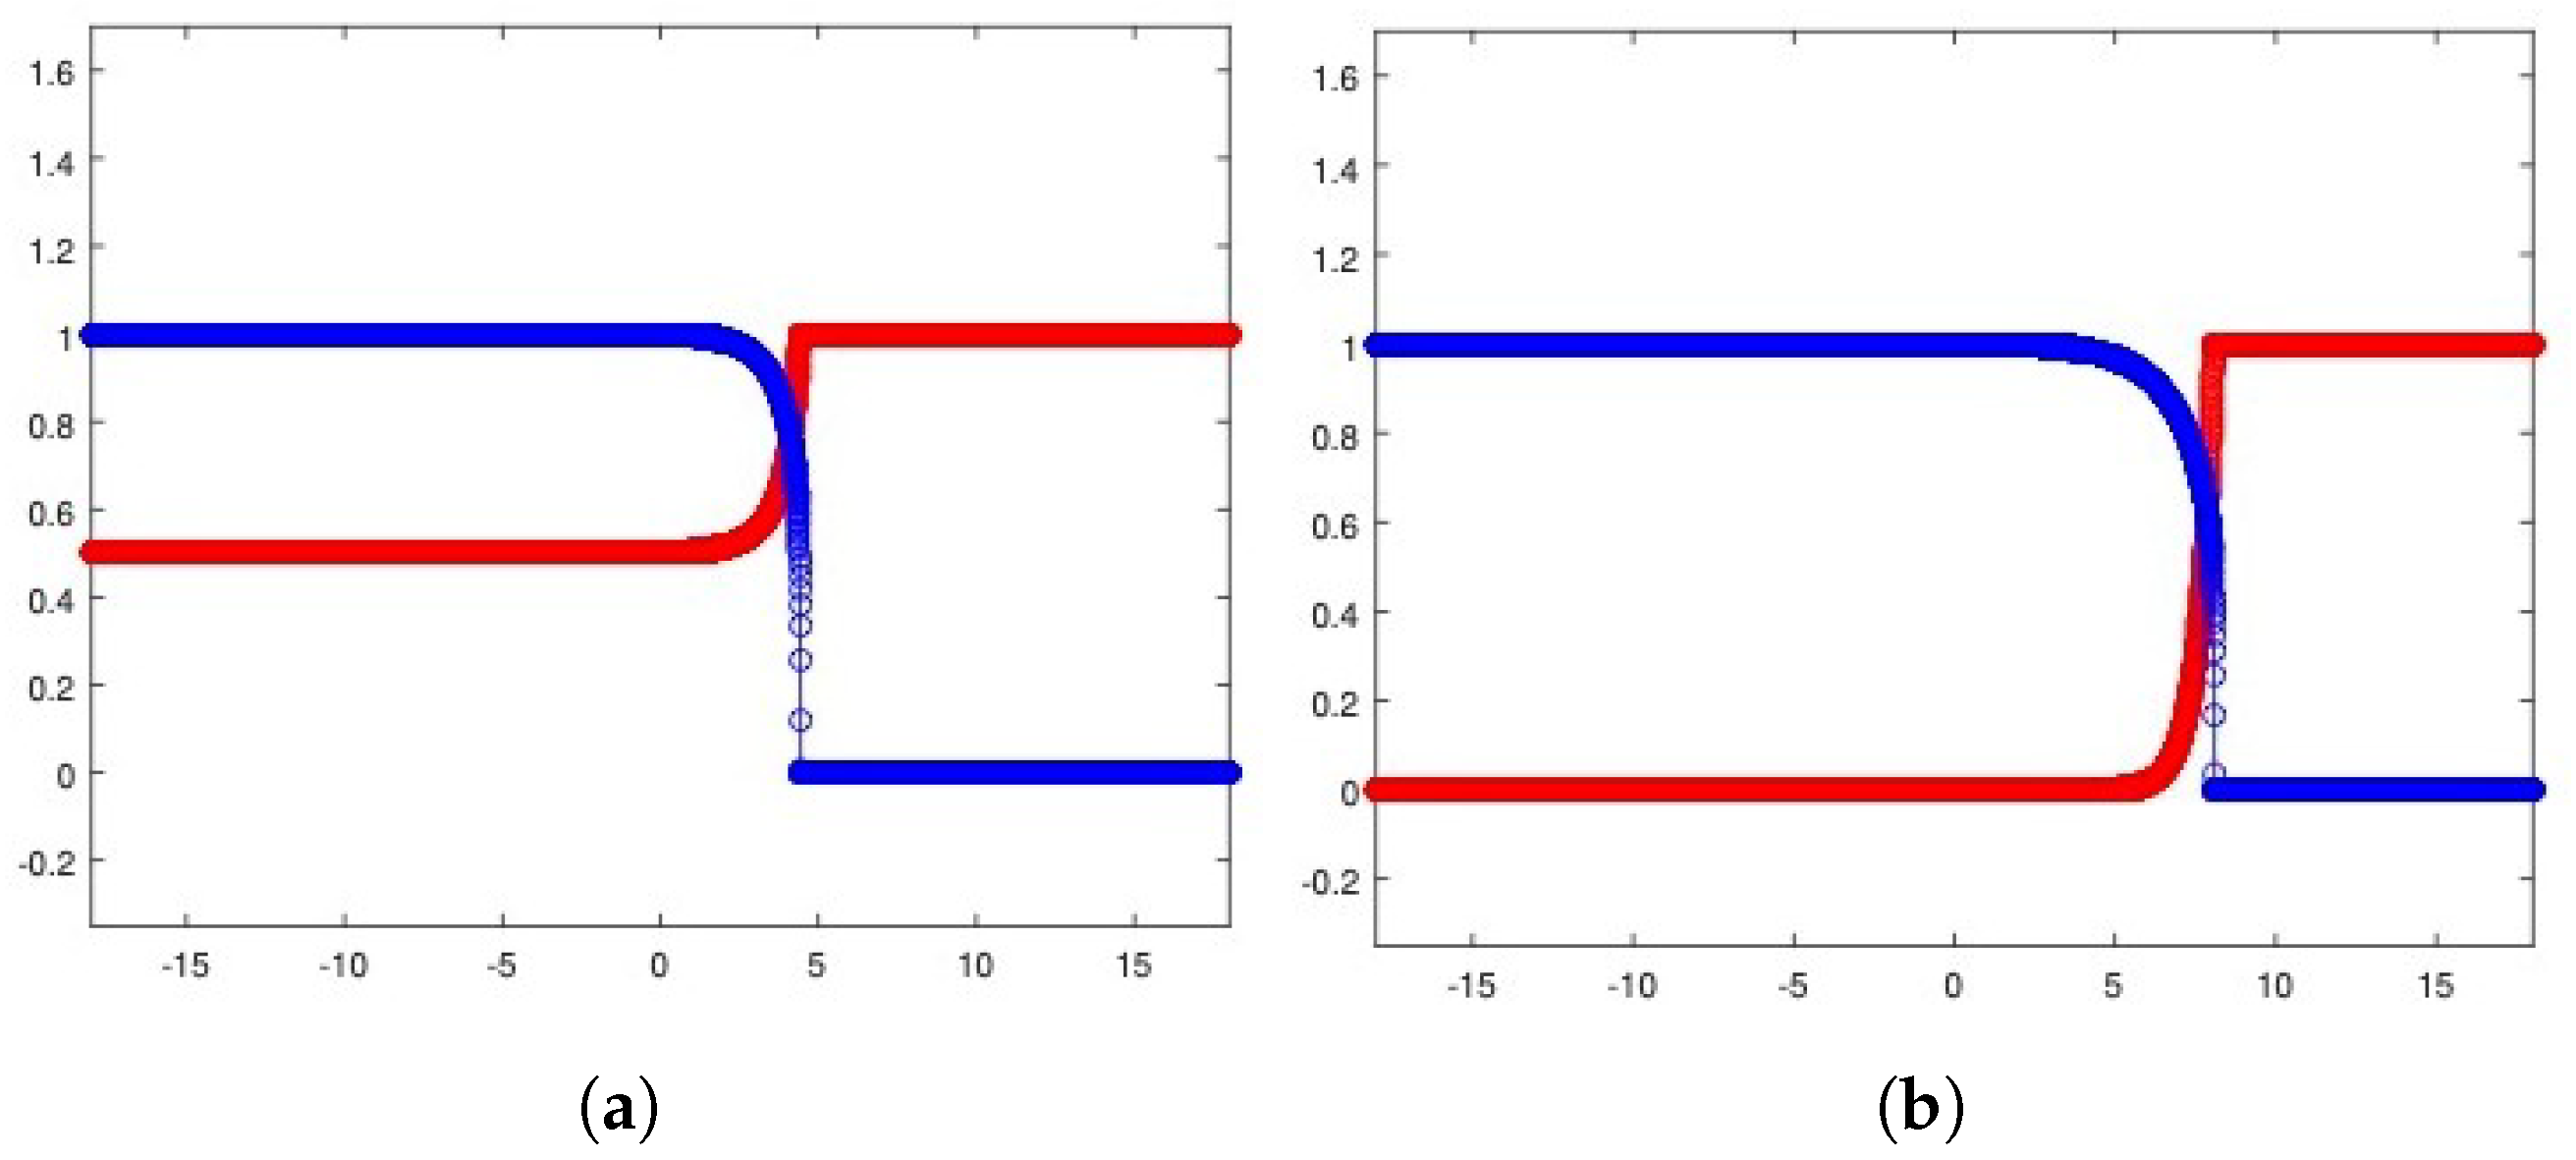
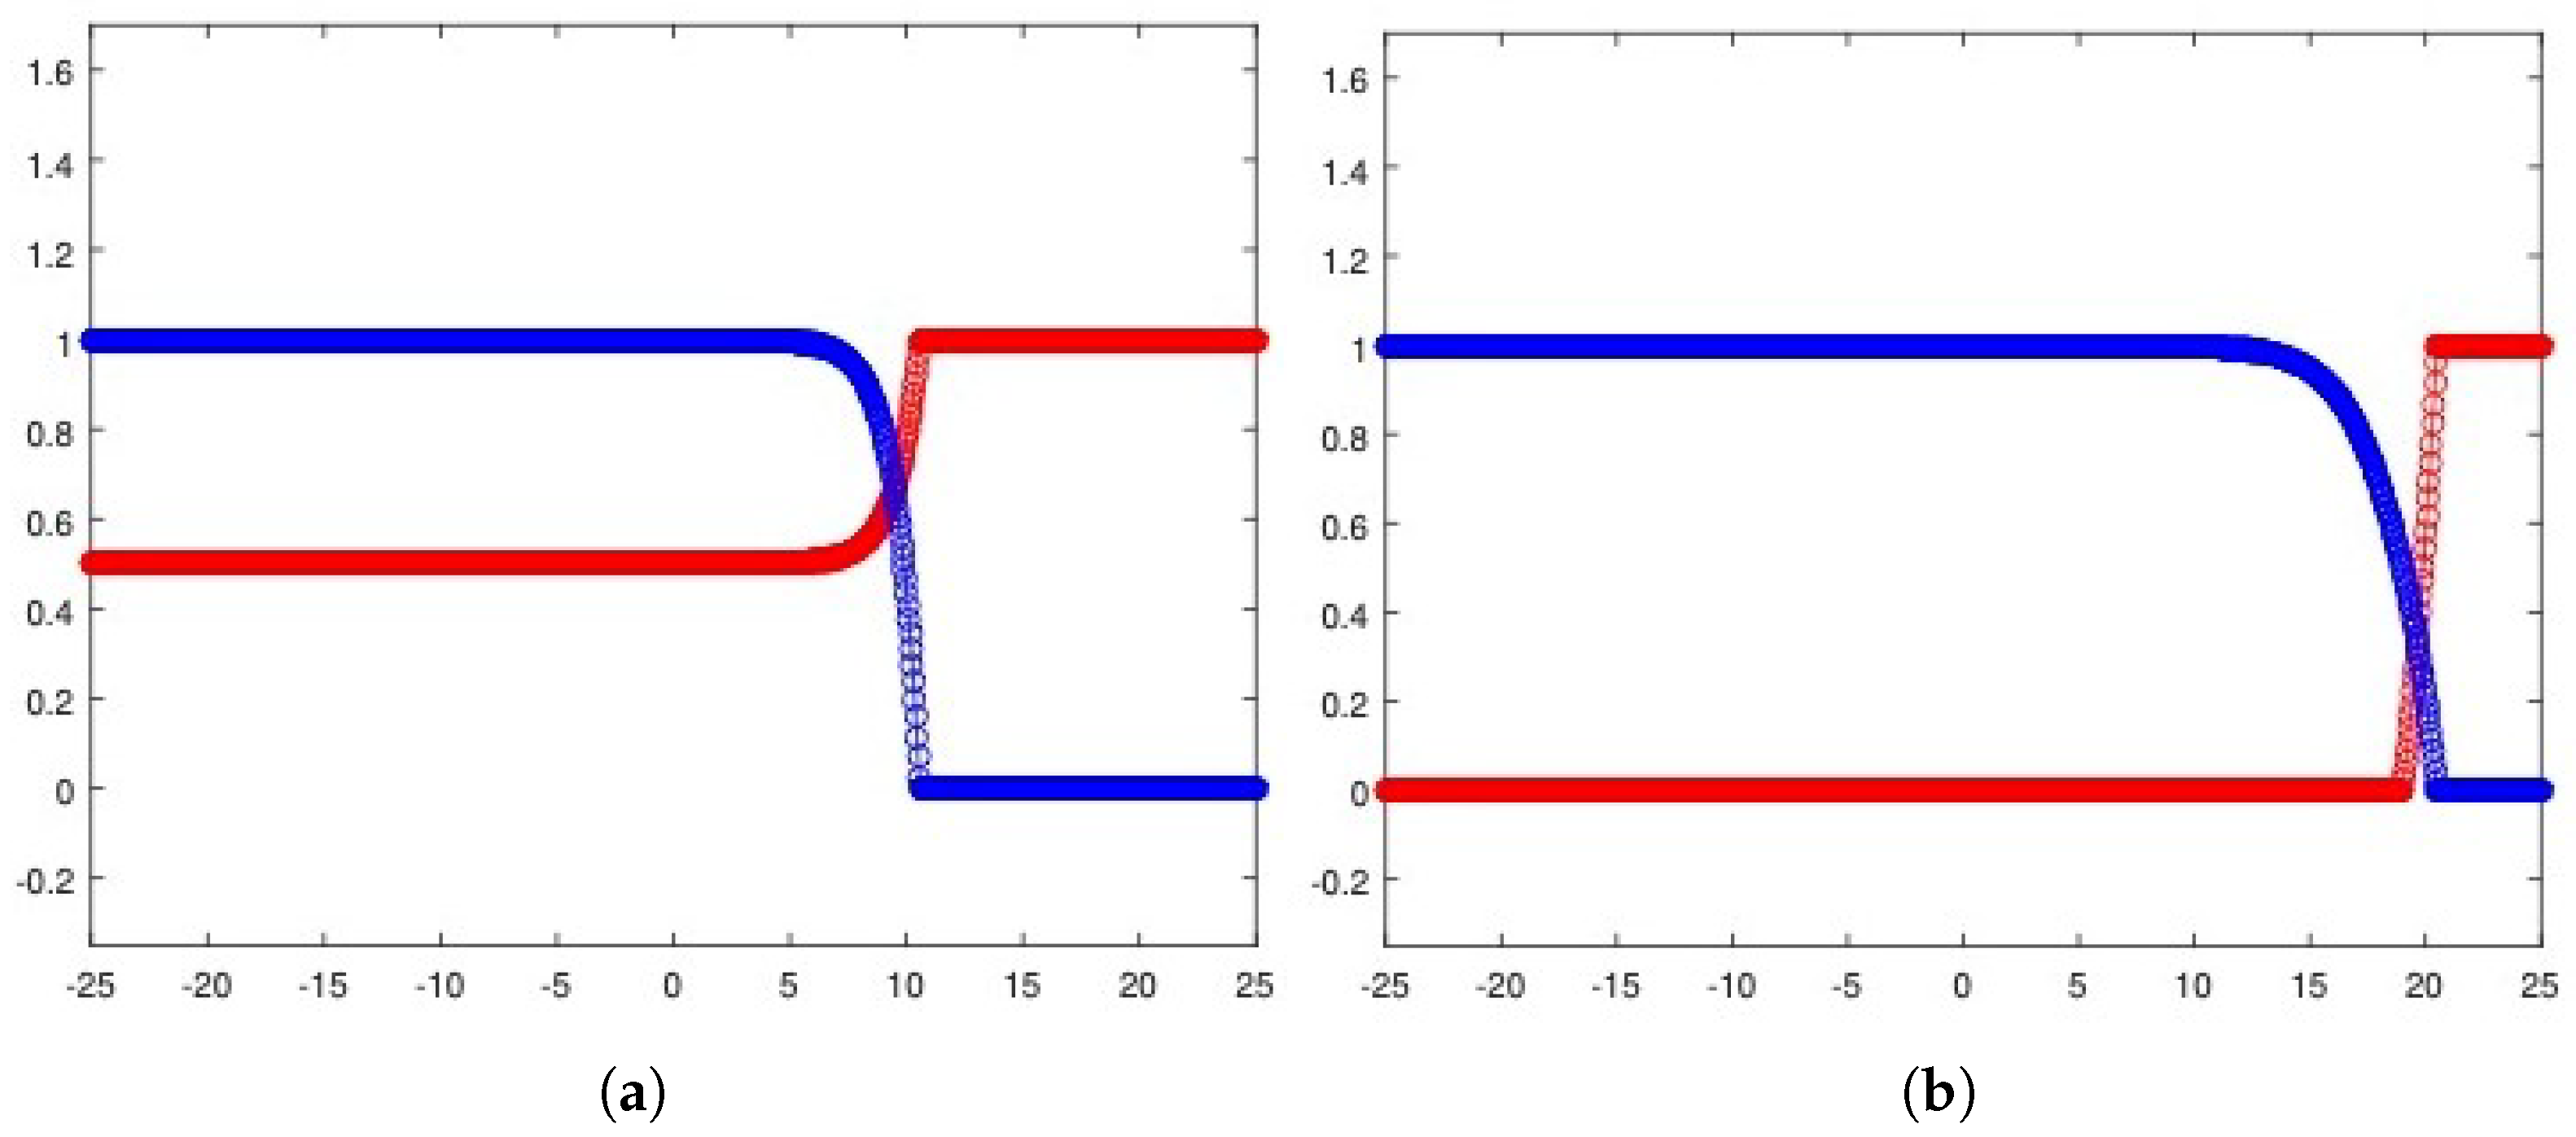
To introduce competition among the two equilibria, we focus on the Riemann problem whose states are at the left and at the right and perform the corresponding numerical experiments (see Figure 4a for the heterogeneous invasion, with , and Figure 4b for the homogeneous invasion, with ).
It is important to note that the structure of the state is a consequence of the d-dependent stability for the equilibria and , so that the resulting state proves itself to be stable for every choice of eligible d. Being unstable, the propagating front arising from the resulting Riemann data travels towards the right-hand side. In Table 2, all the parameters employed to carry out the numerical simulations are shown.
The results produced by numerically investigating system (10) are depicted in Figure 5a for the heterogeneous invasion and Figure 5b for the homogeneous invasion. We note that the two-parameters reduction correctly captures the trends expected in both cases studied. By making a comparison with the analogous plots obtained in [15], we point out that we have employed a smaller and defined a wider spatial window to frame the front evolution, since the waves are traveling faster as a consequence of the rescaling (9). These two changes explain the small differences concerning the steepness and the graphical display of the fronts, being the ones reported in Figure 5, less steep and better depicted graphically. Regardless of these points, the typical trends characterizing cancer invasions in the Gatenby–Gawlinski model, are definitely qualitatively preserved by the simulation results.
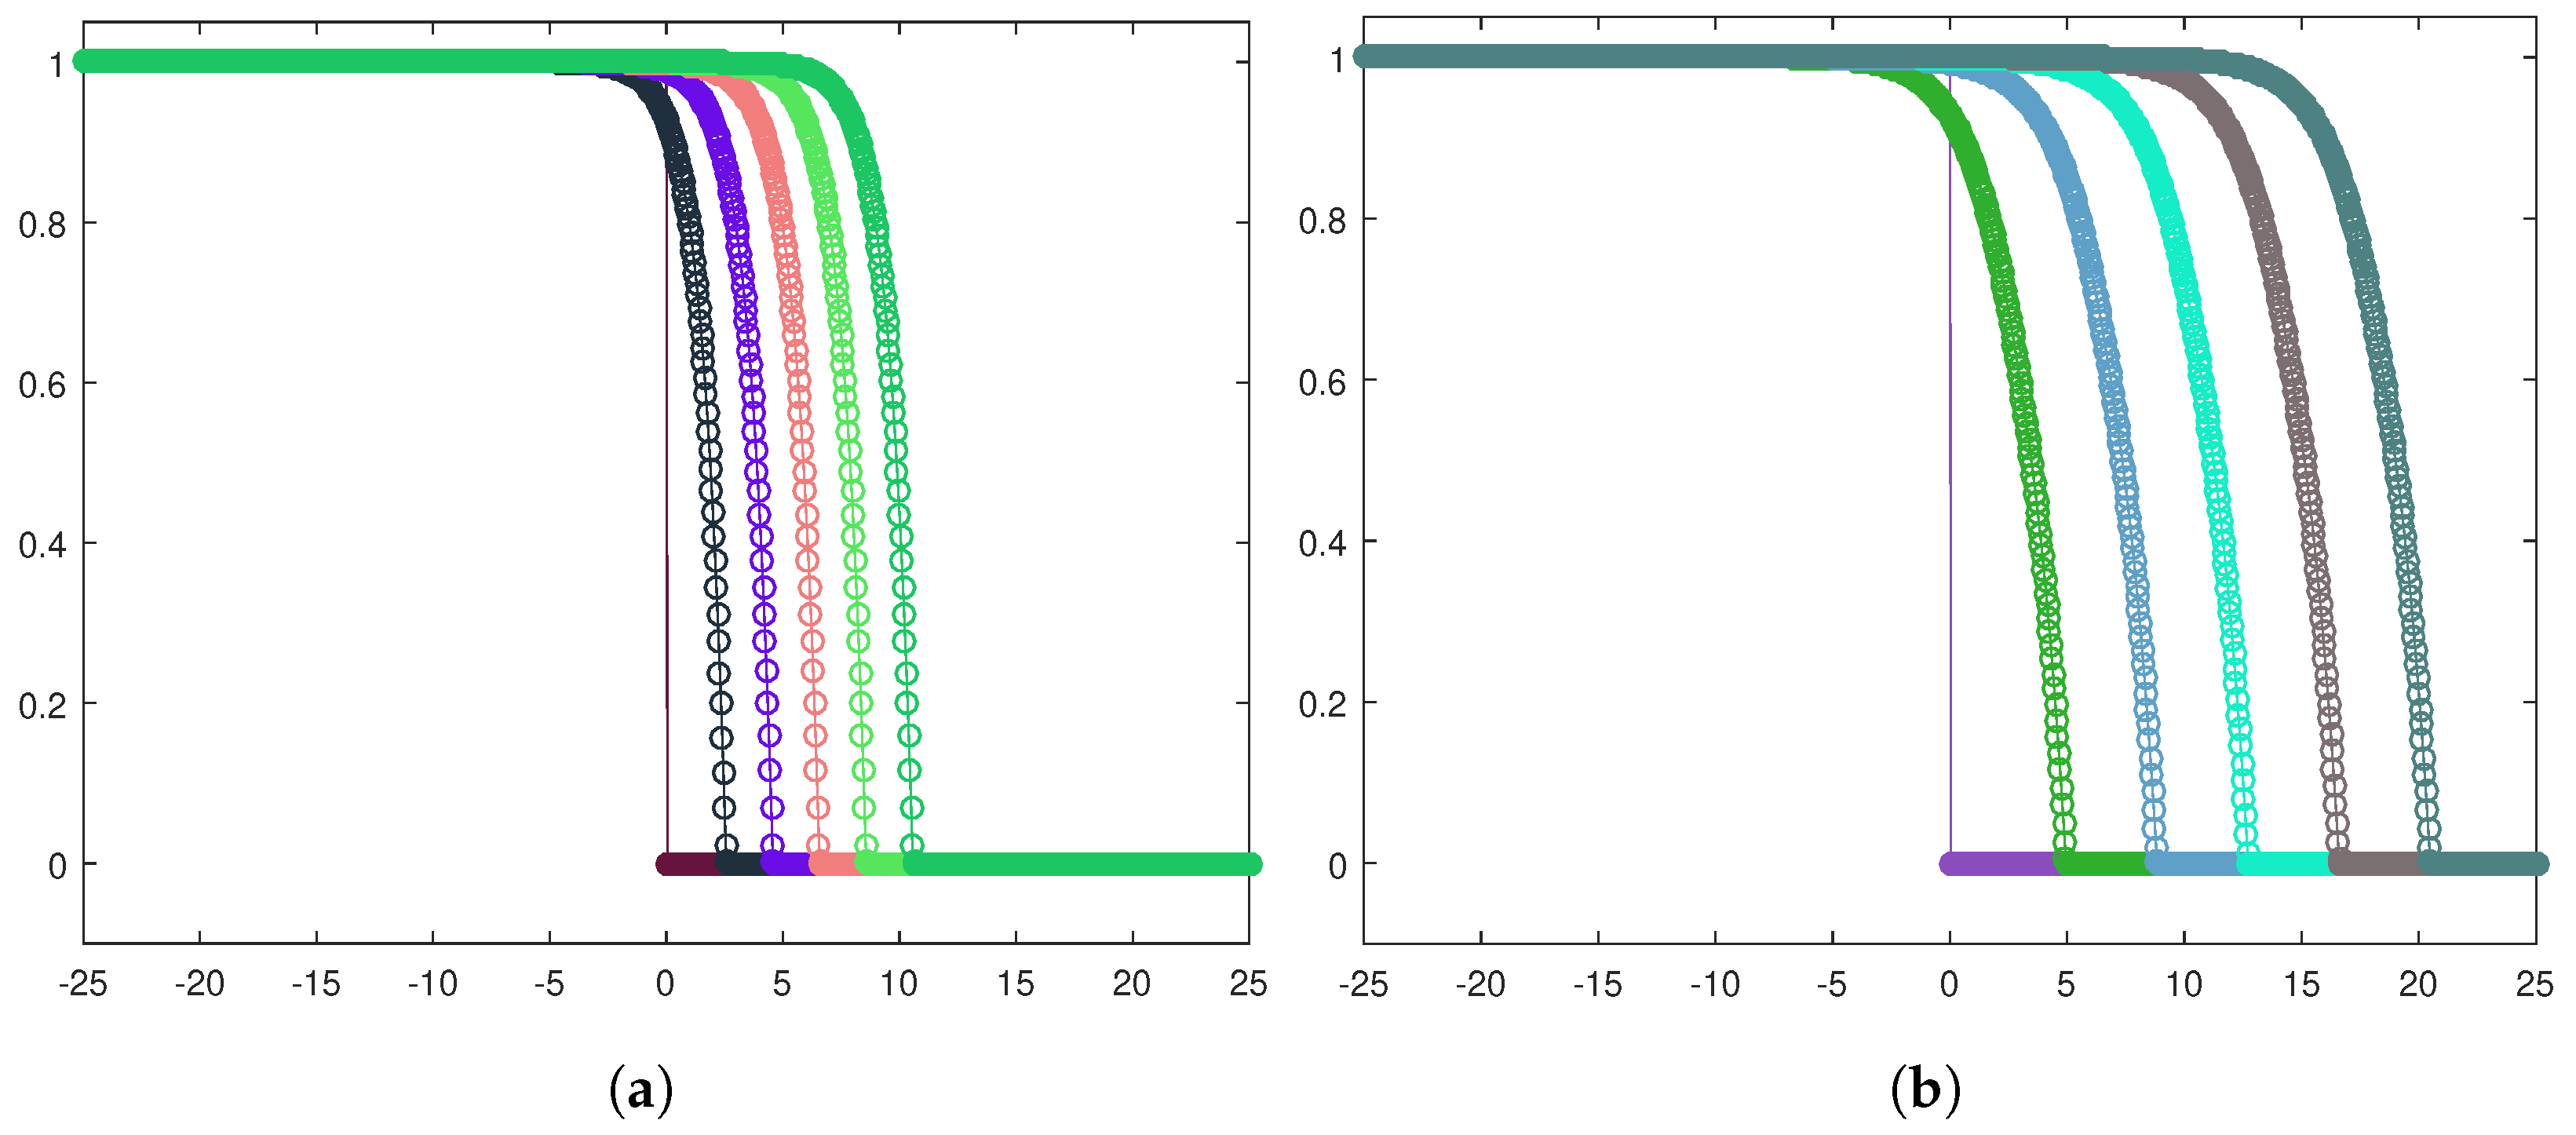
Next, let us focus on the shape of the traveling waves. Figure 6a,b exhibit the front evolution for the tumor cell density in both the invasion configurations, while in Figure 7a,b, the corresponding plots for the healthy cell density are displayed.
We conclude this section by performing a sensitivity analysis with respect to the parameters r and d. In order to accomplish this purpose, we consider as unknown the wave speed s, whose numerical approximation is provided by invoking the space-averaged estimate proposed in [16], already successfully exploited in the Gatenby–Gawlinski model field in [15], to which we refer for the detailed derivation. The final discretized version, providing the approximation for a function v over a uniform spatial mesh at time , is the following:
where , being and the stationary states of . We stress that the estimate (11) is independent of the dynamics of the solutions produced by (10).
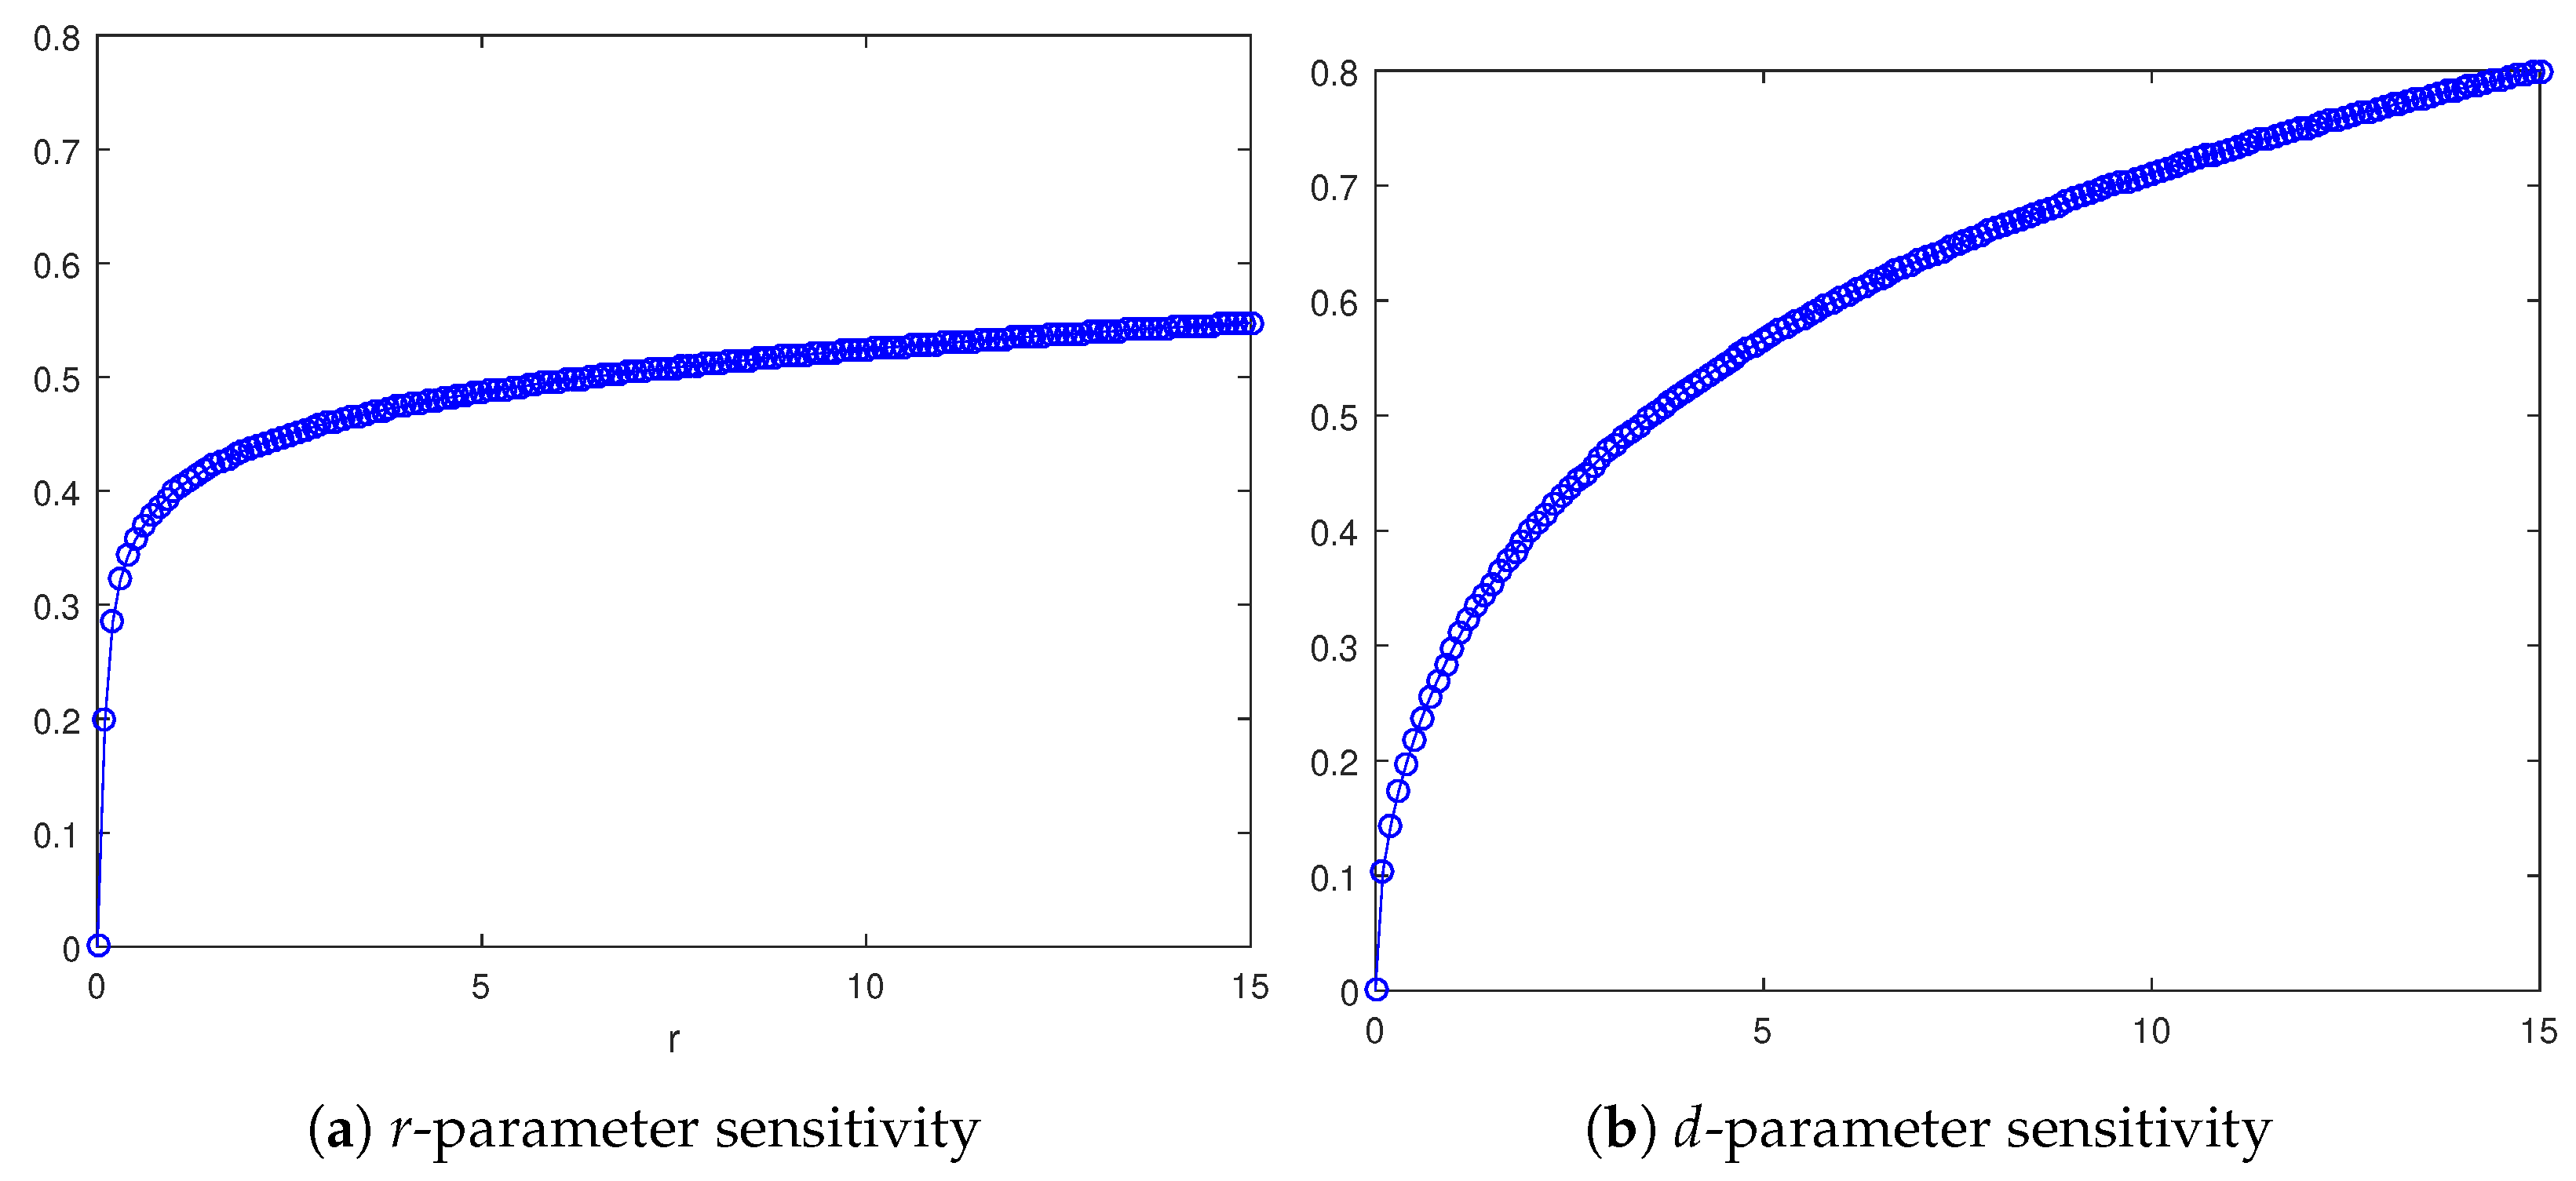
In Figure 8a, the r-dependence is shown, taking as a sample the homogeneous invasion (the heterogeneous case exhibits the same qualitative trend). Specifically, for each r value, the corresponding asymptotic wave speed is reported, numerically approximated by means of (11). The curve so defined is monotone increasing, which is not surprising considering that r is a growth rate for the tumor cell density, so resulting in a faster invasion process. Likewise, focusing on the d-dependence, depicted in Figure 8b, it follows that cancerous invasion is facilitated as d increases, this parameter being a death rate for healthy cells due to interactions with cancerous cells. As a matter of fact, the profile for the wave speed trend is again monotone increasing.
Emphasis should be given to the mesh dependence upon space discretization. Indeed, computing the propagation speed with the LeVeque–Yee formula (11) using different values of gives different values. In Figure 9, the dependency in the plane is shown with a remarkable concave behavior for small .
In view of the rigorous results in [31], further exploration is needed to gain a better understanding of the traveling wave existence of the corresponding semi-discrete and fully discrete schemes.
3. One-Equation-Based Model Reduction
Next, we iterate the reduction procedure described at the beginning of Section 2 to pass from a system in two unknowns to the scalar reaction-diffusion Equation (8). If h is strictly positive, the diffusion is said to be non-degenerate; otherwise, the diffusion is degenerate where h is zero. The problem (8) with h negative is, in general, ill-posed and it will not be considered in this paper.
A rigorous statement for the existence of propagating fronts in the case of non-degenerate diffusion goes as follows: let the function g have two zeros, 0 and 1 to fix ideas, positive in between, in short of logistic type, Then, Equation (8) supports invasive fronts satisfying the asymptotic conditions and if, and only if, , for some critical speed . Moreover, the solution to the initial value problem with Heaviside-like data, characterized by a sharp jump from 0 to 1, converges in an appropriate sense to the front connecting 0 and 1 and moving at a critical speed .
In the degenerate case, the situation is a bit more intricate even in terms of statement since one has to distinguish between smooth and sharp fronts, as previously discussed.
3.1. Derivation from the Two-Equations Model
With the aim of obtaining a one-equation reduction for the Gatenby–Gawlinski model, we start from the simplified model (10) and assume the stationarity for the healthy tissue density equation, leading to . Finally, we impose that
As a consequence, the tumor cells equation turns out to show the following structure:
where the degenerate diffusion term is a piecewise linear function defined as
Our reduction (13) is a degenerate reaction-diffusion equation as in (8) and the diffusion h is almost everywhere differentiable, due to the discontinuity located in for the derivative. The existence and uniqueness results for traveling waves of sharp/smooth-type available in [17] require at least the pointwise differentiability in , so that, strictly concerning the theoretical point of view, it is not possible to state the sharpness/smoothness of the fronts for Equation (13). As a matter of fact, we keep relying on the numerical assessment in this paper, although the possibility of employing a smooth approximation for bypassing the discontinuous point of , so that enough regularity [17,20] might be ensured, would not seem to jeopardize a theoretical prediction of existence and uniqueness for the fronts in the case of (14) as well.
We point out that the reduction (13) might be easily rearranged to become a one-parameter-dependent equation by means of rescaling . However, taking advantage of the constraint employed for carrying out the simulations, it is possible to keep relying on (13) and to obtain a one-parameter dependence anyway.
3.2. The Numerical Algorithm
On the basis of what has already been described in Section 2, we invoke the same cell-centered finite volume approximation for the spatial discretization of (13) and take care to consider the corresponding versions the piecewise linear diffusion (14) leads to. Specifically, we have
Equation (15) can be rewritten to obtain
where the finite volume integral average for the diffusion is dealt with exactly as in the two-equations-based reduction, so that
Now, if the quantity is constant, we obtain the semi-discrete version
which leads to
Following the same path, for equation (16) in the case of non-uniform mesh, we have
while setting as a constant value,
For the time discretization of (17) and (18), we simply employ an explicit strategy, where is the fixed time step, so that the final numerical scheme reads as
where
It is noticeable that the function K exhibits a jump discontinuity located at .
3.3. Simulation Results
We take advantage of the numerical scheme in (19) and perform numerical simulations in order to validate our one-equation-based reduction (13) for the Gatenby–Gawlinski model. As regards the initial profile, we consider the Riemann problem whose states are at the left and at the right; all the parameters employed are listed in Table 3.
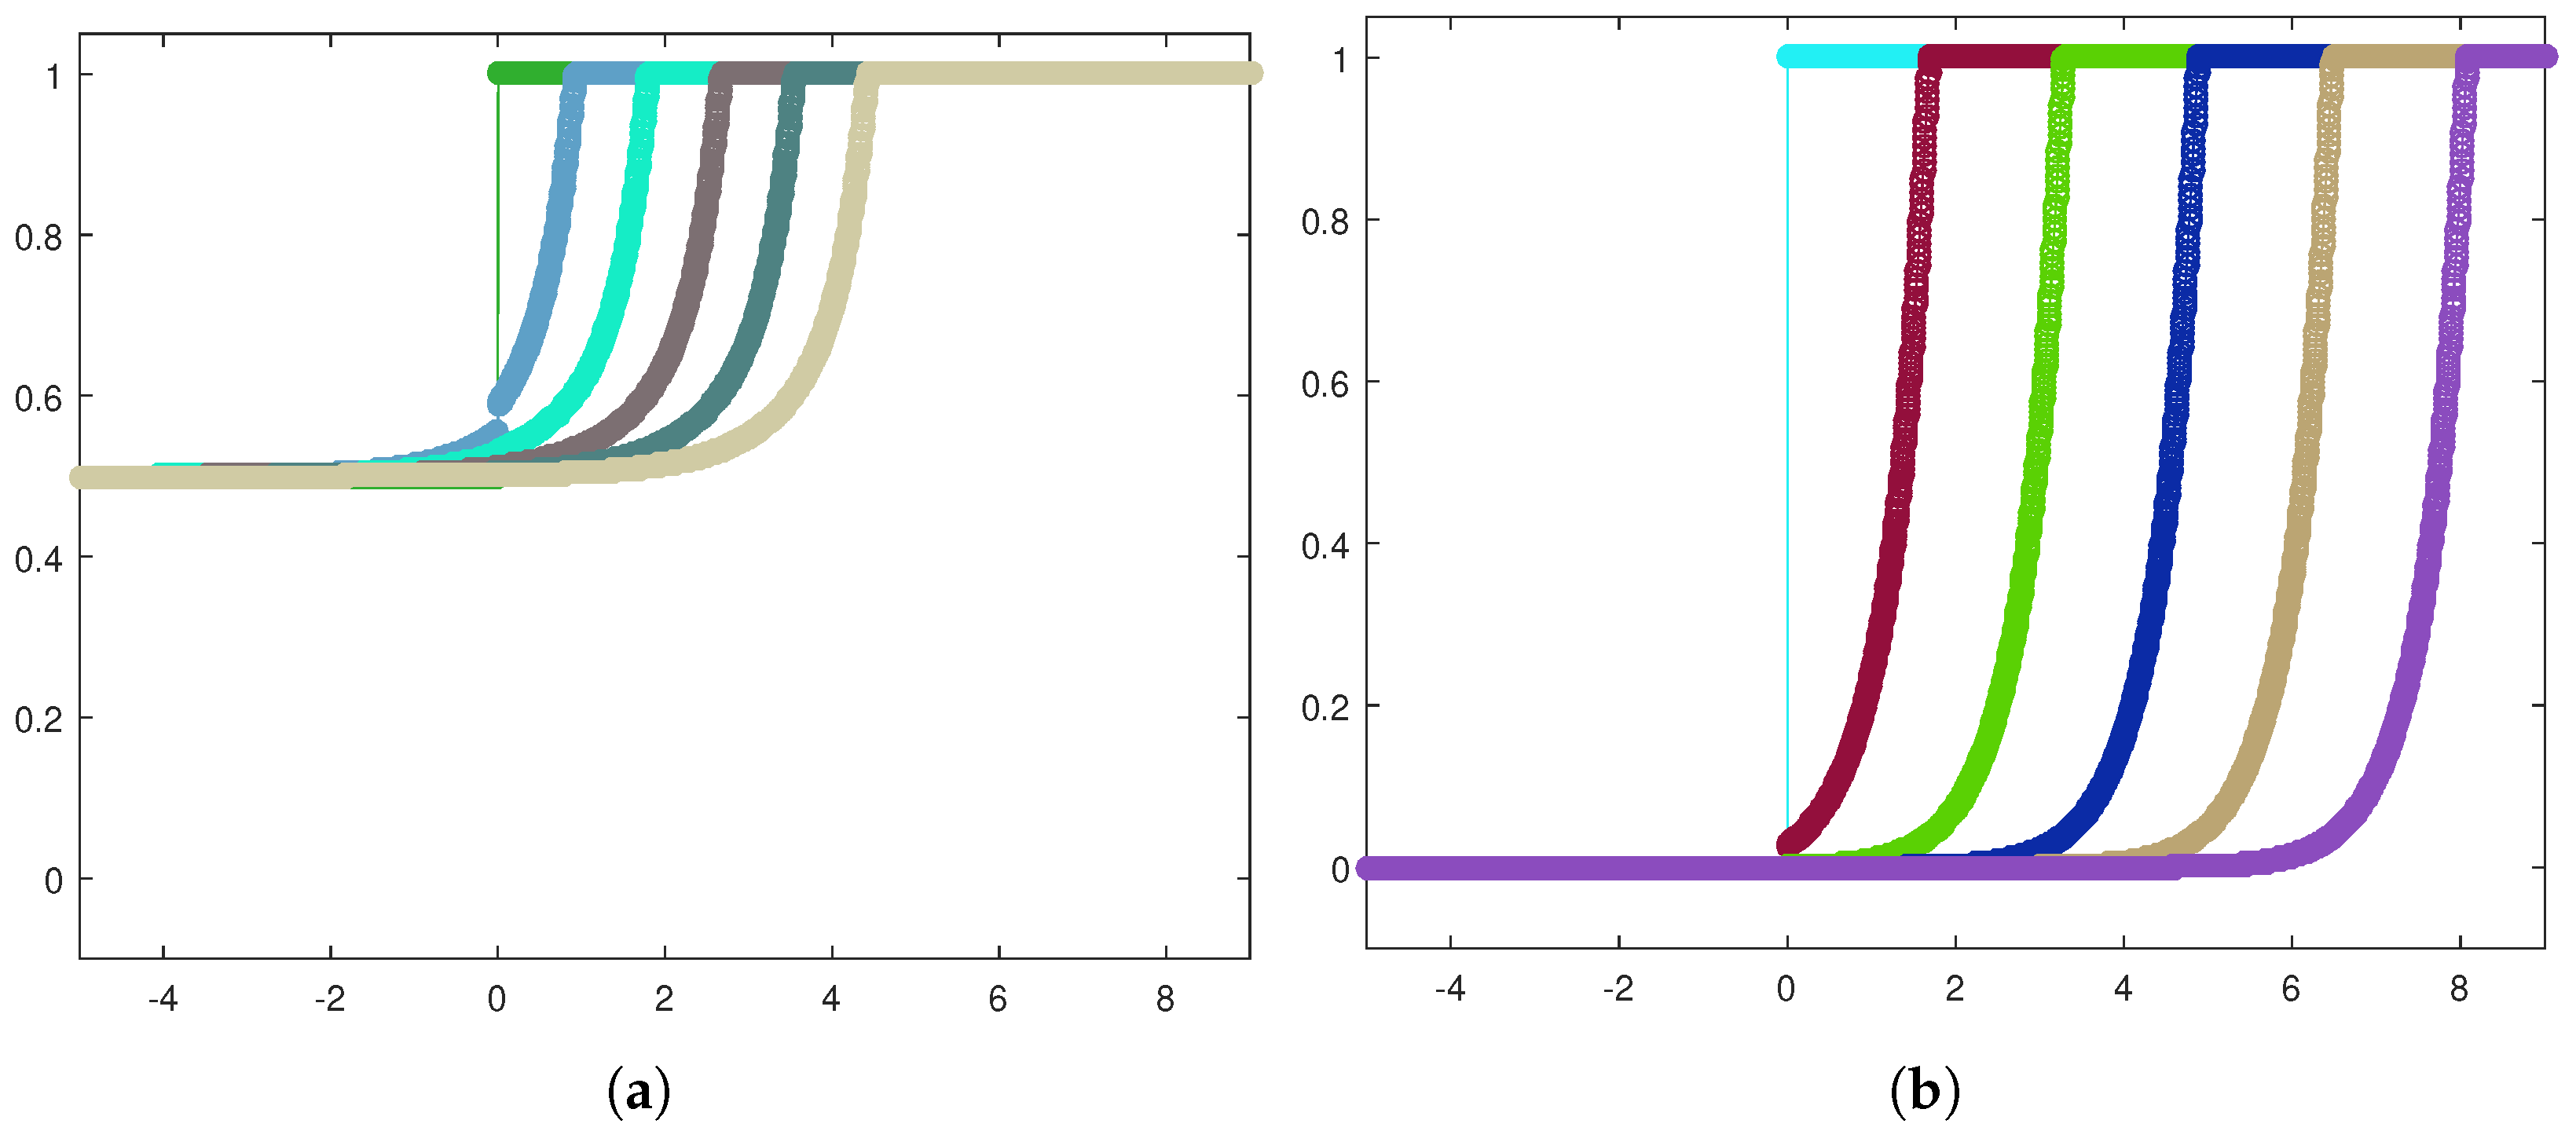
The results are depicted in Figure 10a,b for the heterogeneous and homogeneous invasion, respectively, by means of the front evolution representation. The cancerous cell density is plotted at equally spaced time instants, and, in both the cases, the corresponding traveling waves turn out to be of sharp-type.
For ensuring the effectiveness of the one-equation-based reduction (13), it is important to establish if trends related to tumor invasions are correctly caught. In this respect, Figure 10, as well as providing information about the sharpness of the fronts, certifies that the cancerous cells front moves forward faster in the homogeneous invasion. Specifically, adopting the space-averaged estimate (11), we obtain for the heterogeneous case and for the homogeneous case; these two values are the asymptotic wave speeds of the tumor front. Figure 11 shows the discrete wave speed approximation computed as a function of time ( is taken as a sample) and allows us to appreciate the convergence towards the corresponding asymptotic threshold.
Finally, as further evidence of the reliability of (13), we can obtain information about the healthy cell density too by simply relying on (12). The related graphs are depicted in Figure 12a and Figure 12b, respectively. The plots are realized by simultaneously reporting numerical approximations for the cancerous cell densities, along with the induced healthy cell densities defined by means of (12). The results qualitatively line up with the corresponding ones achieved for the two-equations-based reduction in Section 2, so that the characteristic trends of the Gatenby–Gawlinski model are globally retrieved.
With regard to the model described by (13), it is useful to note that, at least for the heterogeneous invasion, namely, when , the diffusion term turns out to be identically . In order to easily check this statement, recalling the definition of h in (14), it follows that v is always in if , being and bearing in mind the constraint . Due to this fact, the one-equation-based model in this specific case becomes
For degenerate reaction-diffusion equations such as (20), it is possible to obtain an analytical solution [32,33]. In this context, we simply impose that v is a propagating front of the form , s being the associated wave speed, and, after some conventional operations, the exact solution reads as
where . Assuming the previous choice , it follows that , which is a threshold very close to our numerical estimate . For the sake of completeness, we provide a graphical check as well, the plot being depicted in Figure 13. We have chosen to exploit a refined spatio-temporal mesh, namely, and , compared to the parameters listed in Table 3, with the aim of achieving a very effective graphical result. The resulting trajectories are very close and the wave speed approximation is good too, being .
Finally, by analogy with what has been shown in [15], in order to numerically appreciate the transition occurring from the complete Gatenby–Gawlinski model towards the two-equations-based reduction by increasing the parameter c in (1), we propose a similar analysis regarding the one-equation-based model. Indeed, recalling the assumption (12) exploited in (10) for justifying the model simplification, it is possible to study the transition occurring between the two-equations-based and one-equation-based model by defining the -dependent time derivative of the function u. We obtain
At this stage, we can easily infer that, taking the limit as the parameter approaches zero in the first equation of (22), that this perfectly matches, from a theoretical point of view, the idea behind the hypothesis (12), which automatically leads to (13).
Now, we want to catch the transition, either employing the wave speed numerical estimate (11), which is the approach proposed in [15], or taking advantage of the solution (21). As a matter of fact, considering the heterogeneous invasion context, we can rely on the exact solution for the one-equation-based model and exploit it to verify the transition from the two-equations reduction.
Figure 14a exhibits the wave speed numerical approximations achieved by assuming decreasing values in (22) in the case of the tumor cells front. The resulting trend correctly reports a convergence towards the asymptotic threshold , which is the analytical prediction for (20). Moreover, the exact solution (21) allows us to graphically recognize the transition towards (20) by means of a convergence check. Figure 14b reports the tumor density numerical approximation provided by (22) as a function of some values taken as a sample. It is possible to detect a progressive alignment with the analytical solution (21).
4. Conclusions
In this paper, we have investigated the Gatenby–Gawlinski model for tumor invasion taking advantage of some useful system simplifications. In continuity with the study carried out in [15], we have extended the available results for the two-equations-based reduction, specifically analyzing the sharpness/smoothness of the fronts by means of numerical simulations based on a finite volume approximation.
A sensitivity analysis with respect to the system parameters r and d in (10) has been provided as well, by using as unknown the wave speed, whose numerical approximation is achieved through a space-averaged estimate [15,16].
Subsequently, we have proposed a further system simplification leading to a one-equation-based reduction, framed within the degenerate reaction-diffusion equations field. Several results are available in the literature about the existence and uniqueness of sharp/smooth-type fronts for such a mathematical problem [17,18,20,21], but as regards our case (13), due to the almost everywhere differentiability in of the degenerate diffusion, relying on numerical checks is required in order to establish the fronts shape. The evidence is that the traveling wave arising from our one-equation reduction proves itself to be of the sharp-type. We have shown the reduction to qualitatively catch the typical dynamics of the Gatenby–Gawlinski model and, in the specific case of heterogeneous invasion, we have provided the corresponding analytical solution as well, exploiting its availability to verify the simulation results effectiveness. Finally, we have studied the transition from the two-equations-based reduction towards the one-equation-based simplification by defining the -dependent time derivative of the healthy cell density u, as in (22).
With regard to the necessity to lean on numerical assessments about the sharpness detection in the one-equation reduction case, arising from the requirement for a more regular degenerate diffusion in terms of the available theoretical results [17,20], the possibility of employing a smoother approximation to bypass the almost everywhere differentiability of the diffusion seems to represent very promising ground. In this way, enough regularity would be ensured to prove the existence and uniqueness results for the traveling fronts.
Author Contributions
Conceptualization, C.M. and C.S.; Methodology, C.M., P.M. and C.S.; Software, P.M. and C.S.; Validation, C.M., P.M. and C.S.; Formal analysis, C.M., P.M. and C.S.; Investigation, C.M., P.M. and C.S.; Data curation, P.M. and C.S.; Writing—original draft, C.M., P.M. and C.S.; Writing—review & editing, C.M.; Visualization, P.M. and C.S.; Supervision, C.M. and C.S. All authors have read and agreed to the published version of the manuscript.
Funding
C. Mascia has been partially supported by the MIUR PRIN project 2020XB3EFL “Hamiltonian and Dispersive PDEs”. C. Simeoni thanks the Department of Mathematics G. Castelnuovo, Sapienza, University of Rome (Italy), for the invitation during which the drafting of this manuscript has been completed.
Data Availability Statement
Data are contained within the article.
Acknowledgments
The authors are thankful to Thierry Gallay for valuable discussions which improved the quality of the manuscript. They would also like to thank the referees for their careful reading and indispensable comments.
Conflicts of Interest
The authors declare no conflicts of interest.
References
- Gatenby, R.A.; Maini, P.K.; Gawlinski, E.T. Analysis of tumor as an inverse problem provides a novel theoretical framework for understanding tumor biology and therapy. Appl. Math. Lett. 2002, 15, 339–345. [Google Scholar] [CrossRef]
- Warburg, O. The Metabolism of Tumors; Arnold Constable: London, UK, 1930. [Google Scholar]
- Warburg, O. On the origin of cancer cells. Science 1956, 123, 309–314. [Google Scholar] [CrossRef] [PubMed]
- Bertuzzi, A.; Fasano, A.; Gandolfi, A.; Sinisgalli, C. Necrotic core in EMT6/Ro tumour spheroids: Is it caused by an ATP deficit? J. Theor. Biol. 2010, 262, 142–150. [Google Scholar] [CrossRef] [PubMed]
- Bertuzzi, A.; Fasano, A. A model combining acid-mediated tumour invasion and nutrient dynamics. Nonlinear Anal. Real World Appl. 2009, 10, 1955–1975. [Google Scholar]
- Gatenby, R.A.; Gawlinski, E.T. The glycolytic phenotype in carcinogenesis and tumor invasion: Insights through mathematical models. Cancer Res. 2003, 63, 3847–3854. [Google Scholar]
- Gatenby, R.A.; Gillies, R.J. Why do cancers have high aerobic glycolysis? Nat. Rev. Cancer 2004, 4, 891–899. [Google Scholar] [CrossRef] [PubMed]
- Gatenby, R.A.; Gawlinski, E.T.; Gmitro, A.F.; Kaylor, B.; Gillies, R.J. Acid-meditated tumour invasion: A multidisciplinary study. Cancer Res. 2006, 66, 5216–5223. [Google Scholar] [CrossRef]
- Gatenby, R.A.; Gillies, R.J. Glycolysis in cancer: A potential target for therapy. Int. J. Biochem. Cell Biol. 2007, 39, 1358–1366. [Google Scholar] [CrossRef]
- Smallbone, K.; Gatenby, R.A.; Maini, P.K. Mathematical modelling of tumour acidity. J. Theor. Biol. 2008, 255, 106–112. [Google Scholar] [CrossRef]
- Gatenby, R.A.; Gawlinski, E.T. A reaction-diffusion model of cancer invasion. Cancer Res. 1996, 56, 5745–5753. [Google Scholar]
- Fasano, A.; Herrero, M.G.; Rodrigo, M.R. Slow and fast invasion waves in a model of acid-mediated tumour growth. Math. Biosci. 2009, 220, 45–56. [Google Scholar] [CrossRef] [PubMed]
- Davis, P.N.; van Heijster, P.; Marangell, R.; Rodrigo, M.R. Traveling wave solutions in a model for tumor invasion with the acid-mediation hypothesis. J. Dyn. Differ. Equ. 2022, 34, 1325–1347. [Google Scholar] [CrossRef]
- McGillen, J.B.; Gaffney, E.A.; Martin, N.K.; Maini, P.K. A general reaction-diffusion model of acidity in cancer invasion. J. Math. Biol. 2014, 68, 1199–1224. [Google Scholar] [CrossRef] [PubMed]
- Moschetta, P.; Simeoni, C. Numerical investigation of the Gatenby–Gawlinski model for acid-mediated tumour invasion. Rend. Mat. Appl. 2019, 40, 257–287. [Google Scholar]
- LeVeque, R.J.; Yee, H.C. A study of numerical methods for hyperbolic conservation laws with stiff source terms. J. Comput. Phys. 1990, 86, 187–210. [Google Scholar] [CrossRef]
- Malaguti, L.; Marcelli, C. Sharp profiles in degenerate and doubly degenerate Fisher-KPP equations. J. Differ. Equ. 2003, 195, 471–496. [Google Scholar] [CrossRef]
- Sánchez-Garduño, F.; Maini, P.K. Existence and uniqueness of a sharp travelling wave in degenerate non-linear diffusion Fisher-KPP equations. J. Math. Biol. 1994, 33, 163–192. [Google Scholar] [CrossRef]
- Sánchez-Garduño, F.; Maini, P.K. An approximation to a sharp type solution of a density-dependent reaction-diffusion equation. Appl. Math. Lett. 1994, 7, 47–51. [Google Scholar] [CrossRef]
- Sánchez-Garduño, F.; Maini, P.K. Traveling wave phenomena in some degenerate reaction-diffusion equations. J. Differ. Equ. 1995, 117, 281–319. [Google Scholar] [CrossRef]
- Sánchez-Garduño, F.; Maini, P.K.; Kappos, M.E. A shooting argument approach to a sharp-type solution for nonlinear degenerate Fisher-KPP equations. IMA J. Appl. Math. 1996, 57, 211–221. [Google Scholar] [CrossRef]
- Sánchez-Garduño, F.; Maini, P.K. Travelling wave phenomena in non-linear diffusion degenerate Nagumo equations. J. Math. Biol. 1197, 35, 713–728. [Google Scholar] [CrossRef]
- Browning, A.P.; Haridas, P.; Simpson, M.J. A Bayesian sequential learning framework to parametrise continuum models of melanoma invasion into human skin. Bull. Math. Biol. 2019, 81, 676–698. [Google Scholar] [CrossRef] [PubMed]
- Colson, C.; Sánchez-Garduno, F.; Byrne, H.M.; Maini, P.K.; Lorenzi, T. Travelling-wave analysis of a model of tumour invasion with degenerate, cross-dependent diffusion. Proc. R. Soc. A 2021, 477, 20210593. [Google Scholar] [CrossRef] [PubMed]
- El-Hachem, M.; McCue, S.; Simpson, M. Travelling wave analysis of cellular invasion into surrounding tissues. Phys. D Nonlinear Phenom. 2021, 428, 133026. [Google Scholar] [CrossRef]
- Keller, E.F.; Segel, L.A. Initiation of slime mold aggregation viewed as an instability. J. Theor. Biol. 1970, 26, 399–415. [Google Scholar] [CrossRef] [PubMed]
- Keller, E.F.; Segel, L.A. Traveling bands of chemotactic bacteria: A theoretical analysis. J. Theor. Biol. 1971, 30, 235–248. [Google Scholar] [CrossRef] [PubMed]
- Arumugam, G.; Tyagi, J. Keller-Segel Chemotaxis Models: A Review. Acta Appl. Math. 2020, 171, 1–82. [Google Scholar] [CrossRef]
- Wesseling, P. Principles of Computational Fluid Dynamics; Springer: Berlin/Heidelberg, Germany, 2001. [Google Scholar]
- Quarteroni, A. Numerical Models for Differential Problems; Springer: Milan, Italy, 2014. [Google Scholar]
- Gallay, T.; Mascia, C. Propagation fronts in a simplified model of tumor growth with degenerate cross-dependent self-diffusivity. Nonlinear Anal. Real World Appl. 2022, 63, 103387. [Google Scholar] [CrossRef]
- Newman, W.I. Some exact solutions to a non-linear diffusion problem in population genetics and combustion. J. Theor. Biol. 1980, 85, 325–334. [Google Scholar] [CrossRef]
- Newman, W.I. The long-time behavior of the solution to a non-linear diffusion problem in population genetics and combustion. J. Theor. Biol. 1983, 104, 473–484. [Google Scholar] [CrossRef]
Figure 1.
Piecewise constant reconstruction on non-uniform mesh.

Figure 2.
Simulation results in the full model case (1) for the homogeneous invasion: u healthy cells (red), v tumor cells (blue), w lactic acid concentration (black). The parameters are listed in Table 1.

Figure 3.
Front evolution zoom-in for the healthy cell density (a) and the tumor cell density (b).

Figure 4.
Riemann problem for the heterogeneous case (a) and the homogeneous case (b). In both cases, u healthy cells (red), v tumor cells (blue). Parameters are listed in Table 2.
Figure 4.
Riemann problem for the heterogeneous case (a) and the homogeneous case (b). In both cases, u healthy cells (red), v tumor cells (blue). Parameters are listed in Table 2.

Figure 5.
Numerical solutions for the heterogeneous case (a) and the homogeneous case (b). In both cases, u healthy cells (red), v tumor cells (blue). Parameters are listed in Table 2.
Figure 5.
Numerical solutions for the heterogeneous case (a) and the homogeneous case (b). In both cases, u healthy cells (red), v tumor cells (blue). Parameters are listed in Table 2.

Figure 6.
Front evolution zoom-in for the tumor cell density in the heterogeneous case (a) and the homogeneous case (b).
Figure 6.
Front evolution zoom-in for the tumor cell density in the heterogeneous case (a) and the homogeneous case (b).

Figure 7.
Front evolution zoom-in for the healthy cell density in the heterogeneous case (a) and the homogeneous case (b).
Figure 7.
Front evolution zoom-in for the healthy cell density in the heterogeneous case (a) and the homogeneous case (b).

Figure 8.
Graph of as a function of the parameter , with , for the homogeneous invasion when (a) and graph of as a function of the parameter , with and (b).
Figure 8.
Graph of as a function of the parameter , with , for the homogeneous invasion when (a) and graph of as a function of the parameter , with and (b).

Figure 9.
Dependency of the speed on space discretization represented in the -plane for the Riemann problem with data , , , .
Figure 9.
Dependency of the speed on space discretization represented in the -plane for the Riemann problem with data , , , .

Figure 10.
Front evolution for the tumor cell density in the heterogeneous case (a) and the homogeneous case (b). The parameters used are listed in Table 3.
Figure 10.
Front evolution for the tumor cell density in the heterogeneous case (a) and the homogeneous case (b). The parameters used are listed in Table 3.

Figure 11.
Space-averaged propagation speed approximations as a function of time for the heterogeneous invasion. The parameters used are listed in Table 3.
Figure 11.
Space-averaged propagation speed approximations as a function of time for the heterogeneous invasion. The parameters used are listed in Table 3.

Figure 12.
Numerical approximation of the tumor cells (blue) along with the corresponding healthy cells profile (red), recovered by means of (12), for both the heterogeneous case (a) and the homogeneous case (b). The parameters used are listed in Table 3.

Figure 13.
Exact solution and corresponding tumor density numerical approximation for the one-equation-based model in the case of heterogeneous invasion. The spacial and time steps are and , respectively.
Figure 13.
Exact solution and corresponding tumor density numerical approximation for the one-equation-based model in the case of heterogeneous invasion. The spacial and time steps are and , respectively.

Figure 14.
Wave speeds estimates (blue circles) for in (22) if along with the wave speed analytical value (red line) provided by (21) (a) and convergence of the tumor density numerical approximation from (22), as a function of specific values, towards the exact solution (21) (b). The parameters used are listed in Table 3.


Table 1.
Numerical default values for the parameters in the complete model case.
| d | r | D | T |
|---|---|---|---|
| 12.5 | 1 | 20 |
Table 2.
Numerical default values for the parameters involved in the simplified model.
| d | r | T | ||
|---|---|---|---|---|
| 1 | 20 |
Table 3.
Numerical default values for the parameters involved in the reduction (13).
Table 3.
Numerical default values for the parameters involved in the reduction (13).
| d | T | ||
|---|---|---|---|
| 20 |
Disclaimer/Publisher’s Note: The statements, opinions and data contained in all publications are solely those of the individual author(s) and contributor(s) and not of MDPI and/or the editor(s). MDPI and/or the editor(s) disclaim responsibility for any injury to people or property resulting from any ideas, methods, instructions or products referred to in the content. |
© 2024 by the authors. Licensee MDPI, Basel, Switzerland. This article is an open access article distributed under the terms and conditions of the Creative Commons Attribution (CC BY) license (https://creativecommons.org/licenses/by/4.0/).
Share and Cite
MDPI and ACS Style
Mascia, C.; Moschetta, P.; Simeoni, C. Numerical Investigation of Some Reductions for the Gatenby–Gawlinski Model. Axioms 2024, 13, 281. https://doi.org/10.3390/axioms13050281
AMA Style
Mascia C, Moschetta P, Simeoni C. Numerical Investigation of Some Reductions for the Gatenby–Gawlinski Model. Axioms. 2024; 13(5):281. https://doi.org/10.3390/axioms13050281
Chicago/Turabian StyleMascia, Corrado, Pierfrancesco Moschetta, and Chiara Simeoni. 2024. "Numerical Investigation of Some Reductions for the Gatenby–Gawlinski Model" Axioms 13, no. 5: 281. https://doi.org/10.3390/axioms13050281
Note that from the first issue of 2016, this journal uses article numbers instead of page numbers. See further details here.