
Toward Measuring Network Aesthetics Based on Symmetry
by
 and
and
Zengqiang Chen
1, 
Matthias Dehmer
1,2,*,
Frank Emmert-Streib
3,
Abbe Mowshowitz
4,* and
Yongtang Shi
5 1
College of Computer and Control Engineering, Nankai University, Tianjin 300350, China
2
Department of Mechatronics and Biomedical Computer Science, University for Health Sciences,Medical Informatics and Technology (UMIT), 6060 Hall, Tyrol, Austria
3
Predictive Medicine and Analytics Lab, Department of Signal Processing, Tampere University of Technology,33720 Tampere, Finland
4
Department of Computer Science, The City College of New York (CUNY), 138th Street at Convent Avenue,New York, NY 10031, USA
5
Center for Combinatorics and LPMC, Nankai University, Tianjin 300071, China
*
Authors to whom correspondence should be addressed.
Axioms 2017, 6(2), 12; https://doi.org/10.3390/axioms6020012
Submission received: 20 March 2017
/
Revised: 3 May 2017
/
Accepted: 3 May 2017
/
Published: 6 May 2017
(This article belongs to the Special Issue Entropy and Information Theory)
Abstract
:In this exploratory paper, we discuss quantitative graph-theoretical measures of network aesthetics. Related work in this area has typically focused on geometrical features (e.g., line crossings or edge bendiness) of drawings or visual representations of graphs which purportedly affect an observer’s perception. Here we take a very different approach, abandoning reliance on geometrical properties, and apply information-theoretic measures to abstract graphs and networks directly (rather than to their visual representaions) as a means of capturing classical appreciation of structural symmetry. Examples are used solely to motivate the approach to measurement, and to elucidate our symmetry-based mathematical theory of network aesthetics.
1. Introduction
The aim of this paper is to introduce a measure of graph and network aesthetics based on symmetry, and thereby lay a foundation for a theory that applies to abstract graphs rather than drawings or visual representations of such mathematical objects. Symmetry is a basic attribute of aesthetic appreciation, and since this is captured by the automorphism group which is an important element in the analysis of abstract graphs, symmetry is a reasonable platform on which to build an aesthetic theory. It is important to note that our measure is quite independent of visual perception. However, it is useful to position the current research in the literature dealing with aesthetic measurement, so we begin with a brief review of that literature.
Measuring the aesthetics of objects has a long tradition in several disciplines. Important examples are semiotics and computational linguistics, where the aesthetics of languages has been studied extensively [1,2,3,4]. A particularly influential approach to quantitative measurement of aesthetics was developed by Birkhoff [5,6]. Birkhoff’s theory is based on the analysis of material objects such as vases whose features can represented as polygons, thus allowing for the assignment of numerical values to the features [5]. According to the theory, perception of an object depends on the following two general features [5,6]:
- order O (e.g., symmetry of a polygon),
- complexity C (e.g., number of straight lines of a polygon),
Birkhoff’s [5] aesthetical measure is defined by
Of particular interest here, Birkhoff [5] applied the measure to objects whose geometry could be interpreted in terms of networks. The basis for this network interpretation is the use of polygons to represent the geometry of an object [5]. All that is needed to convert a polygon into a network (graph) is the identification of points (vertices) as “end points” in the structure. Interestingly, [5] did not use “pure” graph-theoretical features in deriving the aesthetical measure given by Equation (1). Bense [7] and Moles [8] extended Birkhoff’s theory by using information-theoretic measures and applied them to various problems in cybernetics and sociology. A review of information-theoretic measures applied to the aesthetics of paintings can be found in [9].
Birkhoff’s measure has been discussed and extended by many researchers [9,10]. Galivanter [10] stimulated much debate about the applicability of the two parameters O and C of Birkhoffs formula (see Equation (1)). Galivanter discussed the meaning of C and O, and argued that Birkhoff regarded these quantities as proxies for the effort required (C), and the tension released (O) in perceptual cognition [10]. In response to these observations, Birkhoff’s theory has been further developed (e.g., the contributions cited earlier—i.e., Bense [7] and Moles [8]) to overcome lack of interpretability and to add more conceptual rigor [10].
In [11], Purchase defines several measures of graph aesthetics based on geometrical features (e.g., edge crossings and bends) of graph drawings. Several other measures of the aesthetics of networks or network-like structures have also been defined and studied (e.g., [11,12,13]). Moreover, Ware et al. [13] review measures of graph aesthetics defined in [11], and in particular evaluate the cognitive cost to an observer of different visual representations.
A major objective guiding the design of geometry-based measures has been the desire to improve readability of diagrams and networks. Such illustrative aids play an important role in the development and analysis of software and in web graphs [14]. The indices discussed and evaluated numerically by Ware et al. [13] are based on aesthetic principles manifested by edge bends, edge crosses, maximizing the minimum angle, orthogonality, and symmetry [13]. For further details, see [12,13].
Another approach to aesthetic measurement has been taken by Dehmer et al. [15], who introduced a notation for measuring network style. This approach is based on comparative graph analysis [15]. In our current work, however, we argue that properties expressing structural features can be measured by single graph complexity measures (e.g., [16]), however difficult it may be to relate the numerical value of a measure to any specific structural features of a graph.
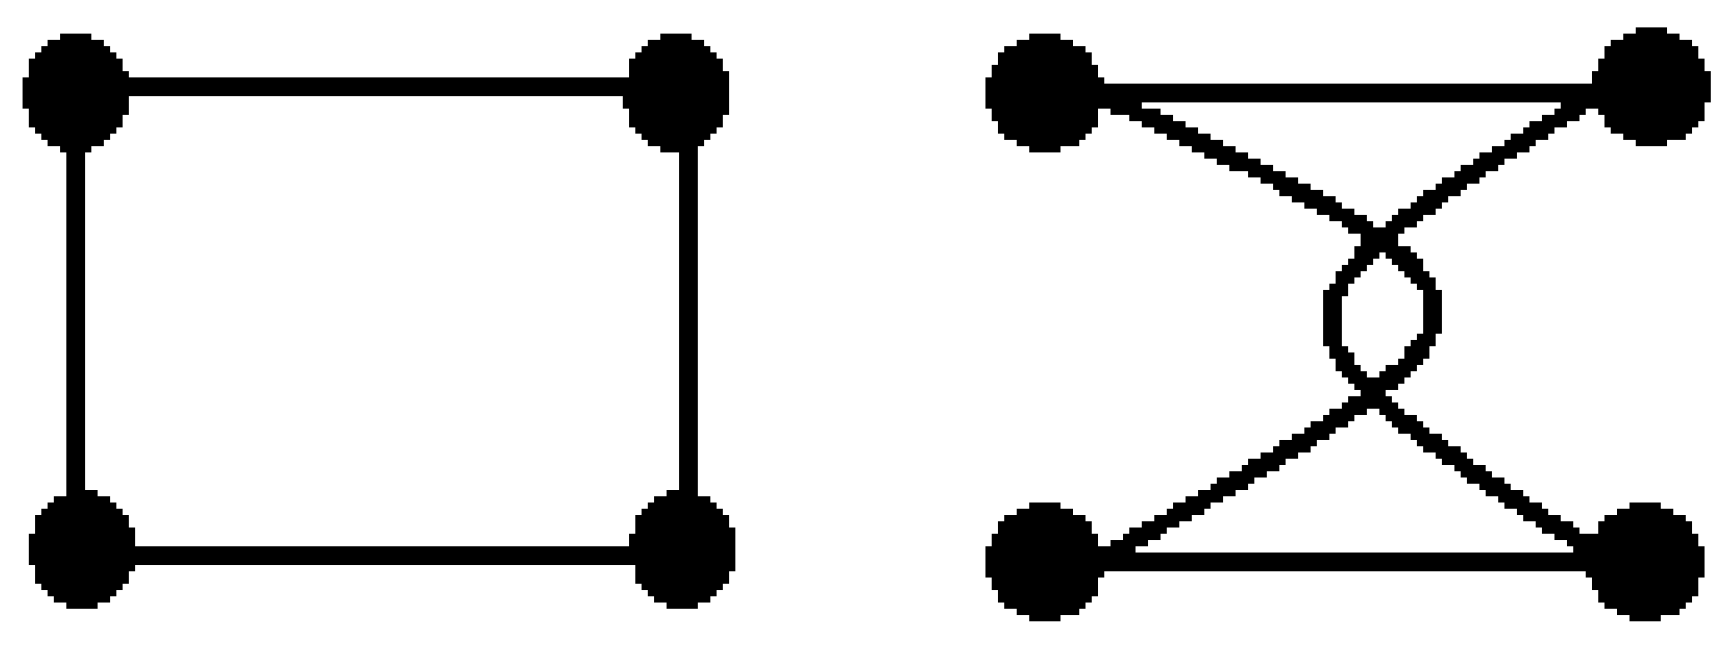
In what follows, we examine the question of how to measure the aesthetics of a network modeled as an abstract graph. Thus, we do not take account of geometrical properties or visual representations except for the purposes of comparison with the graph structure measures introduced. This is a purely theoretical approach to graph aesthetics which may or may not offer ways of improving the readability of drawings. The measures discussed by Ware et al. [13] are not directly comparable with the ones we wish to apply as they are based on different assumptions. The measures examined in [13] take account of geometrical properties of networks such as keeping multi-edge paths as straight as possible (i.e., avoiding zig-zag paths). Geometrical features play no role in structural measures of graphs, since such measures only take account of features such as density, symmetry, sparsity, branching, and so forth (e.g., [16,17,18]). This situation is shown by way of example in Figure 1; a purely structural graph measure cannot distinguish those two graphs. Hence, we expect our results to be different from those obtained by the methods proposed in [13], and draw appropriate conclusions for formalization of our approach (see Section “Conclusion”).
2. Quantitative Methods and Network Aesthetic Measurement
Methods and measures for quantifying structural properties of networks have been examined extensively [19,20,21]. Some of these methods and measures emerged in the late 1950s and early 1960s, applying information-theoretic measures based on Shannon entropy to structural problems in chemistry and biology [21,22,23,24,25]. A well-known example is the graph entropy measure introduced by Rashevsky [25] and developed extensively by Mowshowitz [21], which is based on the vertex orbits of the automorphism group of a graph. Since automorphisms are permutations of graph elements preserving structure, this measure can be regarded as an index of symmetry [16,26]. Many other information-theoretic and non-information-theoretic graph measures for capturing features of the complexity of a network have been proposed (e.g., [19,20,27,28,29]). They have been applied in various disciplines, including discrete mathematics, computer science, mathematical chemistry, and computational biology [20,30,31] and mathematical ecology [29,32,33]. This paper focuses exclusively on measures of symmetry. Consideration of other types of measures is beyond the scope of the current work.
As noted above, Dehmer et al. [15] defined a notion of style for measuring structural properties of networks and graphs. In this work, a style has been defined as a set of graphs with intrinsic structural properties (see also [34]). In order to measure style, Dehmer et al. compared the styles (graph classes) in relation to the median graph [15,35,36]. This means that styles can be measured by comparing measurements based on the median graph with quantitative graph similarity measures [37,38].
Another way of measuring stylistic properties of (single) networks was introduced in [34]. Here it was argued—by way of example—that a stylistic property might be a structural feature of a graph characteristic of a class of graphs. Examples of such structural features representing a style are connectedness of a network [17], balanced or unbalanced properties [39], structural branching [18,40], and symmetry [21,41,42,43], but also other structural features such as the existence of directed or undirected edges and hierarchical properties [44].
The network in Figure 2a shows the Munich subway network [45,46]. This is an example of a transportation network [47] where the special hub view has been generated using the R-based network visualization tool NetBioV [48]. By contrast, the network in Figure 2b represents a transcriptional regulatory network inferred from yeast (see also [49]). These two networks are both undirected and unlabeled, and it should be noted that our definition of aesthetics focuses exclusively on structural properties, e.g., symmetry. This concept could easily be extended to include semantic and functional issues. Such an extension would generate a mapping for measuring aesthetics of structured objects based on the three parameters: structure, semantics, and function. The space of network styles (Style(G)) represents a graph class. So, the mapping enables us to find parameters (e.g., measures) for their structure, semantics, and function in a more simplified space. For example, structural properties can be mapped to the reals. We plan to define this formally and study the properties of such mappings in future work.
3. Methods and Discussion
The aesthetic measure introduced by Birkhoff [5] is clearly quite different from a stylistic measure for networks. As indicated earlier, the main reason is that Birkhoff’s measure takes account of geometrical properties such as vertical and horizontal symmetry, length of lines, etc. for measuring aesthetics and harmony. By contrast, the structure of networks is solely dependent on a set of vertices and the edges joining them [50]. Attaching to a graph some geometrical and visual features [51] such as edge crossings and edge bends gives rise to the kind of measures developed by [13]. The stylistic properties we intend to capture here are restricted to the structural properties of graphs. Therefore, the meaning of aesthetical style measurement of networks is also restricted to some of their obvious structural features, such as symmetry or disorder.
3.1. Graph-Theoretical Definitions
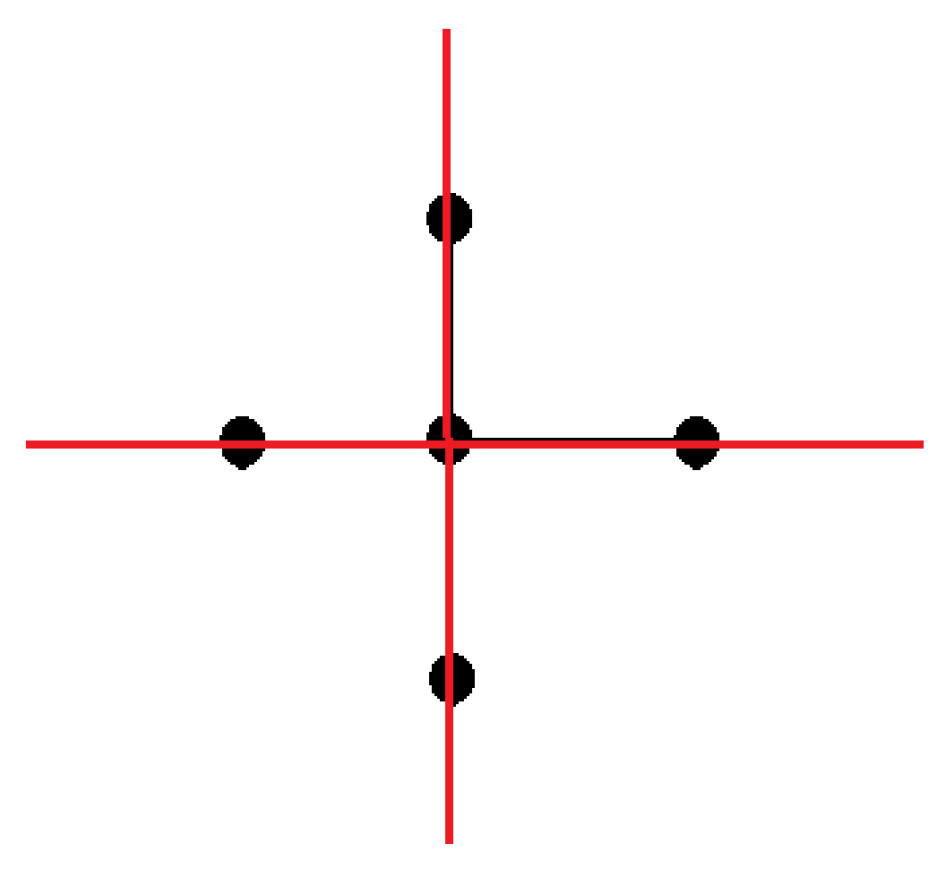
Restricting consideration to symmetry-based measures of graphs produces results quite different from those obtained with measures utilizing geometrical symmetry—horizontal or vertical lines (e.g., Figure 3). This stems from the fact that graph-theoretical symmetry is based on the partition of the vertices of a graph given by the orbits of its automorphism group [52,53]. In order to measure the complexity of a network based on this approach, the so-called topological information content was defined by [25] and later mathematically investigated by Mowshowitz [21,54,55,56]:
Let , where V denotes the non-empty set of vertices, E the set of edges, and is the automorphism group of graph G. is the set of edge-preserving permutations of the vertices. The i-th orbit of —denoted by ()—can be interpreted as a set of topologically-equivalent vertices. The collection of k orbits partitions V, and thus allows for computing the Shannon entropy of the finite probability scheme with probabilities as indicated in Equation (2). Clearly, vanishes if is transitive, and reaches the maximum value when there are no automorphisms other than the identity [50,53]. The complete graph and its complement the null graph have transitive automorphism groups, and so do graphs consisting of a single cycle with n vertices. For simplicity, we will refer to a graph whose automorphism group is transitive as a transitive graph. Note that questions of the computation of the automorphism group of a graph are beyond the scope of this paper. This computation is a hard problem, even for relatively small graphs. Recent work on computational aspects of graph isomorphism (and by extension, graph automorphism) has been reported by McKay and Piperno [57].
3.2. Results
Since every automorphism must preserve vertex degree, all transitive graphs are regular (i.e., every vertex has the same degree) [50]. However, it is far from the case that all regular graphs are transitive. In fact, for every degree value of three or more, there are regular graphs whose only automorphism is the identity. In general, the higher the value of , the more asymmetric is the graph.
That means the degree of symmetry is low when most of the vertex orbits of G are singleton sets, as suggested by the fact that the maximum is attained for networks with the identity group. The following numerical examples show that gives results different from those obtained by measures taking account of geometrical properties such as path bendiness, number of crossings, average crossing angles, number of branches, and shortest path length [13].
Evidently, the measure does not reflect aesthetic factors related to geometry such as bendiness and angles, which contribute to the visual harmony of a network. An aesthetic style measure relying purely on graph-theoretical properties obviously leads to different and possibly weaker results than by using the apparatus due to Ware et al. [13].
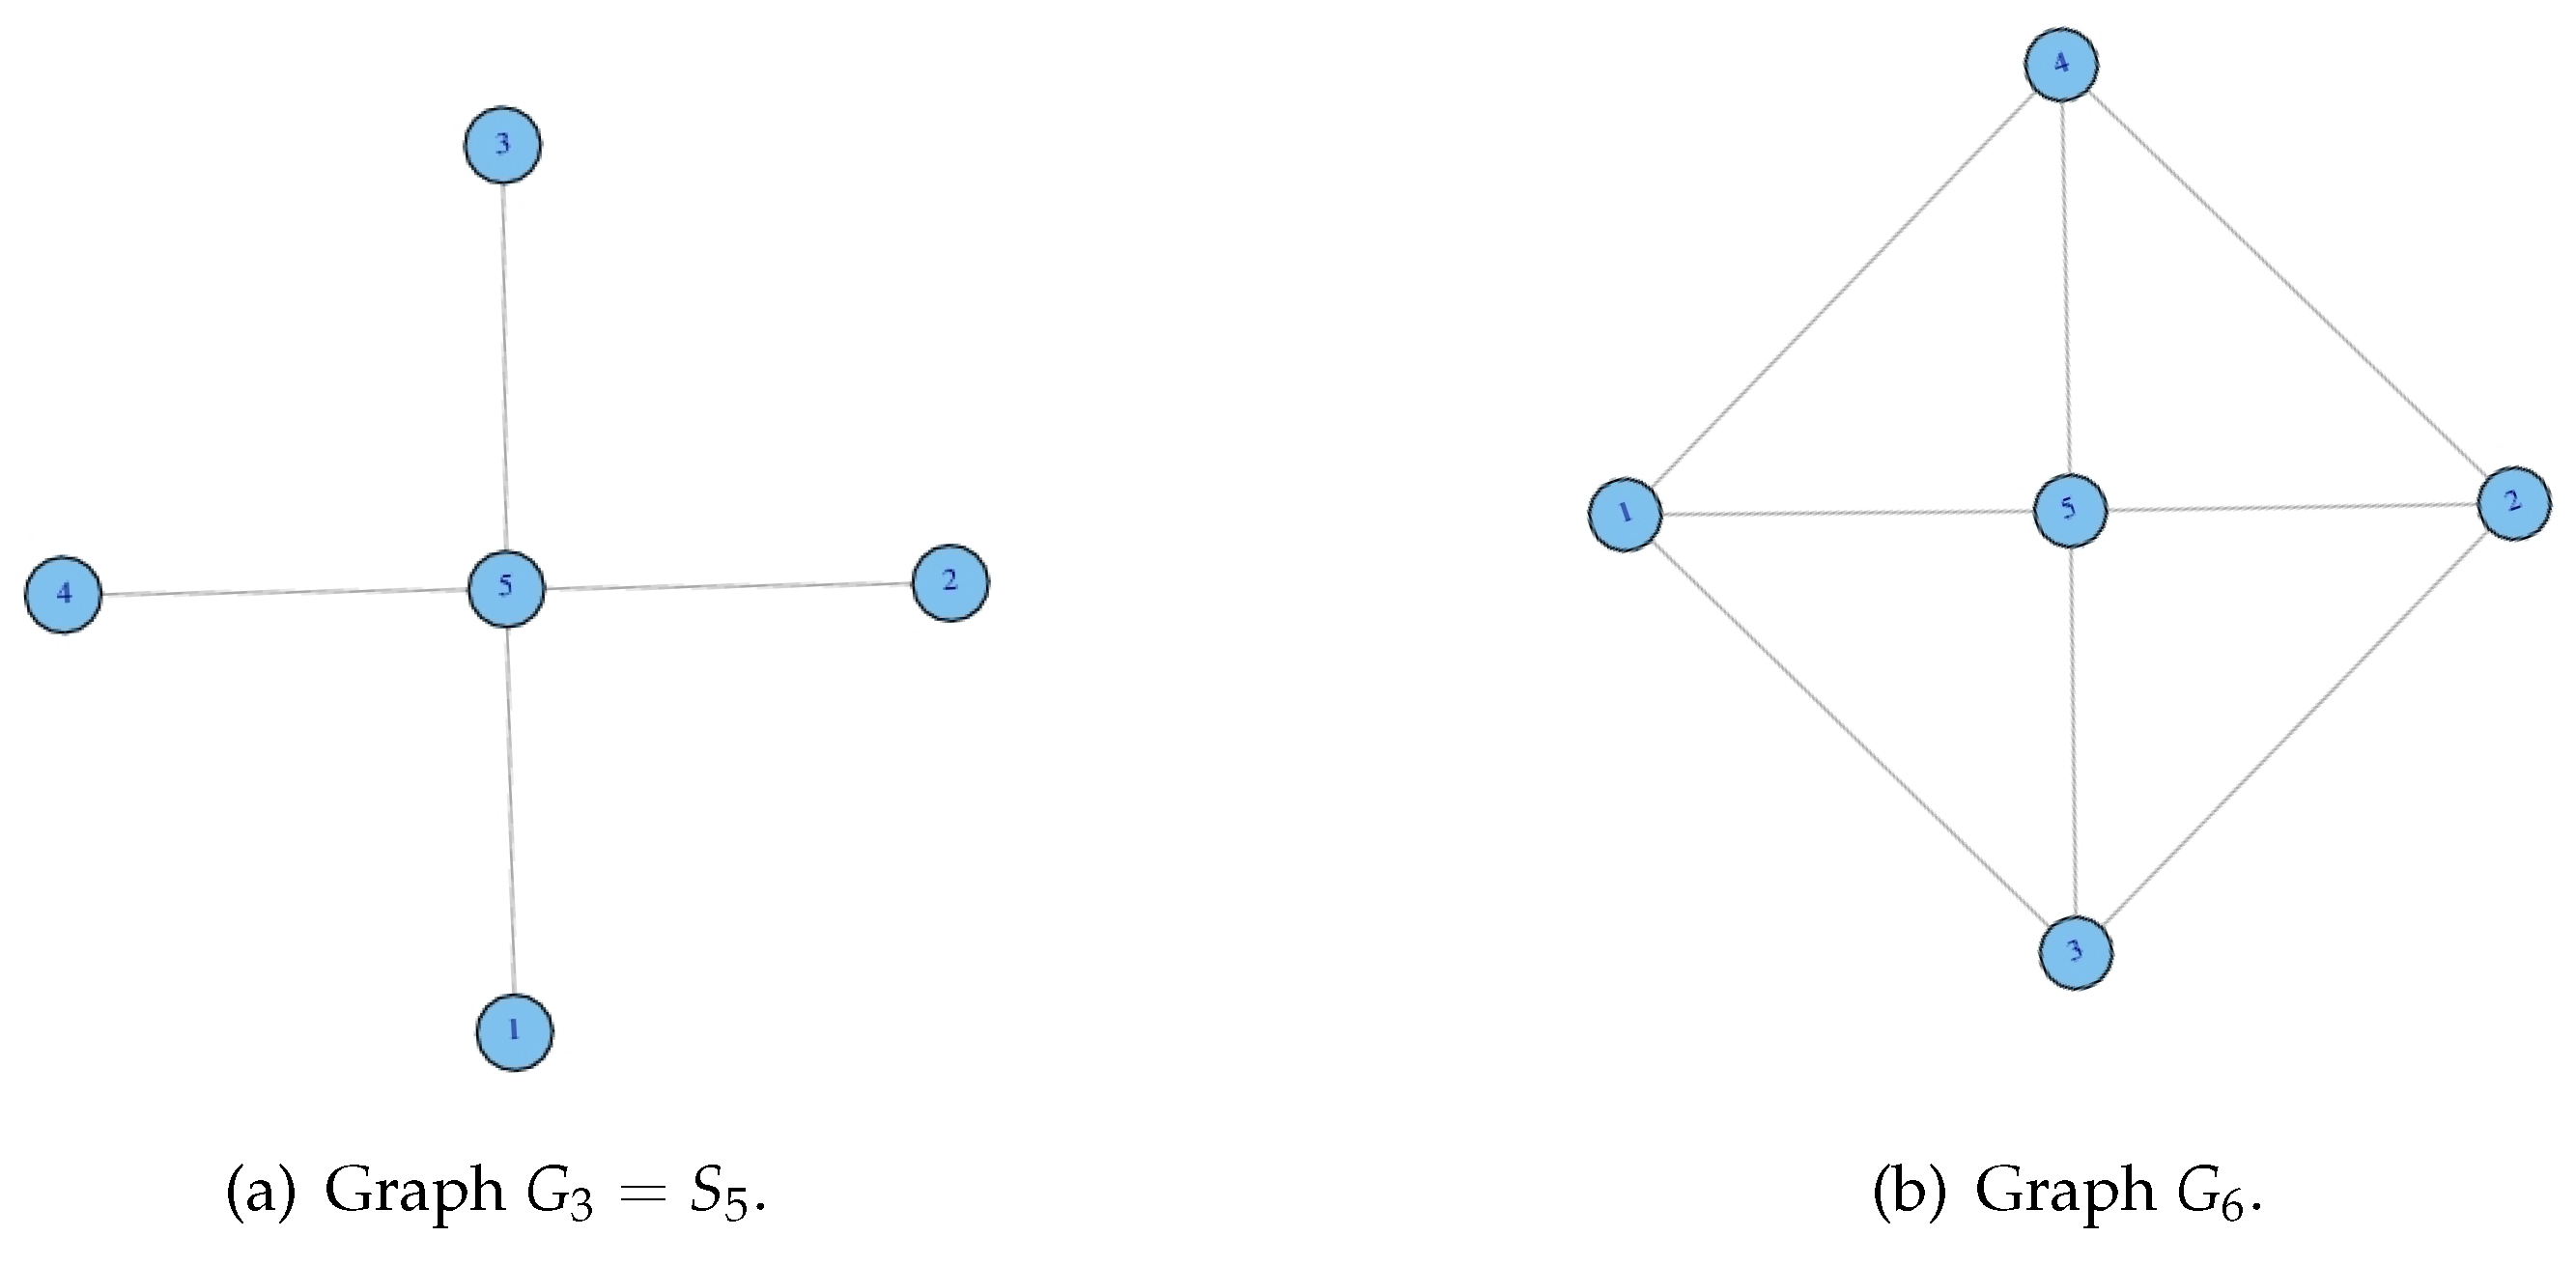
Some graph theoretic terminology and notation need to be introduced here [50]. denotes a complete graph in which each pair of vertices is adjacent, is a star graph consisting of one vertex of degree and pendant vertices, and denotes a cycle with n vertices. Now, consider the following Figure 4. In graph-theoretical terms, the (vertex) automorphism group of is transitive, and therefore, the automorphism group of has just one orbit. Thus, . From Figure 4 it is apparent that both graphs are vertically and horizontally symmetric; yet, their index values are different (see below). In terms of the network style, we could also say that is more disordered than . More generally, we could also argue that aesthetics here correlates with simplicity of a network, which becomes obvious in the case of . The graph is regular, and therefore the simplest and most symmetric case possible.
Now, calculating for gives
Based on the symmetry of the partition given by the two vertex orbits and , the degree of disorder in is obviously higher with . According to the scale we are using, is less aesthetic than , as is more structurally complex. The same situation and explanation holds for Figure 5. However, we see from Figure 5b that , a complete graph, whose group is transitive (), but the drawing has line crossings and therefore looks more complicated than , whose index value is also
So, the comparison between Figure 5a and Figure 5b might suggest combining structural with “visually-oriented” measures expressing a certain kind of harmony like the ones due to Ware et al. [13].
Furthermore, according to the Equations (3) and (4), . As a direct consequence, we define a distance measure between two graphs by
where is a structural graph measure and a class of graphs. According to [58], Equation (7) is a graph distance measure since and . We obtain
From Figure 6, we see by Equation (8) that . By contrast, the distances of the pairs of graphs shown by Figure 7 and Figure 8 vanish; see Equations (9) and (10). Then, we observe that if the graph distance vanishes (see Figure 7 and Figure 8), both graphs possess a (geometrical) horizontal and vertical symmetry axis (again, see Figure 3). Instead, the right-hand graph in Figure 6 does not have such geometrical symmetry, indicated by . This seems to be plausible, as these two graphs do not have the same symmetry structure in terms of their vertex orbits. In conclusion, we see that the graph distance measure defined above might also be useful for automatically measuring aesthetic and stylistic properties of larger networks.
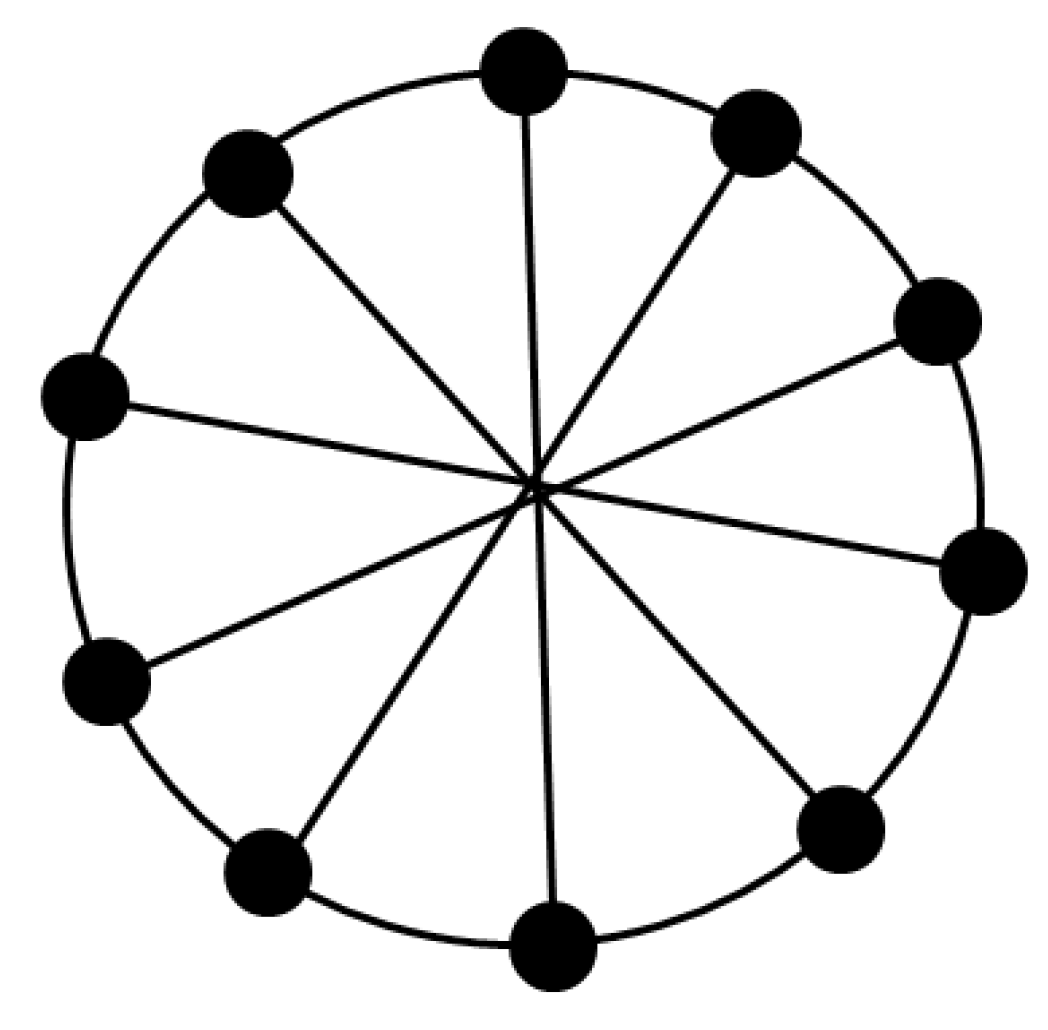
Now we generalize our findings from above to highlight the differences between a symmetry-based measure and an index taking account of geometric properties. In particular, we construct a class of transitive graphs with n vertices having unbounded values on a geometry-based measure. For , the graph in this class consists of the undirected cycle and the k edges . Our geometry-based measure simply counts the number of pairs of line crossings () in a particular visual representation or drawing of a graph. We make this choice because an aesthetic measure should reflect the perception of an observer, and line crossings in a drawing may be viewed as a geometric proxy for the perception of disorder. For example, when (), the graph consists of a and the five additional edges , as shown in Figure 9. This graph has 10 pairs of line crossings, and in general, has binomial coefficient line crossings in the (analogous) visual representation.
Clearly, the graph has the automorphism , which implies it is transitive, and hence . By contrast, the geometric measure defined as the total number of pairs of line crossings in a network gives . So, as (), . The class of graphs we have defined thus shows that it is possible for different aesthetic measures to exhibit unbounded divergence. Although surprising at first glance, on reflection this example of measurement relativity is in keeping with the subjectivity of perception.
The abstract approach to graph aesthetics introduced in this paper has the virtue of providing a natural way of measuring the aesthetics of product graphs, and thus allows for investigation of the aesthetics of complex graphs constructed from simpler ones. The following theorem summarizes the situation for four well-known graph products; namely, sum, join, Cartesian product, and composition (or wreath product), denoted by ∪, +, X, and ∘, respectively [50].
Theorem 1.
Let G and H be graphs. Then
Proof.
Each of the inequalities follows directly from results in [21]. ☐
These results show that aesthetic quality—as measured by information content—is not diminished by combining graphs in predictable ways. In the extreme cases of repetition (i.e., sums or joins of isomorphic graphs), information content—and thus aesthetic value—does not change at all. This is consistent with the aesthetic view of minimalist music in which repetition (with slight variation) figures prominently.
4. Conclusions
In this paper, we have examined aesthetic properties of abstract graphs and networks. Our work complements existing approaches discussed in Section “Introduction”. Measuring graph aesthetics has mainly been discussed in the area of information visualization where geometrical and harmonic factors like edge crossing and edge bendiness could contribute to an observer’s perception of disorder. The work reported here uses structural features of an abstract graph to define a measure of aesthetics.
We have found that by omitting the above-mentioned geometrical features to measure the harmony or aesthetics of networks, we might get weaker results. However, this is not certain because we have not applied our measures to either large graphs or to a diverse set of graphs, nor have we yet conducted an experiment to determine cognitive cost (see also [13]). Such an experiment could reveal whether incorporating the above-mentioned geometrical features [13] creates additional value and generates more subtle evaluation.
Graph-theoretical symmetry based on the automorphism group of a network might not by itself provide an acceptable measure of network aesthetics. Thus, our considerations suggest combining structural, geometrical, and harmonic properties in the definition of new super aesthetic indices. Such super indices could be used to measure network aesthetics more effectively and efficiently. However, it is also clear that measurement of the aesthetics of abstract graphs may be better served by the kind of symmetry measure proposed here, because such measures allow for systematic investigation of graph construction.
Acknowledgments
Zengqiang Chen was supported by the National Science Foundation of China (No. 615731199) and the Natural Science Foundation of Tianjin (No. 14JCYBJC18700). Matthias Dehmer thanks the Austrian Science Funds for supporting this work (project P26142). Yongtang Shi is partially supported by the Natural Science Foundation of Tianjin (No. 17JCQNJC00300) and the National Natural Science Foundation of China.
Author Contributions
Matthias Dehmer, Abbe Mowshowitz, Yongtang Shi, Zengqiang Chen and Frank Emmert-Streib wrote the paper.
Conflicts of Interest
The authors declare no conflict of interest.
References
- Fucks, W. Mathematische Analyse des literarischen Stils. In Studium Generale; Springer: New York, NY, USA, 1953; Volume 6. [Google Scholar]
- Ganter, B.; Mineau, G.W. Conceptual Structures: Logical, Linguistic, and Computational Issues; Lecture Notes in Artificial Intelligence; Springer: New York, NY, USA, 2000. [Google Scholar]
- Mehler, A. Textbedeutung. Zur Prozeduralen Analyse und Repräsentation Struktureller Ähnlichkeiten von Texten; Sprache, Sprechen und Computer/Computer Studies in Language and Speech; Peter Lang: Frankfurt am Main, Germany, 2001; Volume 5. [Google Scholar]
- Tuldava, J. A Statistical Method of Comparison of the Lexical Composition of Two Texts. In Methods in Quantitative Linguistics; Tuldava, J., Ed.; Wissenschaftlicher Verlag Trier: Trier, Germany, 1995. [Google Scholar]
- Birkhoff, G.D. A mathematical approach to aesthetics. Scientia (Milano) 1931, 50, 133–146. [Google Scholar]
- Boselie, F.; Leeuwenberg, E. Birkhoff Revisited: Beauty as a Function of Effect and Means. Am. J. Psychol. 1985, 98, 1–39. [Google Scholar] [CrossRef] [PubMed]
- Bense, M. The Projects of Generative Aesthetics. In Cybernetics, Art, and Ideas; Reichardt, J., Ed.; New York Graphic Society: Greenwich, CT, USA, 1971. [Google Scholar]
- Moles, A.A. Information Theory and Esthetic Perception; University of Illinois Press: Urbana, IL, USA, 1966. [Google Scholar]
- Rigau, J.; Feixas, M.; Sbert, M. Informational Aesthetics Measures. IEEE Comput. Graph. Appl. 2008, 28, 24–34. [Google Scholar] [CrossRef] [PubMed]
- Galanter, P. Complexity, Neuroaesthetics, and Computational Aesthetic Evaluation. In Proceedings of the 13th Generative Art Conference GA2010, Milan, Italy, 15–17 December 2010; pp. 400–409. [Google Scholar]
- Purchase, H. Metrics for Graph Drawing Aesthetics. J. Vis. Lang. Comput. 2002, 13, 501–516. [Google Scholar] [CrossRef]
- Beck, F.; Burch, M.; Diehl, S. Towards an Aesthetic Dimensions Framework for Dynamic Graph Visualisations. In Proceedings of the 13-th International Conference Information Visualisation, Barcelona, Spain, 15–17 July 2009; pp. 592–597. [Google Scholar]
- Ware, C.; Purchase, H.; Colpoys, L.; McGill, M. Cognitive Measurements of Graph Aesthetics. Inf. Vis. 2002, 1, 103–110. [Google Scholar] [CrossRef]
- Battista, G.D.; Eades, P.; Tamassia, R.; Tollis, I.G. Algorithms for the Visualization of Graphs; Prentice Hall: Englewood Cliffs, NJ, USA, 1999. [Google Scholar]
- Dehmer, M.; Emmert-Streib, F.; Gesell, T. A comparative analysis of multidimensional features of objects resembling sets of graphs. Appl. Math. Comput. 2008, 196, 221–235. [Google Scholar] [CrossRef]
- Mowshowitz, A.; Dehmer, M. Entropy and the Complexity of Graphs Revisited. Entropy 2012, 14, 559–570. [Google Scholar] [CrossRef]
- Botafogo, R.A.; Rivlin, E.; Shneiderman, B. Structural Analysis of Hypertexts: Identifying Hierarchies and Useful Metrics. ACM Trans. Inf. Syst. 1992, 10, 142–180. [Google Scholar] [CrossRef]
- Schutte, M.; Dehmer, M. Large-scale analysis of structural branching measures. J. Math. Chem. 2013, 52, 805–819. [Google Scholar] [CrossRef]
- Dehmer, M.; Emmert-Streib, F. Quantitative Graph Theory. Theory and Applications; CRC Press: Boca Raton, FL, USA, 2014. [Google Scholar]
- Todeschini, R.; Consonni, V. Handbook of Molecular Descriptors; Wiley-VCH: Weinheim, Germany, 2002. [Google Scholar]
- Mowshowitz, A. Entropy and the complexity of the graphs I: An index of the relative complexity of a graph. Bull. Math. Biophys. 1968, 30, 175–204. [Google Scholar] [CrossRef] [PubMed]
- Brillouin, L. Science and Information Theory; Academic Press: New York, NY, USA, 1956. [Google Scholar]
- Morowitz, H. Some order-disorder considerations in living systems. Bull. Math. Biophys. 1953, 17, 81–86. [Google Scholar] [CrossRef]
- Trucco, E. A note on the information content of graphs. Bull. Math. Biol. 1956, 18, 129–135. [Google Scholar] [CrossRef]
- Rashevsky, N. Life, Information Theory, and Topology. Bull. Math. Biophys. 1955, 17, 229–235. [Google Scholar] [CrossRef]
- Dehmer, M. Information Theory of Networks. Symmetry 2012, 3, 767–779. [Google Scholar] [CrossRef]
- Dehmer, M.; Mowshowitz, A. A History of Graph Entropy Measures. Inf. Sci. 2011, 1, 57–78. [Google Scholar] [CrossRef]
- Li, X.; Shi, Y.; Gutman, I. Graph Energy; Springer: New York, NY, USA, 2012. [Google Scholar]
- Ulanowicz, R.E. Circumscribed complexity in ecological networks. In Advances in Network Complexity; Devillers, J., Balaban, A.T., Eds.; Wiley-Blackwell: Oxford, UK, 2013; pp. 249–258. [Google Scholar]
- Emmert-Streib, F.; Dehmer, M. (Eds.) Analysis of Microarray Data: A Network-Based Approach; Wiley VCH: Weinheim, Germany, 2010. [Google Scholar]
- Diudea, M.V. QSPR / QSAR Studies by Molecular Descriptors; Nova Publishing: New York, NY, USA, 2001. [Google Scholar]
- Hirata, H.; Ulanowicz, R.E. Information theoretical analysis of ecological networks. Int. J. Syst. Sci. 1984, 15, 261–270. [Google Scholar] [CrossRef]
- Ulanowicz, R.E. Quantitative methods for ecological network analysis. Comput. Biol. Chem. 2004, 28, 321–339. [Google Scholar] [CrossRef] [PubMed]
- Dehmer, M.; Emmert-Streib, F. Mining Graph Patterns in Web-based Systems: A Conceptual View. In Genres on the Web: Computational Models and Empirical Studies; Mehler, A., Sharoff, S., Rehm, G., Santini, M., Eds.; Springer: Berlin, Germany; New York, NY, USA, 2010; pp. 237–253. [Google Scholar]
- Bunke, H.; Günter, S.; Jiang, X. Towards bridging the gap between statistical and structural pattern recognition: Two new concepts in graph matching. In Proceedings of the Advances in Pattern Recognition—ICAPR 2001, Rio de Janeiro, Brazil, 11–14 March 2001; pp. 1–11. [Google Scholar]
- Mehler, A. Textmining. In Texttechnologie. Perspektiven und Anwendungen; Lobin, H., Lemnitzer, L., Eds.; Stauffenburg: Tübingen, Germany, 2004; pp. 83–107. [Google Scholar]
- Dehmer, M.; Mehler, A. A new method of measuring similarity for a special class of directed graphs. Tatra Mt. Math. Publ. 2007, 36, 39–59. [Google Scholar]
- Emmert-Streib, F.; Dehmer, M.; Shi, Y. Fifty years of graph matching, network alignment and network comparison. Inf. Sci. 2016, 346–347, 180–197. [Google Scholar] [CrossRef]
- Mehler, A. Social Ontologies as Generalized Nearly Acyclic Directed Graphs: A Quantitative Graph Model of Social Tagging. In Towards an Information Theory of Complex Networks: Statistical Methods and Applications; Dehmer, M., Emmert-Streib, F., Mehler, A., Eds.; Birkhäuser: Boston, MA, USA; Basel, Switzerland, 2011; pp. 259–319. [Google Scholar]
- Bonchev, D. Topological order in molecules 1. Molecular branching revisited. J. Mol. Struct. THEOCHEM 1995, 336, 137–156. [Google Scholar] [CrossRef]
- Garrido, A. Analysis of asymmetry measures. Adv. Model. Optim. 2008, 2, 199–211. [Google Scholar]
- Garrido, A. Symmetry of Complex Networks. Adv. Model. Optim. 2009, 11, 615–624. [Google Scholar] [CrossRef]
- Mowshowitz, A.; Dehmer, M. A Symmetry Index for Graphs. Symmetry Cult. Sci. 2010, 21, 321–327. [Google Scholar]
- Dehmer, M.; Mehler, A.; Emmert-Streib, F. Graph-theoretical Characterizations of Generalized Trees. In Proceedings of the International Conference on Machine Learning: Models, Technologies & Applications (MLMTA’07), Las Vegas, NV, USA, 25–28 June 2007; pp. 113–117. [Google Scholar]
- Bahnhöfe des MVV. Available online: http://www.mvv-muenchen.de/de/netz-bahnhoefe/bahnhofsinformation/index.html (accessed on 12 January 2017).
- Netzpläne des MVV. Information des Münchner Verkehrs- und Tarifverbundes GmbH. Available online: http://www.mvv-muenchen.de/de/netz-bahnhoefe/netzplaene/index.html (accessed on 12 January 2017).
- Rodrigue, J.P.; Comtois, C.; Slack, B. The Geography of Transport Systems; Taylor & Francis: Boca Raton, FL, USA, 2013. [Google Scholar]
- Tripathi, S.; Dehmer, M.; Emmert-Streib, F. NetBioV: An R package for visualizing large network data in biology and medicine. Bioinformatics 2014, 19, 2834–2836. [Google Scholar] [CrossRef] [PubMed]
- Emmert-Streib, F.; Dehmer, M. Information processing in the transcriptional regulatory network of yeast: Functional robustness. BMC Syst. Biol. 2009, 3. [Google Scholar] [CrossRef] [PubMed]
- Harary, F. Graph Theory; Addison Wesley Publishing Company: Reading, MA, USA, 1969. [Google Scholar]
- Filonik, D.; Baur, D. Measuring aesthetics for information visualization. In Proceedings of the 13th International Conference Information Visualisation, Barcelona, Spain, 15–17 July 2009; pp. 579–584. [Google Scholar]
- Frucht, R. Herstellung von Graphen mit vorgegebener abstrakter Gruppe. Compos. Math. 1939, 6, 239–250. [Google Scholar]
- Mowshowitz, A.; Mitsou, V. Entropy, orbits and spectra of graphs. In Analysis of Complex Networks: From Biology to Linguistics; Dehmer, M., Emmert-Streib, F., Eds.; Wiley-VCH: Weinheim, Germany, 2009; pp. 1–22. [Google Scholar]
- Mowshowitz, A. Entropy and the complexity of graphs II: The information content of digraphs and infinite graphs. Bull. Math. Biophys. 1968, 30, 225–240. [Google Scholar] [CrossRef] [PubMed]
- Mowshowitz, A. Entropy and the complexity of graphs III: Graphs with prescribed information content. Bull. Math. Biophys. 1968, 30, 387–414. [Google Scholar] [CrossRef]
- Mowshowitz, A. Entropy and the complexity of graphs IV: Entropy measures and graphical structure. Bull. Math. Biophys. 1968, 30, 533–546. [Google Scholar] [CrossRef]
- McKay, B.D.; Piperno, A. Practical Graph Isomorphism, II, 2013. Available online: http://cs.anu.edu.au/~bdm/nauty/ (accessed on 12 January 2017).
- Deza, M.M.; Deza, E. Encyclopedia of Distances, 2nd ed.; Springer: New York, NY, USA, 2012. [Google Scholar]
Figure 1.
The same graphs but different drawings.

Figure 2.
Two different networks representing different styles.
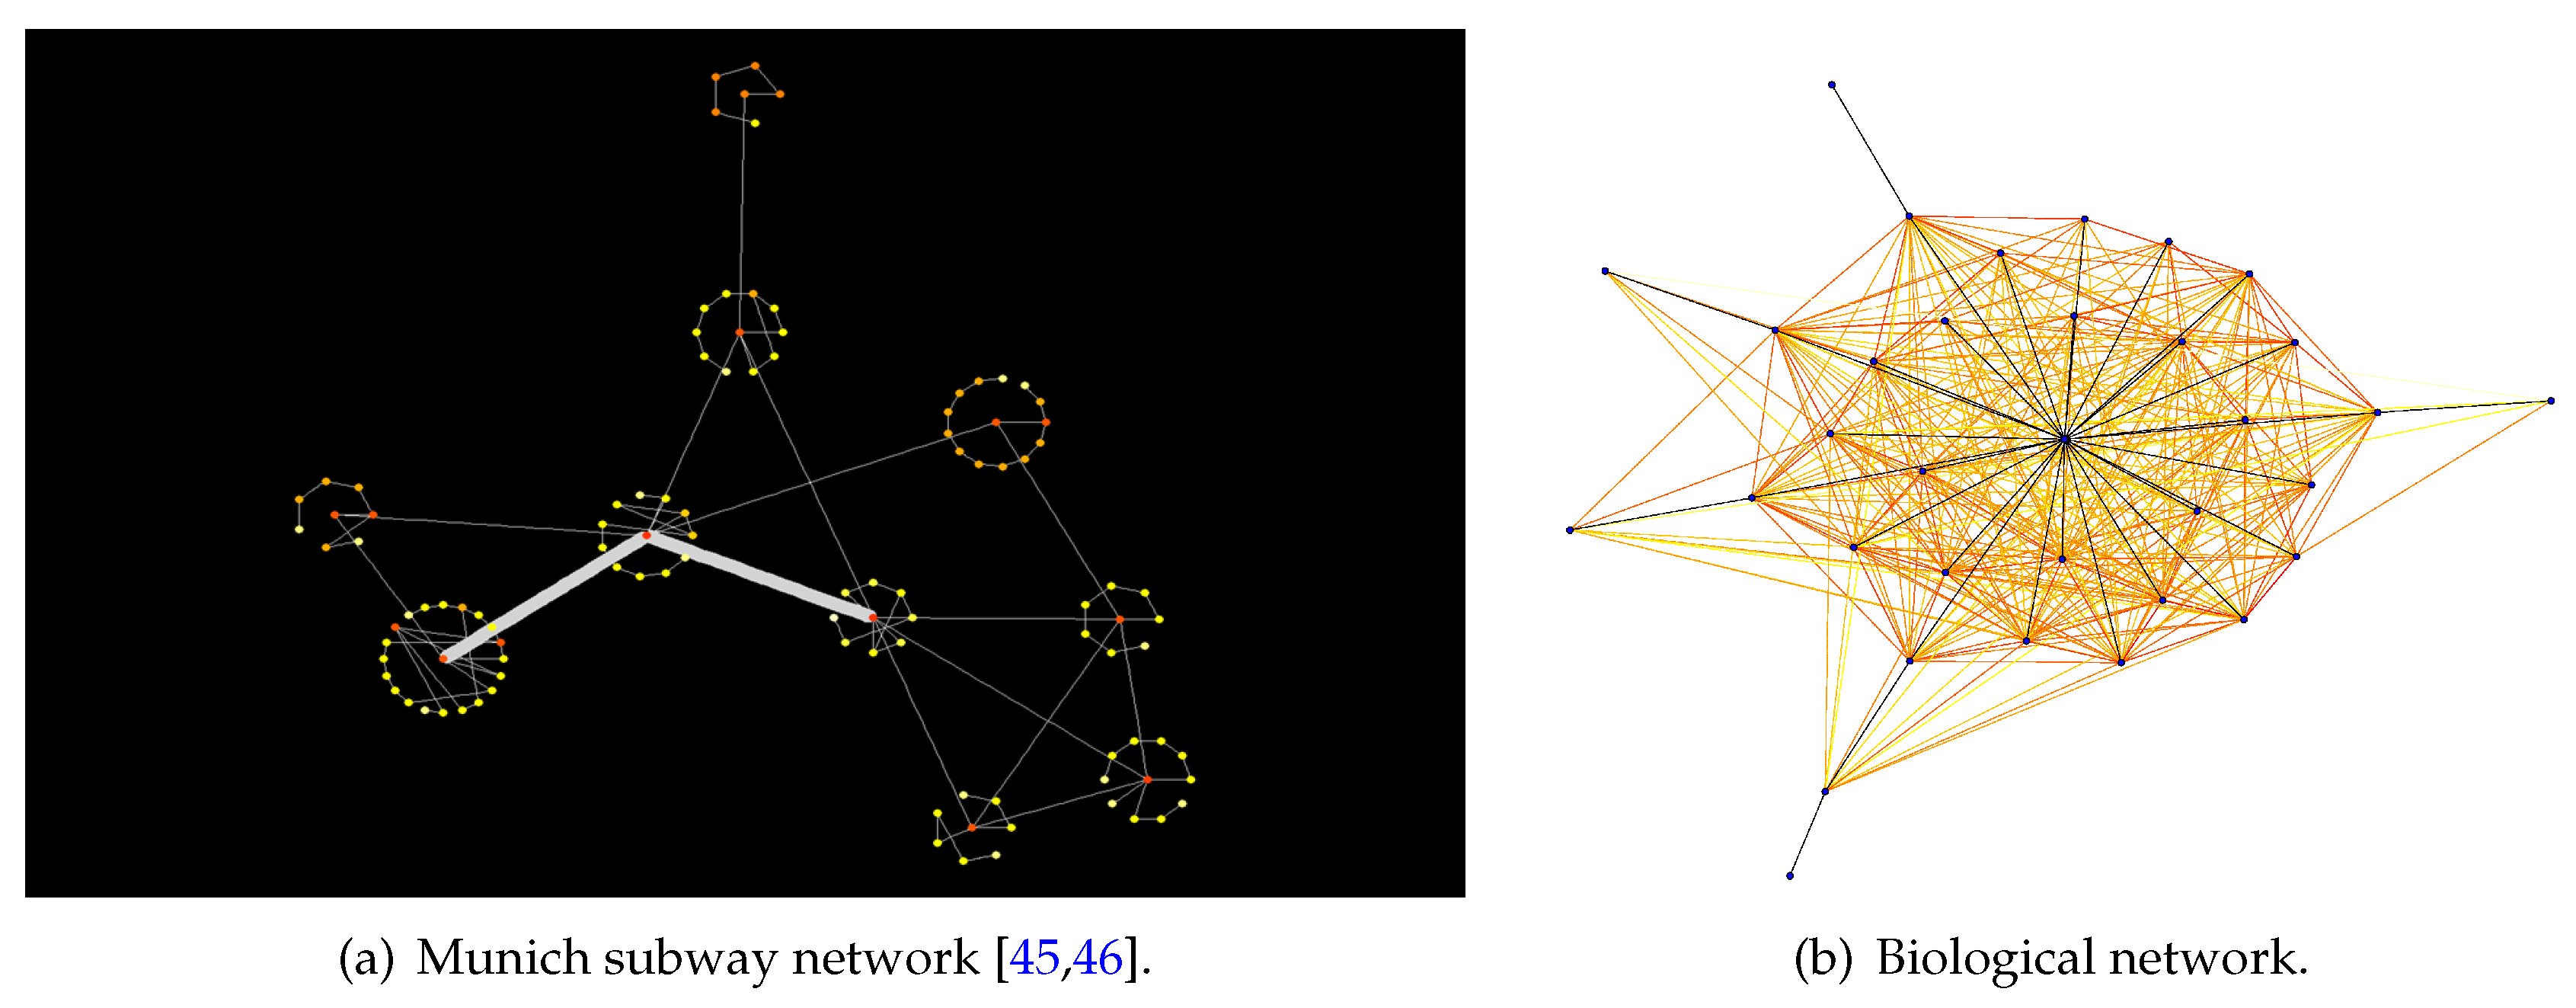
Figure 3.
Geometrical symmetry: horizontal and vertical axis indicated by red lines.

Figure 4.
Two networks and representing different styles.
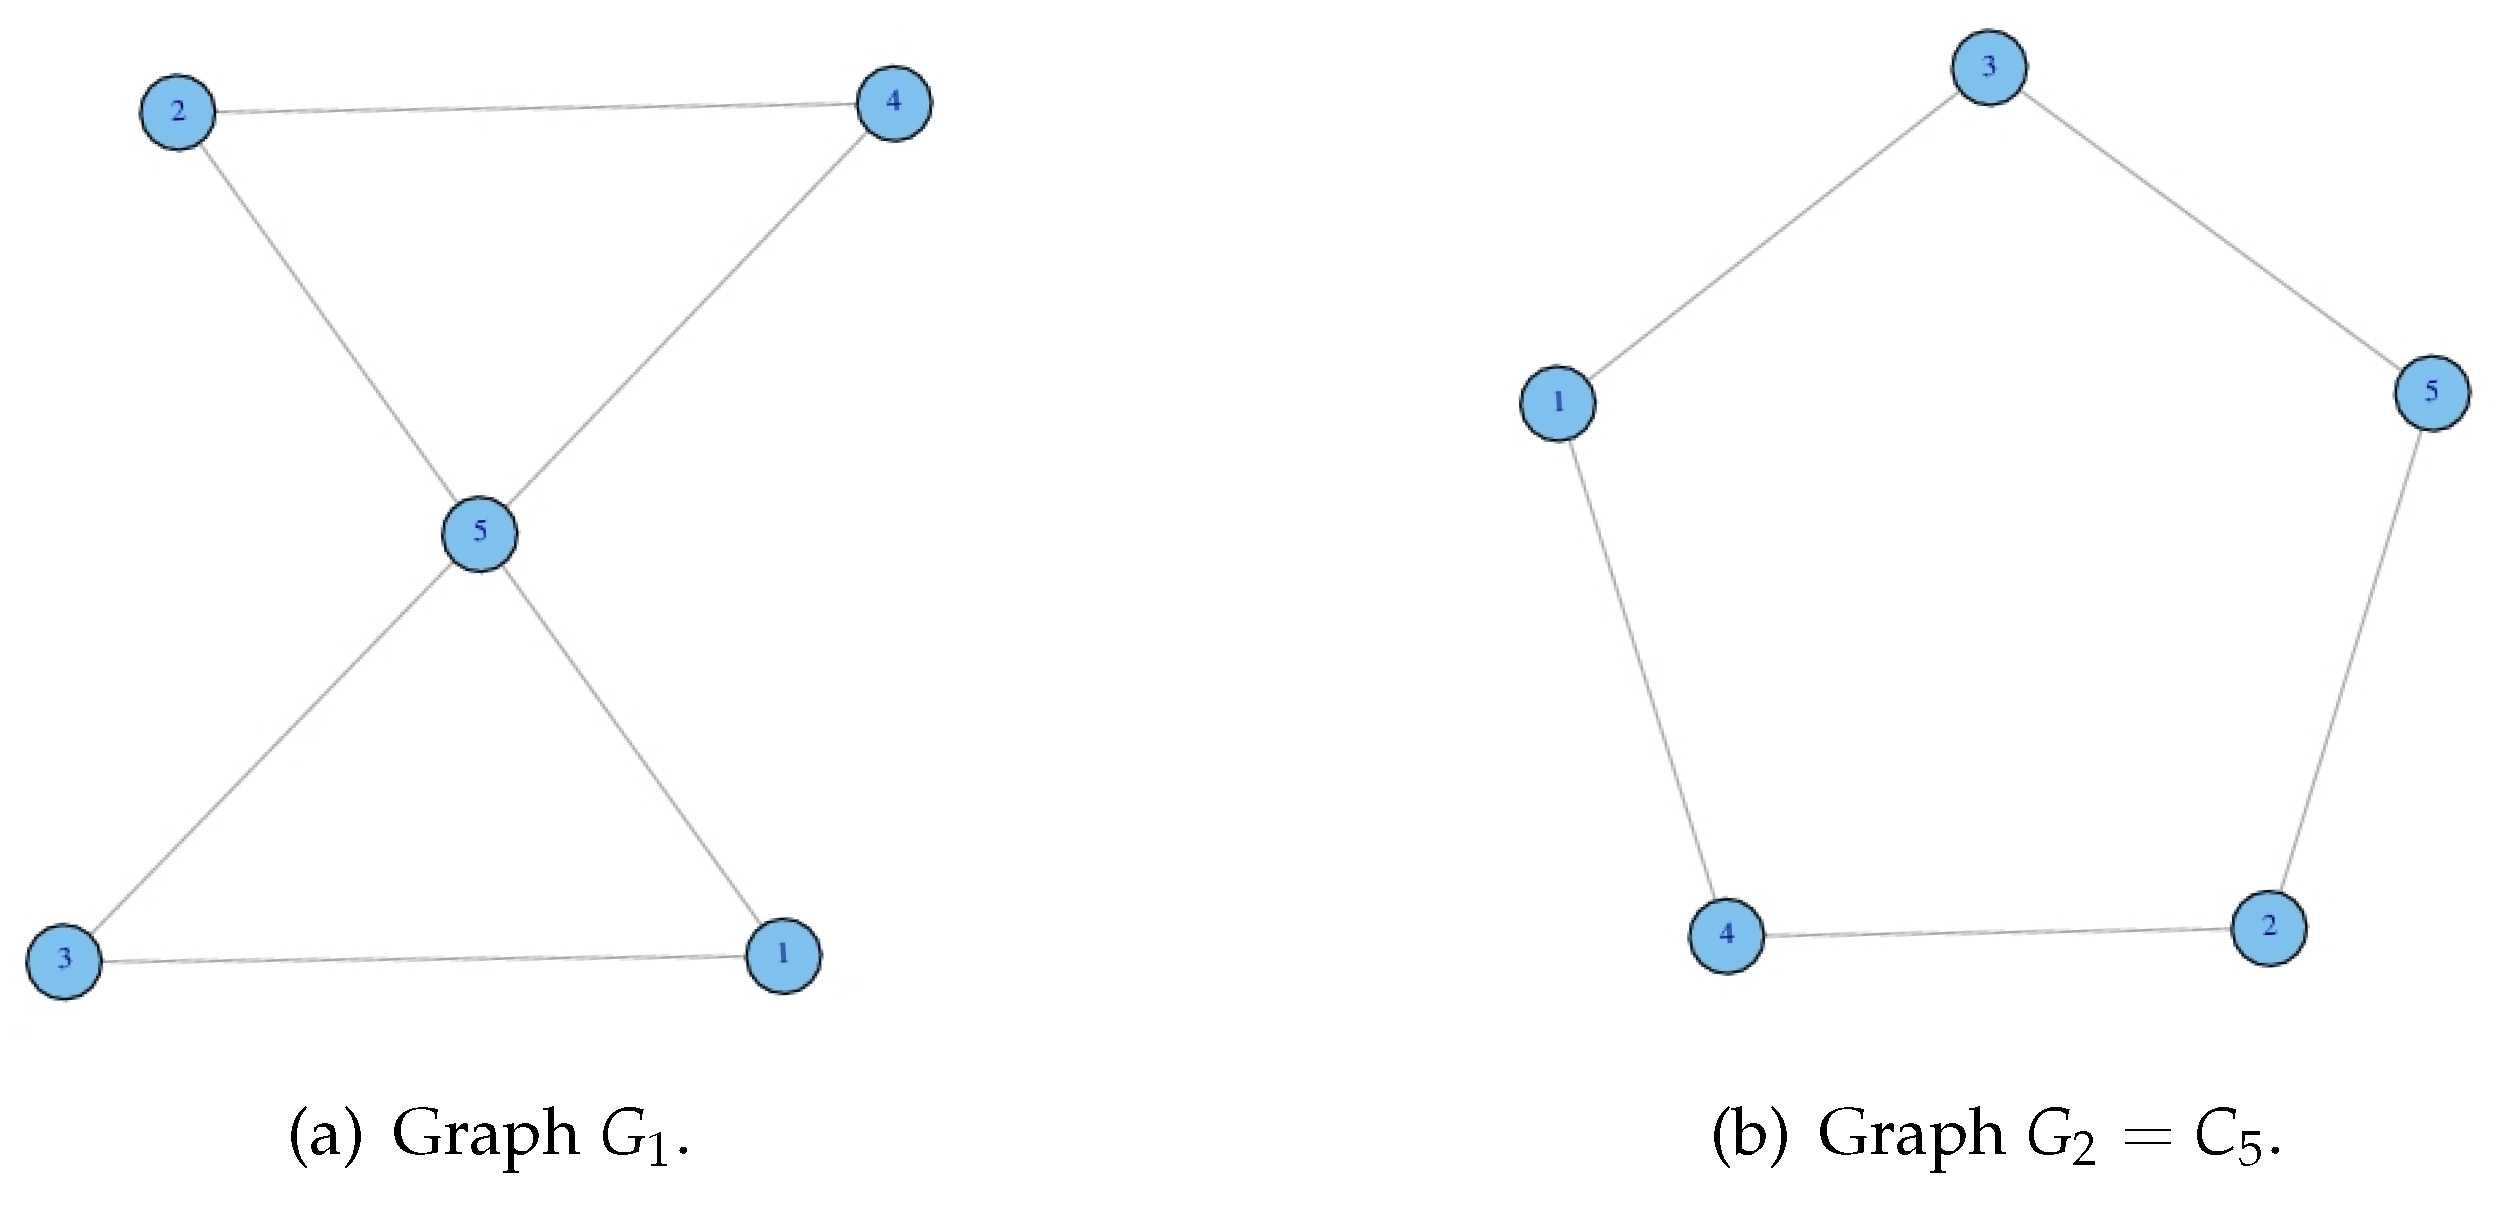
Figure 5.
Two networks and representing different styles.

Figure 6.
Two networks and representing different styles.
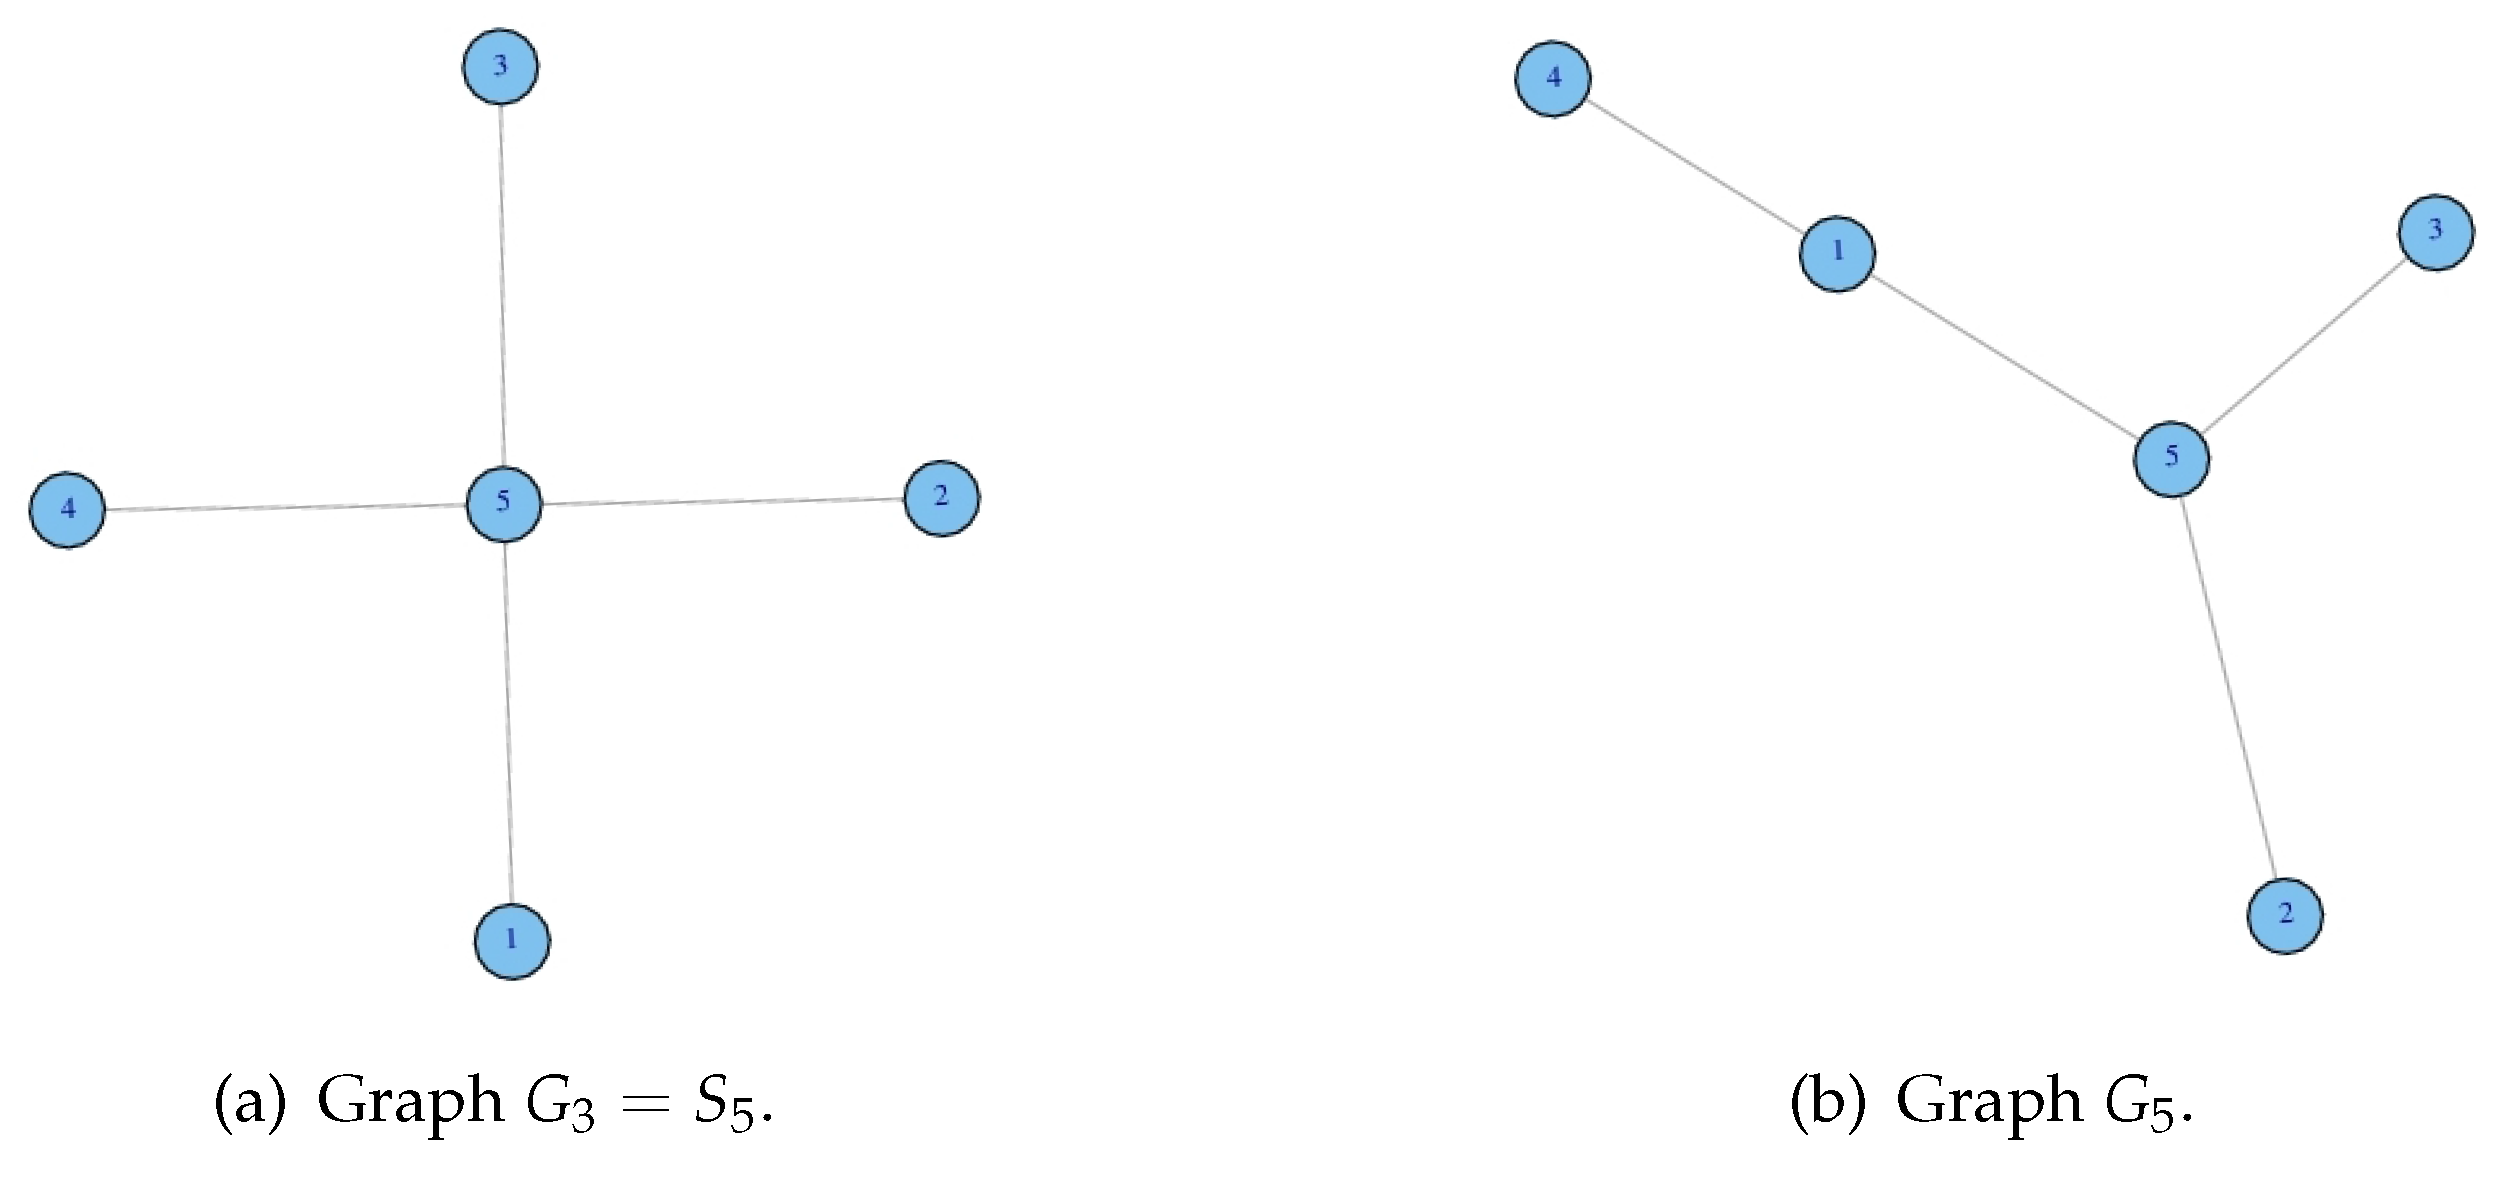
Figure 7.
Two networks and representing different styles.
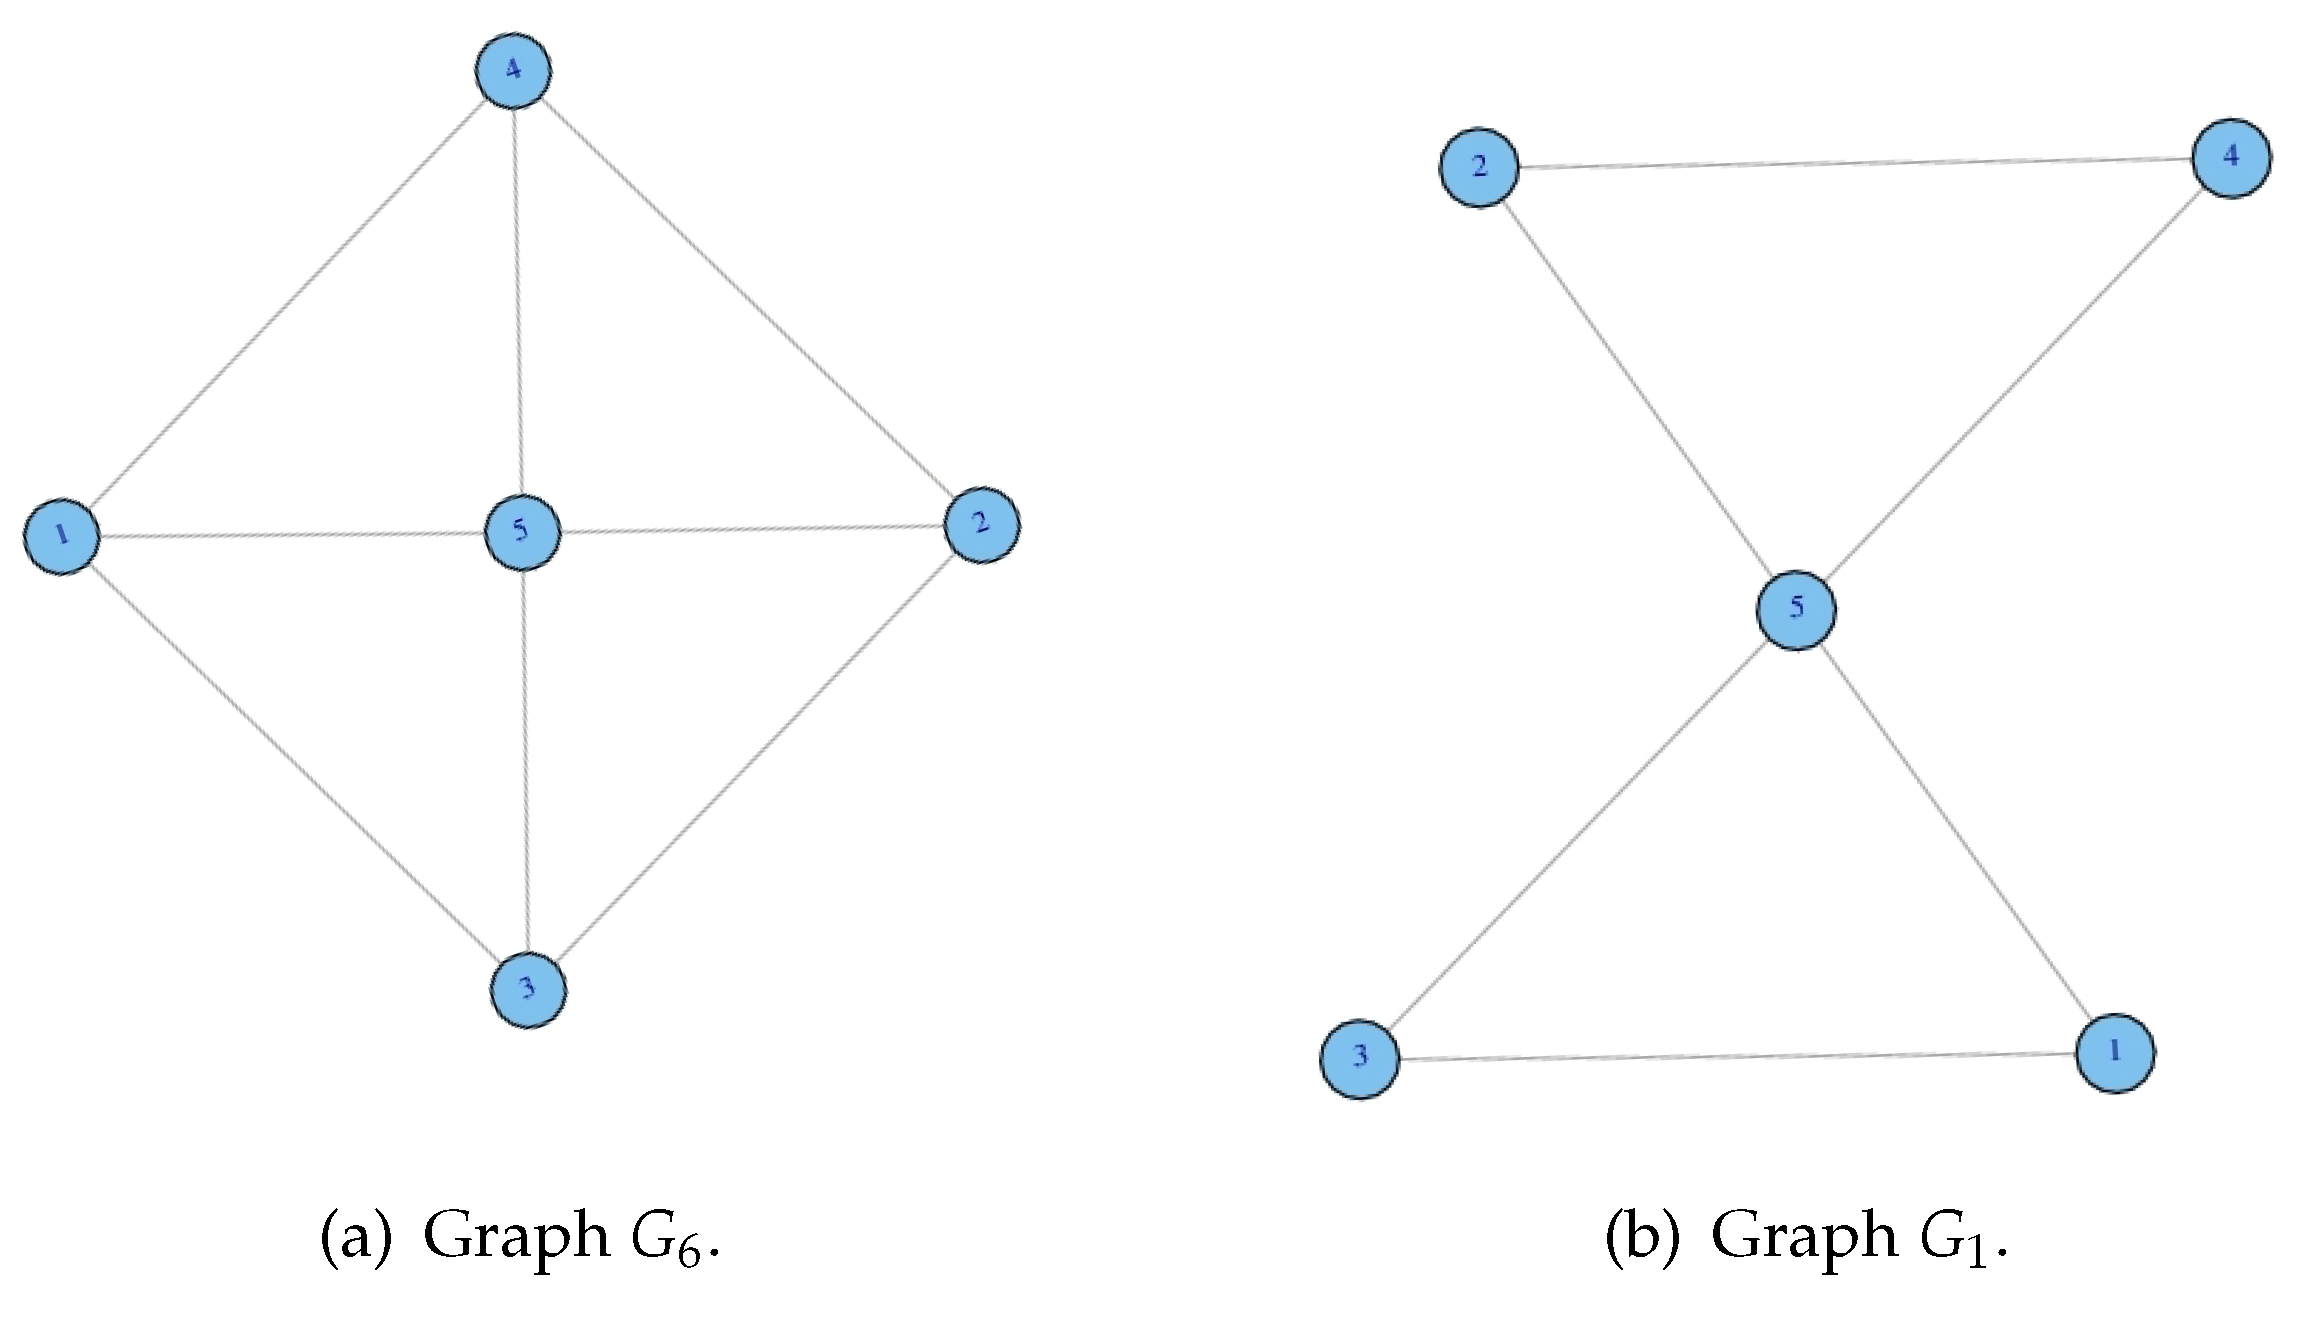
Figure 8.
Two networks and representing different styles.

Figure 9.
Graph with ten vertices possessing a transitive group and ten line crossings.

© 2017 by the authors. Licensee MDPI, Basel, Switzerland. This article is an open access article distributed under the terms and conditions of the Creative Commons Attribution (CC BY) license (http://creativecommons.org/licenses/by/4.0/).
Share and Cite
MDPI and ACS Style
Chen, Z.; Dehmer, M.; Emmert-Streib, F.; Mowshowitz, A.; Shi, Y. Toward Measuring Network Aesthetics Based on Symmetry. Axioms 2017, 6, 12. https://doi.org/10.3390/axioms6020012
AMA Style
Chen Z, Dehmer M, Emmert-Streib F, Mowshowitz A, Shi Y. Toward Measuring Network Aesthetics Based on Symmetry. Axioms. 2017; 6(2):12. https://doi.org/10.3390/axioms6020012
Chicago/Turabian StyleChen, Zengqiang, Matthias Dehmer, Frank Emmert-Streib, Abbe Mowshowitz, and Yongtang Shi. 2017. "Toward Measuring Network Aesthetics Based on Symmetry" Axioms 6, no. 2: 12. https://doi.org/10.3390/axioms6020012
Note that from the first issue of 2016, this journal uses article numbers instead of page numbers. See further details here.