
Flow-Induced Dynamic Behavior of Head-Cover Bolts in a Prototype Pump-Turbine during Load Rejection
by
 , , and
Weiqiang Zhao
1,†,
Xingxing Huang
2,† ,
,
Mengqi Yang
3,
Haixia Yang
3,
Huili Bi
1,
Qilian He
1 and
Zhengwei Wang
1,* 1
State Key Laboratory of Hydroscience and Engineering, Tsinghua University, Beijing 100084, China
2
S.C.I.Energy GmbH, Future Energy Research Institute, Seidengasse 17, 8706 Zurich, Switzerland
3
Branch Company of Maintenance & Test, CSG Power Generation Co., Ltd., Guangzhou 511400, China
*
Author to whom correspondence should be addressed.
†
These authors contributed equally to this work.
Machines 2022, 10(12), 1130; https://doi.org/10.3390/machines10121130
Submission received: 24 October 2022
/
Revised: 22 November 2022
/
Accepted: 23 November 2022
/
Published: 28 November 2022
(This article belongs to the Topic Hydroelectric Power)
Abstract
:In order to ensure stable grid operatiFon and improve power quality, active or passive load rejection of pumped storage power stations (PSPS) inevitably occurs from time to time. The rapid closing of the guide vanes will cause drastic changes in pressure pulsations in the flow channel of the pump-turbine (PT) unit. The high-level pressure pulsations during load rejection transfer to the entire flow passage of the PT unit and generate strong vibrations on the head-cover and the connecting bolts. In this study, the 1D/3D joint simulation of the pipeline in a pumped storage power station and the turbine flow channels including the flow domains of the runner, crown chamber, band chamber, upper and lower labyrinths and pressure balance tubes is carried out first. Then, by applying the calculated pressure loads on the head-cover, stay vanes and bottom ring of the PT unit, the flow-induced dynamic behavior of the structures including the head-cover bolts is analyzed in detail. The results demonstrate that pressure loads on head-cover bolts change dramatically during the load rejection process. The flow-induced deformation of the inner head-cover during the load rejection is larger than that of other structures, and the flow-induced displacement and stress of different head-cover bolts are not uniform. The achieved conclusions in this study can be a useful reference for the design and operation of head-cover bolts for other PT units and high-head Francis turbine units.
1. Introduction
Due to the fast-increasing demand for electricity in recent decades, traditional power plants such as thermal power and nuclear power have to enlarge their capacity in order to balance the demand and the supply in the power grid. On the other hand, with the target of achieving net-zero emission in the middle of this century, more and more countries are introducing green and clean power, including wind power and solar power to their power system [1]. The above two factors both bring challenges to the stability of the power grid: the output of traditional power can hardly be regulated because the heat is difficult to be dissipated, while the new renewable energies rely on intermittent sunlight and wind, which depend on the changing weather. A type of huge energy that can be fast-regulated is required for this new scenario. As an important part of renewable energies, hydraulic power is being increasingly developed worldwide because of its the large-enough capacity and great flexibility. Pumped storage power is a type of hydropower that can consume energy by converting the electricity to the potential energy of water and generating power with turbine mode when there is a requirement for energy from the grid. It usually consists of a pumped-storage power station (PSPA), an upper reservoir and a lower reservoir. Pump-turbine (PT) is the core component of a PSPA, which can switch between turbine mode and pump mode according to the demand of the power grid [2]. In turbine mode, the water flows through the spiral casing into the runner and flows out through the draft tube. In pump mode, the water flow into the draft tube from the lower reservoir is pumped by the runner to the upper reservoir. By switching the operation mode and adjusting the output or input, PT units are able to achieve peak clipping, valley filling, frequency and phase regulation and emergency reserve, which are becoming more and more necessary to the power system.
Compared with Francis turbine units, PT units usually have a higher head and less number of blades. Because of this special design, PT units have to withstand higher pressure pulsation during the operation [3]. The severe pressure pulsation brings excessive vibration and higher stress concentration to the structure, which causes fatigue and failure to the machine. The short remaining useful life will cause economic loss to the PSPAs and even danger to the operators in the plants. A number of damage or failure cases have been reported in the previous studies [4,5,6,7]. According to the research, the main reasons for the failure of the structure include drastic changes in hydraulic excitation under certain operating conditions, excessive vibration induced by the resonance and fatigue failure of the head-cover bolts. The head-cover bolt is a component that is used to connect the head-cover and the stay ring. The design of the head-cover bolts is of paramount importance to the operation safety of PT units. Failures such as loose, fatigued and broken head-cover bolts will cause serious accidents such as component damage, power outages, and even casualties to the operators in the power plants [8,9]. Some accidents caused by the failure of head-cover bolts have been reported in literature [5,6]. A number of researchers have carried out studies on the head-cover bolts and some conclusions can be used as guidance to different stages of the installation of bolts. During the design stage, the variation of the relative stiffness of the bolts and head-cover for PTs have to be considered [10]. In the operation of the PT unit, the head-cover bolts mainly suffer from axial stress. Because of the uneven distribution of the hydraulic pressure, the stress distribution along the circumference is also uneven [11]. The stress and deformation mainly concentrate on the connection positions between the head-cover and the bolts while the maximum stress appears on the bolt at the position where the diameter changed [12]. Generally, the first four turns basically bear 30% of the total load. With the increase in load, the high-stress area extends downward, which helps decrease the area of high stress [13]. Brekke pays special attention to the maintenance of the head-cover bolts in his research and discussed the optimization methodologies of the safety of turbine bolt connections [14]. The previous investigations have discussed the distribution of stress on different bolts under steady operating conditions as well as the stress on certain bolts under transient conditions. However, the stress distribution on different head-cover bolts during the load rejection process of PT units has not been studied in detail. Because of the asymmetric characteristic of hydraulic pressure in the runner chamber during the load rejection process, the circumference distribution of the deformation and stress of head-cover bolts varies greatly. Excessive stress concentration might appear on certain bolts even though the average stress is within the yield strength. The load rejection process is a challenging transient condition for turbine units and is a major fatigue damage contributor for the turbine unit [15,16]. Therefore, a careful stress investigation on the head-cover bolts during the load rejection process is important for the safe design of large hydraulic PT units.
The load rejection process causes extremely high pressure in the flow passage of turbine units, which is harmful to the operation safety of the machine. The field test on the load rejection process is inconvenient for a prototype PT unit. In recent decades, numerical simulations have become an alternative and competitive method to study the internal flow characteristics of PT units. With the development of computer technology, simulation accuracy keeps increasing. Considerable numbers of research [17,18,19,20,21] have proved the reliability of computational fluid dynamics (CFD) of PT by comparing the simulation results with a field test. In literature [22], the simulation error between the CFD results and the field text is less than 7% and 12% in large opening condition and minimum opening, respectively. In this research, numerical simulation is applied to investigate prototype high-head PT head-cover bolts during the load rejection process.
The coupling between the vibration of structures such as the head-cover of PTs and the fluid field is a typical Fluid-Structure Interaction (FSI) problem, which is generally solved by one-way FSI and two-way FSI. In a two-way FSI, the structure is excited by the hydraulic pressure while the effect of the deformation of the structure has an influence on the fluid field reversely. For engineering problems, the scale of the whole flow passage can be more than ten meters, while the scale of the deformation of the PT structure is only several millimeters. The effect of the structure deformation on the fluid field is neglectable. Therefore, the one-way FSI is suitable for the numerical simulation in this research with a reasonable calculation accuracy. The one-way FSI simulation methodology has been verified in literature [23,24], where the result of different FSI methods has been compared. By means of one-way FSI, some researchers tried to calculate the deformation and stress of the structure of a hydraulic machine [25,26]. The difference between the FSI simulation and field test result is acceptable for engineering problems. The previous research has provided sufficient foundation for the efficiency of the FSI method on the prototype PT head-cover during the load rejection process.
The research on the characteristics of structural components such as head-cover vibration of PT units is a complex FSI problem. One-way FSI and two-way FSI are two typical methods to solve the FSI problem. The characteristic length of the entire flow field can be up to ten meters, while the actual head-cover deformation of the PT unit is only several millimeters, so the effect of the head-cover deformation on fluid flow is negligible; therefore, the one-way FSI method is reasonable for this study considering the computational resources and the accuracy of the results. It is more reasonable to adopt the one-way FSI method for this study considering the computing resources and accuracy of the results. The studies [23,24] have verified the accuracy of the FSI calculation method, compared the effects of different FSI methods on the calculation results of hydraulic machinery and confirmed the feasibility of the one-way method. Some researchers [25,26] have calculated the stresses and strains of the stationary parts of the unit with the one-way FSI method. The difference between the calculated results and the measured ones is within the acceptable range.
In this research, the flow-induced dynamic behavior of head-cover bolts in a PT unit during its load rejection process is investigated by means of the 1D and 3D hybrid numerical simulation method. In Section 2, the basic theory is introduced by displaying the equations of 1D and 3D simulation. In Section 3, a 1-dimensional (1D) calculation was performed on the pipeline in order to obtain the pressure and discharge in the machine during the load rejection process. The key time points were selected according to the peak and valley pressure and used as the boundary conditions of the 3-dimensional (3D) calculation. Then, a physical model of both the fluid domain and structure of the researched unit was built for the 3D fluid simulation. Computational fluid dynamics (CFD) was applied to the model to calculate the pressure distribution of each key time point. In Section 4, the obtained pressure distribution was mapped on the structure model of the unit by the one-way FSI method. Finally, the dynamic behavior of the head-cover and the head-cover bolts were investigated and analyzed in detail. The conclusions in Section 5 of this research provide important guidance for the design of head-cover bolts for the PT units.
2. Numerical Simulation Methodology
The numerical simulation methods in this paper are composed of 1D pipeline simulation, 3D CFD calculation and one-way FSI simulation method.
2.1. 1D Pipeline Calculation Methodology
The 1D pipeline model of the researched unit includes the upper reservoir, penstock, surge shaft, valves and lower reservoir. In each of the components of the 1D pipeline model, the mathematical model of the unsteady flow is used. The basic equations of unsteady flow in the model include the kinematic equation of motion and the continuity equation.
where Z, g and are the axis elevation of the pipeline, local acceleration of gravity and water density, respectively. V is the average velocity of the water. D is the diameter of the flow passage in the pipeline. F is the Darcy Westbach friction coefficient. is the liquid density and g is the local acceleration of gravity and water density, respectively. F is Darcy Westbach friction coefficient, D and X are the inner diameter and the axis length of the pipe, respectively. A and p are the wave velocity and the pressure of the water in the pipeline, T is the transient time and is the angle between the pipe axis and the horizontal plane.
Equations (1)–(3) can be combined and transformed into method of characteristic (MoC), which is a differential equation with constant coefficients. On the characteristic line, , the original equation can be transformed into a differential equation with constant coefficients; therefore, the process of solving the partial differential equation can be transformed into the discretization of the differential equation on the characteristic line. The compatibility equations are:
where and are the two directions of the characteristic line. The compatibility equation is established along the characteristic line. The equation can be integrated into the form of a difference through the change in flow and head between two points, and then solved iteratively to complete the 1D pipeline calculation.
2.2. 3D Flow Simulation Methodology
The 3D flow simulation methodology is based on the Navier–Stokes Equation for fluid flow in conservative differential form:
Equation (6) is the Navier–Stokes Equation and Equestion (7) is the formulas for incompressible fluids. Where and t represent the fluid density and time, is the velocity vector in 3D space. Based on the equation and finite element method, the pressure pulsation and distribution in the flow passage can be obtained. The pressure can be applied on the fluid–structure coupling surfaces of the structures.
2.3. Fluid–Structure Interaction Analysis Methodology
The dynamic characteristics of the structure are influenced by the forces and pressure acting on the structure. Considering the pressure, the finite element methodology can be described as:
where , and represent the mass matrix, damping matrix and stiffness matrices of the structure, respectively; , and refers to the acceleration, velocity and displacement of the structure, respectively; is the excitation force vector applies on structures, while is to the fluid pressure vector acting on the surface of the structure.
By 3D computational fluid dynamics (CFD) analysis, the fluid pressure distribution in the PT unit can be obtained. As described in Section 2.2, the fluid pressure can be mapped to the fluid–structure interference surfaces and the flow-induced structural stress of the machine can be calculated with the displacement by Equation (9).
where and are the strain-displacement matrix and stiffness matrix, respectively.
Equation (10) shows the calculation of von Mises stress yield by stress in three directions, which is used for evaluating the structural stress characters of the turbine unit.
where () are the principal stresses.
3. Numerical Simulation of the Fluid Flow
3.1. 1D Simulation on Pipeline Flow
The researched machine is a PT unit with a rated power of 300 MW and a rated speed of 500 rpm. The rated head is 520 m. It has 7 blades in the runner and 20 blades on both the stay vanes and guide vanes. Figure 1 shows the sketch of the water conveyance system of the researched PT unit. The 1D model of the pipeline system includes the upper and lower reservoir, turbine unit and surge shafts.
The 3D CFD calculation domain is the turbine part of the system, including the flow passage of the spiral casing, stay vane, guide vane, runner, draft tube, upper and lower labyrinth seals and pressure-balance pipelines.
Figure 2 shows the close curve of the relative guide vanes and variation of relative rotating speed and discharge obtained by the 1D simulation. From the figure, it can be observed that the guide vanes close monotonously from the maximum opening to zero after the load rejection. The rotating speed of the runner increases at the beginning of the load rejection process while vibrating due to the close-down of the guide vanes. The extremes are selected from both the rotating speed curve and the discharge curve. The extreme points are used to perform the fluid dynamic calculation [18]; giving the rotating speed and discharge are the key parameters that affect the flow in the fluid domain during the load rejection process [27,28]. Figure 3 shows the relative pressure (rate between the pressure and rated head of the machine) of spiral casing inlet () and draft tube outlet () calculated by 1D simulation. The pressure values vibrate with the variation of the discharge and rotating speed. and are used as the boundary conditions of the 3D flow simulation.
3.2. 3D CFD Simulation
3.2.1. 3D Model of Flow Calculation
The 3D fluid domain model includes the flow passage of the spiral casing, stay vanes, guide vanes, runner and draft tube. As shown in Figure 4 The flow passage of the upper labyrinth seal and lower labyrinth seal (1.5 mm) between the runner and non-rotational structure are also included in the fluid model in order to increase the simulation accuracy.
3.2.2. Mesh Independence Analysis of the 3D Flow Calculation
ANSYS CFX was used to carry out the 3D CFD analysis. The analysis type was set to stable and the discrete format and the solver were set to high resolution. The runner domain was set to rotate at an angular velocity of 500 rpm. The wall condition was set as a non-slip wall. The interfaces between guide vanes and runner, runner and draft tube were set to Frozen Rotor and the others are set to General Connection. The turbulence model was set to shear stress transport, the turbulence model was set to shear stress transfer and the turbulence mathematical accuracy was set to first order with a convergence residual of .
The mesh quality is very important for 3D turbulence calculation. In this paper, the tetrahedron–hexahedron hybrid mesh was used to discrete the fluid domain. In this study, the mesh in the flow passage of guide vanes was generated automatically according to different GVOs in order to ensure the mesh quality of the guide vanes under a given opening. Figure 5 shows the mesh of different fluid domains of the PT unit. Four sets of mesh have been compared in order to determine the best mesh that achieves a balance between the simulation time and accuracy. The comparison of the efficiencies of different sets of mesh and the details about the mesh of each part of the fluid domain is listed in Figure 5 and Table 1 in literature [16]. The final adopted mesh (3) of the PT unit for load rejection calculation is shown in Table 1.
3.3. 3D Fluid Simulation Results
3.3.1. Pressure Variation at the Monitoring Points
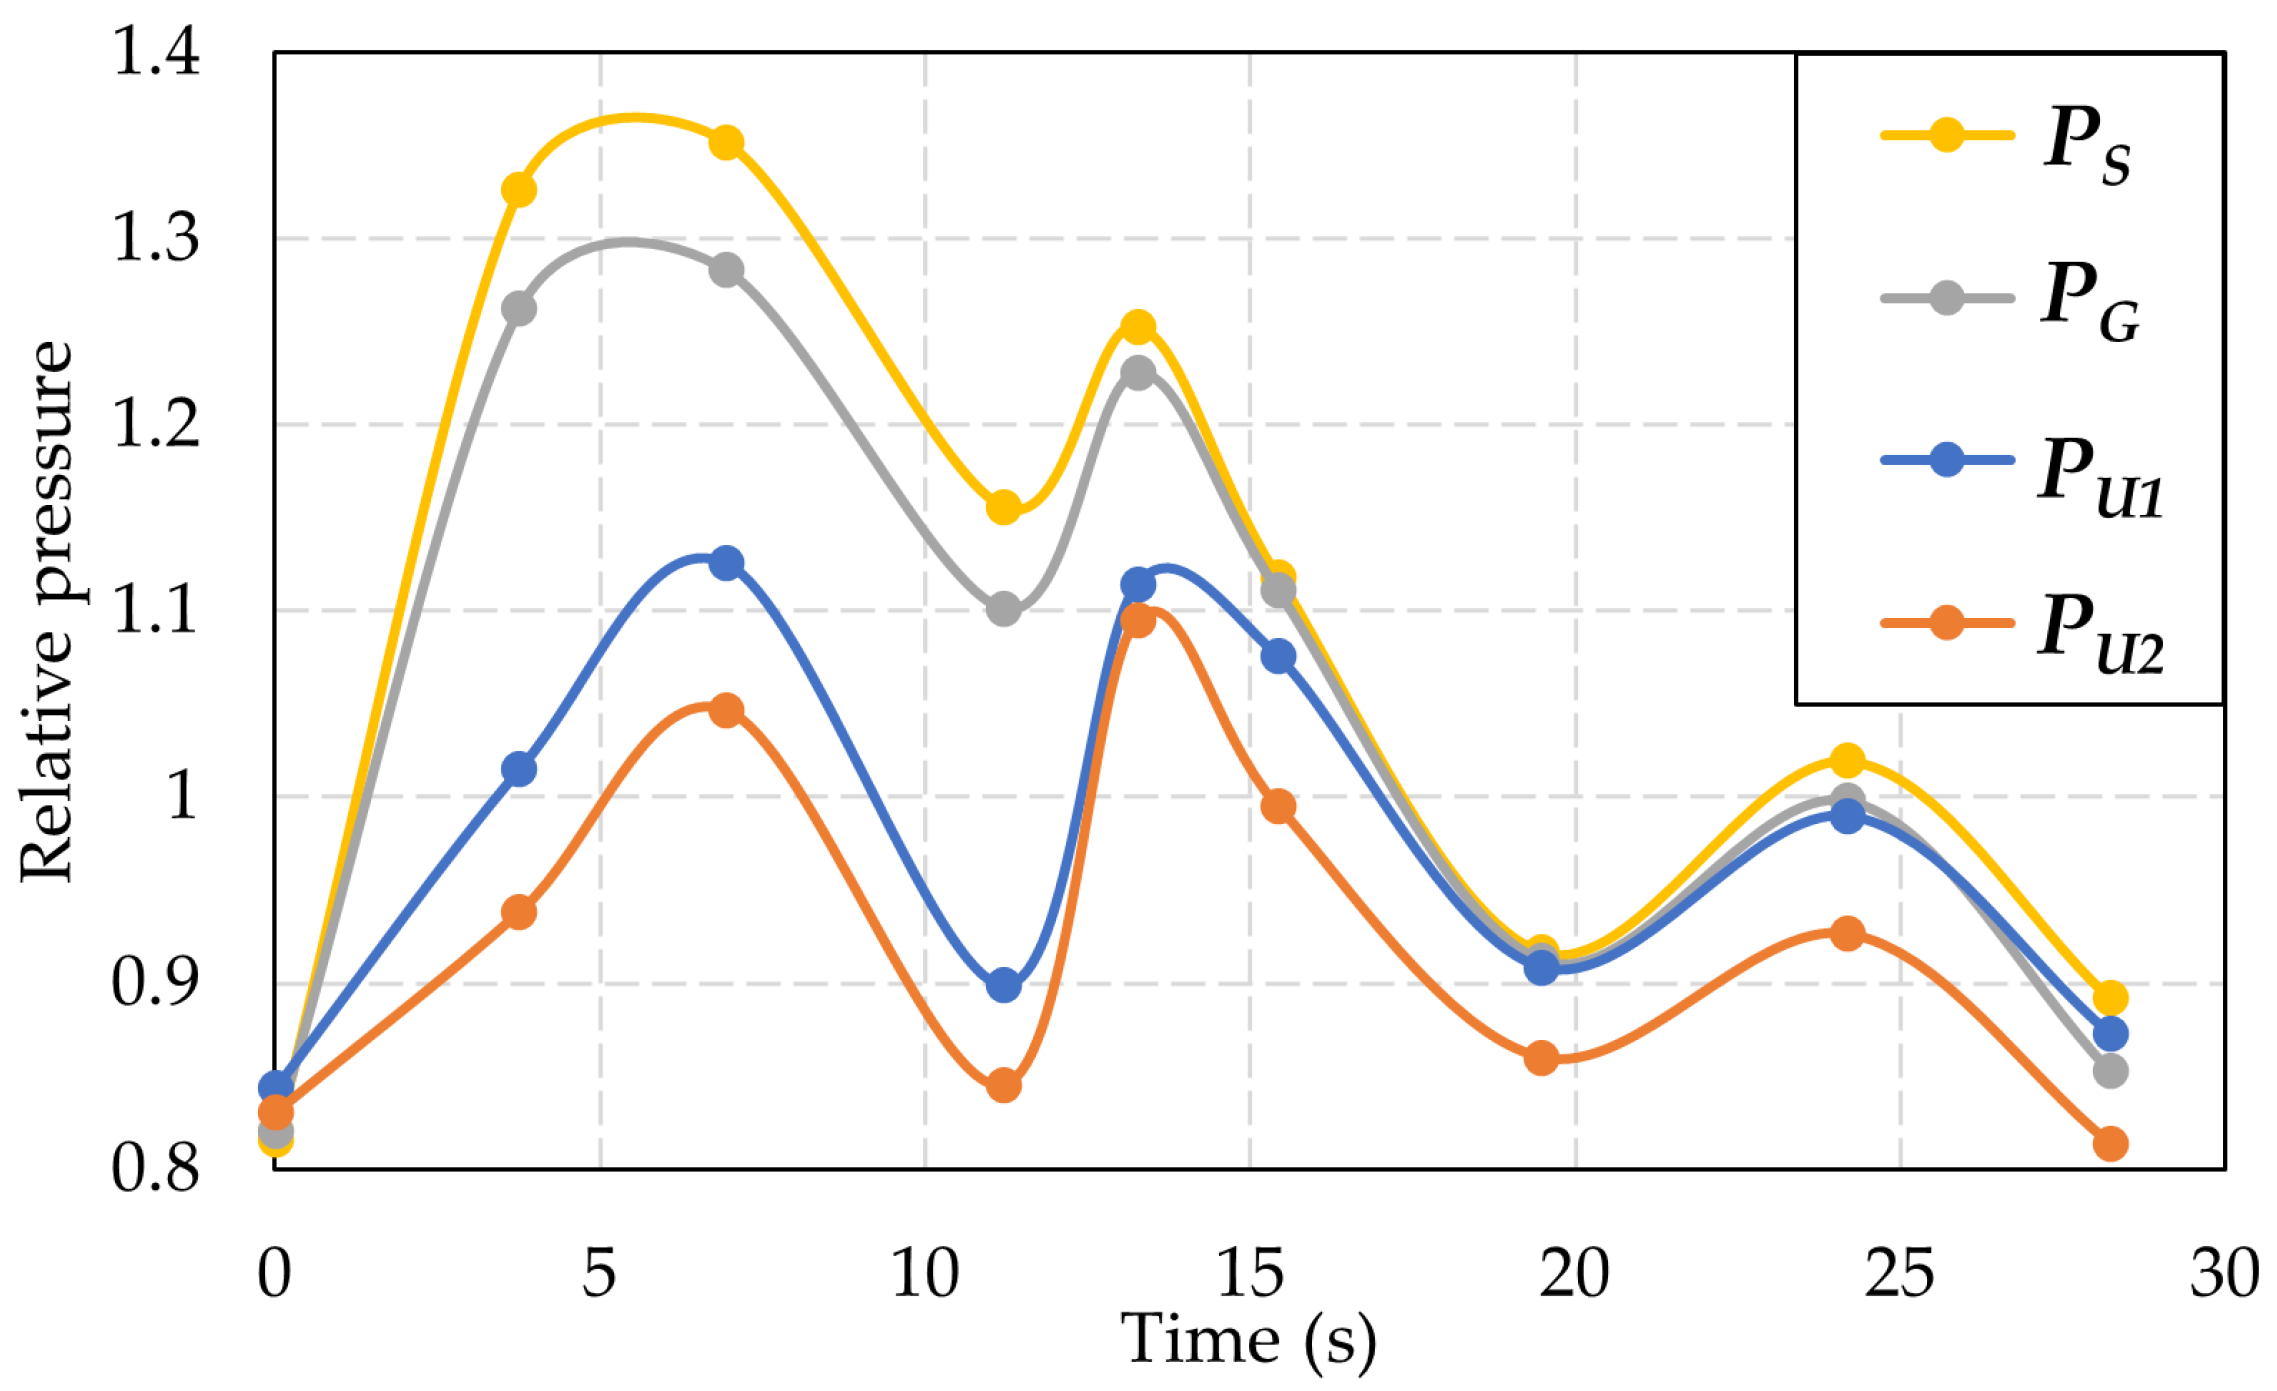
Four pressure monitoring points (, , , ) are set at the stay vanes, guide vanes, crown gap and upper labyrinth seal. The details of the pressure monitoring points and fluid domain from the spiral casing to the draft tube are shown in Figure 6. The variation of pressure at the monitoring points during the load rejection process is shown in Figure 7. During the load rejection process, the pressure of each monitoring point fluctuates with great amplitudes, which is closely related to the discharge and rotating speed of the machine. The high rotating speed enhances the shearing effect of the runner on the non-rotating flow region, increasing the water flow velocity at the inlet and upstream of the runner, resulting in more wake cutting on the vane flow domain. It also enhances the rotor–stator interaction phenomenon and increased the pressure pulsation in the bladeless region. At t = 6.88 s, the GVO and the rotating speed are high and the flow rate is low. At this moment, the turbulence and vortices of the flow from the guide vane increase, and a large number of blade channel vorticity currents appear in the runner, which is extremely unstable. The turbulent flow induces increased energy dissipation and pressure in the vaneless area. At the moment with high discharge and low speed (t = 11.19 s and t = 19.43 s), the deviation between the outflow speed direction of the guide vane and the design condition is small, so the internal flow of the unit is sufficient and uniform and the pressure shows a low level.
3.3.2. Flow Pattern Change in the Runner Passage
In the process of load rejection, the flow from the guide vane to the runner outlet shows extremely unstable turbulent characteristics. Figure 8 shows the streamline distribution in the runner in the whole load rejection process. When the load rejection does not begin (t = 0 s), the flow in the runner is uniform. Afterward, the flow is greatly affected by the changes in flow rate, head and speed.
During the process of load rejection, the fluid in the flow passage shows extremely unstable turbulent characteristics. Figure 8 shows the streamline distribution in one of the sections of the runner during the whole load rejection process. Before the load rejection (t = 0 s), the fluid in the runner flows uniformly. After that, the flow is greatly affected by the change of flow, head and speed. From each figure during the load rejection process, it can be observed that the flow in each flow passage between the blades is different from one another. The flow during load rejection shows apparent asymmetry. At the moments with large discharge (Figure 8b,d,e,g), large vortices appear on the suction surface of the blades. The scale of the vortices implies the size of the flow duct, which disturbs the flow in the machine. The unstable flow induces pressure fluctuation in the runner, which influences the hydraulic torque of the machine.
At the moments with the negative flow (t = 15.40 s and 24.10 s), the unit enters the reverse pump operating condition. Due to the imbalance of speed and flow, the flow between blade passages rotates abnormally and separated flow occurs on the pressure surface of the runner. Both factors cause the wake to fall off upstream of the runner blades and a large number of swirl eddies appear in the vaneless area. At the same time, wake falling off also occurs at the leading edge of the guide vanes and stay vanes. The unstable flow of the unit extends to the spiral casing area. It is shown in research [29] that the vortex core in the vaneless area is impacted instantaneously by a large number of reverse refluxes into the guide vane area and the stay vane area when the unit experiences the reverse pump operating condition, which is also in accordance with the calculation results in this paper.
At t = 15.40 s and 24.10 s, the discharges are negative while the rotating speed is positive, which means the unit enters the reverse pump condition. Due to the imbalance of pressure, the flow between the blades rotates abnormally, and the separation flow appears on the pressure surface of the runner. The separation causes the wake to shed at the trailing edge of the guide vanes, resulting in a large number of vortices in the bladeless area. At the same time, wake shedding also occurs at the leading edges of the blades.
3.3.3. Result of Pressure Variation
Figure 9 shows the pressure change of the upper side of the flow passage of stay vanes, guide vanes, vaneless area, crown seal and upper labyrinth during load rejection. Before the load rejection (t = 0 s) the distribution of the pressure is uniform on the lower side of the head-cover. For the moments of t = 3.73 s, t = 11.19 s, t = 13.24 s and t = 19.43 s, the hydraulic moment is positive or equal to zero, and the pressure distribution of the unit is relatively uniform, i.e., there is no pressure concentration applied on the head-cover. For the moments with negative hydraulic torque (t = 6.88 s, 13.24 s, 15.40 s, 24.10 s), there appears to be circumferential pressure unbalance and pressure concentration in the flow passage of the guide vanes. The pressure concentration is caused by the separation of high-speed circumferential flow through the clearance. In the clearance, the flow comes across a sudden velocity decrease and local pressure rise, which causes strong impacts on the head-cover.
4. Flow-Induced Dynamic Behavior of Structures
4.1. Simulation Setup and Mesh Independence Analysis
The studied stationary structures of the PT unit consist of a head-cover, a stay ring, a bottom ring and connecting bolts (Figure 10). The head-cover and bottom ring are assembled to the stay ring by 80 head-cover bolts and 80 bottom ring bolts. The nominal diameter of the bolts is 110 mm. The material properties of the stationary structures are listed in Table 2.
The flow-induced dynamic behavior of the stationary structures of the PT unit is analyzed in detail with the help of the numerical code ANSYS Mechanical. The finite element mesh and the boundary conditions are shown in Figure 11. All nodal degrees of freedom (DOFs) on the stay ring surfaces embedded in concretes are fixed, and the nodal DOFs of the bottom ring surface welded into the draft tube are also fixed. The calculated pressure loads () are applied on the fluid-structure coupling surfaces and caused large axial force on the head-cover (). The stiffness of turbine radial guide bearing (1.0 × N·m) and the gravity (g = 9.8 m · s) are considered for the analysis.
After applying a preload force () to each bolt, the head-cover, the stay ring and the bottom ring are bolted together as a single structural assembly. The nut is considered to be bonded to the bolt shank, and the bolt thread is bonded to the stay ring. In this study, the bolt thread details are not considered. The connection surfaces between the head-cover and the stay ring are in frictional contact. The same setting applies to the attachment surfaces between the bottom ring and the stay ring, the attachment surfaces between the nuts and the head-cover, and the attachment surfaces between the nuts and the bottom ring. The friction coefficient of frictional contacts is set to 0.1. The exported pressure files from CFD simulations at each time point during the load rejection are mapped on the finite element model of the stationary structures sequentially so that the flow-induced dynamic behavior of the studied structures can be analyzed.
The geometrically complex head-cover, stay ring and bottom ring are meshed with high-quality tetrahedral elements, while the bolts are geometrically simple and meshed with high-quality hexahedral elements. The meshes of the head-cover bolts and bottom ring bolts, especially at the typical stress concentration areas, are refined (S1 and S2).
To achieve a reasonable balance between the accuracy of the computation results and the simulation time, a mesh independence analysis shall be carried out. Three groups of meshes with different element sizes are established for the studied structures. The node numbers of three sets of meshes are 1.6 × , 2.4 × and 5.2 × , respectively. Figure 12 shows that the second group mesh marked by the red box consumes only 0.7% of the simulation time of the third group, but the results are similar. Therefore, it is logical to use the second group mesh to complete the investigation.
4.2. Results and Discussions
During the turbine load rejection process, the hydraulic pressure load acting on the stationary structures of the unit changes significantly. Figure 13 shows the normalized axial thrust on the head-cover. It can be observed that the axial thrust on the head-cover is time-dependent and the force direction is axially upward during the whole load rejection process. The axial thrust has three local maxima during load rejection and reaches its maximum at t = 13.2 s. The maximum axial thrust is more than ten times the overall weight of the head-cover plus the rotating shaft line.
The maximum deformation of the structures induced by unsteady flow during load rejection is also changing with time, but the deformation distribution at the different moments keeps the same pattern, as shown in Figure 14.
Flange beams and bolt flanges are used to strengthen the connections between the stay ring and the head-cover and the bottom ring. The adjacent head-cover bolts (bolt couple) between the flange beams are deformed close to each other, resulting from the hydraulic forces induced by the unsteady flow. The same deformation characteristics are also present on the bottom ring bolts.
The vibration behavior of the head-cover and head-cover bolts during load rejection are strongly related to the axial thrust on the head-cover. Since the inner head-cover has no support in the axial direction, the maximum deformation of the structures appears at the inner plate of the head-cover lifted by the large axial thrust. During the load rejection process, the maximum deformation of the head-cover with time follows the variation of the axial thrust and reaches its maximum at t = 13.2 s (Figure 15).
In order to facilitate production processing, transportation and installation, the head-cover is usually manufactured as two symmetrical halves, which are assembled into a single structure during the installation in the power plant. As can be seen from Figure 16, the flow-induced deformation of the head-cover is also symmetrical. Since the connecting flanges of the head-cover are thicker than the stiffener plates, the deformation of the head-cover inner plate near the connecting flanges is smaller than the deformation of the inner plate at other locations. Therefore, increasing the thickness of the stiffener plates inside the head-cover can increase the local stiffness and effectively reduce the deformation of the inner plate of the head-cover.
The flow-induced stress distribution during turbine load rejection in the large stationary structures of the unit including the head-cover, stay ring and bottom ring is shown in Figure 17. The large hydraulic pressure acts on the stationary structures of the unit, pressing the bottom ring downward and lifting the head-cover. As a result, the guide vanes between them are stretched. Since the trailing edge of the stay vane is much thinner than the leading edge, the maximum flow-induced stress is concentrated at the rounded corner of the trailing edge of the stay vane.
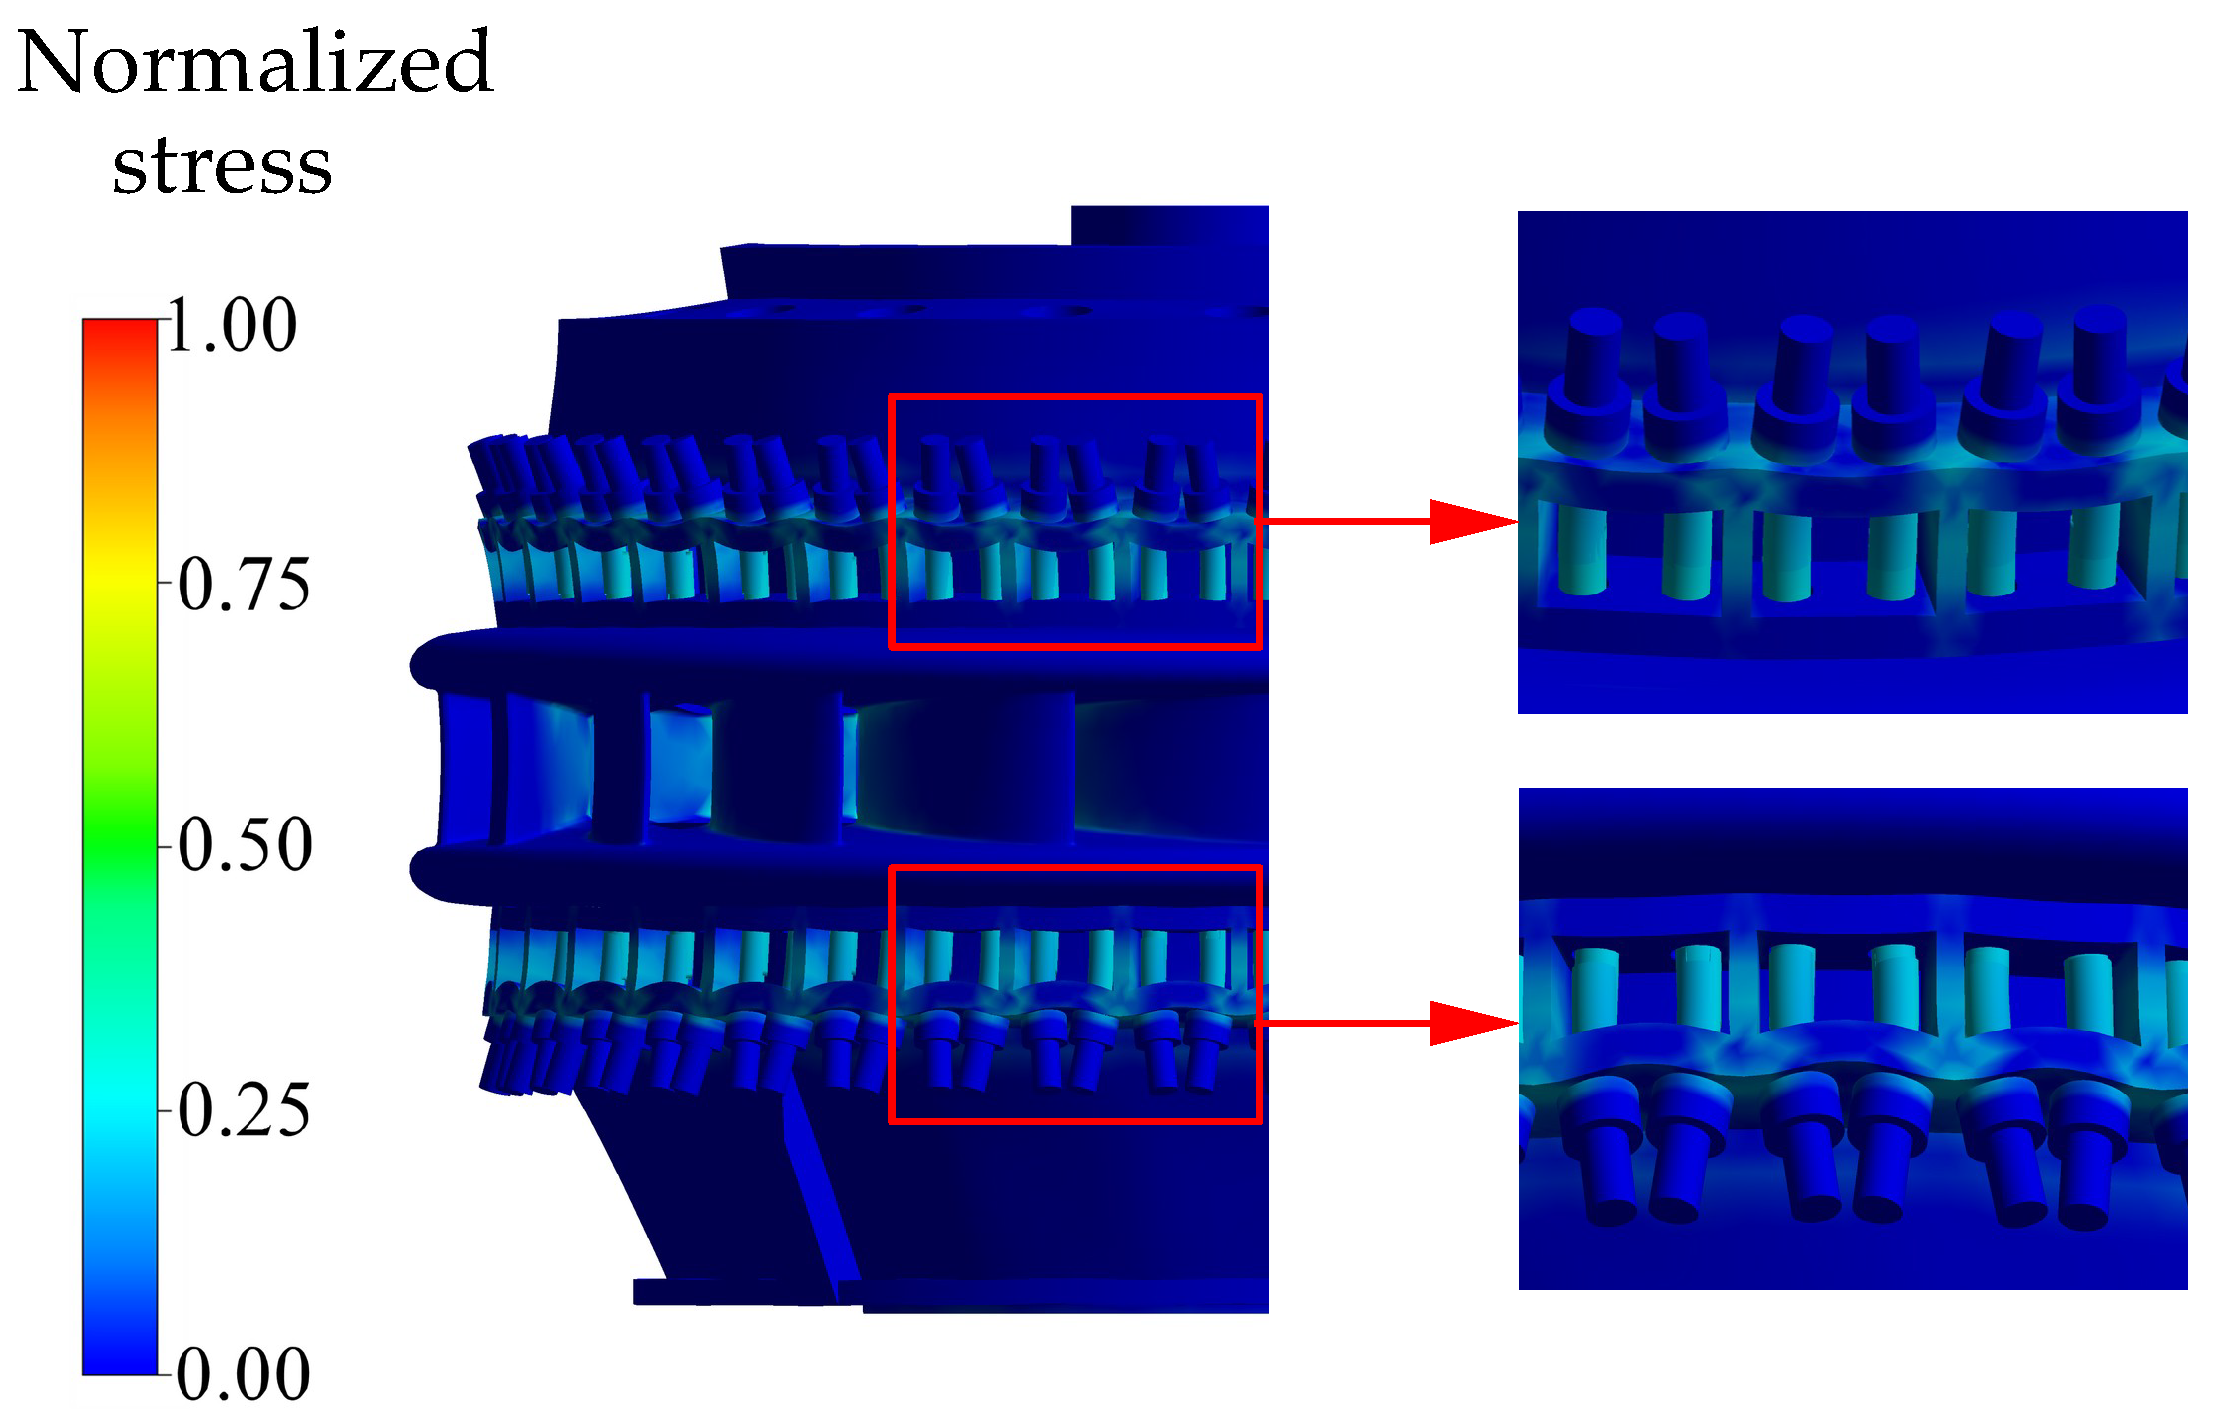
Since the connecting bolts bear the large pressure from the flow channel and tighten the stationary structures of the unit together, high stresses during the turbine load rejection appear also on the head-cover bolts, bottom ring bolts, the flange beams, and the bolt flanges (Figure 17). The bolt couples are evenly distributed along the circumference in the large stationary structures so that the stress distribution in each bolt couple shows a similar distribution (Figure 18).
The stress distributions of the head-cover bolts and the bottom ring bolts during the process of turbine load rejection are demonstrated in Figure 19. The analysis shows that the stress distribution of the connection bolts is similar in general. The maximum stress of the head-cover bolt is located at the bolt fillet close to the head-cover bolt flange, while the maximum stress of the bottom ring bolt is concentrated at the bolt fillet near the bottom ring bolt flange.
The stress distribution of the large stationary structures, head-cover bolts and bottom ring bolts during turbine load rejection varies with time and keeps the same pattern at different moments. Figure 20 compares the maximum stresses of the stay ring, head-cover bolts, and bottom ring bolts during turbine load rejection. The stresses are normalized with reference to the maximum stress of the head-cover bolts.
The axial effective area of the head-cover is much larger than that of the bottom ring, so the axial force on the head-cover is larger than that on the bottom ring. In addition, the bottom ring with sold reinforced plates is more rigid than the head-cover. So the maximum stress of head-cover bolts is higher than the maximum stress of bottom ring bolts during turbine load rejection, and the peak-peak value of head-cover bolts is also larger than that of the bottom ring bolts. Figure 20 also shows that the peak-peak value of the stay ring is larger than the connection bolts, but the absolute stress values are much lower than the connection bolts.
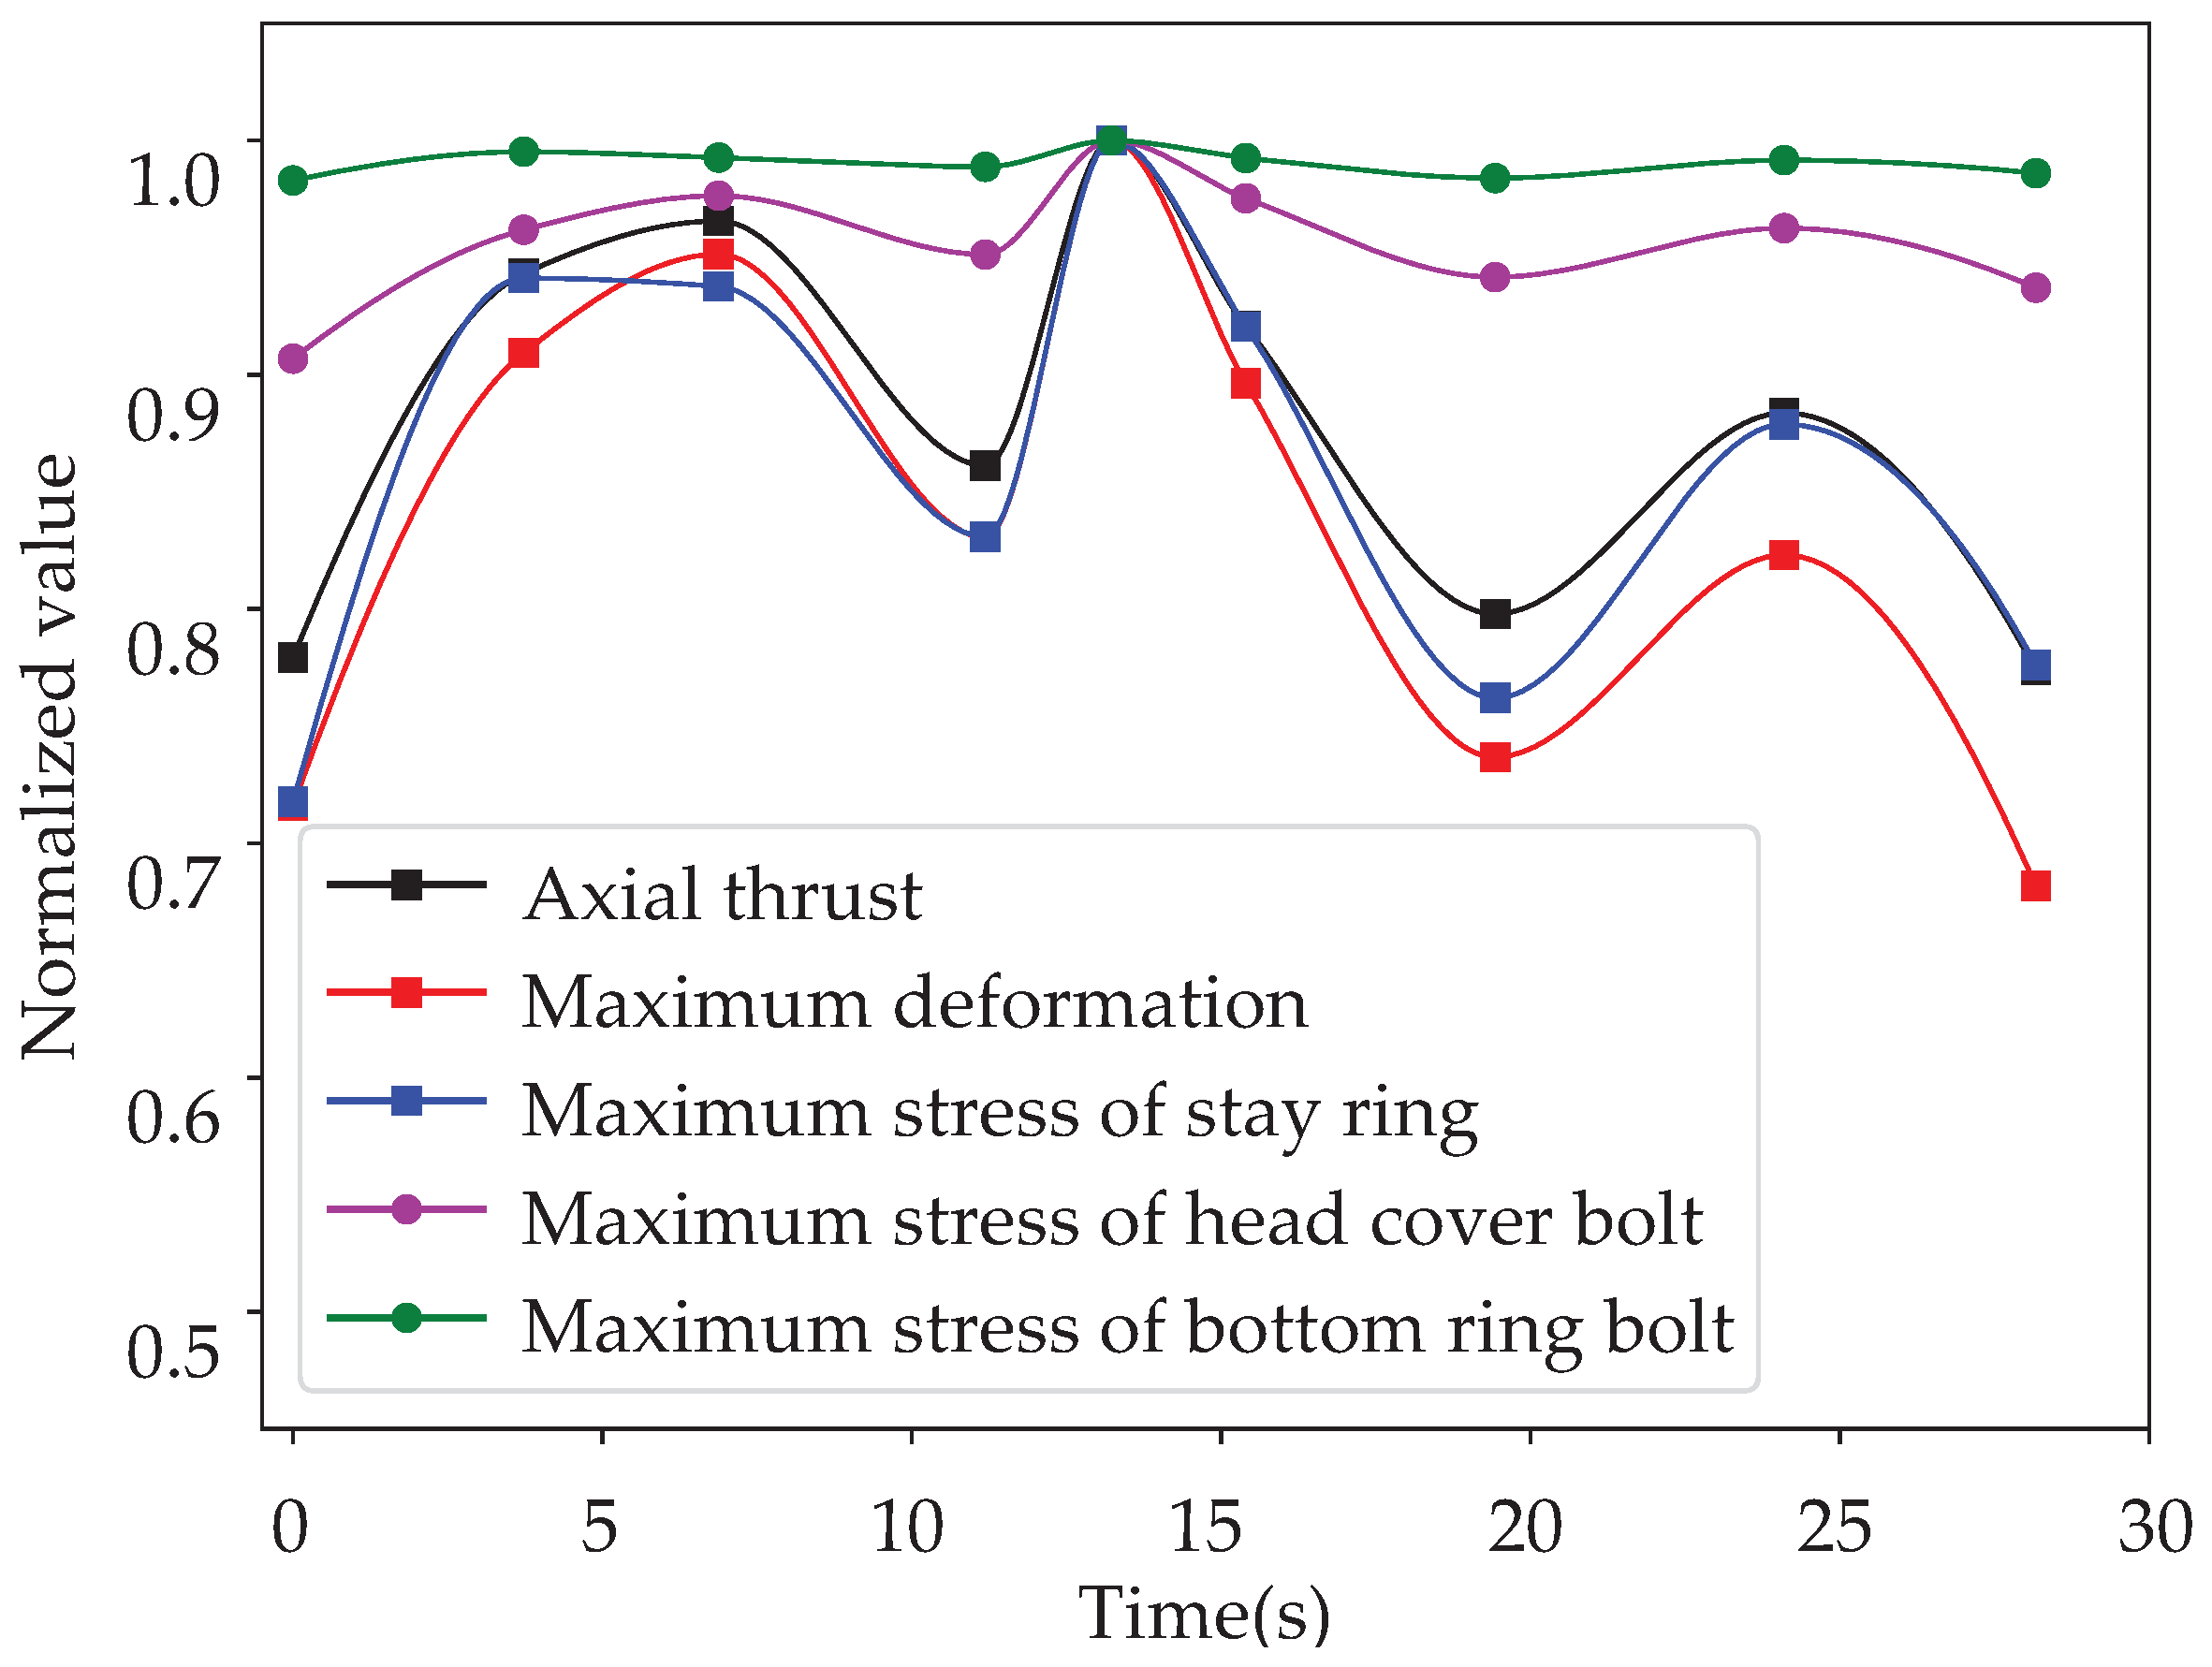
In order to study the relation between the axial thrust and the structural dynamic behavior, Figure 21 compares the axial thrust and the maximum deformation and stresses of the structures during the load rejection process. All values are normalized with reference to their maximum values, respectively. The maximum deformation and stresses of the structures follow the same trend of axial thrust with time during the turbine load rejection and reach their respective maximum values at t = 13.24 s. However, the variation ranges of these parameters are significantly different.
Figure 21 shows the variation range of the axial thrust, maximum structural deformation and maximum stress of the stay ring. It can be observed that the range is between 0.7 to 1, which is larger than the variation range of the maximum stress of the connection bolts, between 0.9 to 1. For the connection bolts, the variation range of the head-cover bolts (0.93–1) is larger than that of the bottom ring bolts (0.98–1), and the absolute stress value of the head-cover bolts is higher than that of the bottom ring bolts, so under the same operation condition, the head-cover bolts are more prone to fatigue failure with enough alternative load cycles.
For the connection bolts, the variation range of the head-cover bolts (0.93–1) is greater than that of the bottom ring bolts 0.98–1, and the absolute stress value of the head-cover bolts is higher than that of the bottom ring bolts, as shown in Figure 20. Therefore, under the same operating conditions, the head-cover bolts are more prone to fatigue failure than bottom ring bolts under sufficient cycles of alternating loads.
5. Conclusions
The flow-induced dynamic behavior of the stationary structures including head-cover bolts in a prototype pump-turbine unit during turbine load rejection has been studied in detail.
Firstly, the variation of the inlet and outlet pressures during the load rejection process has been calculated by 1D pipeline simulation. Then, the 3D model of the researched PT unit is built from the spiral casing to the draft tube. The pressure-balance pipelines and labyrinth seals are included in the model. After that, the pressure obtained by 1D simulation is used as the boundary conditions of the CFD simulation carried out on the 3D model. The calculation results show that large-scale vortices appear in the runner during the load rejection process. The pressure distribution analysis shows the pressure concentration on the head-cover.
By applying the pressure loads calculated by CFD simulations, the flow-induced deformation and stress of the structures have been analyzed. The maximum deformation and stresses of the structures during load rejection are changing with time, but the distributions of deformation and stress at the different moments keep the same pattern.
The maximum deformation during turbine load rejection is located on the inner plate of the head-cover. Increasing the thickness of the stiffener plates of the head-cover can improve the local rigidity of the head-cover, thereby effectively reducing the deformation of the inner plate of the head-cover.
The maximum stress of the large stationary structures appears at the rounded corner of the trailing edge of the stretched stay vane, and the maximum stress of the bolts in the head-cover and bottom ring is concentrated at the bolt fillet close to the bolt flange.
The maximum deformation and stresses in the structures during turbine load rejection follow the tendency of axial thrust variation with time and reach their respective maximum values at t = 13.24 s.
During turbine load rejection, the variation ranges of axial thrust, maximum deformation, and maximum stress are significantly different. The normalized variation range of the axial thrust, maximum structural deformation, and maximum stress of the stay ring (0.7 to 1) is larger than that of the maximum stress of the connection bolts (0.9 to 1). Both the absolute stress value and the peak-peak value of head-cover bolts are larger than those of the bottom ring bolts, therefore the head-cover bolts are more prone to fatigue failure with enough alternative load cycles than the bottom ring bolts. It is recommended to strengthen the online monitoring and on-site inspection of head-cover bolts and bottom ring bolts and replace the bolts after a long service time.
Author Contributions
Conceptualization, Z.W.; methodology, W.Z. and X.H.; software, H.B., Q.H., W.Z., M.Y., H.Y. and X.H.; validation, H.B., M.Y. and H.Y.; investigation, H.B., Q.H., W.Z. and X.H.; writing—original draft preparation, W.Z., X.H. and Q.H.; writing—review and editing, W.Z., X.H., M.Y., H.Y., H.B. and Q.H.; supervision, Z.W. All authors have read and agreed to the published version of the manuscript.
Funding
The work is supported by Joint Open Research Fund Program of State key Laboratory of Hydroscience and Engineering and Tsinghua—Ningxia Yinchuan Joint Institute of Internet of Waters on Digital Water Governance (sklhse-2022-Iow13). This work is supported by National Natural Science Foundation of China (No.: 51876099).
Institutional Review Board Statement
Not applicable.
Informed Consent Statement
Not applicable.
Data Availability Statement
Not applicable.
Acknowledgments
The authors would like to express their sincere thanks for the financial support of the project: Research on Lifetime Prediction of Non-rotating Parts of pump-turbine Unit Based on Rotor-Stator Interaction (RSI), Fluid–Structure Coupling and Fracture Mechanics—Research project on RSI mechanism and its Influence on Non-rotating parts of pump-turbine Unit of Branch Company of Maintenance & Test, CSG Power Generation Co., LTD.
Conflicts of Interest
The authors declare no conflict of interest.
Abbreviations
The following abbreviations are used in this manuscript:
| PSPS | Pumped storage power station |
| CFD | Computational fluid dynamics |
| FEM | Finite element method |
| FSI | Fluid–structure interaction |
| FVM | Finite volume method |
| PT | Pump-turbine |
References
- Zhao, W. Improved Condition Monitoring of Hydraulic Turbines Based on Artificial Intelligence Techniques. Ph.D. Thesis, Universitat Politècnica de Catalunya, Barcelona, Spain, 2021. [Google Scholar]
- Zhao, W.; Presas, A.; Egusquiza, M.; Valentín, D.; Egusquiza, E.; Valero, C. On the use of Vibrational Hill Charts for improved condition monitoring and diagnosis of hydraulic turbines. Struct. Health Monit. 2022, 21, 14759217211072409. [Google Scholar] [CrossRef]
- Zhao, W.; Egusquiza, M.; Valero, C.; Valentín, D.; Presas, A.; Egusquiza, E. On the use of artificial neural networks for condition monitoring of pump-turbines with extended operation. Measurement 2020, 163, 107952. [Google Scholar] [CrossRef]
- Liu, X.; Luo, Y.; Wang, Z. A review on fatigue damage mechanism in hydro turbines. Renew. Sustain. Energy Rev. 2016, 54, 1–14. [Google Scholar] [CrossRef]
- Casanova, F.; Mantilla, C. Fatigue failure of the bolts connecting a Francis turbine with the shaft. Eng. Fail. Anal. 2018, 90, 1–13. [Google Scholar] [CrossRef]
- Peltier, R.; Boyko, A.; Popov, S.; Krajisnik, N. Investigating the Sayano-Shushenskaya hydro power plant disaster. Power 2010, 154, 48. [Google Scholar]
- Egusquiza, E.; Valero, C.; Huang, X.; Jou, E.; Guardo, A.; Rodriguez, C. Failure investigation of a large pump-turbine runner. Eng. Fail. Anal. 2012, 23, 27–34. [Google Scholar] [CrossRef] [Green Version]
- Wang, Z.; Yang, J.; Wang, W.; Qu, J.; Huang, X.; Zhao, W. Research on the Flow-Induced Stress Characteristics of Head-Cover Bolts of a Pump-Turbine during Turbine Start-Up. Energies 2022, 15, 1832. [Google Scholar] [CrossRef]
- Song, X.j.; Yao, R.; Chao, L.; Wang, Z.w. Study of the formation and dynamic characteristics of the vortex in the pump sump by CFD and experiment. J. Hydrodyn. 2021, 33, 1202–1215. [Google Scholar] [CrossRef]
- Luo, Y.; Chen, F.; Chen, L.; Wang, Z.; Yu, J.; Zhu, X.; Zhao, Z.; Ren, S.; Li, J.; Lu, X. Study on stresses of head cover bolts in a pump turbine based on FSI. In IOP Conference Series: Earth and Environmental Science; IOP Publishing: Bristol, UK, 2021; Volume 804, p. 042062. [Google Scholar]
- Luo, Y.; Chen, F.; Chen, L.; Wang, Z.; Yu, J.; Luo, C.; Zhao, Z.; Ren, S.; Li, J.; Deng, D. Stresses and relative stiffness of the head cover bolts in a pump turbine. In IOP Conference Series: Materials Science and Engineering; IOP Publishing: Bristol, UK, 2019; Volume 493, p. 012113. [Google Scholar]
- Chen, F.; Chen, L.; Wang, Z.; Yu, J.; Luo, C.; Zhao, Z.; Ren, S.; Li, J.; Deng, D. Computation of static stresses of the head cover bolts in a pump turbine. In IOP Conference Series: Materials Science and Engineering; IOP Publishing: Bristol, UK, 2019; Volume 493, p. 012143. [Google Scholar]
- Chen, L.; Li, H.; Yu, J.; Luo, Y.; Wang, Z.; Zhu, X.; Zhao, Z.; Lu, X. Stress analysis of screw connection of key structural components in pump turbine. In IOP Conference Series: Earth and Environmental Science; IOP Publishing: Bristol, UK, 2021; Volume 804, p. 032037. [Google Scholar]
- Brekke, H. Performance and safety of hydraulic turbines. In IOP Conference Series: Earth and Environmental Science; IOP Publishing: Bristol, UK, 2010; Volume 12, p. 012061. [Google Scholar]
- Huang, X.; Chamberland-Lauzon, J.; Oram, C.; Klopfer, A.; Ruchonnet, N. Fatigue analyses of the prototype Francis runners based on site measurements and simulations. In IOP Conference Series: Earth and Environmental Science; IOP Publishing: Bristol, UK, 2014; Volume 22, p. 012014. [Google Scholar]
- He, Q.; Huang, X.; Yang, M.; Yang, H.; Bi, H.; Wang, Z. Fluid–Structure Coupling Analysis of the Stationary Structures of a Prototype Pump Turbine during Load Rejection. Energies 2022, 15, 3764. [Google Scholar] [CrossRef]
- He, L.; Wang, Z.; Kurosawa, S.; Nakahara, Y. Resonance investigation of pump-turbine during startup process. In IOP Conference Series: Earth and Environmental Science; IOP Publishing: Bristol, UK, 2014; Volume 22, p. 032024. [Google Scholar]
- Kolšek, T.; Duhovnik, J.; Bergant, A. Simulation of unsteady flow and runner rotation during shut-down of an axial water turbine. J. Hydraul. Res. 2006, 44, 129–137. [Google Scholar] [CrossRef]
- Ciocan, G.D.; Iliescu, M.S.; Vu, T.C.; Nennemann, B.; Avellan, F. Experimental study and numerical simulation of the FLINDT draft tube rotating vortex. J. Fluids Eng. 2007, 129, 146–158. [Google Scholar] [CrossRef]
- Huang, X.; Oram, C.; Sick, M. Static and dynamic stress analyses of the prototype high head Francis runner based on site measurement. In IOP Conference Series: Earth and Environmental Science; IOP Publishing: Bristol, UK, 2014; Volume 22, p. 032052. [Google Scholar]
- Goyal, R.; Cervantes, M.J.; Gandhi, B.K. Characteristics of Synchronous and Asynchronous modes of fluctuations in Francis turbine draft tube during load variation. Int. J. Fluid Mach. Syst. 2017, 10, 164–175. [Google Scholar] [CrossRef]
- Mao, Z.; Tao, R.; Chen, F.; Bi, H.; Cao, J.; Luo, Y.; Fan, H.; Wang, Z. Investigation of the starting-up axial hydraulic force and structure characteristics of pump turbine in pump mode. J. Mar. Sci. Eng. 2021, 9, 158. [Google Scholar] [CrossRef]
- Münch, C.; Ausoni, P.; Braun, O.; Farhat, M.; Avellan, F. Fluid–structure coupling for an oscillating hydrofoil. J. Fluids Struct. 2010, 26, 1018–1033. [Google Scholar] [CrossRef]
- Benra, F.K.; Dohmen, H.J. Comparison of pump impeller orbit curves obtained by measurement and FSI simulation. In Proceedings of the ASME Pressure Vessels and Piping Conference, San Antonio, TX, USA, 22–26 July 2007; Volume 42827, pp. 41–48. [Google Scholar]
- Kato, C.; Yoshimura, S.; Yamade, Y.; Jiang, Y.Y.; Wang, H.; Imai, R.; Katsura, H.; Yoshida, T.; Takano, Y. Prediction of the noise from a multi-stage centrifugal pump. In Proceedings of the Fluids Engineering Division Summer Meeting, Houston, TX, USA, 19–23 June 2005; Volume 41987, pp. 1273–1280. [Google Scholar]
- Jiang, Y.; Yoshimura, S.; Imai, R.; Katsura, H.; Yoshida, T.; Kato, C. Quantitative evaluation of flow-induced structural vibration and noise in turbomachinery by full-scale weakly coupled simulation. J. Fluids Struct. 2007, 23, 531–544. [Google Scholar] [CrossRef]
- Mandair, S.; Morissette, J.; Magnan, R.; Karney, B. MOC-CFD coupled model of load rejection in hydropower station. In IOP Conference Series: Earth and Environmental Science; IOP Publishing: Bristol, UK, 2021; Volume 774, p. 012021. [Google Scholar]
- Zhou, D.; Chen, H.; Kan, K.; Yu, A.; Binama, M.; Chen, Y. Experimental study on load rejection process of a model tubular turbine. In IOP Conference Series: Earth and Environmental Science; IOP Publishing: Bristol, UK, 2021; Volume 774, p. 012036. [Google Scholar]
- Fu, X.; Li, D.; Wang, H.; Zhang, G.; Li, Z.; Wei, X. Dynamic instability of a pump-turbine in load rejection transient process. Sci. China Technol. Sci. 2018, 61, 1765–1775. [Google Scholar] [CrossRef]
Figure 1.
The 1D calculation model of the researched PT unit.

Figure 2.
The operating parameters and 9 key time points of the PT unit during load rejection.

Figure 3.
Normalized pressure at the spiral casing inlet and draft tube outlet.

Figure 4.
The 3D modeling of flow passage of the unit.

Figure 5.
Mesh of the fluid domains.

Figure 6.
Pressure monitoring points’ selection.

Figure 7.
Pressure change at the monitoring points.

Figure 8.
Flow pattern in the runner passage.

Figure 9.
Pressure distribution in the flow passages at different key time moments.

Figure 10.
CAD model and boundary conditions of the stationary structures of the PT unit.

Figure 11.
Simulation setup and finite element mesh of the stationary structure of the unit.

Figure 12.
Mesh independence analysis.

Figure 13.
Axial thrust of the head-cover during load rejection.

Figure 14.
Deformation distribution of the stationary structures in section view.

Figure 15.
The maximum deformation of the head-cover during load rejection.

Figure 16.
Deformation distribution of the stationary structures in top view.

Figure 17.
The stress distribution of the large stationary structures.

Figure 18.
The stress distribution of the large stationary structures and the connection bolts.

Figure 19.
The stress distribution of head-cover bolts and bottom ring bolts.

Figure 20.
Comparison of the maximum stresses of the stationary structures during load rejection.

Figure 21.
Results’ comparison of the PT unit during load rejection.


Table 1.
Element number of flow domains.
| Flow Domain | Elements () |
|---|---|
| Spiral casing and Stay vane | 3.26 |
| Guide Vane | 0.27 |
| Runner | 3.63 |
| Draft tube | 0.60 |
| Labyrinth seal and Pressure-balance pipelines | 0.40 |
| Total | 8.16 |
Table 2.
Material properties of the studied structures.
| Property | Value |
|---|---|
| Elastic modulus [Pa] | 2.1 × |
| Poisson’s ratio [-] | 0.3 |
| Density [kg·m ] | 7850 |
Publisher’s Note: MDPI stays neutral with regard to jurisdictional claims in published maps and institutional affiliations. |
© 2022 by the authors. Licensee MDPI, Basel, Switzerland. This article is an open access article distributed under the terms and conditions of the Creative Commons Attribution (CC BY) license (https://creativecommons.org/licenses/by/4.0/).
Share and Cite
MDPI and ACS Style
Zhao, W.; Huang, X.; Yang, M.; Yang, H.; Bi, H.; He, Q.; Wang, Z. Flow-Induced Dynamic Behavior of Head-Cover Bolts in a Prototype Pump-Turbine during Load Rejection. Machines 2022, 10, 1130. https://doi.org/10.3390/machines10121130
AMA Style
Zhao W, Huang X, Yang M, Yang H, Bi H, He Q, Wang Z. Flow-Induced Dynamic Behavior of Head-Cover Bolts in a Prototype Pump-Turbine during Load Rejection. Machines. 2022; 10(12):1130. https://doi.org/10.3390/machines10121130
Chicago/Turabian StyleZhao, Weiqiang, Xingxing Huang, Mengqi Yang, Haixia Yang, Huili Bi, Qilian He, and Zhengwei Wang. 2022. "Flow-Induced Dynamic Behavior of Head-Cover Bolts in a Prototype Pump-Turbine during Load Rejection" Machines 10, no. 12: 1130. https://doi.org/10.3390/machines10121130
Note that from the first issue of 2016, this journal uses article numbers instead of page numbers. See further details here.