
Advances and Prospects of Vision-Based 3D Shape Measurement Methods

State Key Laboratory for Manufacturing Systems Engineering, Xi’an Jiaotong University, Xi’an 710049, China
*
Author to whom correspondence should be addressed.
Machines 2022, 10(2), 124; https://doi.org/10.3390/machines10020124
Submission received: 5 January 2022
/
Revised: 25 January 2022
/
Accepted: 7 February 2022
/
Published: 10 February 2022
(This article belongs to the Special Issue Precision Measurement and Machines)
Abstract
:Vision-based three-dimensional (3D) shape measurement techniques have been widely applied over the past decades in numerous applications due to their characteristics of high precision, high efficiency and non-contact. Recently, great advances in computing devices and artificial intelligence have facilitated the development of vision-based measurement technology. This paper mainly focuses on state-of-the-art vision-based methods that can perform 3D shape measurement with high precision and high resolution. Specifically, the basic principles and typical techniques of triangulation-based measurement methods as well as their advantages and limitations are elaborated, and the learning-based techniques used for 3D vision measurement are enumerated. Finally, the advances of, and the prospects for, further improvement of vision-based 3D shape measurement techniques are proposed.
1. Introduction
The technical exploration of extracting three-dimensional (3D) information from two-dimensional (2D) images began with the research on the image processing of polyhedral block world by L. R. Roberts in the mid-1960s. An important landmark in the development of 3D machine vision was the computational theory of vision proposed by David Marr [1], who worked in the artificial intelligence laboratory of the Massachusetts Institute of Technology (MIT) during the 1970s and published a book [2] which provided a complete theoretical framework of machine vision systems in 1982. Since then, vision-based 3D perception methods have been widely studied and employed in industrial manufacturing, biomedical engineering and reverse engineering due to their merits of high precision, high efficiency and non-contact [3]. Recently, the explosive growth of artificial intelligence (AI) technology has given a boost to vision-based 3D shape measurement techniques with its powerful capability of data representation [4,5]. Intelligent robots have been developed to perceive their external environment and autonomously navigate by utilizing 3D vision techniques [6,7]. Vision-based 3D measurement is no doubt the core technology of an advanced manufacturing industry characterized by networked and intelligent manufacturing.
Vision-based 3D measurements can be classified into active and passive methods. The passive methods realize 3D sensing without active illumination, and according to the number of used cameras they can be divided into monocular vision, stereo vision [8], and multiple view vision-based measurements [9]. Monocular vision-based measurements can be classified into two major categories: the conventional methods including shape from focus (SFF) [10], structure from motion (SFM) [11], simultaneous localization and mapping (SLAM) [12], etc.; and the learning-based methods, [13] which use a large number of sample data to train convolutional neural network (CNN) and then obtain the depth information of the scene through network model. These passive methods are often limited by the texture of scenes and have lower accuracy compared with the active methods, represented by time-of-flight (ToF) [14], triangulation-based laser scanning [15] and structured light (SL) [16], phase measuring deflectometry (PMD) [17], differential interference contrast [18], etc.
ToF and triangulation-based 3D vision measurements are the most popular and widely used methods in daily life and industrial production. ToF, as one of the active vision methods, has recently been brought into focus in the consumer hardware space (e.g., Microsoft Kinect, Intel RealSense, HUAWEI P40 Pro) and has been applied to various applications at the consumer level (e.g., 3D reconstruction, face recognition, virtual reality). In a typical ToF system, an active optical emitter and a receiver are used to emit light and receive the optical signal reflected by the scene in time domain, respectively. Depth information of the scene can be obtained by recording the time difference between the light emission and the reception. However, ToF has certain limitations in industrial applications. The time difference for short distances is difficult to calculate accurately, and the achievable depth resolution is from a millimeter to submillimeter, which is relatively low due to the very fast propagation speed of light.
Triangulation-based methods require the capture of images from at least two perspectives due to the depth ambiguity of monocular imaging. Photogrammetry that originated in the field of surveying and mapping captures images from multiple perspectives followed by matching the common feature points in the images. Camera poses and 3D points can be calculated based on the triangulation and bundle adjustment. Despite the measurement coordinate system, photogrammetry is similar to SFM [11] in computer vision, which carries out 3D reconstruction from 2D images. Photogrammetry only obtains a set of sparse 3D points of the scene and needs a gauge to recover the absolute scale. Stereo vision captures images from two known perspectives and then identifies and matches the corresponding features in the images. The 3D profile can be recovered using the known intrinsic and extrinsic camera parameters. It also has low spatial resolution and has difficulty in dealing with textureless scenes. To address the above problems of passive vision methods, laser scanning and SL techniques were proposed to introduce artificial textures into textureless scenes, so as to realize 3D reconstruction with high resolution and accuracy. A laser scanning system usually uses a line laser to project one or more laser stripes onto an object, and 3D scanning is performed with the movement of the stripe or object. Three-dimensional geometry information is then acquired by extracting the modulated laser stripes based on the calibrated laser triangulation model. SL techniques can acquire a 3D profile with full field of view in single measurement. A group of images with encoded features is projected onto the object followed by the capture and decoding of the SL patterns modulated by the object profile, and then accurate and efficient 3D data can be obtained using the calibrated SL system model.
With the impressive advancement of AI, the research of vision-based 3D shape measurement technology is making constant breakthroughs. This paper elaborates the state-of-the-art triangulation-based methods for their achievable high resolution and accuracy and practicability in engineering. Specifically, the basic principles and typical techniques as well as their advantages and limitations are reviewed in this paper. The learning-based 3D vision measurements are also discussed. On this basis, opinions about the challenges and perspectives of vision-based 3D shape measurement technology towards further improvement are proposed.
2. Basics of Vision-Based 3D Measurement
2.1. Camera Model
The camera is the core component in a vision-based 3D measurement system. The mathematical relationship between a given 3D point in the world coordinate system and its 2D projection on the image plane can be described based on a pinhole model. As shown in Figure 1a, a 3D point Pw(Xw, Yw, Zw) in the world coordinate system OwXwYwZw is transformed to a 2D pixel p(u, v) in the image coordinate system ouv by the camera lens:
where Kc represents the projection matrix of the camera, R and t represent the rotation matrix and translation matrix from the 3D world coordinate system to the 3D camera coordinate system, respectively, and s represents the scaled factor.
For perspective lens,
where fx, fy, cx and cy are the intrinsic parameters.
For telecentric lens [19], the imaging process is a parallel projection, as shown in Figure 1b, and
where m represents the equivalent focal length.
To expand the depth of focus in the case of high magnifications, the image sensor is often tilted relative to the optical lens to focus on an oblique plane, which is called the Scheimpflug condition [20], as shown in Figure 2a. The tilt of the image plane causes two perspective parameters of τx and τy, which are rotation angles about the ox axis and o′y′ axis, respectively, as shown in Figure 2b. A Scheimpflug camera model is useful for a triangulation-based machine vision system [21,22], which introduces two additional transformation matrices on the basis of general camera model and can be expressed as:
where Rτ and Kτ are the rotation matrix and the projection matrix, respectively, calculated by two tilt angle τx and τy as:
Due to manufacturing and assembly errors in the lens, geometrical distortions in the radial and tangential direction exist in actual images to some extent, and all of the camera parameters are described by:
where fx, fy, cx, cy are the intrinsic parameters, k1, k2, k3, p1, p2 are the distortion coefficients, and τx, τy are rotation angles. A camera calibration procedure is required to be conducted to calculate these parameters.
Calibration methods for perspective cameras include conventional methods, active movement methods and self-calibration methods. Conventional methods [23,24] usually employ a standard target with known parameters to produce the correspondence between 3D points and pixel points. The standard target could be 1D, 2D or 3D, among which the most efficient and widely used is 2D targets with several corner features on the plane [23]. However, the calibration accuracy of these methods relies heavily on the manufacturing accuracy of calibration targets and in some cases it may not be suitable to place calibration targets. Active movement methods [25,26] realize camera calibration by controlling the camera for specific movements followed by analyzing the change of captured images. Active movement methods are flexible and do not require any calibration targets but are limited by the movement devices. To address the limitations of conventional methods and active movement methods, self-calibration methods have been developed that do not utilize any calibration board or movement, represented by vanishing points based methods [27] and Kruppa equations based methods [28] using geometry constraints. Self-calibration methods can be conducted in-situ but suffer from low accuracy.
On the basis of Zhang’s method, Louhichi et al. [29] proposed a simple scheme to carry out the calibration of a Scheimpflug camera by hand positioning a roughly known calibration pattern and computing camera parameters using a bundle adjustment technique. Steger et al. [30] proposed comprehensive models that can handle all tilt lens types and an algorithm to calibrate an arbitrary combination of perspective and telecentric cameras. In practice, appropriate camera calibration methods should be used according to the specific application.
2.2. Epipolar Geometry
Three-dimensional geometry of the scene cannot be reconstructed from one single image because one pixel point can only determine an optical ray (except for deep learning-based algorithms, which are not under discussion in this paper). To perform 3D reconstruction, two or more images are required to be captured from different perspectives. These images can be taken by one camera from different perspectives, which generates SFM (generally more than two perspectives), and can also be taken by different cameras, which comes into being stereo vision.
The common principle of SFM and stereo vision is illuminated as epipolar geometry. As demonstrated in Figure 3, 3D point P is captured from two perspectives and p1 and p2 are the imaging points of P; O1 and O2 are the camera centers; O1O2P is the epipolar plane; e1 and e2 are the epipolar points; l1 and l2 are the epipolar lines; R, t are the rotational and translational matrices from first perspective to second. Then p1 and p2 are constrained by:
where , ; E is called essential matrix and is expressed as E = t × R; F is called fundamental matrix and is expressed as , where Kc is the projection matrix of camera. The same point observed from different perspectives, and for each pixel point p1 on the first image coordinate, the corresponding point p2 on the second image locates on the epipolar line l2. In the process of image matching, the constraint of epipolar geometry can reduce the computation space of corresponding points from 2D to 1D linear space, which can substantially decrease the computation cost in multi-view image matching.
To reconstruct the 3D data by SFM based on triangulation, the pose of camera (R and t) should be estimated first. For a given pixel point p1 on the first image, the matching point p2 on the second image can be found by searching and calculating the similarity of sub-images centered at p1 and p2 along l2. Using at least eight pairs of matching points [31], the essential matrix E as well as the fundamental matrix F can be calculated. The rotation matrix R and the translation matrix t can be acquired using the singular value decomposition (SVD) solution of E or F. Then the depth of the matching points can be obtained. Due to the homogeneity of Equation (6), the scale of obtained E, R and t is ambiguous, which causes the scale ambiguity of 3D data. Therefore, a standard or calibrated scale is often used to eliminate the scale ambiguity of obtained 3D data.
In contrast, since the rigid transformation matrix including the rotation R and translation t between the two cameras is known in stereo vision system, the 3D data of a given pair of matching points can be obtained directly based on triangulation. Stereo matching is a key step for stereo vision. To improve the searching speed of stereo correspondence, stereo rectification [32] is conducted to make the stereo images lie in the same plane, and epipolar lines l1 and l2 are horizontally aligned, as demonstrated in Figure 4. The corresponding 3D point P(X, Y, Z) of point pair (pl, pr) can be obtained by:
where B represents the baseline of two cameras, f represents the focal length, (cx, cy) represents the left camera center, d is the disparity and d = xl − xr.
2.3. Laser Triangulation
As demonstrated in Figure 5a, a laser beam generated by a laser projector is projected onto the object. The diffuse reflection light from the surface of the object is captured by the camera with a given angle to the incident direction. Once a laser point is captured on the image plane, the depth of the point can be calculated using laser triangulation:
where b is the baseline from the optical center C to laser beam L, and α is the angle between the laser beam and the baseline. The value of b can be obtained after system calibration. The angle β can be determined using the projected pixel point p and the focal length f by β = arctan (f/p).
Generally, to improve the measurement efficiency, line laser is often used in practical applications to project a laser stripe onto the object. As shown in Figure 5b, all 3D points on the laser line can be obtained by solving the simultaneous equations of the camera imaging model and the mathematic equation of laser plane. The mathematical equation of the laser plane is expressed by:
where a, b, c and d are the equation coefficients, which can be calculated after system calibration. Equations (2) and (9) provide four equations with four unknown parameters (Xw, Yw, Zw, s) for each known pixel point (uc, vc). As discussed in Section 2.1, it is suitable to use a tilt lens in some cases with large magnification to ensure that the laser plane is in focus for the entire measurement range.
The calibration process of a laser scanning system consists of three steps: camera calibration (discussed in Section 2.1), extraction of the laser centerline and laser plane calibration. The frequently used laser centerline extraction methods, represented by gray centroid method, extreme value method and Gaussian fitting method, are easy and efficient to conduct but have relatively low precision. The Steger algorithm [33] uses a Hessian matrix to compute the normal of the laser stripe at each pixel followed by calculating the sub-pixel result using Taylor expansion of the light stripe centerline, which achieves sub-pixel precision but suffers from low processing speed. Laser plane calibration is conducted by computing the 3D data of the laser stripes at different positions within the laser plane followed by fitting a plane through the whole measurements, which can be classified into fixed position methods, controllable relative motion methods and free motion methods [34]. Fixed position methods [35] usually employ a standard target (e.g., ball or step) to calculate the 3D coordinates of laser stripes, and the optical plane can be fitted using the obtained non-collinear 3D points. Controllable relative motion methods need to move or rotate a planar target to different positions, which generates a series of 3D measurements, and the exterior orientation of the laser plane can be fitted using the 3D points. To simplify the operation of laser plane calibration, free motion methods [36,37] using a planar target with free motion in space have been proposed. Based on the camera model and cross ratio invariance, a large number of non collinear points can be extracted by freely moving the planar target to several (more than two) positions. Then the obtained points can be utilized to fit the laser plane equation using a RANSAC algorithm. Although the procedure of laser plane calibration is simplified, it is not applicable for large scenes. A 1D target-based calibration method [37] was proposed to overcome the shortcoming.
2.4. Structured Light System Model
SL systems make use of a digital projector to project encoded patterns onto the object, which can substantially improve the stereo matching results. Similar to laser triangulation, it might be necessary to use the Scheimpflug condition, as discussed in Section 2.1, to tilt the image plane and the projector if high magnification lenses are adopted. As shown in Figure 6, the projector projects encoded patterns onto the object from one perspective while the camera captures these patterns deformed by the object profile from another perspective. By decoding the deformed SL images, accurate and dense 3D data of every illuminated camera pixel can be acquired using the stereo vision principle.
The projector is considered to be the reverse process of camera shooting as it projects images instead of capturing images. Based on the mathematic model of a camera, an SL system is modelled as follows:
where Pcam and Pproj represent the projection matrices of camera and projector, respectively, Tworld_to_cam and Tworld_to_proj represent the rigid transformation from world coordinate system to camera coordinate and projector coordinate system, respectively.
Given that the projector cannot take pictures itself, the conventional calibration process of SL system is complex and difficult to implement. Zhang et al. [38] proposed a scheme to simplify the calibration process. The pixel correspondence between the camera and the projector can be established by projecting a sequence of vertical and horizontal phase shifting patterns. As demonstrated in Figure 7, for a given pixel in the camera image coordinate system, the corresponding pixel in the projector image coordinate system can be determined by locating an intersection point using the horizontal and vertical phase values. Using the correspondence data, SL system calibration can be carried out based on the stereo vision technique.
Most proposed calibration methods work on the premise that the camera lens and the projector lens are nearly focused, which could fail if the camera is substantially defocused. To deal with the defocusing occasions and simplify the calibration process, out-of-focus calibration methods [39,40] have been presented. These methods can produce accurate results but might not be robust enough for complicated scenes.
3. Vision-Based 3D Shape Measurement Techniques
3.1. Stereo Vision Technique
Stereo vision is one of the most widely researched and employed 3D vision measurement methods, which commonly uses a pair of synchronous cameras to capture images from two different perspectives. By identifying and matching the common features on the images, the depth information of the scene can be recovered based on the standard triangulation principle. Barnard and Fischler [41] discussed the working principles and functional modules of binocular vision systems, including image acquisition, camera calibration, feature extraction, stereo matching, depth determination and interpolation, among which stereo matching is the most important and challenging step. The function of stereo matching is to calculate the stereo correspondence between stereo images and generate the disparity results. To optimize and accelerate the stereo matching algorithm, the point search is generally conducted along a 1D horizontal line owing to the epipolar constraint-based stereo rectification, as discussed in Section 2.2.
In the past two decades, the conventional stereo matching approaches have been intensively researched in the field of computer vision. Daniel and Richard [42] provided a taxonomy that divides stereo matching process into four procedures: cost computation, cost aggregation, disparity optimization and disparity refinement, as shown in Figure 8. The function of cost computation is to compute the similarity score of left image pixels and corresponding candidates in the right image and generate an initial disparity result for the left image. Several common functions including sum of absolute difference (SAD) [43], squared intensity differences (SSD) [44], normalized cross-correlation (NCC) [45], CENSUS [46], BRIEF [47], while combined functions (e.g., AD-CENSUS) are often used in this step to calculate the similarity. The matching cost aggregation and disparity optimization steps are carried out to acquire more accurate and robust disparity results utilizing the contextual matching cost information and regularization terms.
The conventional stereo matching algorithms can be classified into local matching algorithms and global matching algorithms [48]. Local matching algorithms often choose the pixel with the lowest matching cost as the corresponding point and produce the disparity results. The disparity result at each pixel depends only on the intensity of the sub-image window. Thus, local methods consider only local information and have high processing speed but low quality. By comparison, global matching algorithms, represented by graph cut [49] and belief propagation [50], can generate more accurate disparity results, which normally replace the cost aggregation with a global energy optimizing framework. The energy optimizing framework includes a data smoothness term, which is used to smooth the disparity result among neighbor pixels, and the disparity map is finally acquired by producing continuous depth values at the neighbor pixels. However, these algorithms are time consuming. The semi-global method [8] computes the matching cost using mutual information at each pixel instead of block matching. One dimensional energy minimization along multiple directions is conducted to approximately replace two-dimensional global energy minimization. This method achieves a good balance between computational complexity and the quality of disparity results. Various stereo matching algorithms [51] have been developed to generate a disparity map with relative high quality, but accuracy and robustness are limited by the occlusion, lack of texture, discontinuity and uneven ambient light. For example, the reported measurement error was 1.3% in Ref. [52]. For objects with rich textures, the measurement accuracy could reach up to 0.12% [53].
3.2. Three-Dimensional Laser Scanning Technique
The 3D laser scanning technique has been widely applied in various applications due to its characteristics of high precision, strong robustness and low cost. In the setup shown in Figure 5b, the object needs to move relative to the laser plane to scan the entire 3D surface, and the real-time relative positions between the laser plane and object are required to be known in the process of laser scanning. Conventional laser scanning techniques are usually based on controllable relative motion by calibrating the rotation and translation devices [54,55]. Encoders are often used to trigger the image acquisition to ensure constant motion of two adjacent frames. To realize full-field 3D reconstruction, a multi-view laser scanning system [54] implementing a translational and rotational platform has been presented. The translational platform provides one-dimensional scanning from a fixed view. The rotational platform is used to rotate the object to obtain 3D data from different perspectives and then the entire surface data can be easily registered after utilizing the parameters of turntable calibration. This realizes the integration of laser scanning and point clouds registration without using any complex registration algorithm or markers-based method but faces challenges when measuring large objects. We developed a laser scanning system using a rotation and a translation platform for 3D reconstruction [15], as shown in Figure 9. A stepped gauge (each step had a height of 2 mm, and a length and width of 20 mm × 5 mm) was used to evaluate the measurement accuracy, The root mean square (RMS) errors in the translation scan and rotation scan were 0.016 and 0.031 mm, respectively. An industrial robot was also used to replace the motion platform to realize multiple axes scanning [56].
These methods mentioned above usually need a high-precision mechanical platform or robot for scanning, but they are not suitable for some application scenarios with the requirement of a higher scanning speed and lower cost. In order to simplify the scanning process, Winkelbach et al. [57] designed a 3D sensing system consisting of a fixed camera and a hand-held laser projector. A known background geometry was employed to calculate the mathematical equation of the laser plane in real-time. The coordinate transformation parameters of the camera and background geometry were acquired beforehand through system calibration. In the whole scanning process, the laser stripe projected onto the background geometry was utilized to extract the central points and determine a mathematical equation of the laser plane using a RANSAC algorithm. Finally, the 3D profile was calculated based on laser triangulation. Due to the limitation of the background calibration board, this method cannot meet the measurement requirements of large-scale objects. Mark-based hand-held laser scanning technique is one of the most widely used commercial solutions for large object measurement so far. Taking advantage of binocular cameras, hand-held laser scanning techniques can realize real-time self-positioning by extracting and tracking the mark points pasted on to the surface of the object, and then large-scale and multi-perspective 3D shape measurement can be performed based on the combination of stereo vision and laser triangulation. The representative commercial products are the CREAFORM HandySCAN series, which achieved a measurement accuracy of 0.025 mm with a scanning area of 310 mm × 350 mm. Although this solution has been well developed, the use of mark points leads to the complexity of the measurement process and the limitation of usage scenarios. Theiler et al. [58] proposed an automatic keypoint-based method to register two point clouds without placing any markers in the scene. A 4-Points Congruent Sets is used to extract 3D keypoints followed by the calculation of the transformation between the two measures using the keypoints. This method is suitable for 3D reconstruction of large scenes but the measurement accuracy is relative low.
As an alternative setup, the orientation of the laser plane can be altered continuously to scan the entire surface of the measuring object. This is done by projecting the laser stripe onto a rotating planar mirror, or so-called galvanometer, as shown in Figure 10, which is generally composed of a swing motor and a mirror. We proposed a system calibration method [59] and an error compensation method [60] for galvanometric laser scanning system, which achieved an average error of 0.05 mm in measuring two standard balls with a center distance of 60 mm. In order to avoid establishing the complex mathematical model and improve the calibration accuracy of the system, a neural network model was established by using the image coordinates of calibration points and the rotation angle of laser plane as input and the corresponding 3D world coordinates as output, and the system calibration was completed by training [61]. Compared with the conventional methods, galvanometric laser scanning methods can perform accurate and fast 3D surface reconstruction without using motion equipment or pasting markers, and has great potential for in-situ measurement.
3.3. Structured Light Technique
SL techniques can realize rapid, low-cost and non-contact 3D surface measurement with relative high accuracy, and hence have been widely applied in practical engineering such as accurate and precise detection in advanced manufacturing, automatic robot recognition, biomedical diagnosis and many other fields [62,63]. The measuring procedures mainly include three steps: projecting coded patterns onto the object surface, capturing the deformed images and decoding the images to reconstruct the 3D information utilizing SL system model [37]. Various methods that differ in SL pattern codification have been reported in the past two decades.
3.3.1. Random Speckle Projection
The statistically random speckle projection (RSP) methods encode random features locally on the projected patterns, as shown in Figure 11. Stereo correspondence can be realized by digital image correlation (DIC) of captured speckle images, which solve the stereo matching problem of the stereo vision system. A diffractive optical element (DOE) is often employed in RSP systems to modulate the laser beam and project statistical random patterns. The RSP technique has realized industrialization and been integrated in intelligent hardware (e.g., Microsoft Kinect, Intel RealSense, HUAWEI P40 Pro).
The RSP techniques include single shot and multiple shot method. The single shot method extracts depth from a pair of deformed speckle images, which is robust to movement but has low spatial resolution and accuracy. Khan et al. [64] presented a single shot laser speckle based stereo vision system for dynamic 3D measurement, which employed the Kanade–Lucas–Tomasi (KLT) tracking technique to calculate the stereo correspondence. This system had a measurement accuracy of 0.392 mm in measuring a sphere of 20 mm in diameter which was better than the measurement accuracy of 0.845 mm achieved by the Kinect device. The single shot-based RSP technique is often employed in some cases with a relatively low requirement of accuracy including motion sensing [65], distance measurement and rough localization. In contrast, the multiple shot RSP technique can generate more accurate 3D data, but motion artifacts and errors will be produced when measuring dynamic scenes. Schaffer et al. [66] proposed a high-speed multi-shot RSP system, in which an acousto-optical deflector was utilized to project speckle patterns and the deformed speckle images were captured by a pair of synchronized cameras. This system achieved high speed 3D sensing of moving objects with low speed. Harendt et al. [67] presented a motion compensation algorithm for a multi-shot RSP system based on spatio-temporal image correlation which adapted the temporal and spatial support locally to the motion of the measured objects.
The RSP technique has the advantages of easy implementation and miniaturization, however, it is difficult to determine the corresponding point in the area with relative high noise. Stark et al. [68] presented a suppression approach to decrease the intensity of subjective speckles by moving the camera orthogonal to the view and recovering the pixel movement. Another problem is the low measurement accuracy and spatial resolution, because the speckle size is larger than a pixel. In addition, the speckle size varies with the measurement distance, which limits the efficient working range of RSP system. Khan et al. [69] proposed a self-adapting RSP system to optimize the size of speckle according to the measuring distance and comparatively dense 3D data was produced. To suppress the noise generated by subjective speckle, histogram equalization and local Laplacian-based image filtering were utilized to improve the feature contrast and preserve the edge information.
3.3.2. Binary Coding Projection
To facilitate the realization of pixel-by-pixel correspondence, binary coding methods which encode each pixel over time were proposed [70]. Typical binary coding methods include simple binary-coded and gray-coded methods, as demonstrated in Figure 12. Three patterns consist of 8-pixel stripes, which generate a series of codewords for each stripe of pixels considering black as 0 and white as 1. By projecting these patterns sequentially, the captured images can be binarized to decode the binary codewords pixel-by-pixel. Dense 3D data can then be obtained by calculating the stereo correspondence using the pixel-wise codewords. Although these two methods generate similar patterns, it is traditionally considered that the gray-coded method is more robust than the simple-coded method and is more widely used in practice. Since the gray-coded method changes only one bit of the codewords between adjacent pixels, it can reduce the probability of generating errors, while the simple-coded method does not have this constraint.
The extraction and localization of stripe boundaries are key problems of binary coding projection-based 3D measurement techniques. Trobina et al. [71] proposed an error model based on the gray-coded method and analyzed various factors affecting the accuracy of this method in detail. The research showed that both the linear interpolation technique and the zero-crossing technique can reach sub-pixel level in stripe-edge detection and the former performs better. Song et al. [72] used an improved zero-crossing feature detector to enhance the precision of edge extraction.
Although binary coding methods are quite simple and robust, the achievable spatial resolution is restricted by the pixel size of the camera and projector. On the one hand, the narrowest stripes of the patterns must be wider than one projector pixel to avoid sampling problems. On the other hand, the width of each captured stripe is preferably greater than a camera pixel to ensure that the binary status is correctly found from the captured images. Therefore, the decoded codewords are discrete rather than continuous hence no better correspondence can be established accurately, which greatly limits the use of binary coding methods, especially in cases with requirements of high resolution and accuracy. In recent years, many gray-coding-assisted SL methods have been developed to improve the measurement resolution and accuracy [73,74,75,76]. The proposed method in Ref. [76] achieved a measurement accuracy of 0.098 mm in measuring a standard sphere with 12.6994 mm radius.
3.3.3. Fringe Projection
The aforementioned RSP methods and binary coding methods overcome the image correspondence problem of stereo vision, but the matching accuracy is relatively low due to the limitation of the spatial resolution of the projector. Fringe projection profilometry (FPP) [77] realizes 3D shape reconstruction by projecting a series of sinusoidal phase encoding patterns onto the objects followed by capturing the deformed fringe images and decoding the phase information, and 3D surface data can be calculated using the SL system model eventually. The FPP techniques mainly include Fourier transform profilometry (FTP) [78] and phase-shifting profilometry (PSP) [79].
FTP produces wrapped phase map from only one fringe image and is suitable for dynamic measurement, for instance, Ref. [80] reported a micro-FTP which can realize an acquisition rate up to 10,000 3D frames per second. Takeda et al. [81] proposed a standard FTP, in which a sinusoidal intensity encoding pattern is projected onto the object and the deformed image is captured from another perspective followed by calculating the Fourier transformation of the image line by line. The fundamental frequency can be separated by filtering the frequency spectrum and is transformed to the spatial domain by inverse Fourier transformation. The wrapped phase value distributing in [−π, π] can then be acquired. To acquire a full-filed continuous phase distribution, phase unwrapping procedure is carried out to eliminate the 2π gaps, and then the actual depth that relates to the absolute phase at each pixel point can be obtained. Ref. [82] realized FTP of a single-field fringe for dynamic objects using an interlaced scanning camera. This method not only kept the measurement accuracy, which was about 0.2 mm, in measuring a known plane with the height of 35 mm, but also doubled the time resolution of the measurement system. To overcome the problem of frequency overlapping caused by shadows, non-uniformities and contours, modified FTP [83], windowed FTP [84], wavelet transform profilometry [85] and Hilbert transform [86] were proposed. The frequency spectrum can be separated more precisely with these methods, but the problem of low quality in details of the complex surfaces still exists. Wang et al. [87] combined the two-step phase-shifting algorithm, Fourier transform profilometry and the optimum three-frequency selection method to achieve high-speed 3D shape measurement of complex surfaces without loss of accuracy.
Compared with FTP, PSP can perform more accurate 3D shape measurement and is more robust to the noise produced by environmental illumination. For instance, the measurement accuracy of a high-end commercially available 3D scanner (e.g., GOM ATOS Core) can reach up to 2.5 μm. PSP generally projects a group of sinusoidal intensity encoding patterns onto the objects, and the wrapped phase value at each pixel can be obtained using the N-step phase-shifting techniques [79]. Generally, the step number N should be equal or greater than three. The more phase-shifting patterns are projected, the higher phase accuracy can be obtained. PSP also generates a wrapped phase map distributing in [−π, π] and requires a phase unwrapping algorithm [88] to eliminate the 2π phase intervals. The phase unwrapping approaches include spatial [89,90] and temporal phase unwrapping algorithms [91]. The spatial phase unwrapping algorithms eliminate phase discontinuities by checking the phase values of surrounding pixels, which produce a phase map with phase ambiguities but could fail in the measurement of isolated or abrupt surfaces. The temporal phase unwrapping algorithms represented by the multi-frequency [92] and Gray-code [93] algorithms can obtain the absolute phase distribution of complex scenes without phase ambiguity. However, the measurement speed is limited by the increase of patterns, and phase distortion will occur when measuring dynamic scenes.
With the advent of digital light processing (DLP) projector and high-speed imaging techniques, various PSP-based methods have been presented for high-speed 3D surface measurement [16,94]. Nguyen et al. [95] developed a real-time 3D profile reconstruction system, which can work at a frequency of 120 Hz by synchronizing a DLP projector and a high-speed camera with an external trigger signal. This system makes use of three gray-scale three-step phase-shifting patterns integrated into one color image, but still suffers from phase ambiguities due to single-frequency PSP. Cong et al. [96] developed an FTP-assisted PSP (FAPS) method to perform 3D measurements for locomotor objects, while isolated surfaces without markers is a challenging problem. Pixel-wise phase unwrapping methods [97,98] using geometric constraints have also been developed, which do not require any additional images, markers or cameras, but the phase unwrapping quality may relate to the virtual plane.
Gai et al. [99] developed an SL system based on the combining projection of single digital speckle pattern and four-step phase-shifting patterns. The initial matching information was calculated by speckle pattern and then refined by the wrapped phase data, while errors that existed in the initial matching information decreased the measurement accuracy for complex surfaces. We proposed a DIC assisted PSP method [100] and developed a stereo SL system for accurate and dynamic 3D shape measurements based on the combined projection of three-step phase-shifting patterns and one speckle pattern. To improve the measurement accuracy, a stereo SL model [101] was proposed to make adequate use of triple-view information to calculate 3D coordinates using the disparity map and absolute phase map, as shown in Figure 13. The proposed method achieved a measurement accuracy of 0.02 mm within a 200 × 180 mm2 field of view, and the comparative experimental results show that the measurement error was reduced by 33% compared with the conventional multi-frequency PSP methods.
A variant phase-shifting method [102] has been proposed to compute the absolute phase results by assigning the index number of the fringe to the phase shift value. This method only projects four fringe patterns and achieves 3D measurement at a high speed, while the precision of phase unwrapping may be affected by the quality of pixels, especially in noisy condition. Except for reducing the patterns, a digital binary defocusing technique [103,104] has been proposed to defocus the projector lens and project binary patterns to realize the projection of phase-shifting patterns. DLP projector can achieve a frequency of 125 Hz for 8-bit gray-scale image and 4225 Hz for 1-bit binary image. Thus, the measuring speed is substantially improved. However, the limitation of the binary defocusing method is that the lens of the projector needs to be adjusted accurately within a small out-of-focus range to achieve the performance of PSP.
The methods mentioned above have greatly improved the real-time capability of PSP, but the motion error still exists no matter how fast the speed at which the PSP techniques can achieve. Weise et al. [105] presented a motion compensation method to optimize the phase offset produced by the motion to a small degree using a linear least-square optimization scheme with a Taylor approximation. It assumes that the motion is small and homogeneous at each pixel but may not work for the scenes with nonhomogeneous motion. Feng et al. [106] presented a motion compensation to reduce the motion error of dynamic PSP using fringe statistics. Iterative methods [107,108] have also been researched to optimize the nonhomogeneous motion-induced phase error. They have substantially reduced the motion error of PSP measurement for fast moving or deforming surfaces, but the high computation cost limits their applications for real-time measurement. Liu et al. [109] developed a nonhomogeneous motion error compensation approach to calculate the phase offsets by computing the differences among multiple adjacent phase maps. Guo et al. [110] presented a real-time 3D surface measurement system, which utilized the phase value of dual-frequency composite fringe to extract the motion area of scene followed by reducing the motion error using the phase value calculated by PSP and FTP. This system can perform 3D reconstruction for locomotor and static objects but suffers from low quality in details of the object surface.
3.4. Deep Learning-Based Techniques
Stereo matching algorithms [111] have become a deep learning task resorting to the development of CNN, which can be classified into non-end-to-end and end-to-end learning approaches. Non-end-to-end learning networks, represented by MC-CNN [112] and SGM-Net [113], commonly replace the local descriptors of conventional methods with CNN in the step of cost computation in stereo matching pipeline followed by several postprocessing steps including cross-based cost aggregation, consistency check and sub-pixel enhancement, as shown in Figure 14. However, these non-end-to-end learning algorithms suffer from high computational cost.
The end-to-end learning methods realize stereo matching through an end-to-end network and predict dense disparity results directly from input images. DispNet [114] realized an end-to-end learning-based stereo matching scheme. One-dimensional correlation is conducted along the epipolar line to compute matching cost, and an encoder-decoder structure is employed for disparity regression. iResNet [115] was shown to integrate the stereo matching process, which predicts an initial disparity using an encoder–decoder structure and employs a subnetwork to optimize the initial disparity using residual signals. GC-Net [116] adequately used the geometric characteristics and context constraints of the image, and realized an end-to-end learning network for stereo matching, which constructs a 4D cost volume and directly generates a disparity map through 3D convolution without requiring any postprocessing procedure, as shown in Figure 15. GC-Net retains the complete features and greatly promotes the stereo matching performance.
PSMNet [117] has further improved the stereo matching accuracy, which consists of a pyramid pooling module and a 3D convolution module. Pyramid pooling module makes full use of global information by gathering image features at different scales and builds matching cost volume. The 3D CNN module adjusts the matching cost volume by combining multiple stacked hourglass networks with intermediate supervision. PSMNet has achieved the best performance in the KITTI dataset. To reduce the computation cost, GA-Net [118] replaces 3D convolutions with two cost aggregation layers including a semi-global guided aggregation (SGA) and a local guided aggregation (LGA) network, as shown in Figure 16, which speeds up the algorithm while maintaining accuracy.
For RSP 3D measurement, Fanello et al. [119] considered the stereo matching process of an RSP technique as a learning-based regression instead of digital image correlation. An ensemble of random forests was used to realize the independent computation of each pixel while retaining accuracy. However, this method requires tedious calibration and expensive data collection procedures. Fanello et al. [120] further proposed an unsupervised greedy optimization scheme, which was trained to estimate and identify corresponding features in infrared images. This method optimizes a series of sparse hyperplanes and reduces the complexity of matching cost computation to O(1) but faces difficulties in textureless scenes due to the limitation of the shallow descriptor and local optimization framework. ActiveStereoNet (ASN) [121], as shown in Figure 17, realized an end-to-end and unsupervised deep neural networks (DNN) scheme for an RSP 3D measurement. A novel loss function was utilized in ASN to deal with the challenges of active stereo matching (e.g., illumination, high-frequency noise, occlusion). This method substantially improved the performance of the active stereo 3D shape measurement technique but may suffer from low spatial resolution. SLNet [122] was developed to improve the stereo matching results of the RSP 3D measurement technique. SLNet utilized a Siamese DNN to extract features, pyramid pooling layers to concatenate features of stereo images and SENet to compute the parameters of DNN. To train the DNN, a dataset was created using a conventional RSP technique.
Deep learning-based stereo matching algorithms have made great progress in producing disparity maps, but there are still difficulties in dealing with textureless regions, occlusion areas, repeated patterns, and reflective surfaces. The measurement accuracy is not high enough for industrial applications because the prediction results cannot completely converge to the ground truth value. Furthermore, the DNN model is trained by dataset, which could have difficulties when measuring different scenes beyond the dataset. In the future, more efficient algorithms will be further researched to improve the stereo matching performance using more constraint information. The RSP technique is similar to the stereo vision technique except that the image features in the RSP technique are relatively regular in different scenes. Most general deep learning-based stereo matching networks cannot provide enough strength to extract these image features with high resolution and accuracy. Therefore, feature extraction network should be further improved to be adapted to the characteristic of speckle image when transplanting the stereo matching networks to RSP techniques.
Recently, deep learning algorithms have also been applied to phase extraction [123], phase unwrapping [124,125] and fringe image denoising [126] to improve the performance of FPP. Feng et al. [124] trained two different CNNs to obtain unwrapped phase maps from one single fringe image, as shown in Figure 18. The CNNs-1 was constructed to estimate the background intensity and the CNNs-2 was trained to estimate the parameters of the arctangent function in PSP using the original fringe image and estimated background intensity. Spoorthi et al. [124] developed a DNN framework with an encoder–decoder structure for spatial phase unwrapping, which ran faster and more accurately than conventional quality-guided methods. Yin et al. [125] proposed a DNN-based algorithm for temporal phase unwrapping, which predicted an unwrapped phase map with high reliability using dual-frequency wrapped phase maps calculated by three-step PSP. Van der Jeught et al. [127] trained a fully convolutional DNN using amounts of simulated deformed fringe images to realize the depth extraction from only one fringe image. Machineni et al. [128] realized an end-to-end deep learning-based scheme for FPP systems. This used CNN to predict the multi-scale similarity and the depth was estimated from single deformed fringe images without phase unwrapping. Yu et al. [129] designed an FPTNet to realize the transformation from single fringe image to multi-frequency fringe images based on DNN, and the 3D reconstruction was performed by calculating the absolute phase map. These deep learning-based approaches achieved compelling performance in the man-made or simulated datasets, but the performance for practical objects remains to be further researched.
4. Discussion
4.1. Comparison and Analysis
Considering the measurement requirements and the different applications, Table 1 compares the performances, the hardware configurations, the anti-interference capabilities, the resolutions, the measurement accuracies and the applicable occasions of all the discussed methods. Each method has its own merits and limitations, and one should choose the appropriate method or the optimal combination of several methods according to the measured object and parameters for a given task.
4.2. Uncertainty of Vision-Based Measurement
In a vision-based 3D shape measurement system, there are several parameters that determine its performance such as measurement area, resolution and sensitivity. These parameters are fixed after system calibration, including the position and orientation of cameras, the lenses and pixel sizes, the working distance and FOV. However, internal and external factors such as system installation errors, vibration, optical errors, saturation by high reflection, and image noises, system calibration, and image rectification algorithms may influence the measurement results [130,131]. Although plenty of research [132,133,134] on parameter analysis and system optimization in vision-based measurements have been reported, there has been little effective progress in the quantitative analysis of uncertainties.
ISO 15530 [135] and ISO 25178 [136] specify the evaluation of measurement uncertainty for results of measurements obtained by traditional contact coordinate measurement methods and some other optical measurement methods (optical probe method, coherent scanning interferometry, phase-shifting interferometry). These are based mainly on the guide to the expression of uncertainty in measurement (GUM) [137,138,139] or with the Monte Carlo method (MCM) [140,141,142] to build a calibration system. When it comes to the characterization of vision-based measurement processes, some external parameters that may influence the image acquisition should be taken into consideration. As an example, some factors such as lighting conditions, that affect the active vision-based measurement systems but do not belong to the main variables in traditional contact coordinate measurement systems, are not mentioned in these standards [143,144,145].
Usually, a gauge whose dimensions are accurately known is used to evaluate the absolute accuracy in a vision-based measurement system. However, as the sources of error are varied, from instrumental biases to residual deviations of point cloud registration, the lack of comprehensive quantitative analysis of interference factors, complete theoretical basis and available calibration methods results in the inability to quantify the uncertainty, which restricts the development of vision-based measurement technology in the field with the requirement of high-accuracy and reliable metrology. According to the GUM, the uncertainty of the measurement results depends on the characteristics of the system hardware (e.g., the camera and projection device), on the measured object and its background, on some external parameters that may influence the image acquisition, on the image processing algorithms adopted and on the measurement extraction procedures executed. Therefore, it is imperative that the following main sources of uncertainties in vision-based measurement system should be highlighted:
- (1)
- Image acquisition: a camera system is composed of lens, hardware and software components, all of which affect the final image taken with the camera if it is not predefined. The camera pose also affects the position and shape of the measured object in the image. Thus, the camera system should be accurately calibrated, and the systematic effects should be considered and compensated. The random effects should also be taken into account, related to fluctuations of the camera position because of imperfections of the bearing structure, environmental vibrations, etc.
- (2)
- Lighting conditions: the lighting of the scene directly determines the pixel values of the image, which may have an adverse impact on image processing and measurement results if the lighting condition varies. Lighting conditions can be considered either as systematic effects (the background that does not change during the measurement process) and random effects (fluctuations of the lighting conditions), and both have to be taken into consideration when evaluating uncertainty.
- (3)
- Image processing and 3D mapping algorithms: uncertainties introduced in the image processing and measurement extraction algorithms must also be taken into consideration. For instance, noise reduction algorithms are not 100% efficient and there is still some noise in the output image. This contribution to uncertainty should be evaluated and combined with all the other contributions to define the uncertainty associated with the final measurement results.
4.3. Challenges and Prospects
Although vision-based 3D shape measurement methods have been well researched, few of them could perform 3D measurement with high accuracy and precision in real-time applications, which is required to output at least 10 depth frames per second. Stereo vision and RSP systems can achieve very high-speed 3D sensing, which are practical for robotic vision but not suitable for industrial measurement with high accuracy. Galvanometric laser scanning systems can perform fast 3D measurement with high resolution and accuracy but require movement to scan the whole surface of the objects assuming that the object remains at rest during scanning. The frame rate of SL systems is limited by the speed of pattern projection device. Several proposed SL methods are capable of producing depth map at a frame rate of 60 fps, but still limited in many scenes with fast movement (e.g., running blade). Binary defocusing technique can achieve 300 fps taking advantage of the DLP technique but suffers from low robustness. Therefore, the projection hardware technologies [146] need to be improved to increase the measurement speed of SL methods while retaining the measurement accuracy. Besides, fringe projection approaches based on two-beam optical interference [147,148,149] have been proposed for high speed and high precision 3D shape measurement. These methods realize fringe projection based on the principle of Mach–Zehnder interferometer and Young’s double pinhole interference. However, the optical structure and interference signal could be easily affected by environmental vibration, which limits the application of these methods. Recently, we have been dedicating to realizing a novel scheme for fringe projection by using integrated optical waveguide device. This method is hoped to perform 3D shape measurement practically with high speed and high accuracy on the premise of overcoming the challenge of optical transmission loss and may also be beneficial for sensor miniaturization.
In addition, vision-based 3D shape measurement methods face difficulties for surfaces with specular reflection, transparency and high dynamic range. Though researchers have presented various strategies [150,151,152,153,154,155], they are not robust enough for arbitrary scenes, and their consistency and repeatability are often difficult to guarantee. Recently, great advancements in AI technology have facilitated the development of vision-based 3D shape measurement techniques and great progress has been made in image processing using deep learning-based networks instead of conventional methods [156]. In the future, the generalizability of deep learning algorithms will be further studied to improve the performance of vision-based 3D shape measurement techniques in practical applications.
5. Conclusions
In this paper we gave an overview of vision-based 3D shape measurement methods, their generic principles, and representative techniques such as stereo vision, 3D laser scanning and structured light projection that are widely employed in industrial applications. The typical vision-based measurement systems and recent research were discussed in detail, considering both advantages and limitations in practice. The characterization of the uncertainty in vision-based 3D measurement systems was discussed in metrological perspective, and the challenges and prospects towards further improvement were proposed. As one of the future trends in vision-based measurement, continuous progress in AI is expected to rocket the development of camera calibration and image processing. More applications are also expected in intelligent manufacturing, i.e., for on-machine and in-process measurement. To achieve these goals, comprehensive work on both hardware, such as the projectors and cameras, and software, such as image processing algorithms for 3D measurement, embedded tracing calibration methods and adaptive error compensation, is essential.
Author Contributions
Conceptualization, G.Z. and S.Y.; methodology, G.Z.; investigation, G.Z., P.H. and H.D.; writing—original draft preparation, G.Z., P.H. and H.D.; writing—review and editing, S.Y. and G.Z.; supervision, S.Y.; funding acquisition, S.Y. and G.Z. All authors have read and agreed to the published version of the manuscript.
Funding
This research was funded by the Program for Science and Technology Innovation Group of Shaanxi Province, grant number 2019TD-011; the Key Research and Development Program of Shaanxi Province, grant number 2020ZDLGY04-02 and 2021GXLH-Z-029; the Fundamental Research Funds for the Central Universities.
Acknowledgments
We would like to thank the Program for Science and Technology Innovation Group of Shaanxi Province (2019TD-011), the Key Research and Development Program of Shaanxi Province (2020ZDLGY04-02, 2021GXLH-Z-029), and the Fundamental Research Funds for the Central Universities for their support.
Conflicts of Interest
The authors declare no conflict of interest.
References
- Marr, D.; Nishihara, H.K. Representation and recognition of the spatial organization of three-dimensional shapes. Proc. R. Soc. London Ser. B. Biol. Sci. 1978, 200, 269–294. [Google Scholar]
- Marr, D. Vision: A Computational Investigation into the Human Representation and Processing of Visual Information; MIT Press: Cambridge, MA, USA, 2010. [Google Scholar]
- Brown, G.M.; Chen, F.; Song, M. Overview of three-dimensional shape measurement using optical methods. Opt. Eng. 2000, 39, 10–22. [Google Scholar] [CrossRef]
- Khan, F.; Salahuddin, S.; Javidnia, H. Deep Learning-Based Monocular Depth Estimation Methods—A State-of-the-Art Review. Sensors 2020, 20, 2272. [Google Scholar] [CrossRef] [Green Version]
- Yao, Y.; Luo, Z.; Li, S.; Fang, T.; Quan, L. MVSNet: Depth Inference for Unstructured Multi-View Stereo; Springer: Munich, Germany, 2018; pp. 785–801. [Google Scholar] [CrossRef] [Green Version]
- Cadena, C.; Carlone, L.; Carrillo, H.; Latif, Y.; Scaramuzza, D.; Neira, J.; Reid, I.; Leonard, J.J. Past, Present, and Future of Simultaneous Localization and Mapping: Toward the Robust-Perception Age. IEEE Trans. Robot. 2016, 32, 1309–1332. [Google Scholar] [CrossRef] [Green Version]
- Yang, L.; Liu, Y.; Peng, J. Advances techniques of the structured light sensing in intelligent welding robots: A review. Int. J. Adv. Manuf. Technol. 2020, 110, 1027–1046. [Google Scholar] [CrossRef]
- Hirschmuller, H. Stereo Processing by Semiglobal Matching and Mutual Information. IEEE Trans. Pattern Anal. Mach. Intell. 2007, 30, 328–341. [Google Scholar] [CrossRef] [PubMed]
- Seitz, S.M.; Curless, B.; Diebel, J.; Scharstein, D.; Szeliski, R. A comparison and evaluation of multi-view stereo reconstruction algorithms. In Proceedings of the 2006 IEEE Computer Society Conference on Computer Vision and Pattern Recognition (CVPR’06), New York, NY, USA, 17–22 June 2006; Volume 1, pp. 519–528. [Google Scholar]
- Nayar, S.K.; Nakagawa, Y. Shape from focus. IEEE Trans. Pattern Anal. Mach. Intell. 1994, 16, 824–883. [Google Scholar] [CrossRef] [Green Version]
- Westoby, M.J.; Brasington, J.; Glasser, N.F.; Hambrey, M.J.; Reynolds, J.M. ‘Structure-from-Motion’ photogrammetry: A low-cost, effective tool for geoscience applications. Geomorphology 2012, 179, 300–314. [Google Scholar] [CrossRef] [Green Version]
- Zhu, S.; Yang, S.; Hu, P.; Qu, X. A Robust Optical Flow Tracking Method Based On Prediction Model for Visual-Inertial Odometry. IEEE Robot. Autom. Lett. 2021, 6, 5581–5588. [Google Scholar] [CrossRef]
- Han, X.F.; Laga, H.; Bennamoun, M. Image-based 3D object reconstruction: State-of-the-art and trends in the deep learning era. IEEE Trans. Pattern Anal. Mach. Intell. 2019, 43, 1578–1604. [Google Scholar] [CrossRef] [Green Version]
- Foix, S.; Alenya, G.; Torras, C. Lock-in Time-of-Flight (ToF) Cameras: A Survey. IEEE Sens. J. 2011, 11, 1917–1926. [Google Scholar] [CrossRef] [Green Version]
- Yang, S.; Shi, X.; Zhang, G.; Lv, C. A Dual-Platform Laser Scanner for 3D Reconstruction of Dental Pieces. Engineering 2018, 4, 796–805. [Google Scholar] [CrossRef]
- Zhang, S. High-speed 3D shape measurement with structured light methods: A review. Opt. Lasers Eng. 2018, 106, 119–131. [Google Scholar] [CrossRef]
- Huang, L.; Idir, M.; Zuo, C.; Asundi, A. Review of phase measuring deflectometry. Opt. Lasers Eng. 2018, 107, 247–257. [Google Scholar] [CrossRef]
- Arnison, M.R.; Larkin, K.G.; Sheppard, C.J.; Smith, N.I.; Cogswell, C.J. Linear phase imaging using differential interference contrast microscopy. J. Microsc. 2004, 214, 7–12. [Google Scholar] [CrossRef]
- Li, D.; Tian, J. An accurate calibration method for a camera with telecentric lenses. Opt. Lasers Eng. 2013, 51, 538–541. [Google Scholar] [CrossRef]
- Sun, C.; Liu, H.; Jia, M.; Chen, S. Review of Calibration Methods for Scheimpflug Camera. J. Sens. 2018, 2018, 3901431. [Google Scholar] [CrossRef] [Green Version]
- Blais, F. Review of 20 years of range sensor development. J. Electron. Imaging 2004, 13, 231–243. [Google Scholar] [CrossRef]
- Wang, M.; Yin, Y.; Deng, D.; Meng, X.; Liu, X.; Peng, X. Improved performance of multi-view fringe projection 3D microscopy. Opt. Express 2017, 25, 19408–19421. [Google Scholar] [CrossRef] [PubMed]
- Zhang, Z. Flexible Camera Calibration by Viewing a Plane from Unknown Orientations. In Proceedings of the 7th IEEE International Conference on Computer Vision (ICCV’99), Kerkyra, Greece, 20–27 September 1999; pp. 666–673. [Google Scholar]
- Tsai, R. A versatile camera calibration technique for high-accuracy 3D machine vision metrology using off-the-shelf TV cameras and lenses. IEEE J. Robot Autom. 1987, 3, 323–344. [Google Scholar] [CrossRef] [Green Version]
- Hartley, R.I. Self-calibration from multiple views with a rotating camera. In Proceedings of the 1994 European Conference on Computer Vision, Stockholm, Sweden, 2–6 May 1994; Springer: Stockholm, Sweden, 2018; pp. 471–478. [Google Scholar]
- Maybank, S.J.; Faugeras, O.D. A theory of self-calibration of a moving camera. Int. J. Comput. Vis. 1992, 8, 123–151. [Google Scholar] [CrossRef]
- Caprile, B.; Torre, V. Using vanishing points for camera calibration. Int. J. Comput. Vis. 1990, 4, 127–139. [Google Scholar] [CrossRef]
- Habed, A.; Boufama, B. Camera self-calibration from bivariate polynomials derived from Kruppa’s equations. Pattern Recognit. 2008, 41, 2484–2492. [Google Scholar] [CrossRef]
- Louhichi, H.; Fournel, T.; Lavest, J.M.; Ben Aissia, H. Self-calibration of Scheimpflug cameras: An easy protocol. Meas. Sci. Technol. 2007, 18, 2616–2622. [Google Scholar] [CrossRef]
- Steger, C. A Comprehensive and Versatile Camera Model for Cameras with Tilt Lenses. Int. J. Comput. Vis. 2016, 123, 121–159. [Google Scholar] [CrossRef] [Green Version]
- Hartley, R.I. In defense of the eight-point algorithm. IEEE Trans. Pattern Anal. Mach. Intell. 1997, 19, 580–593. [Google Scholar] [CrossRef] [Green Version]
- Fusiello, A.; Trucco, E.; Verri, A. A compact algorithm for rectification of stereo pairs. Mach. Vis. Appl. 2000, 12, 16–22. [Google Scholar] [CrossRef]
- Steger, C. An unbiased detector of curvilinear structures. IEEE Trans. Pattern Anal. Mach. Intell. 1998, 20, 113–125. [Google Scholar] [CrossRef] [Green Version]
- Zhang, X.; Zhang, J. Summary on Calibration Method of Line-Structured Light. Laser Optoelectron. Prog. 2018, 55, 020001. [Google Scholar] [CrossRef]
- Liu, Z.; Li, X.; Li, F.; Zhang, G. Calibration method for line-structured light vision sensor based on a single ball target. Opt. Lasers Eng. 2015, 69, 20–28. [Google Scholar] [CrossRef]
- Zhou, F.; Zhang, G. Complete calibration of a structured light stripe vision sensor through planar target of unknown orientations. Image Vis. Comput. 2005, 23, 59–67. [Google Scholar] [CrossRef]
- Wei, Z.; Cao, L.; Zhang, G. A novel 1D target-based calibration method with unknown orientation for structured light vision sensor. Opt. Laser Technol. 2010, 42, 570–574. [Google Scholar] [CrossRef]
- Zhang, S.; Huang, P.S. Novel method for structured light system calibration. Opt. Eng. 2006, 45, 083601. [Google Scholar]
- Li, B.; Karpinsky, N.; Zhang, S. Novel calibration method for structured-light system with an out-of-focus projector. Appl. Opt. 2014, 53, 3415–3426. [Google Scholar] [CrossRef] [PubMed]
- Bell, T.; Xu, J.; Zhang, S. Method for out-of-focus camera calibration. Appl. Opt. 2016, 55, 2346. [Google Scholar] [CrossRef]
- Barnard, S.T.; Fischler, M.A. Computational Stereo. ACM Comput. Surv. 1982, 14, 553–572. [Google Scholar] [CrossRef]
- Scharstein, D.; Szeliski, R. A taxonomy and evaluation of dense two-frame stereo correspondence algorithms. Int. J. Comput. Vis. 2002, 47, 7–42. [Google Scholar] [CrossRef]
- Gupta, R.K.; Cho, S.-Y. Window-based approach for faststereo correspondence. IET Comput. Vis. 2013, 7, 123–134. [Google Scholar] [CrossRef] [Green Version]
- Yang, R.G.; Pollefeys, M. Multi-resolution real-time stereo on commodity graphics hardware. In Proceedings of the IEEE Computer Society Conference on Computer Vision and Pattern Recognition, Madison, WI, USA, 18–20 June 2003; pp. 211–217. [Google Scholar]
- Hirschmuller, H.; Scharstein, D. Evaluation of cost functions for stereo matching. In Proceedings of the 2007 IEEE Conference on Computer Vision and Pattern Recognition, Minneapolis, MN, USA, 17–22 June 2007. [Google Scholar]
- Zabih, R.; Woodfill, J. Non-parametric local transforms for computing visual correspondence. In Proceedings of the 1994 European Conference on Computer Vision, Stockholm, Sweden, 2–6 May 1994; pp. 151–158. [Google Scholar]
- Calonder, M.; Lepetit, V.; Strecha, C.; Fua, P. BRIEF: Binary robust independent elementary features. In Proceedings of the 11th European Conference on Computer Vision, Heraklion, Greece, 5–11 September 2010; pp. 778–792. [Google Scholar]
- Fuhr, G.; Fickel, G.P.; Dal’Aqua, L.P.; Jung, C.R.; Malzbender, T.; Samadani, R. An evaluation of stereo matching methods for view interpolation. In Proceedings of the 2013 IEEE International Conference on Image Processing, Melbourne, Australia, 15–18 September 2013; pp. 403–407. [Google Scholar] [CrossRef]
- Hong, L.; Chen, G. Segment-based stereo matching using graph cuts. In Proceedings of the 2004 IEEE Computer Society Conference on Computer Vision and Pattern Recognition, Washington, DC, USA, 27 June–2 July 2004; pp. 74–81. [Google Scholar]
- Yang, Q.X.; Wang, L.; Yang, R.G.; Stewenius, H.; Nister, D. Stereo Matching with Color-Weighted Correlation, Hierarchical Belief Propagation, and Occlusion Handling. IEEE Trans. Pattern Anal. Mach. Intell. 2009, 31, 492–504. [Google Scholar] [CrossRef]
- Hamzah, R.A.; Ibrahim, H. Literature survey on stereo vision disparity map algorithms. J. Sens. 2016, 2016, 8742920. [Google Scholar] [CrossRef] [Green Version]
- Quan, Y.; Li, S.; Mai, Q. On-machine 3D measurement of workpiece dimensions based on binocular vision. Opt. Precis. Eng. 2013, 21, 1054–1061. [Google Scholar] [CrossRef]
- Wei, Z.; Gu, Y.; Huang, Z.; Wu, J. Research on Calibration of Three Dimensional Coordinate Reconstruction of Feature Points in Binocular Stereo Vision. Acta Metrol. Sin. 2014, 35, 102–107. [Google Scholar]
- Song, L.; Sun, S.; Yang, Y.; Zhu, X.; Guo, Q.; Yang, H. A Multi-View Stereo Measurement System Based on a Laser Scanner for Fine Workpieces. Sensors 2019, 19, 381. [Google Scholar] [CrossRef] [PubMed] [Green Version]
- Wu, B.; Xue, T.; Zhang, T.; Ye, S. A novel method for round steel measurement with a multi-line structured light vision sensor. Meas. Sci. Technol. 2010, 21, 025204. [Google Scholar] [CrossRef]
- Li, J.; Chen, M.; Jin, X.; Chen, Y.; Dai, Z.; Ou, Z.; Tang, Q. Calibration of a multiple axes 3-D laser scanning system consisting of robot, portable laser scanner and turntable. Optik 2011, 122, 324–329. [Google Scholar] [CrossRef]
- Winkelbach, S.; Molkenstruck, S.; Wahl, F.M. Low-Cost Laser Range Scanner and Fast Surface Registration Approach. In Proceedings of the 2006 Annual Symposium of the German-Association-for-Pattern-Recognition, Berlin, Germany, 12–14 September 2006; pp. 718–728. [Google Scholar]
- Theiler, P.W.; Wegner, J.D.; Schindler, K. Keypoint-based 4-Points Congruent Sets—Automated marker-less registration of laser scans. J. Photogramm. Remote Sens. 2014, 96, 149–163. [Google Scholar] [CrossRef]
- Yang, S.; Yang, L.; Zhang, G.; Wang, T.; Yang, X. Modeling and Calibration of the Galvanometric Laser Scanning Three-Dimensional Measurement System. Nanomanufacturing Metrol. 2018, 1, 180–192. [Google Scholar] [CrossRef]
- Wang, T.; Yang, S.; Li, S.; Yuan, Y.; Hu, P.; Liu, T.; Jia, S. Error Analysis and Compensation of Galvanometer Laser Scanning Measurement System. Acta Opt. Sin. 2020, 40, 2315001. [Google Scholar]
- Yang, L.; Yang, S. Calibration of Galvanometric Line-structured Light Based on Neural Network. Tool Eng. 2019, 53, 97–102. [Google Scholar]
- Kong, L.B.; Peng, X.; Chen, Y.; Wang, P.; Xu, M. Multi-sensor measurement and data fusion technology for manufacturing process monitoring: A literature review. Int. J. Extrem. Manuf. 2020, 2, 022001. [Google Scholar] [CrossRef]
- Zhang, Z.Y.; Yan, J.W.; Kuriyagawa, T. Manufacturing technologies toward extreme precision. Int. J. Extrem. Manuf. 2019, 1, 022001. [Google Scholar] [CrossRef] [Green Version]
- Khan, D.; Shirazi, M.A.; Kim, M.Y. Single shot laser speckle based 3D acquisition system for medical applications. Opt. Lasers Eng. 2018, 105, 43–53. [Google Scholar] [CrossRef]
- Eschner, E.; Staudt, T.; Schmidt, M. 3D particle tracking velocimetry for the determination of temporally resolved particle trajectories within laser powder bed fusion of metals. Int. J. Extrem. Manuf. 2019, 1, 035002. [Google Scholar] [CrossRef] [Green Version]
- Schaffer, M.; Grosse, M.; Harendt, B.; Kowarschik, R. High-speed three-dimensional shape measurements of objects with laser speckles and acousto-optical deflection. Opt. Lett. 2011, 36, 3097–3099. [Google Scholar] [CrossRef] [PubMed]
- Harendt, B.; Große, M.; Schaffer, M.; Kowarschik, R. 3D shape measurement of static and moving objects with adaptive spatiotemporal correlation. Appl. Opt. 2014, 53, 7507. [Google Scholar] [CrossRef] [PubMed]
- Stark, A.W.; Wong, E.; Weigel, D.; Babovsky, H.; Schott, T.; Kowarschik, R. Subjective speckle suppression in laser-based stereo photogrammetry. Opt. Eng. 2016, 55, 121713. [Google Scholar] [CrossRef]
- Khan, D.; Kim, M.Y. High-density single shot 3D sensing using adaptable speckle projection system with varying preprocessing. Opt. Lasers Eng. 2020, 136, 106312. [Google Scholar] [CrossRef]
- Inokuchi, S.; Sato, K.; Matsuda, F. Range-imaging system for 3-D object recognition. In Proceedings of the 1984 International Conference on Pattern Recognition, Montreal, QC, Canada, 30 July–2 August 1984; pp. 806–808. [Google Scholar]
- Trobina, M. Error Model of a Coded-Light Range Sensor; Communication Technology Laboratory, ETH Zentrum: Zurich, Germany, 1995. [Google Scholar]
- Song, Z.; Chung, R.; Zhang, X.T. An accurate and robust strip-edge-based structured light means for shiny surface micromeasurement in 3-D. IEEE Trans. Ind. Electron. 2013, 60, 1023–1032. [Google Scholar] [CrossRef]
- Zhang, Q.; Su, X.; Xiang, L.; Sun, X. 3-D shape measurement based on complementary Gray-code light. Opt. Lasers Eng. 2012, 50, 574–579. [Google Scholar] [CrossRef]
- Zheng, D.; Da, F.; Huang, H. Phase unwrapping for fringe projection three-dimensional measurement with projector defocusing. Opt. Eng. 2016, 55, 034107. [Google Scholar] [CrossRef]
- Zheng, D.; Da, F.; Kemao, Q.; Seah, H.S. Phase-shifting profilometry combined with Gray-code patterns projection: Unwrapping error removal by an adaptive median filter. Opt. Eng. 2016, 55, 034107. [Google Scholar] [CrossRef]
- Wu, Z.; Guo, W.; Zhang, Q. High-speed three-dimensional shape measurement based on shifting Gray-code light. Opt. Express 2019, 27, 22631–22644. [Google Scholar] [CrossRef] [PubMed]
- Xu, J.; Zhang, S. Status, challenges, and future perspectives of fringe projection profilometry. Opt. Lasers Eng. 2020, 135, 106193. [Google Scholar] [CrossRef]
- Su, X.; Chen, W. Fourier transform profilometry: A review. Opt. Lasers Eng. 2001, 35, 263–284. [Google Scholar] [CrossRef]
- Zuo, C.; Feng, S.; Huang, L.; Tao, T.; Yin, W.; Chen, Q. Phase shifting algorithms for fringe projection profilometry: A review. Opt. Lasers Eng. 2018, 109, 23–59. [Google Scholar] [CrossRef]
- Zuo, C.; Tao, T.; Feng, S.; Huang, L.; Asundi, A.; Chen, Q. Micro Fourier Transform Profilometry (μFTP): 3D shape measurement at 10,000 frames per second. Opt. Lasers Eng. 2018, 102, 70–91. [Google Scholar] [CrossRef] [Green Version]
- Takeda, M.; Mutoh, K. Fourier transform profilometry for the automatic measurement of 3-D object shapes. Appl. Opt. 1983, 22, 3977–3982. [Google Scholar] [CrossRef]
- Cao, S.; Cao, Y.; Zhang, Q. Fourier transform profilometry of a single-field fringe for dynamic objects using an interlaced scanning camera. Opt. Commun. 2016, 367, 130–136. [Google Scholar] [CrossRef]
- Guo, L.; Li, J.; Su, X. Improved Fourier transform profilometry for the automatic measurement of 3D object shapes. Opt. Eng. 1990, 29, 1439–1444. [Google Scholar] [CrossRef]
- Kemao, Q. Windowed Fourier transform for fringe pattern analysis. Appl. Opt. 2004, 43, 2695–2702. [Google Scholar] [CrossRef]
- Zhong, J.; Weng, J. Spatial carrier-fringe pattern analysis by means of wavelet transform: Wavelet transform profilometry. Appl. Opt. 2004, 43, 4993–4998. [Google Scholar] [CrossRef] [PubMed]
- Gdeisat, M.; Burton, D.; Lilley, F.; Arevalillo-Herráez, M. Fast fringe pattern phase demodulation using FIR Hilbert transformers. Opt. Commun. 2016, 359, 200–206. [Google Scholar] [CrossRef]
- Wang, Z.; Zhang, Z.; Gao, N.; Xiao, Y.; Gao, F.; Jiang, X. Single-shot 3D shape measurement of discontinuous objects based on a coaxial fringe projection system. Appl. Opt. 2019, 58, A169–A178. [Google Scholar] [CrossRef] [PubMed]
- Zhang, S. Absolute phase retrieval methods for digital fringe projection profilometry: A review. Opt. Lasers Eng. 2018, 107, 28–37. [Google Scholar] [CrossRef]
- Ghiglia, D.C.; Pritt, M.D. Two-Dimensional Phase Unwrapping: Theory, Algorithms, and Software; John Wiley and Sons: New York, NY, USA, 1998. [Google Scholar]
- Zhao, M.; Huang, L.; Zhang, Q.; Su, X.; Asundi, A.; Kemao, Q. Quality-guided phase unwrapping technique: Comparison of quality maps and guiding strategies. Appl. Opt. 2011, 50, 6214–6224. [Google Scholar] [CrossRef] [PubMed]
- Zuo, C.; Huang, L.; Zhang, M.; Chen, Q.; Asundi, A. Temporal phase unwrapping algorithms for fringe projection profilometry: A comparative review. Opt. Lasers Eng. 2016, 85, 84–103. [Google Scholar] [CrossRef]
- Towers, C.E.; Towers, D.P.; Jones, J.D. Absolute fringe order calculation using optimised multi-frequency selection in full-field profilometry. Opt. Lasers Eng. 2005, 43, 788–800. [Google Scholar] [CrossRef]
- Sansoni, G.; Carocci, M.; Rodella, R. Three-dimensional vision based on a combination of gray-code and phase-shift light projection: Analysis and compensation of the systematic errors. Appl. Opt. 1999, 38, 6565–6573. [Google Scholar] [CrossRef] [Green Version]
- Van der Jeught, S.; Dirckx, J.J. Real-time structured light profilometry: A review. Opt. Lasers Eng. 2016, 87, 18–31. [Google Scholar] [CrossRef]
- Nguyen, H.; Nguyen, D.; Wang, Z.; Kieu, H.; Le, M. Real-time, high-accuracy 3D imaging and shape measurement. Appl. Opt. 2014, 54, A9–A17. [Google Scholar] [CrossRef]
- Cong, P.; Xiong, Z.; Zhang, Y.; Zhao, S.; Wu, F. Accurate Dynamic 3D Sensing With Fourier-Assisted Phase Shifting. IEEE J. Sel. Top. Signal Process. 2014, 9, 396–408. [Google Scholar] [CrossRef]
- An, Y.; Hyun, J.-S.; Zhang, S. Pixel-wise absolute phase unwrapping using geometric constraints of structured light system. Opt. Express 2016, 24, 18445–18459. [Google Scholar] [CrossRef] [PubMed]
- Jiang, C.; Li, B.; Zhang, S. Pixel-by-pixel absolute phase retrieval using three phase-shifted fringe patterns without markers. Opt. Lasers Eng. 2017, 91, 232–241. [Google Scholar] [CrossRef]
- Gai, S.; Da, F.; Dai, X. Novel 3D measurement system based on speckle and fringe pattern projection. Opt. Express 2016, 24, 17686–17697. [Google Scholar] [CrossRef] [PubMed]
- Hu, P.; Yang, S.; Zheng, F.; Yuan, Y.; Wang, T.; Li, S.; Liu, H.; Dear, J.P. Accurate and dynamic 3D shape measurement with digital image correlation-assisted phase shifting. Meas. Sci. Technol. 2021, 32, 075204. [Google Scholar] [CrossRef]
- Hu, P.; Yang, S.; Zhang, G.; Deng, H. High-speed and accurate 3D shape measurement using DIC-assisted phase matching and triple-scanning. Opt. Lasers Eng. 2021, 147, 106725. [Google Scholar] [CrossRef]
- Wu, G.; Wu, Y.; Li, L.; Liu, F. High-resolution few-pattern method for 3D optical measurement. Opt. Lett. 2019, 44, 3602–3605. [Google Scholar] [CrossRef] [PubMed]
- Lei, S.; Zhang, S. Flexible 3-D shape measurement using projector defocusing. Opt. Lett. 2009, 34, 3080–3082. [Google Scholar] [CrossRef]
- Zhang, S.; Van Der Weide, D.; Oliver, J. Superfast phase-shifting method for 3-D shape measurement. Opt. Express 2010, 18, 9684–9689. [Google Scholar] [CrossRef] [Green Version]
- Weise, T.; Leibe, B.; Van Gool, L. Fast 3d scanning with automatic motion compensation. In Proceedings of the 2007 IEEE Conference on Computer Vision and Pattern Recognition, Minneapolis, MN, USA, 18–23 June 2007; pp. 2695–2702. [Google Scholar]
- Feng, S.; Zuo, C.; Tao, T.; Hu, Y.; Zhang, M.; Chen, Q.; Gu, G. Robust dynamic 3-D measurements withmotion-compensated phase-shifting profilometry. Opt. Lasers Eng. 2018, 103, 127–138. [Google Scholar] [CrossRef]
- Liu, Z.; Zibley, P.C.; Zhang, S. Motion-induced error compensation for phase shifting profilometry. Opt. Express 2018, 26, 12632–12637. [Google Scholar] [CrossRef]
- Lu, L.; Yin, Y.; Su, Z.; Ren, X.; Luan, Y.; Xi, J. General model for phase shifting profilometry with an object in motion. Appl. Opt. 2018, 57, 10364–10369. [Google Scholar] [CrossRef]
- Liu, X.; Tao, T.; Wan, Y.; Kofman, J. Real-time motion-induced-error compensation in 3D surface-shape measurement. Opt. Express 2019, 27, 25265–25279. [Google Scholar] [CrossRef] [PubMed]
- Guo, W.; Wu, Z.; Li, Y.; Liu, Y.; Zhang, Q. Real-time 3D shape measurement with dual-frequency composite grating and motion-induced error reduction. Opt. Express 2020, 28, 26882–26897. [Google Scholar] [CrossRef]
- Zhou, K.; Meng, X.; Cheng, B. Review of Stereo Matching Algorithms Based on Deep Learning. Comput. Intell. Neurosci. 2020, 2020, 8562323. [Google Scholar] [CrossRef] [PubMed]
- Zbontar, J.; LeCun, Y. Computing the stereo matching cost with a convolutional neural network. In Proceedings of the 2015 IEEE Conference on Computer Vision and Pattern Recognition, Boston, MA, USA, 7–12 June 2015; pp. 1592–1599. [Google Scholar]
- Seki, A.; Pollefeys, M. SGM-Nets: Semi-global matching with neural networks. In Proceedings of the 2017 IEEE Conference on Computer Vision and Pattern Recognition, Honolulu, HI, USA, 21–26 June 2017; pp. 6640–6649. [Google Scholar]
- Mayer, N.; Ilg, E.; Hausser, P.; Fischer, P.; Cremers, D.; Dosovitskiy, A.; Brox, T. Large dataset to train convolutional networks for disparity, optical flow, and scene flow estimation. In Proceedings of the 2016 IEEE Conference on Computer Vision and Pattern Recognition, Las Vegas, NV, USA, 27–30 June 2016; pp. 4040–4048. [Google Scholar]
- Liang, Z.; Feng, Y.; Guo, Y.; Liu, H.; Chen, W.; Qiao, L.; Zhou, L.; Zhang, J. Learning for disparity estimation through feature constancy. In Proceedings of the 2018 IEEE Conference on Computer Vision and Pattern Recognition, Salt Lake City, UT, USA, 18–22 June 2018; pp. 2811–2820. [Google Scholar]
- Kendall, A.; Martirosyan, H.; Dasgupta, S.; Henry, P.; Kennedy, R.; Bachrach, A.; Bry, A. End-to-End Learning of Geometry and Context for Deep Stereo Regression. In Proceedings of the IEEE International Conference on Computer Vision (ICCV), Venice, Italy, 22–29 October 2017; pp. 66–75. [Google Scholar] [CrossRef] [Green Version]
- Chang, J.; Chen, Y. Pyramid stereo matching network. In Proceedings of the 2018 IEEE Conference on Computer Vision and Pattern Recognition, Salt Lake City, UT, USA, 18–22 June 2018; pp. 5410–5418. [Google Scholar]
- Zhang, F.; Prisacariu, V.; Yang, R.; Torr, P.H.S. GA-Net: Guided aggregation net for end-To-End stereo matching. In Proceedings of the 2019 IEEE Conference on Computer Vision and Pattern Recognition, Long Beach, CA, USA, 16–17 June 2019; pp. 185–194. [Google Scholar]
- Fanello, S.R.; Rhemann, C.; Tankovich, V.; Kowdle, A.; Escolano, S.O.; Kim, D.; Izadi, S. Hyperdepth: Learning depth from structured light without matching. In Proceedings of the 2016 IEEE Conference on Computer Vision and Pattern Recognition, Seattle, WA, USA, 14–19 June 2016; pp. 5441–5450. [Google Scholar]
- Fanello, S.R.; Valentin, J.; Rhemann, C.; Kowdle, A.; Tankovich, V.; Davidson, P.; Izadi, S. Ultrastereo: Efficient learning-based matching for active stereo systems. In Proceedings of the 2017 IEEE Conference on Computer Vision and Pattern Recognition, Honolulu, HI, USA, 21–26 June 2017; pp. 6535–6544. [Google Scholar]
- Zhang, Y.; Khamis, S.; Rhemann, C.; Valentin, J.; Kowdle, A.; Tankovich, V.; Schoenberg, M.; Izadi, S.; Funkhouser, T.; Fanello, S. ActiveStereoNet: End-to-End Self-supervised Learning for Active Stereo Systems. In Proceedings of the 2018 European Conference on Computer Vision, Munich, Germany, 8–14 September 2018; pp. 802–819. [Google Scholar] [CrossRef] [Green Version]
- Du, Q.; Liu, R.; Guan, B.; Pan, Y.; Sun, S. Stereo-Matching Network for Structured Light. IEEE Signal Process. Lett. 2018, 26, 164–168. [Google Scholar] [CrossRef]
- Feng, S.; Chen, Q.; Gu, G.; Tao, T.; Zhang, L.; Hu, Y.; Yin, W.; Zuo, C. Fringe pattern analysis using deep learning. Adv. Photon. 2019, 1, 025001. [Google Scholar] [CrossRef] [Green Version]
- Spoorthi, G.; Gorthi, S.; Gorthi, R.K.S.S. PhaseNet: A deep convolutional neural network for two-dimensional phase unwrapping. IEEE Signal Process. Lett. 2019, 26, 54–58. [Google Scholar] [CrossRef]
- Yin, W.; Chen, Q.; Feng, S.; Tao, T.; Huang, L.; Trusiak, M.; Asundi, A.; Zuo, C. Temporal phase unwrapping using deep learning. Sci. Rep. 2019, 9, 20175. [Google Scholar] [CrossRef]
- Yan, K.; Yu, Y.; Huang, C.; Sui, L.; Qian, K.; Asundi, A. Fringe pattern denoising based on deep learning. Opt. Commun. 2018, 437, 148–152. [Google Scholar] [CrossRef]
- Van der Jeught, S.; Dirckx, J.J.J. Deep neural networks for single shot structured light profilometry. Opt. Express 2019, 27, 17091–17101. [Google Scholar] [CrossRef]
- Machineni, R.C.; Spoorthi, G.E.; Vengala, K.S.; Gorthi, S.; Gorthi, R.K.S.S. End-to-end deep learning-based fringe projection framework for 3D profiling of objects. Comput. Vis. Image Underst. 2020, 199, 103023. [Google Scholar] [CrossRef]
- Yu, H.; Chen, X.; Zhang, Z.; Zuo, C.; Zhang, Y.; Zheng, D.; Han, J. Dynamic 3-D measurement based on fringe-to-fringe transformation using deep learning. Opt. Express 2020, 28, 9405–9418. [Google Scholar] [CrossRef]
- Gupta, M.; Agrawal, A.; Veeraraghavan, A.; Narasimhan, S.G. A practical approach to 3D scanning in the presence of interreflections; subsurface scattering defocus. Int. J. Comput. Vis. 2013, 102, 33–55. [Google Scholar] [CrossRef]
- Rao, L.; Da, F. Local blur analysis phase error correction method for fringe projection profilometry systems. Appl. Opt. 2018, 57, 4267–4276. [Google Scholar] [CrossRef] [PubMed]
- Waddington, C.; Kofman, J. Analysis of measurement sensitivity to illuminance fringe-pattern gray levels for fringe-pattern projection adaptive to ambient lighting. Opt. Lasers Eng. 2010, 48, 251–256. [Google Scholar] [CrossRef]
- Ribo, M.; Brandner, M. State of the art on vision-based structured light systems for 3D measurements. In Proceedings of the 2005 IEEE International Workshop on Robotic Sensors: Robotic & Sensor Environments, Ottawa, ON, Canada, 30 September–1 October 2005; pp. 2–6. [Google Scholar]
- Liu, P.; Li, A.; Ma, Z. Error analysis and parameter optimization of structured-light vision system. Comput. Eng. Des. 2013, 34, 757–760. [Google Scholar]
- Jia, X.; Jiang, Z.; Cao, F.; Zeng, D. System model and error analysis for coded structure light. Opt. Precis. Eng. 2011, 19, 717–727. [Google Scholar]
- Fan, L.; Zhang, X.; Tu, D. Structured light system calibration based on digital phase-shifting projection technology. Machinery 2014, 52, 73–76. [Google Scholar]
- ISO 15530; Geometrical Product Specifications (GPS)—Coordinate Measuring Machines (CMM): Technique for Determining the Uncertainty of Measurement. ISO: Geneva, Switzerland, 2013.
- ISO 25178; Geometrical product specifications (GPS)—Surface texture: Areal. ISO: Geneva, Switzerland, 2019.
- Giusca, C.L.; Leach, R.K.; Helery, F.; Gutauskas, T.; Nimishakavi, L. Calibration of the scales of areal surface topography-measuring instruments: Part 1. Measurement noise residual flatness. Meas. Sci. Technol. 2013, 23, 035008. [Google Scholar] [CrossRef]
- Giusca, C.L.; Leach, R.K.; Helery, F. Calibration of the scales of areal surface topography measuring instruments: Part 2. Amplification; linearity squareness. Meas. Sci. Technol. 2013, 23, 065005. [Google Scholar] [CrossRef]
- Giusca, C.L.; Leach, R.K. Calibration of the scales of areal surface topography measuring instruments: Part 3. Resolut. Meas. Sci. Technol. 2013, 24, 105010. [Google Scholar] [CrossRef]
- Ren, M.J.; Cheung, C.F.; Kong, L.B. A task specific uncertainty analysis method for least-squares-based form characterization of ultra-precision freeform surfaces. Meas. Sci. Technol. 2012, 23, 054005. [Google Scholar] [CrossRef]
- Ren, M.J.; Cheung, C.F.; Kong, L.B.; Wang, S.J. Quantitative Analysis of the Measurement Uncertainty in Form Characterization of Freeform Surfaces based on Monte Carlo Simulation. Procedia CIRP 2015, 27, 276–280. [Google Scholar] [CrossRef] [Green Version]
- Cheung, C.F.; Ren, M.J.; Kong, L.B.; Whitehouse, D. Modelling analysis of uncertainty in the form characterization of ultra-precision freeform surfaces on coordinate measuring machines. CIRP Ann.-Manuf. Technol. 2014, 63, 481–484. [Google Scholar] [CrossRef]
- Vukašinović, N.; Bračun, D.; Možina, J.; Duhovnik, J. The influence of incident angle, object colour and distance on CNC laser scanning. Int. J. Adv. Manuf. Technol. 2010, 50, 265–274. [Google Scholar] [CrossRef]
- Ge, Q.; Li, Z.; Wang, Z.; Kowsari, K.; Zhang, W.; He, X.; Zhou, J.; Fang, N.X. Projection micro stereolithography based 3D printing and its applications. Int. J. Extrem. Manuf. 2020, 2, 022004. [Google Scholar] [CrossRef]
- Schaffer, M.; Grosse, M.; Harendt, B.; Kowarschik, R. Coherent two-beam interference fringe projection for highspeed three-dimensional shape measurements. Appl. Opt. 2013, 52, 2306–2311. [Google Scholar] [CrossRef]
- Duan, X.; Duan, F.; Lv, C. Phase stabilizing method based on PTAC for fiber-optic interference fringe projection profilometry. Opt. Laser Eng. 2013, 47, 137–143. [Google Scholar]
- Duan, X.; Wang, C.; Wang, J.; Zhao, H. A new calibration method and optimization of structure parameters under the non-ideal condition for 3D measurement system based on fiber-optic interference fringe projection. Optik 2018, 172, 424–430. [Google Scholar] [CrossRef]
- Gayton, G.; Su, R.; Leach, R.K. Modelling fringe projection based on linear systems theory and geometric transformation. In Proceedings of the 2019 International Symposium on Measurement Technology and Intelligent Instruments, Niigata, Japan, 1–4 September 2019. [Google Scholar]
- Petzing, J.; Coupland, J.; Leach, R.K. The Measurement of Rough Surface Topography Using Coherence Scanning Interferometry; National Physical Laboratory: London, UK, 2010. [Google Scholar]
- Salahieh, B.; Chen, Z.; Rodriguez, J.J.; Liang, R. Multi-polarization fringe projection imaging for high dynamic range objects. Opt. Express 2014, 22, 10064–10071. [Google Scholar] [CrossRef] [PubMed]
- Jiang, C.; Bell, T.; Zhang, S. High dynamic range real-time 3D shape measurement. Opt. Express 2016, 24, 7337–7346. [Google Scholar] [CrossRef] [PubMed]
- Song, Z.; Jiang, H.; Lin, H.; Tang, S. A high dynamic range structured light means for the 3D measurement of specular surface. Opt. Lasers Eng. 2017, 95, 8–16. [Google Scholar] [CrossRef]
- Lin, H.; Gao, J.; Mei, Q.; Zhang, G.; He, Y.; Chen, X. Three-dimensional shape measurement technique for shiny surfaces by adaptive pixel-wise projection intensity adjustment. Opt. Lasers Eng. 2017, 91, 206–215. [Google Scholar] [CrossRef]
- Zhong, C.; Gao, Z.; Wang, X.; Shao, S.; Gao, C. Structured Light Three-Dimensional Measurement Based on Machine Learning. Sensors 2019, 19, 3229. [Google Scholar] [CrossRef] [Green Version]
Figure 1.
Schematic of camera model. (a) Perspective camera model; (b) telecentric camera model.
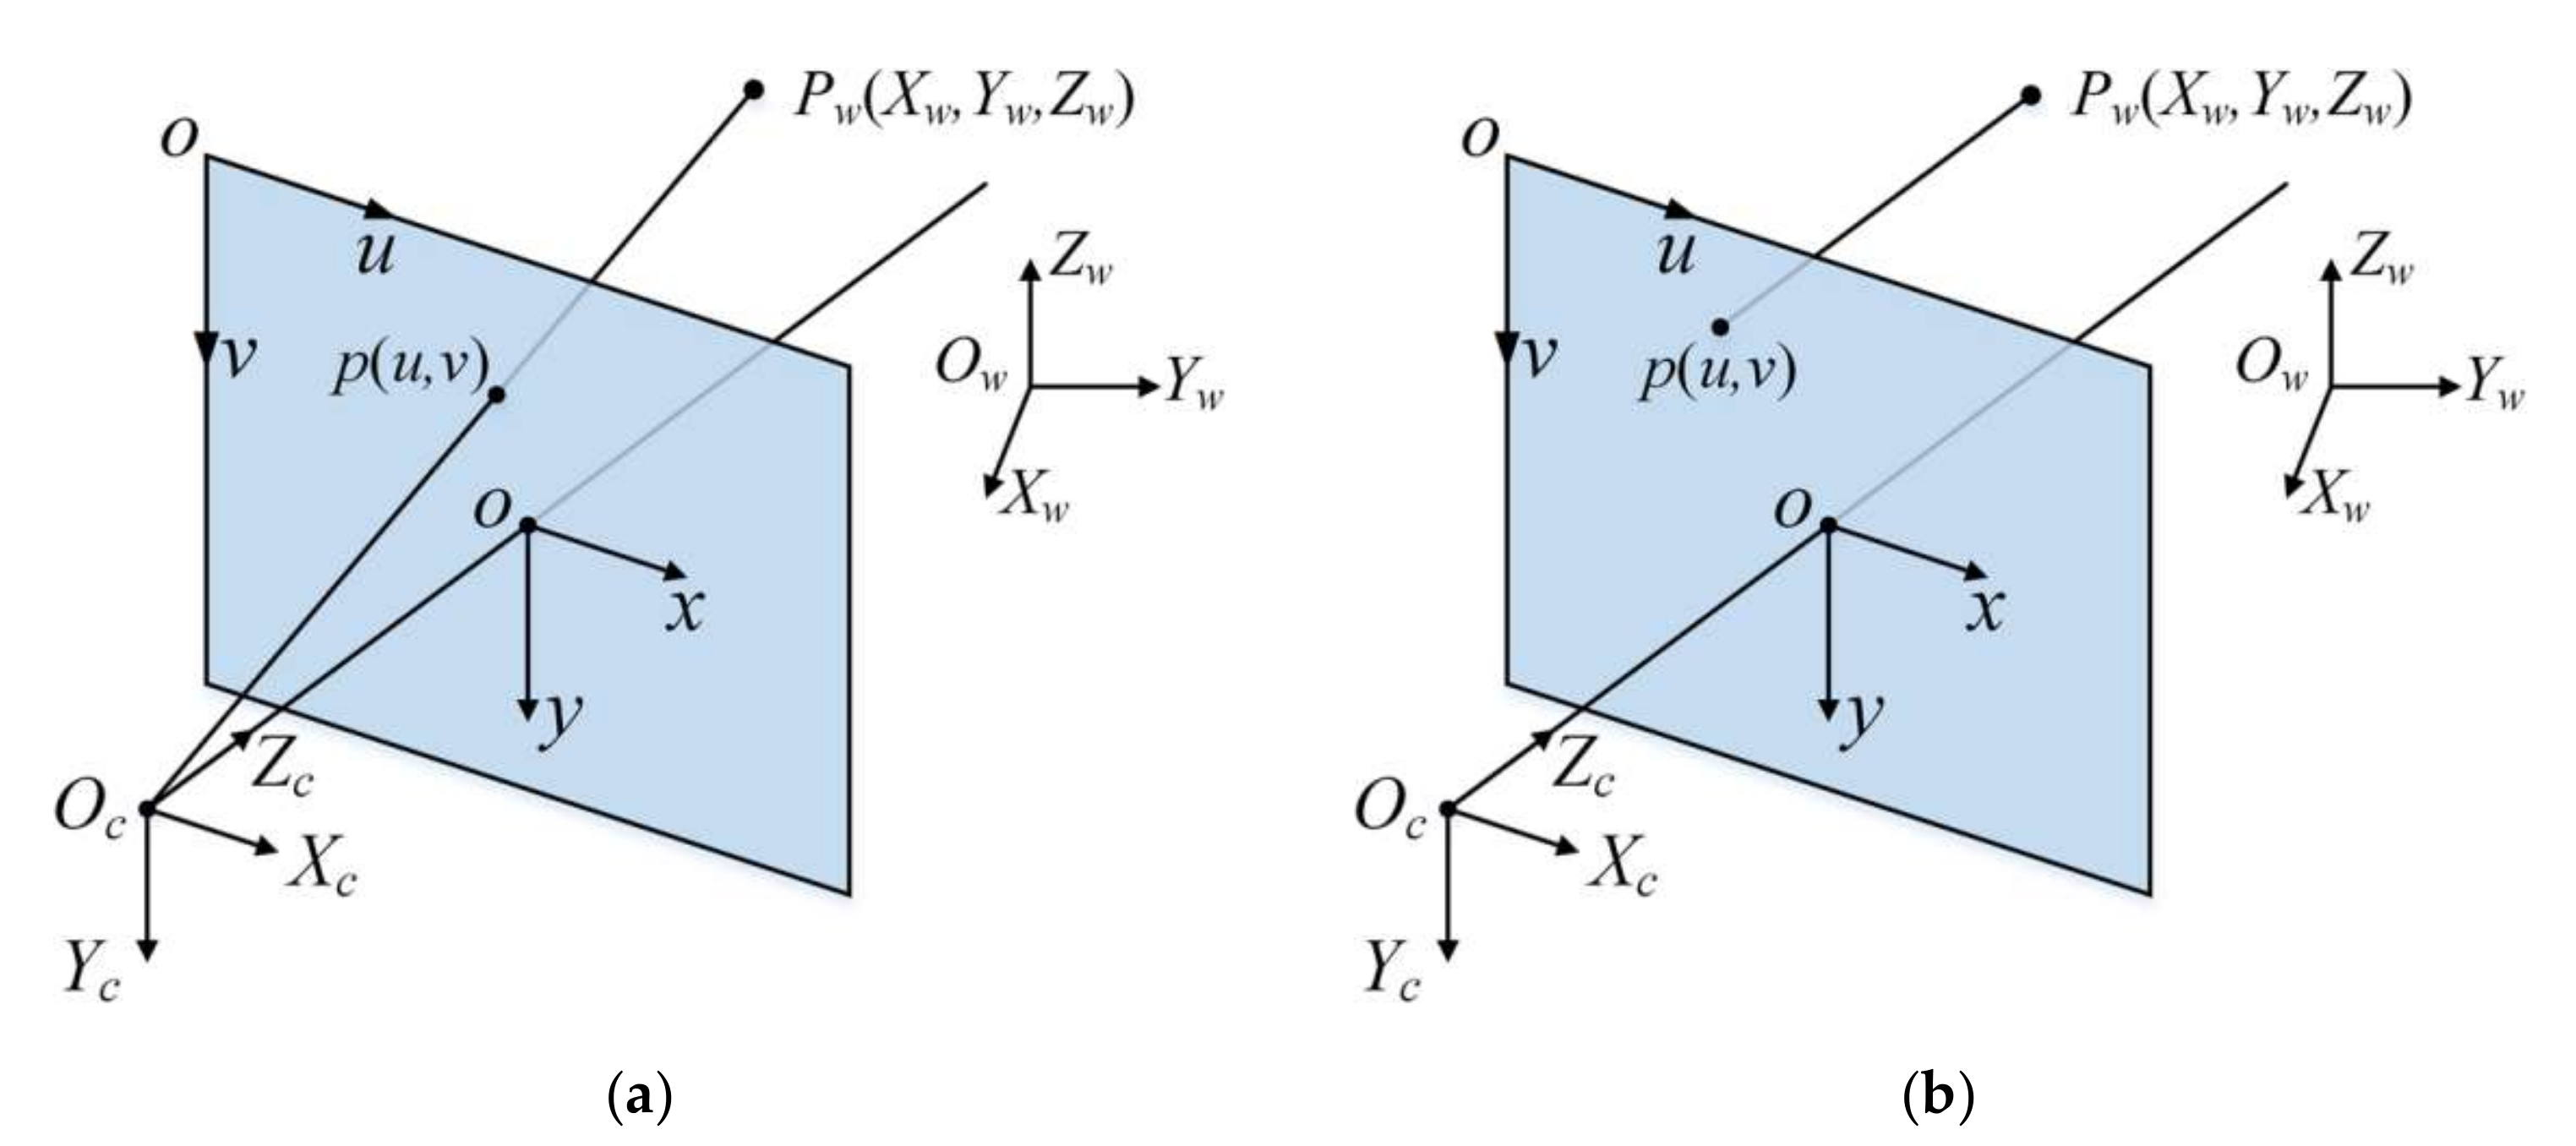
Figure 2.
Schematic of a Scheimpfug camera model. (a) Optical structure; (b) coordinate systems.

Figure 3.
Schematic of epipolar geometry.
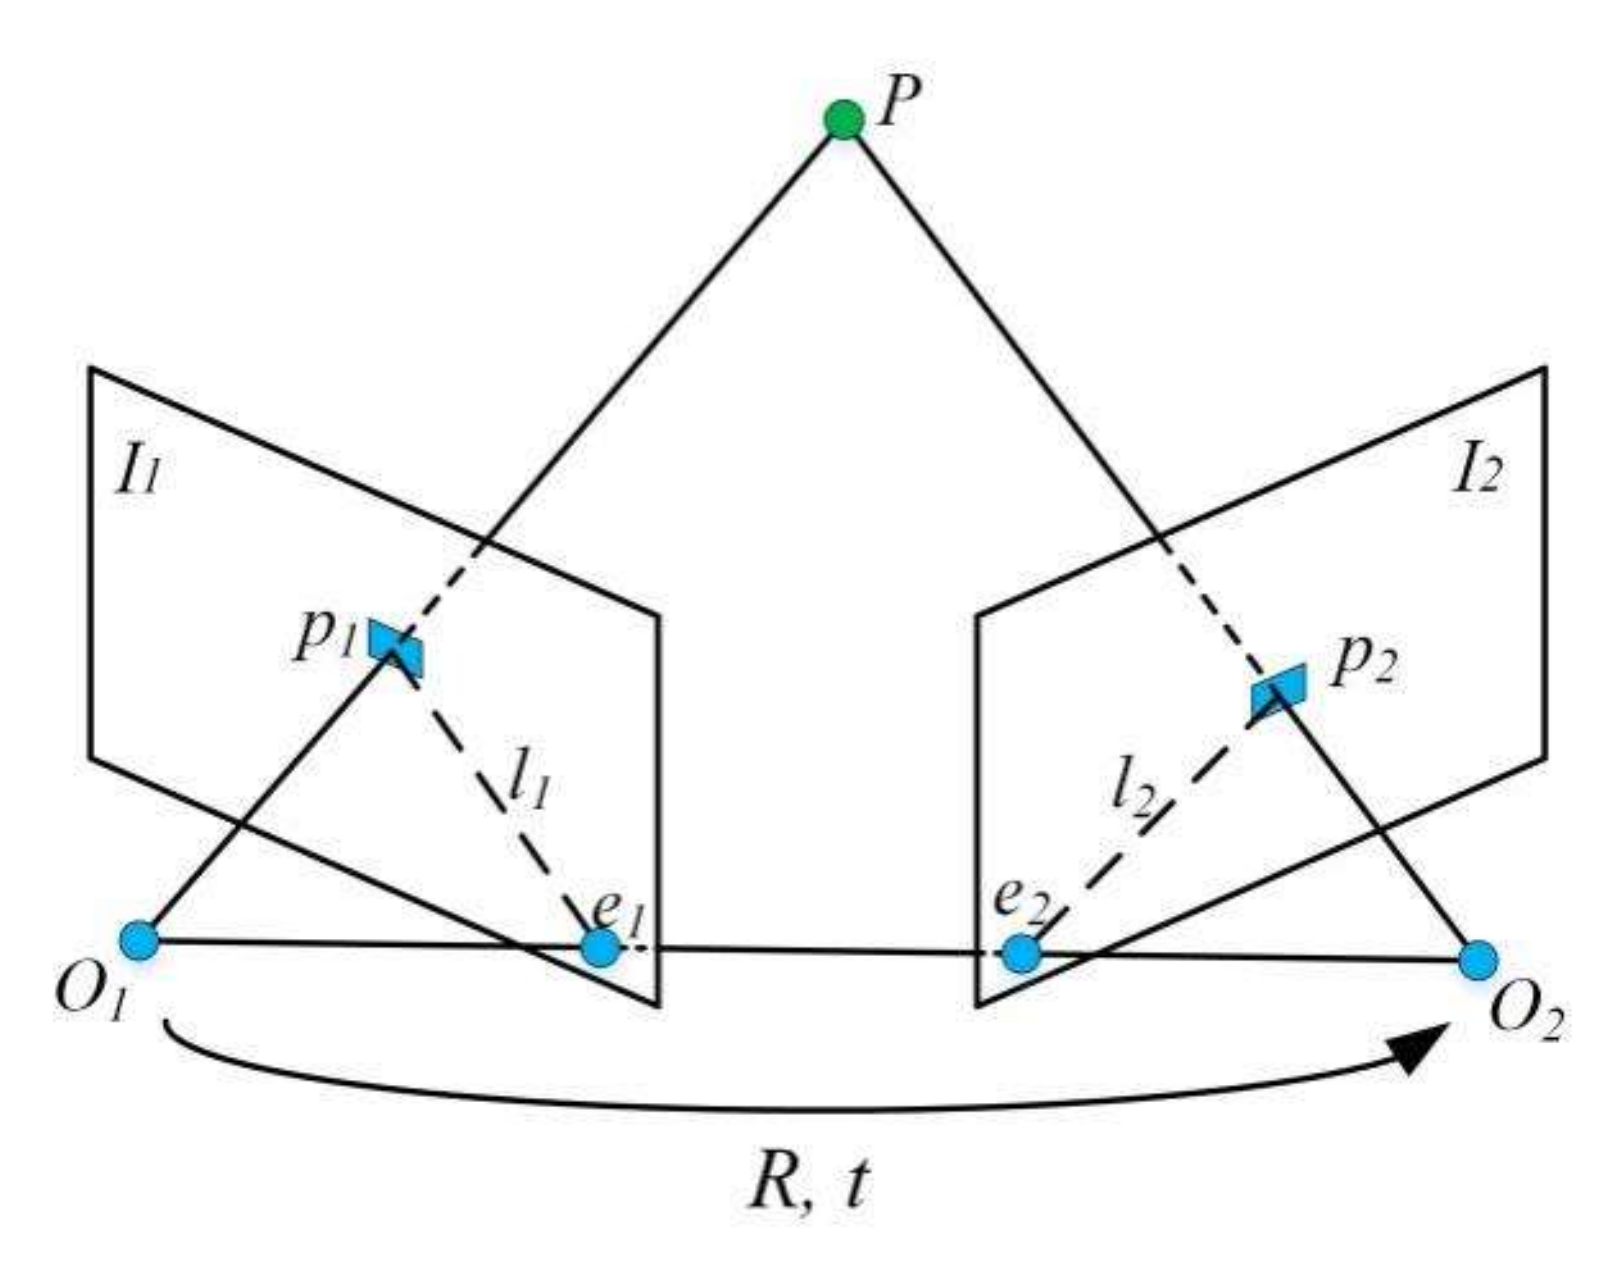
Figure 4.
Schematic diagram of parallel stereo vision.
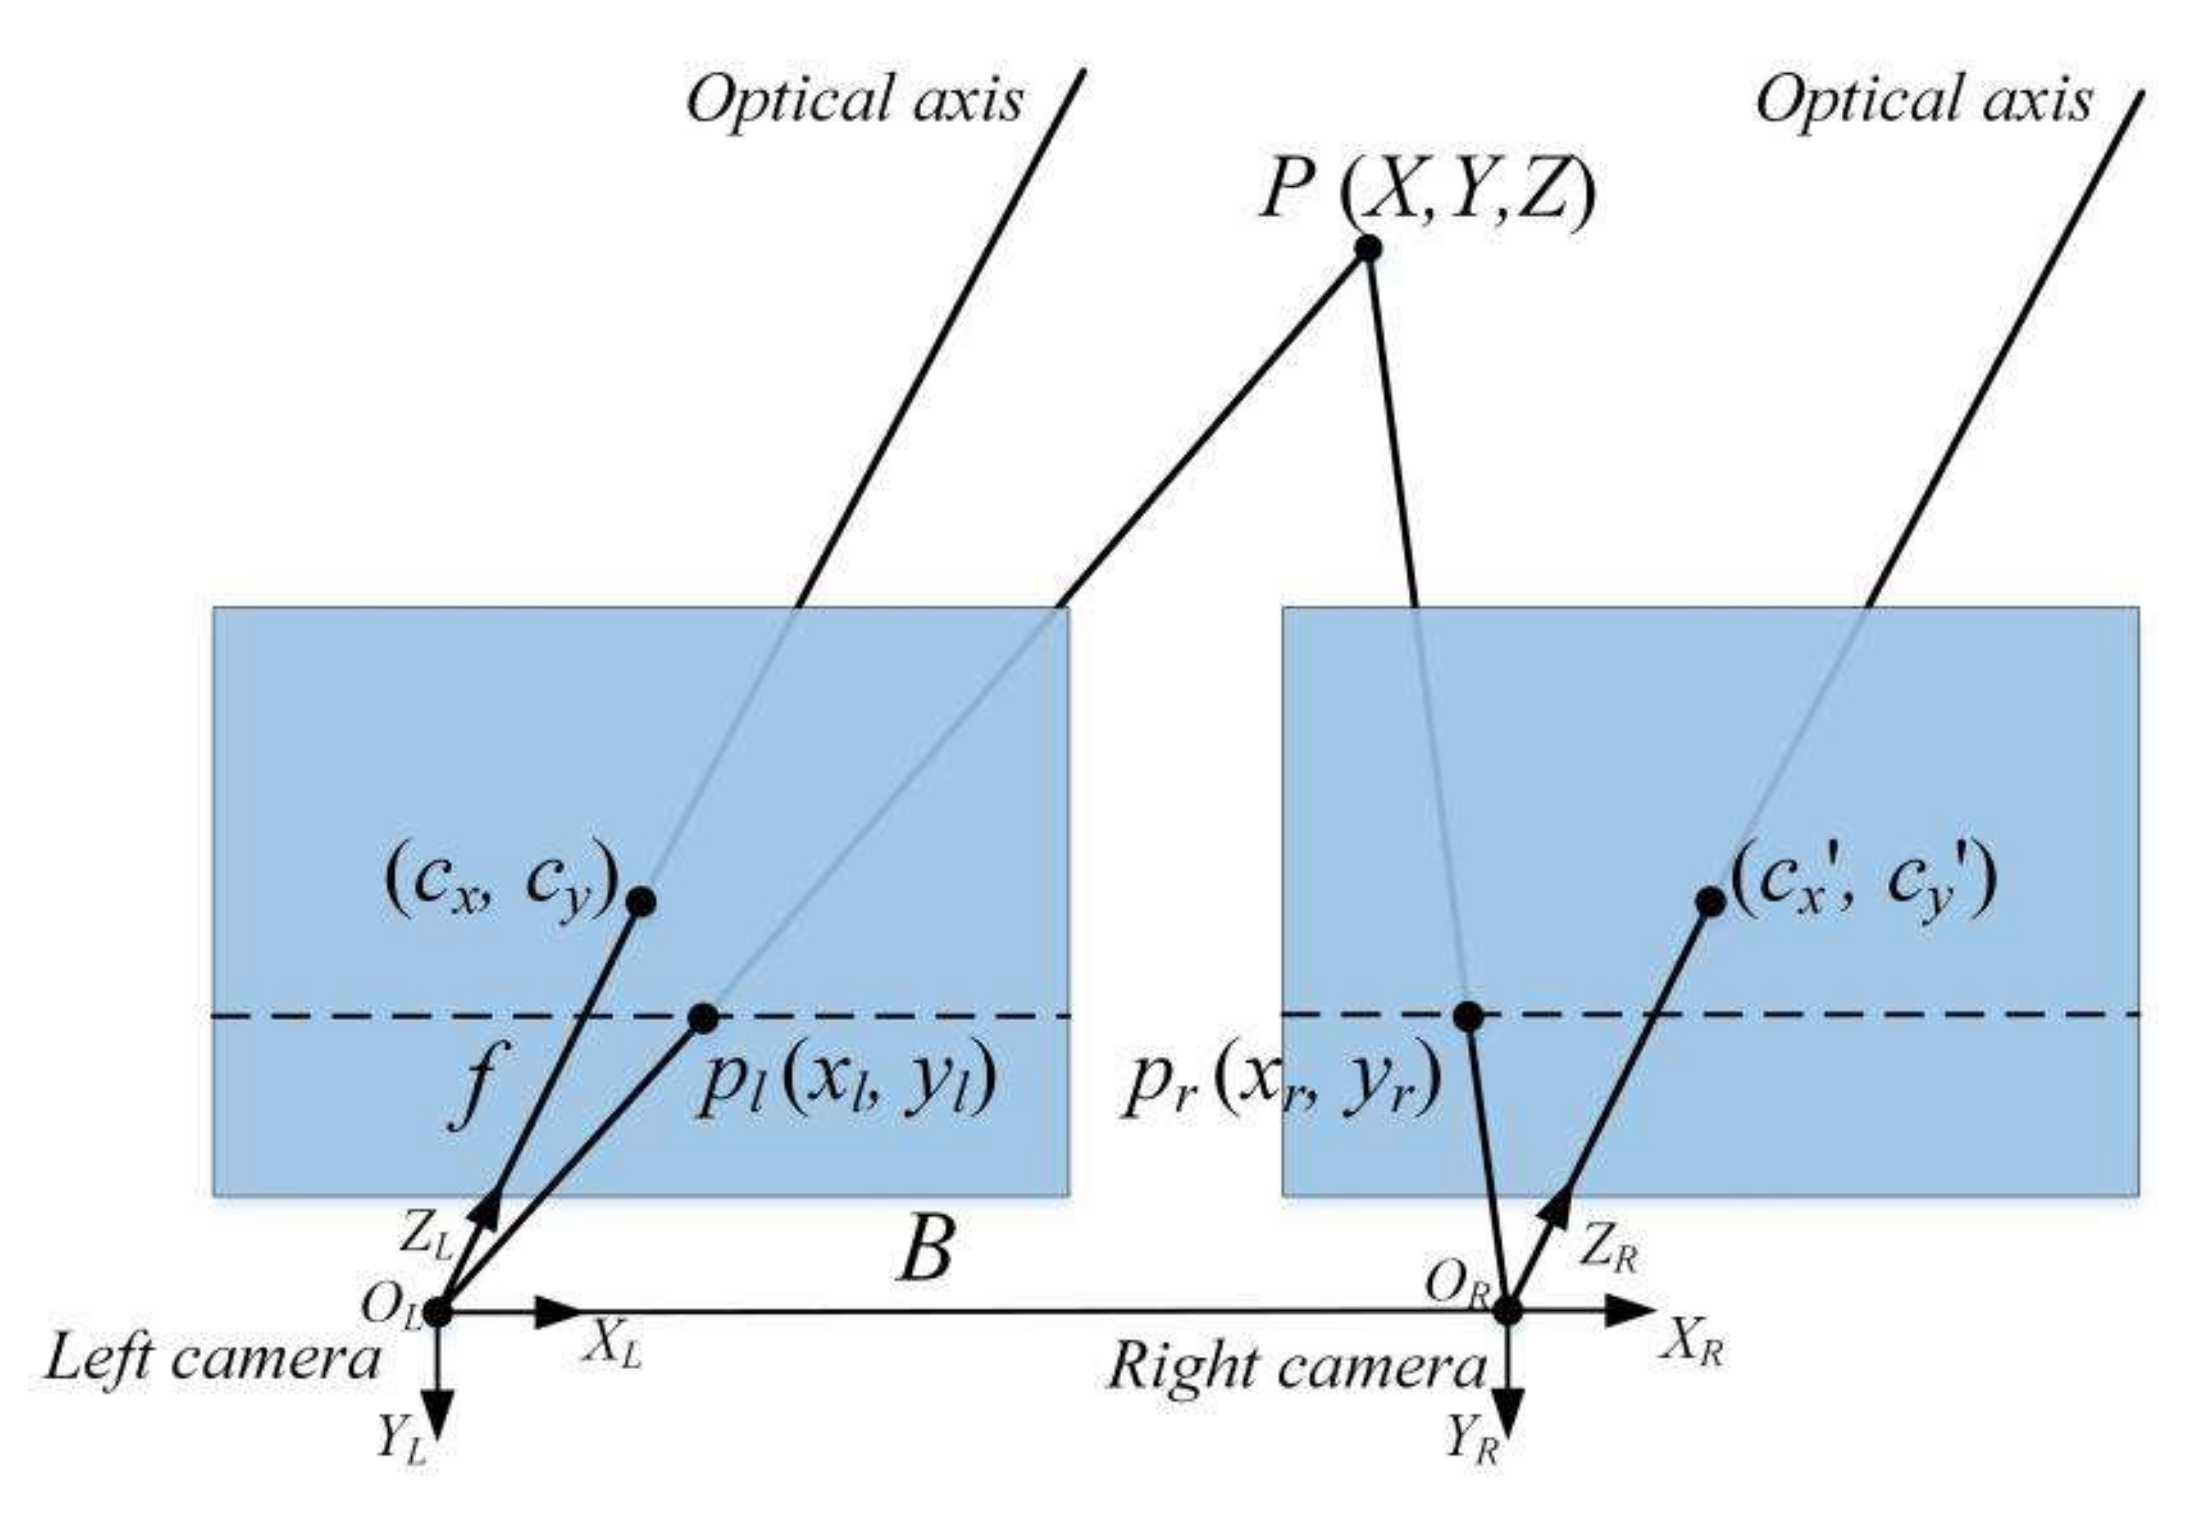
Figure 5.
Schematic of laser triangulation. (a) Measuring principle; (b) line laser projection configuration.
Figure 5.
Schematic of laser triangulation. (a) Measuring principle; (b) line laser projection configuration.
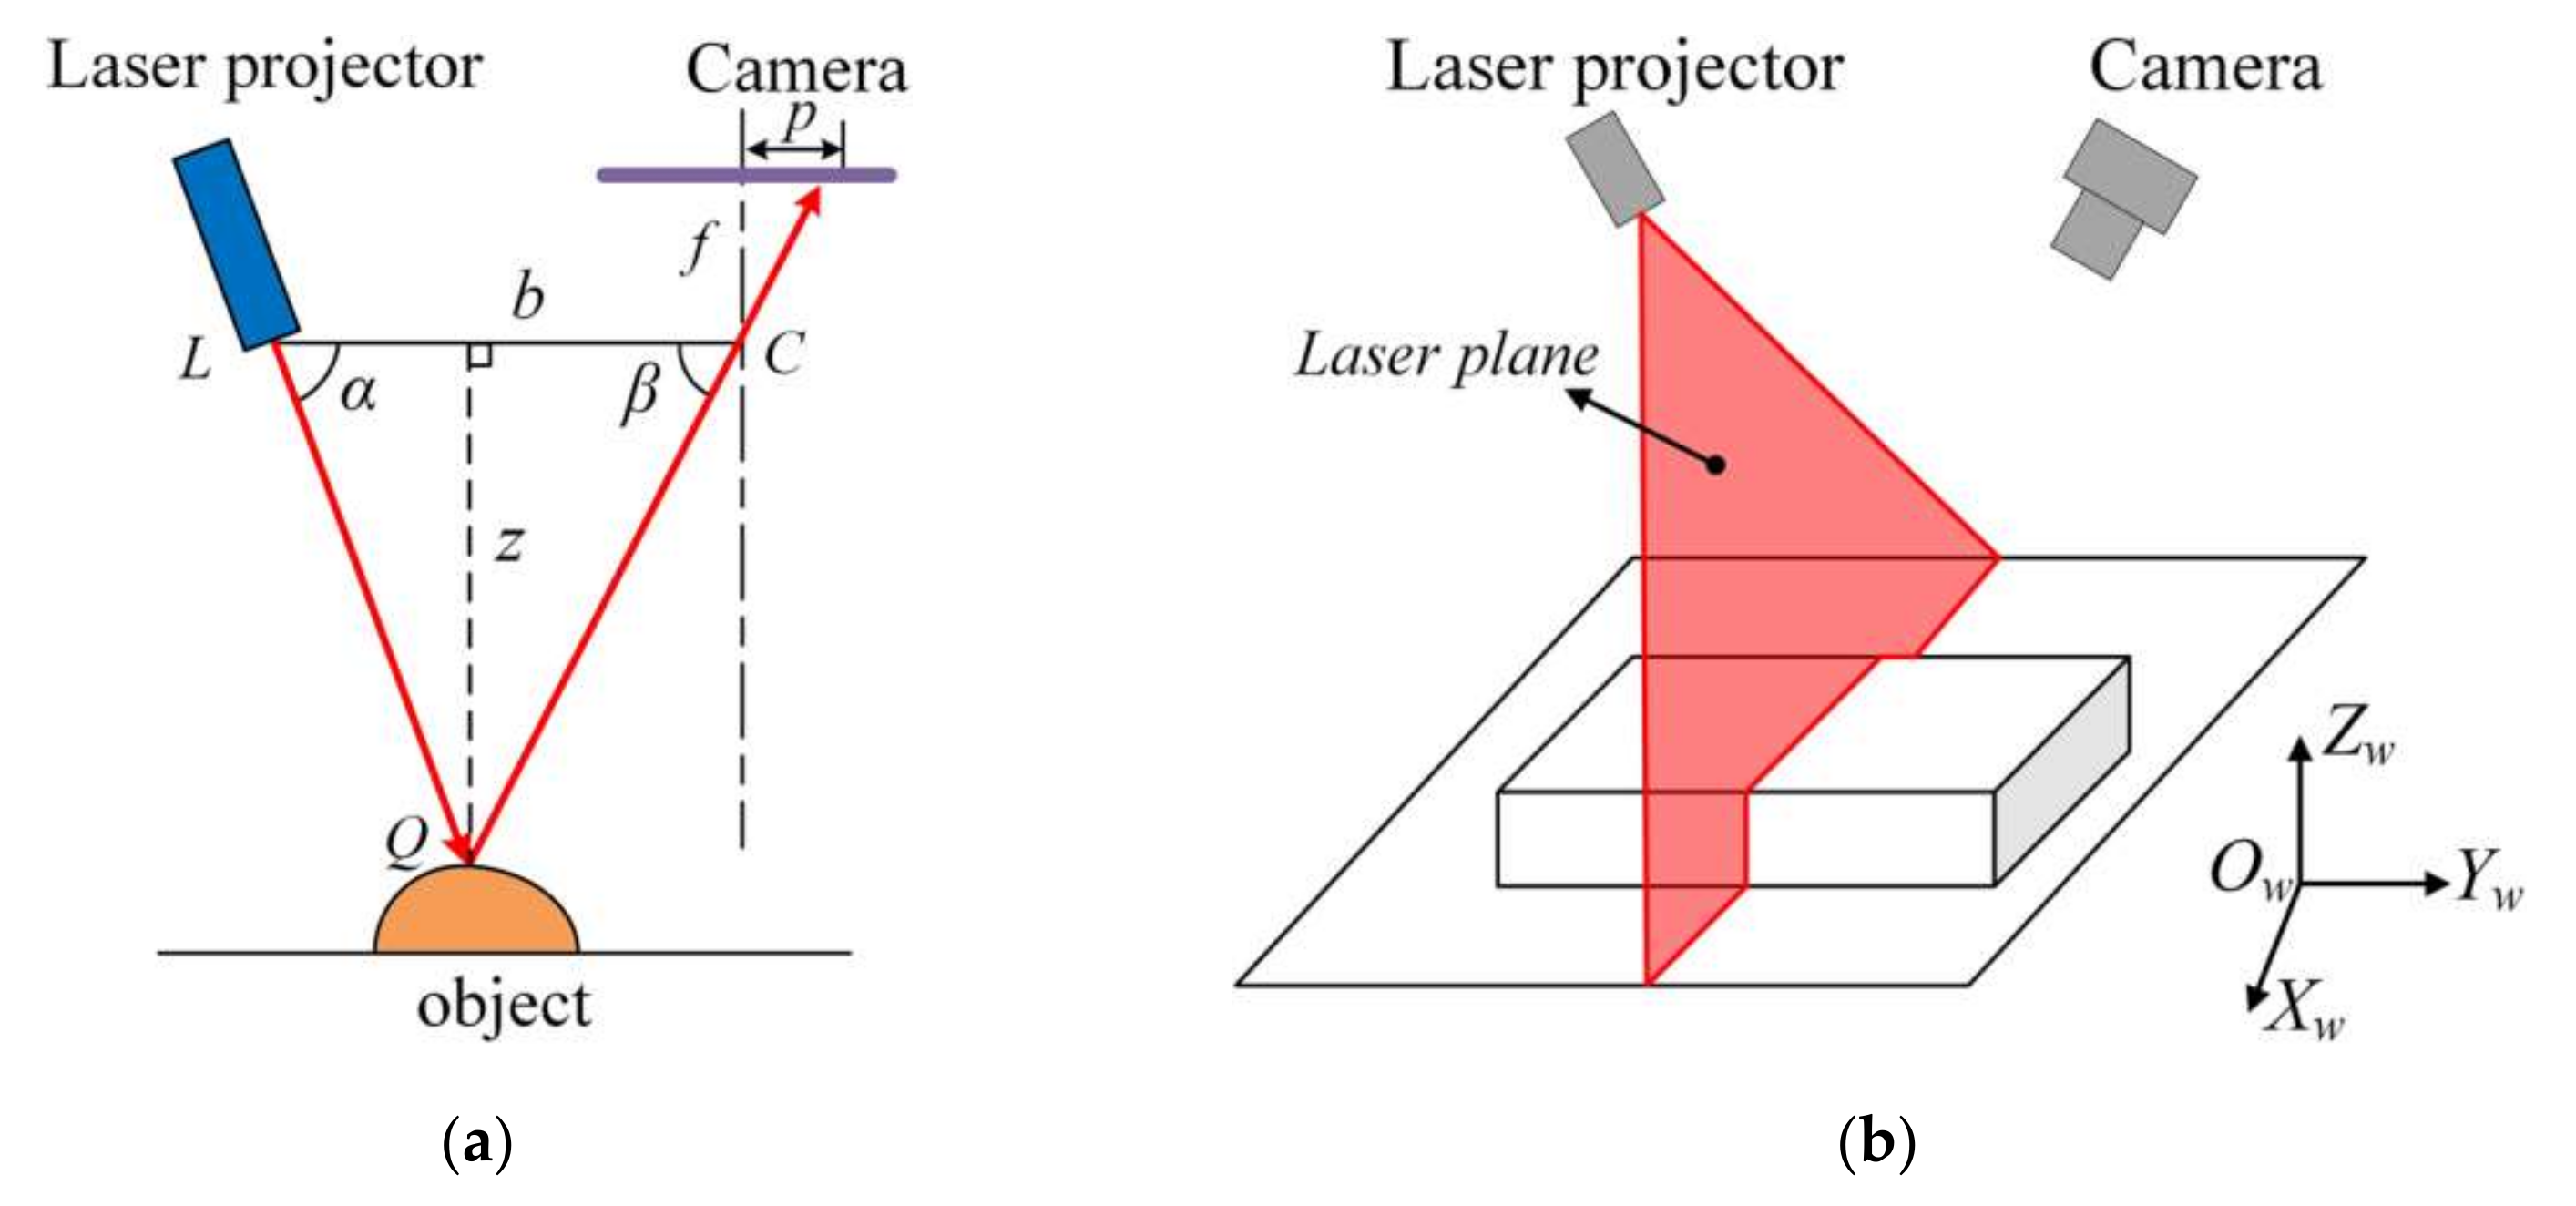
Figure 6.
Schematic of structured light system.
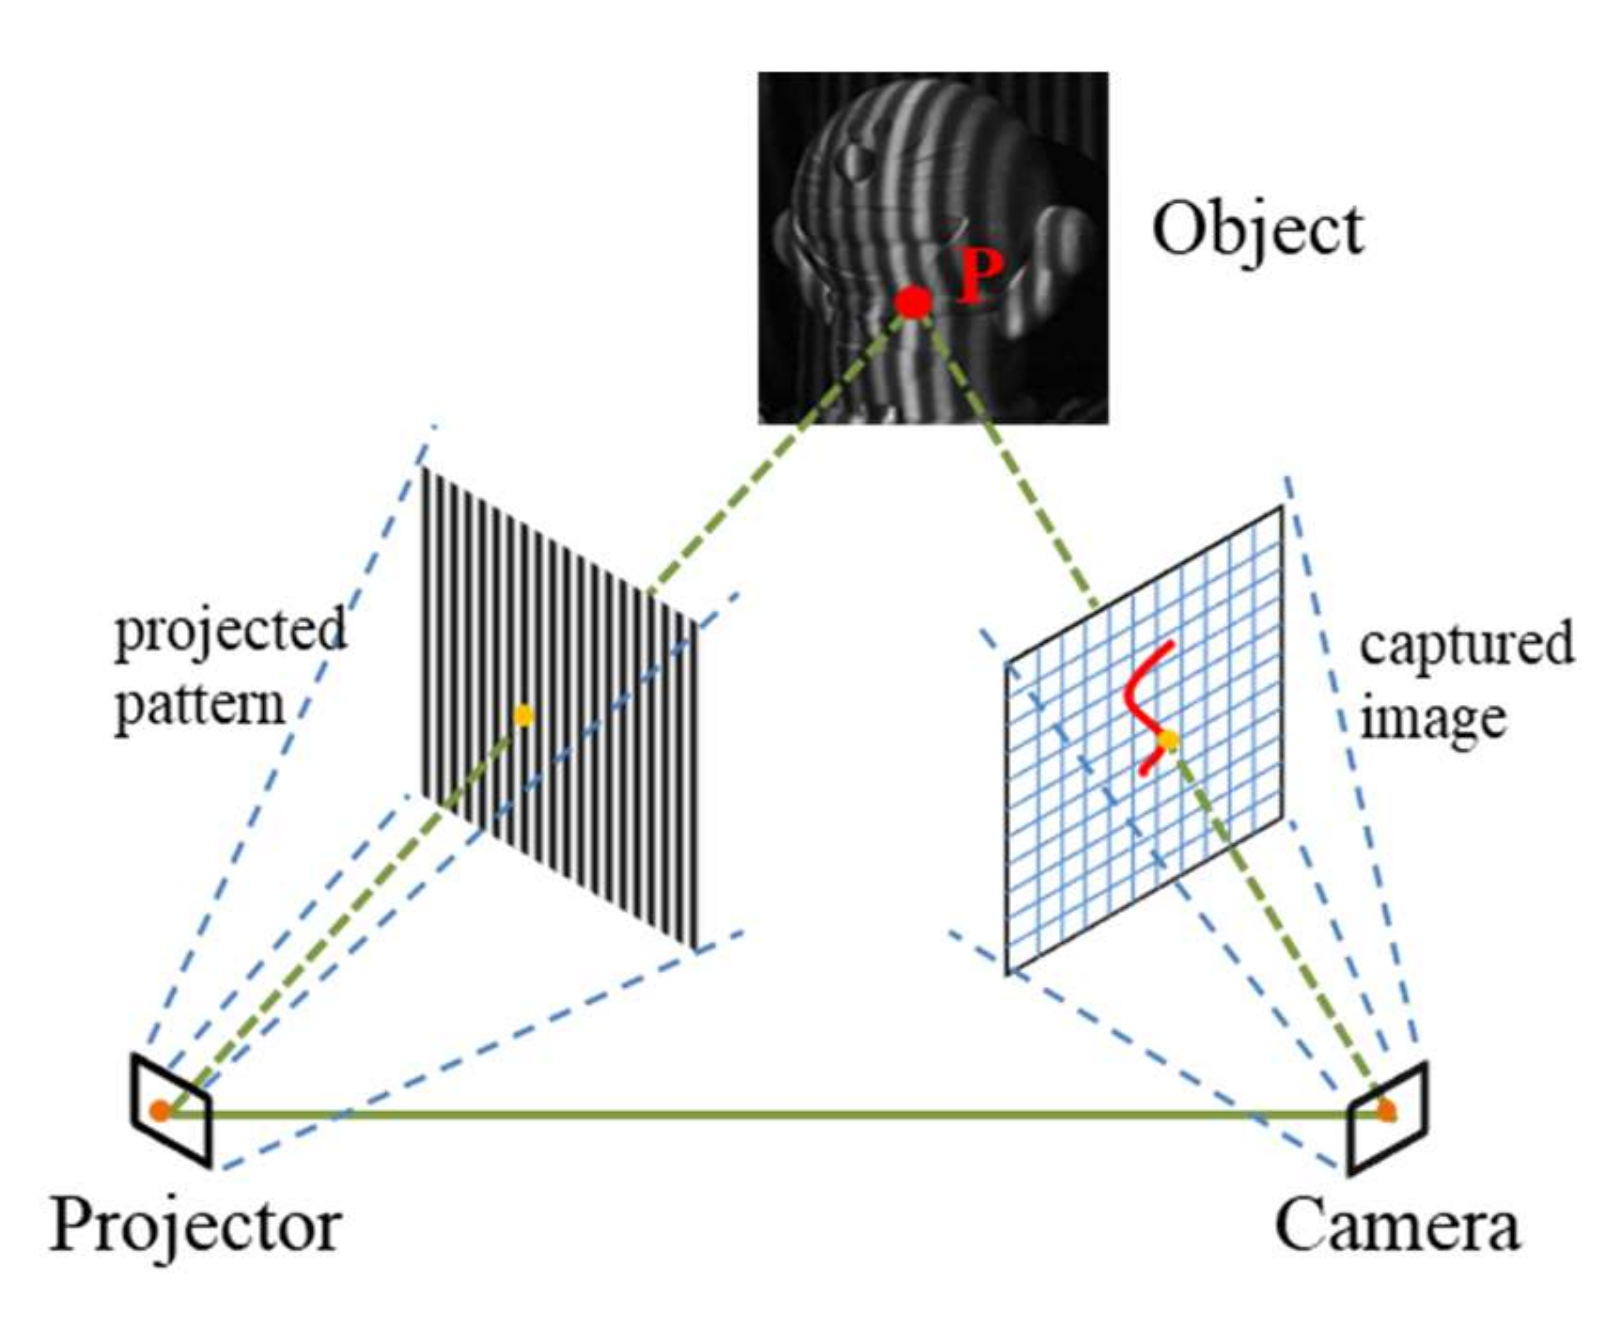
Figure 7.
Correspondence of camera pixel and projector pixel.

Figure 8.
Flowchart of stereo matching.

Figure 9.
Dual-platform laser scanning. (a) Configuration; (b) translational scanning point cloud; (c) rotational scanning point cloud [15].
Figure 9.
Dual-platform laser scanning. (a) Configuration; (b) translational scanning point cloud; (c) rotational scanning point cloud [15].
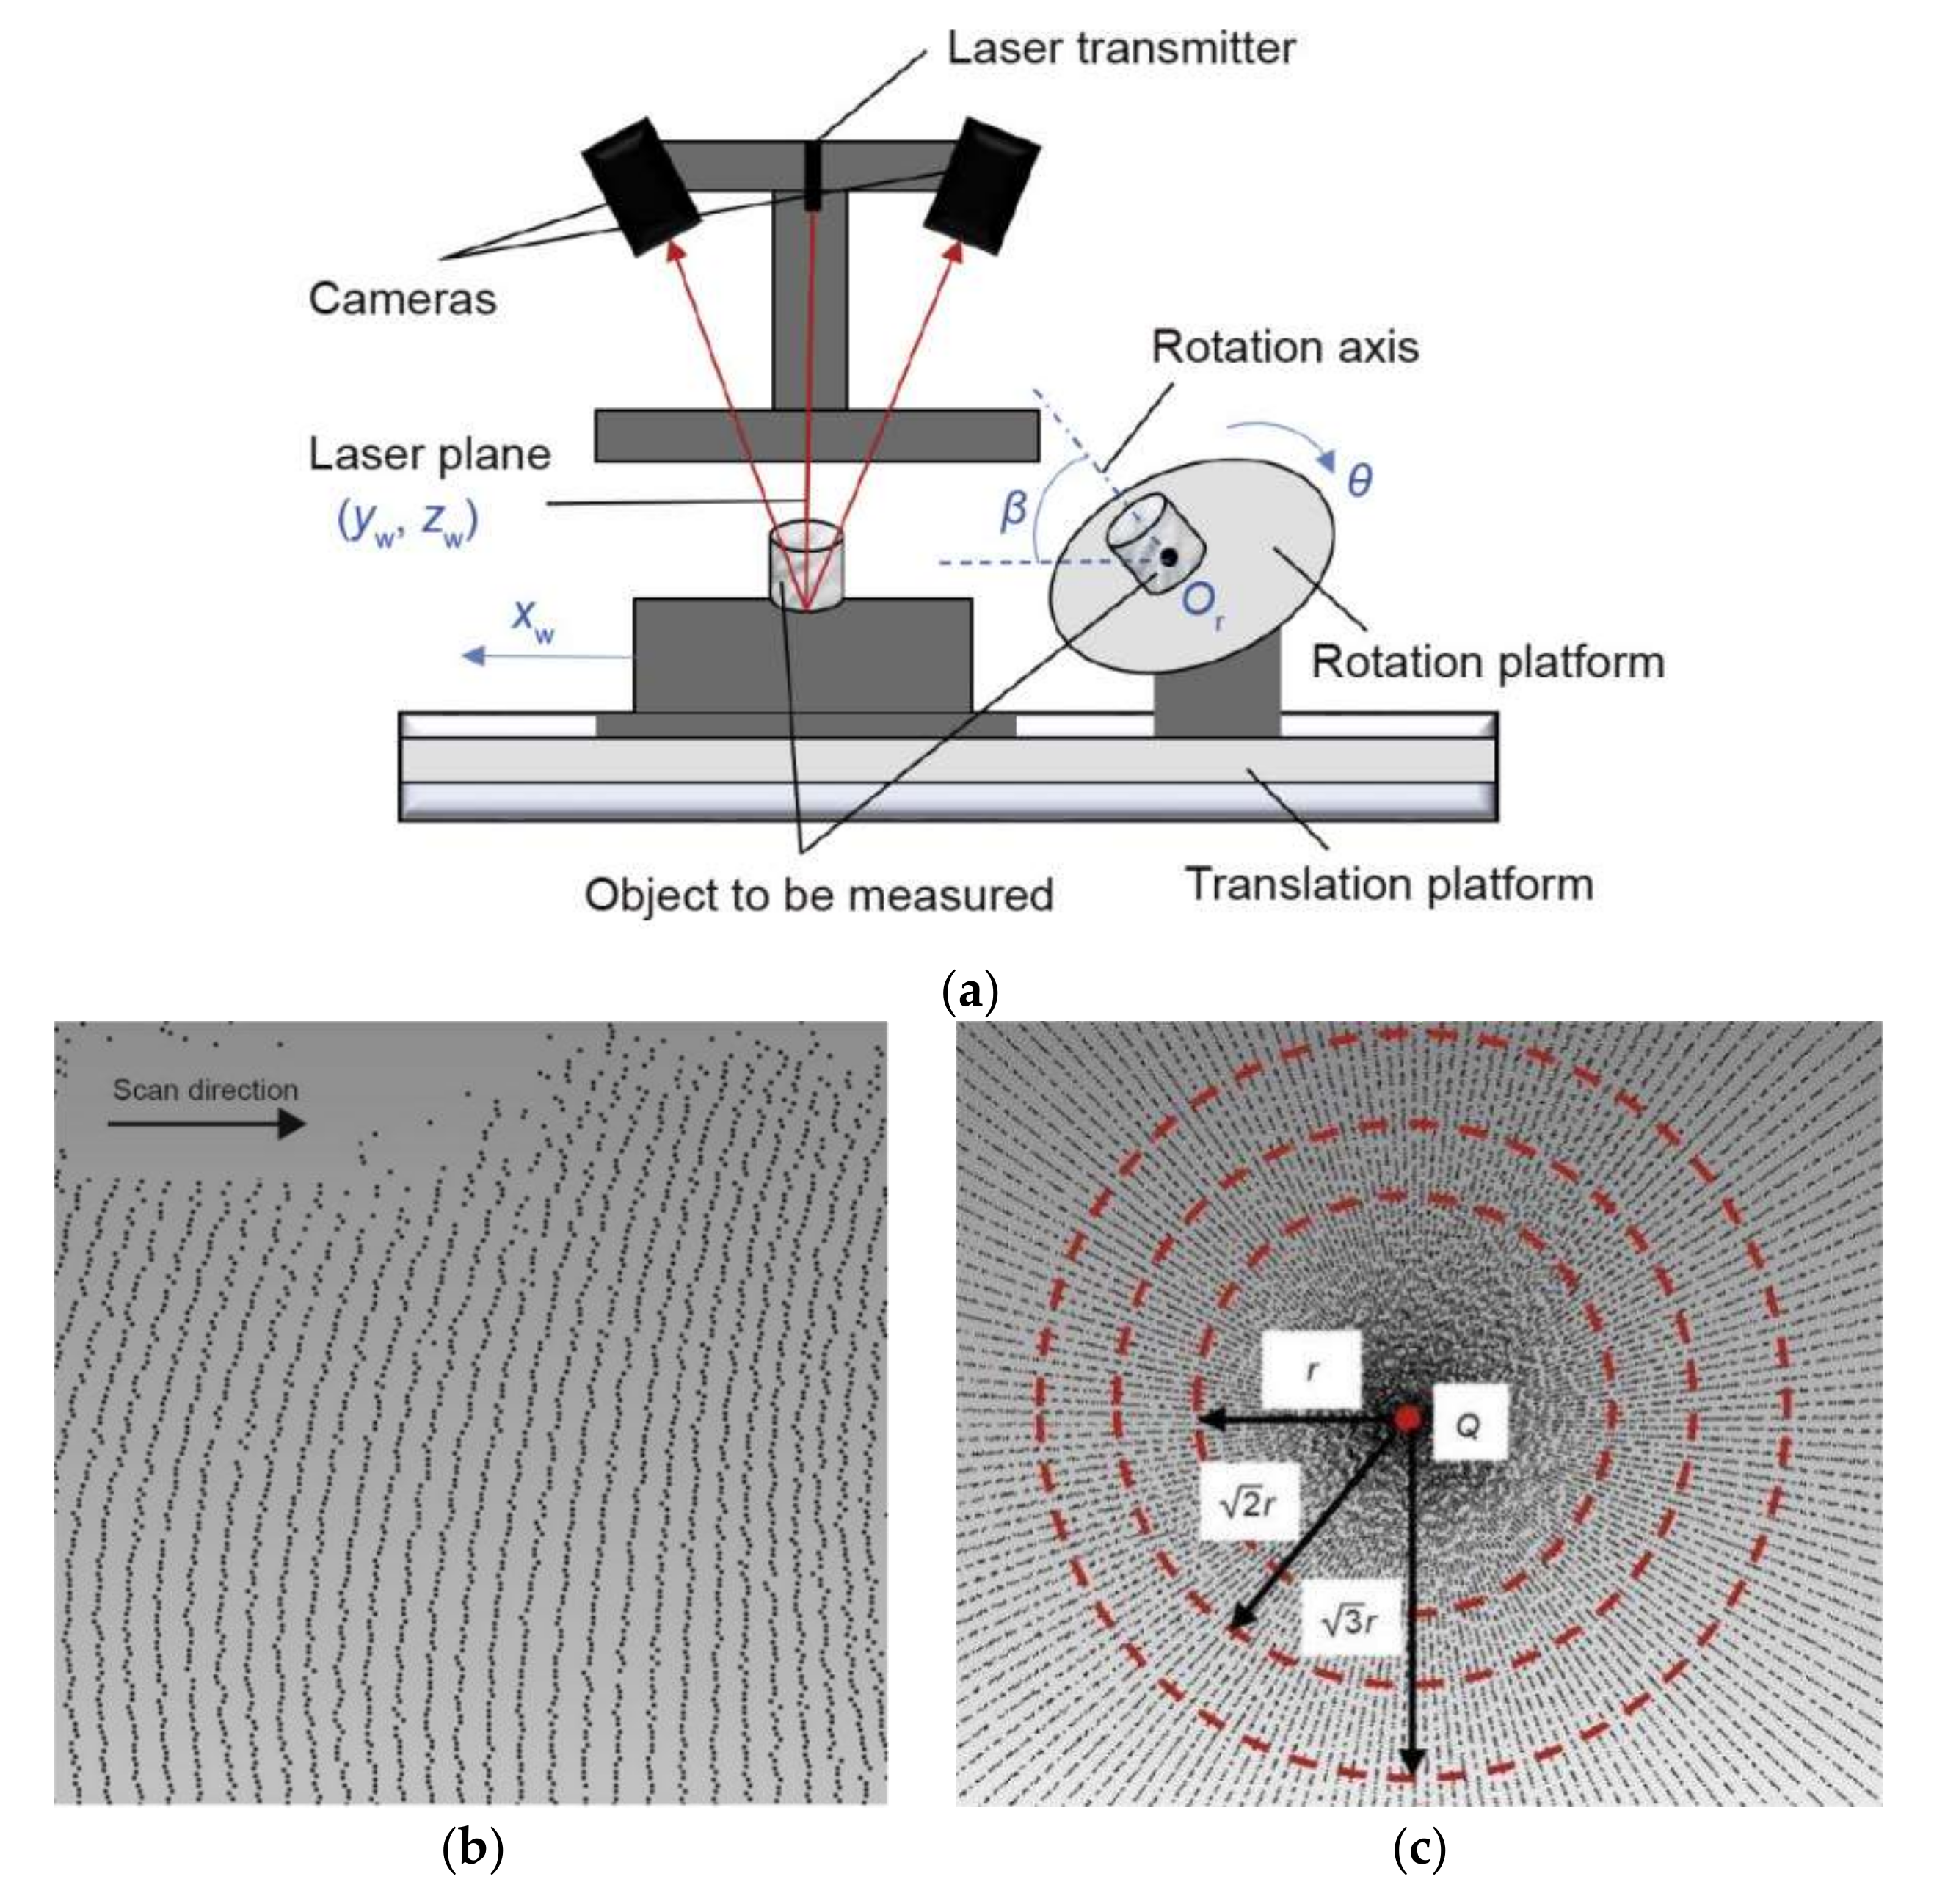
Figure 10.
Schematic of galvanometric laser scanning method. (a) System calibration; (b) measured point cloud of a checkerboard flat panel before (red) and after (blue) error compensation [60].
Figure 10.
Schematic of galvanometric laser scanning method. (a) System calibration; (b) measured point cloud of a checkerboard flat panel before (red) and after (blue) error compensation [60].
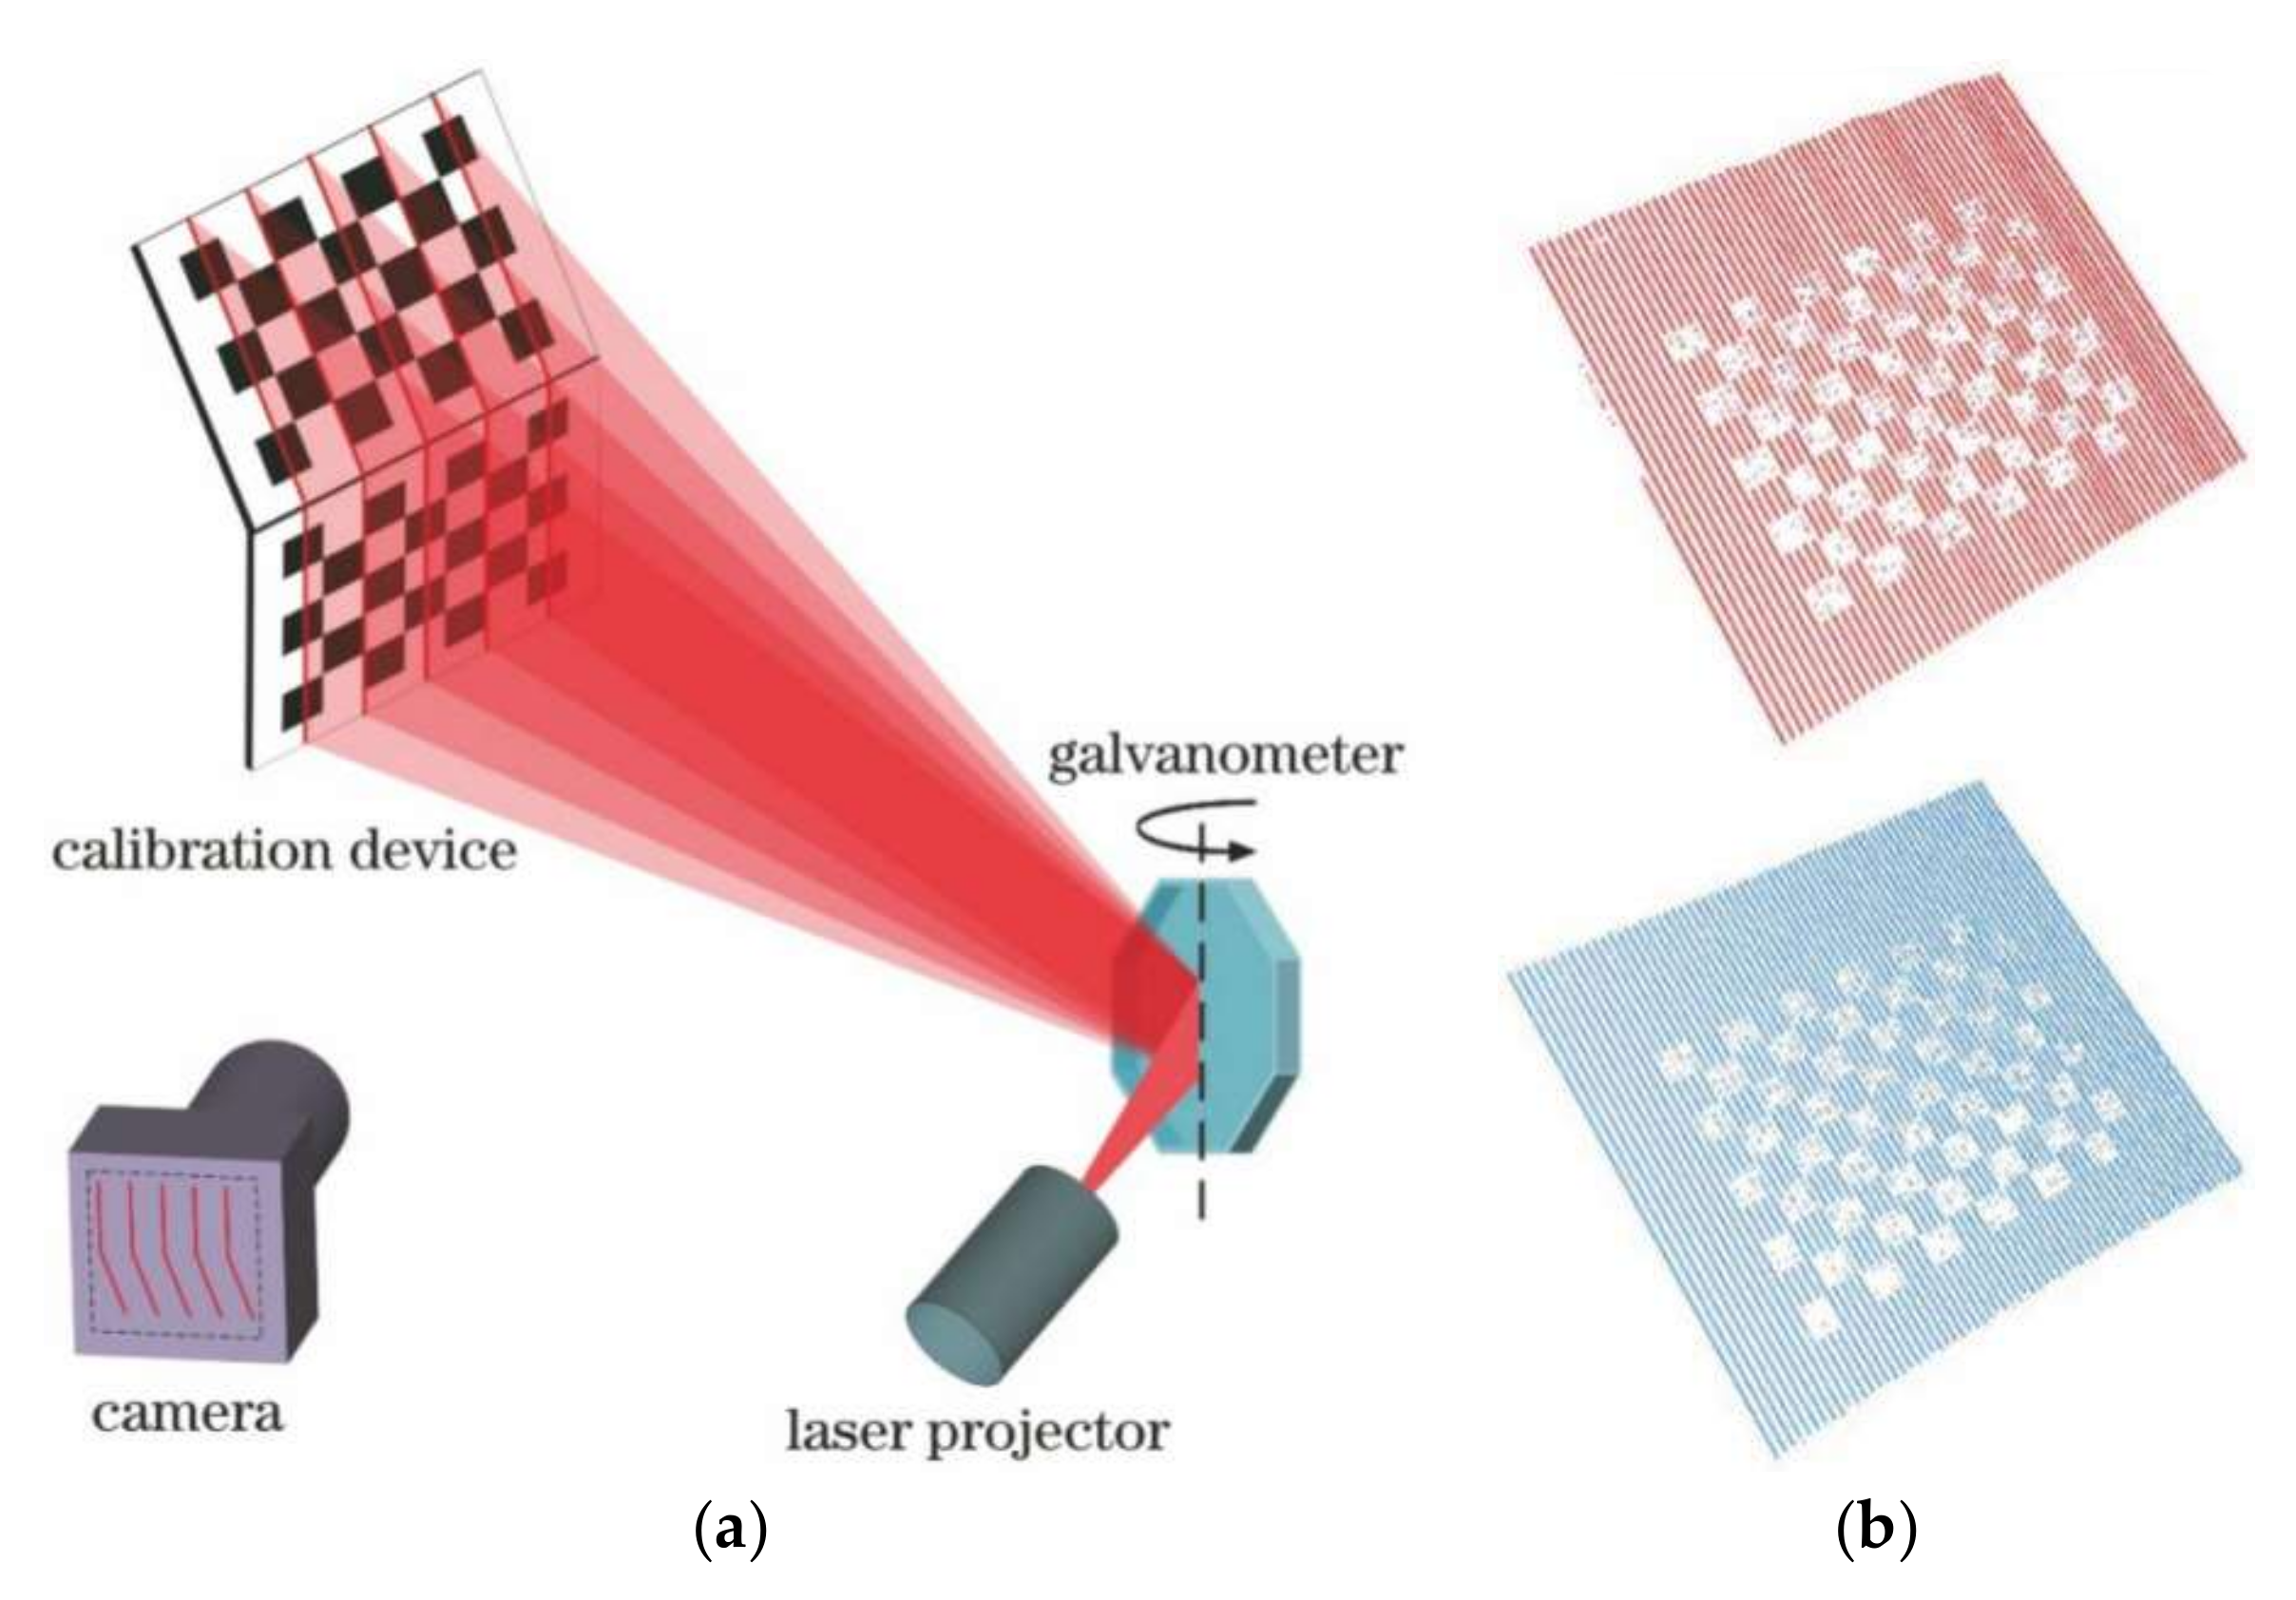
Figure 11.
Schematic diagram of DIC. (a) Left image; (b) right image.
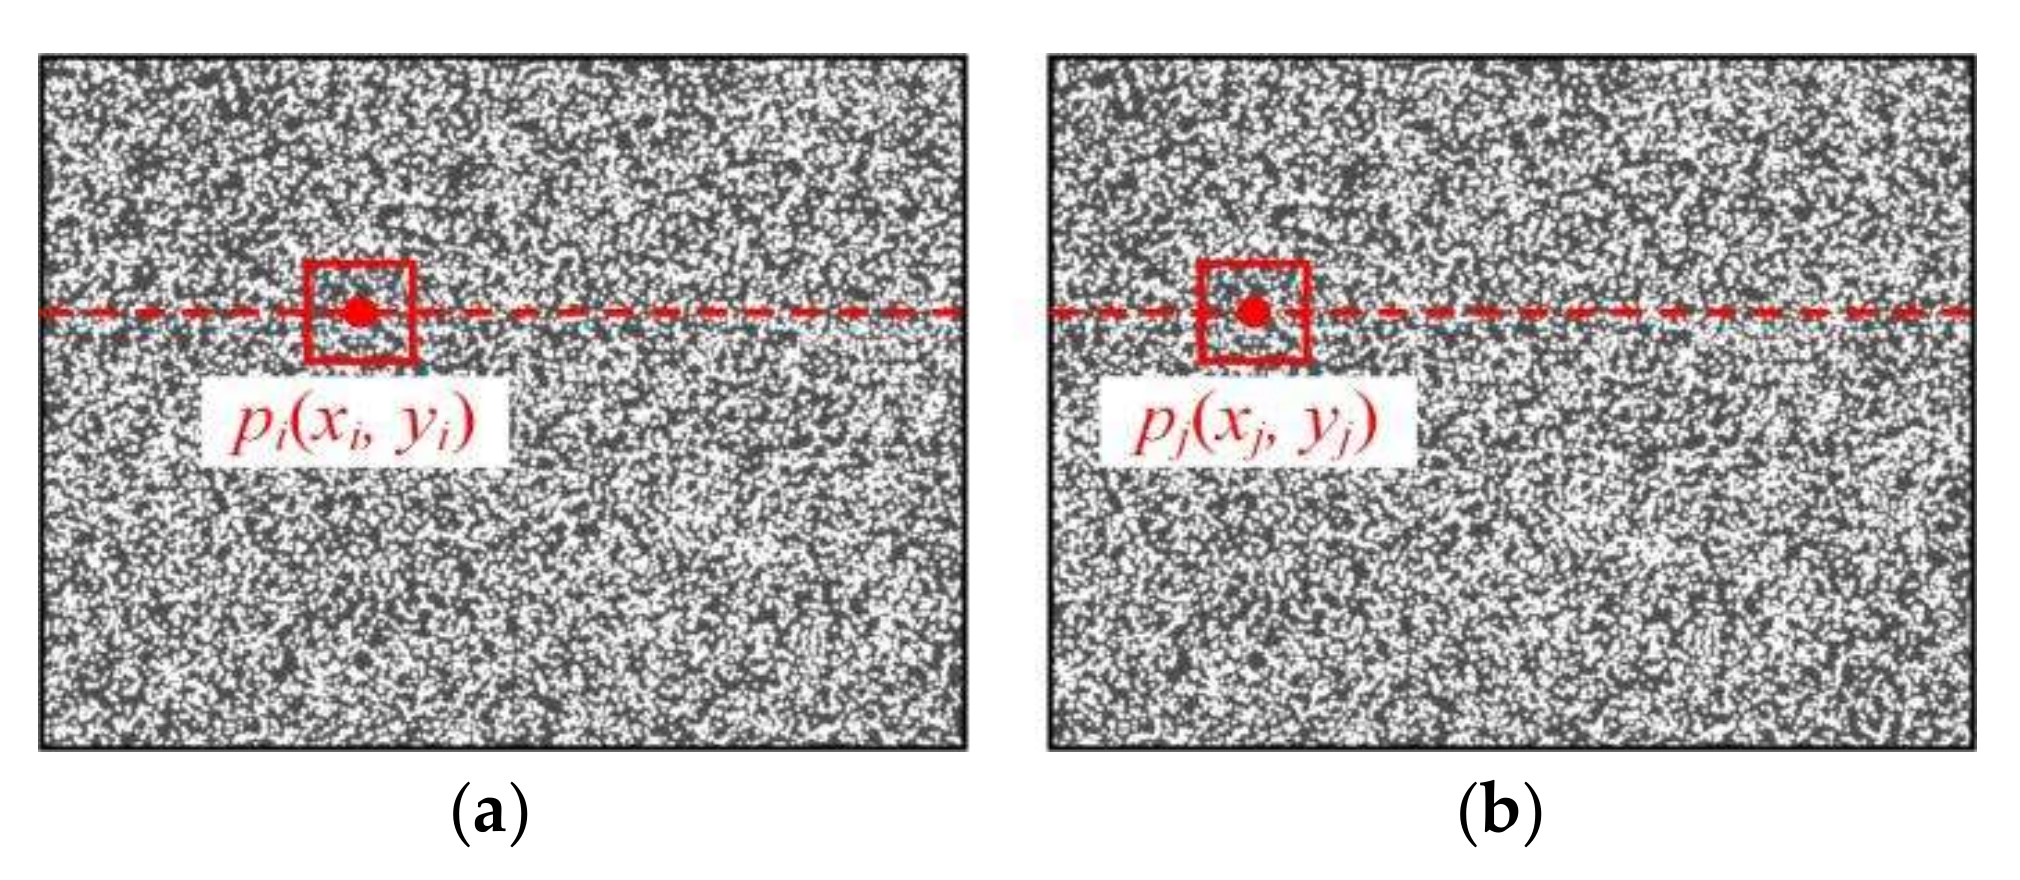
Figure 12.
Typical binary coding schemes. (a) Simple coding; (b) gray coding.
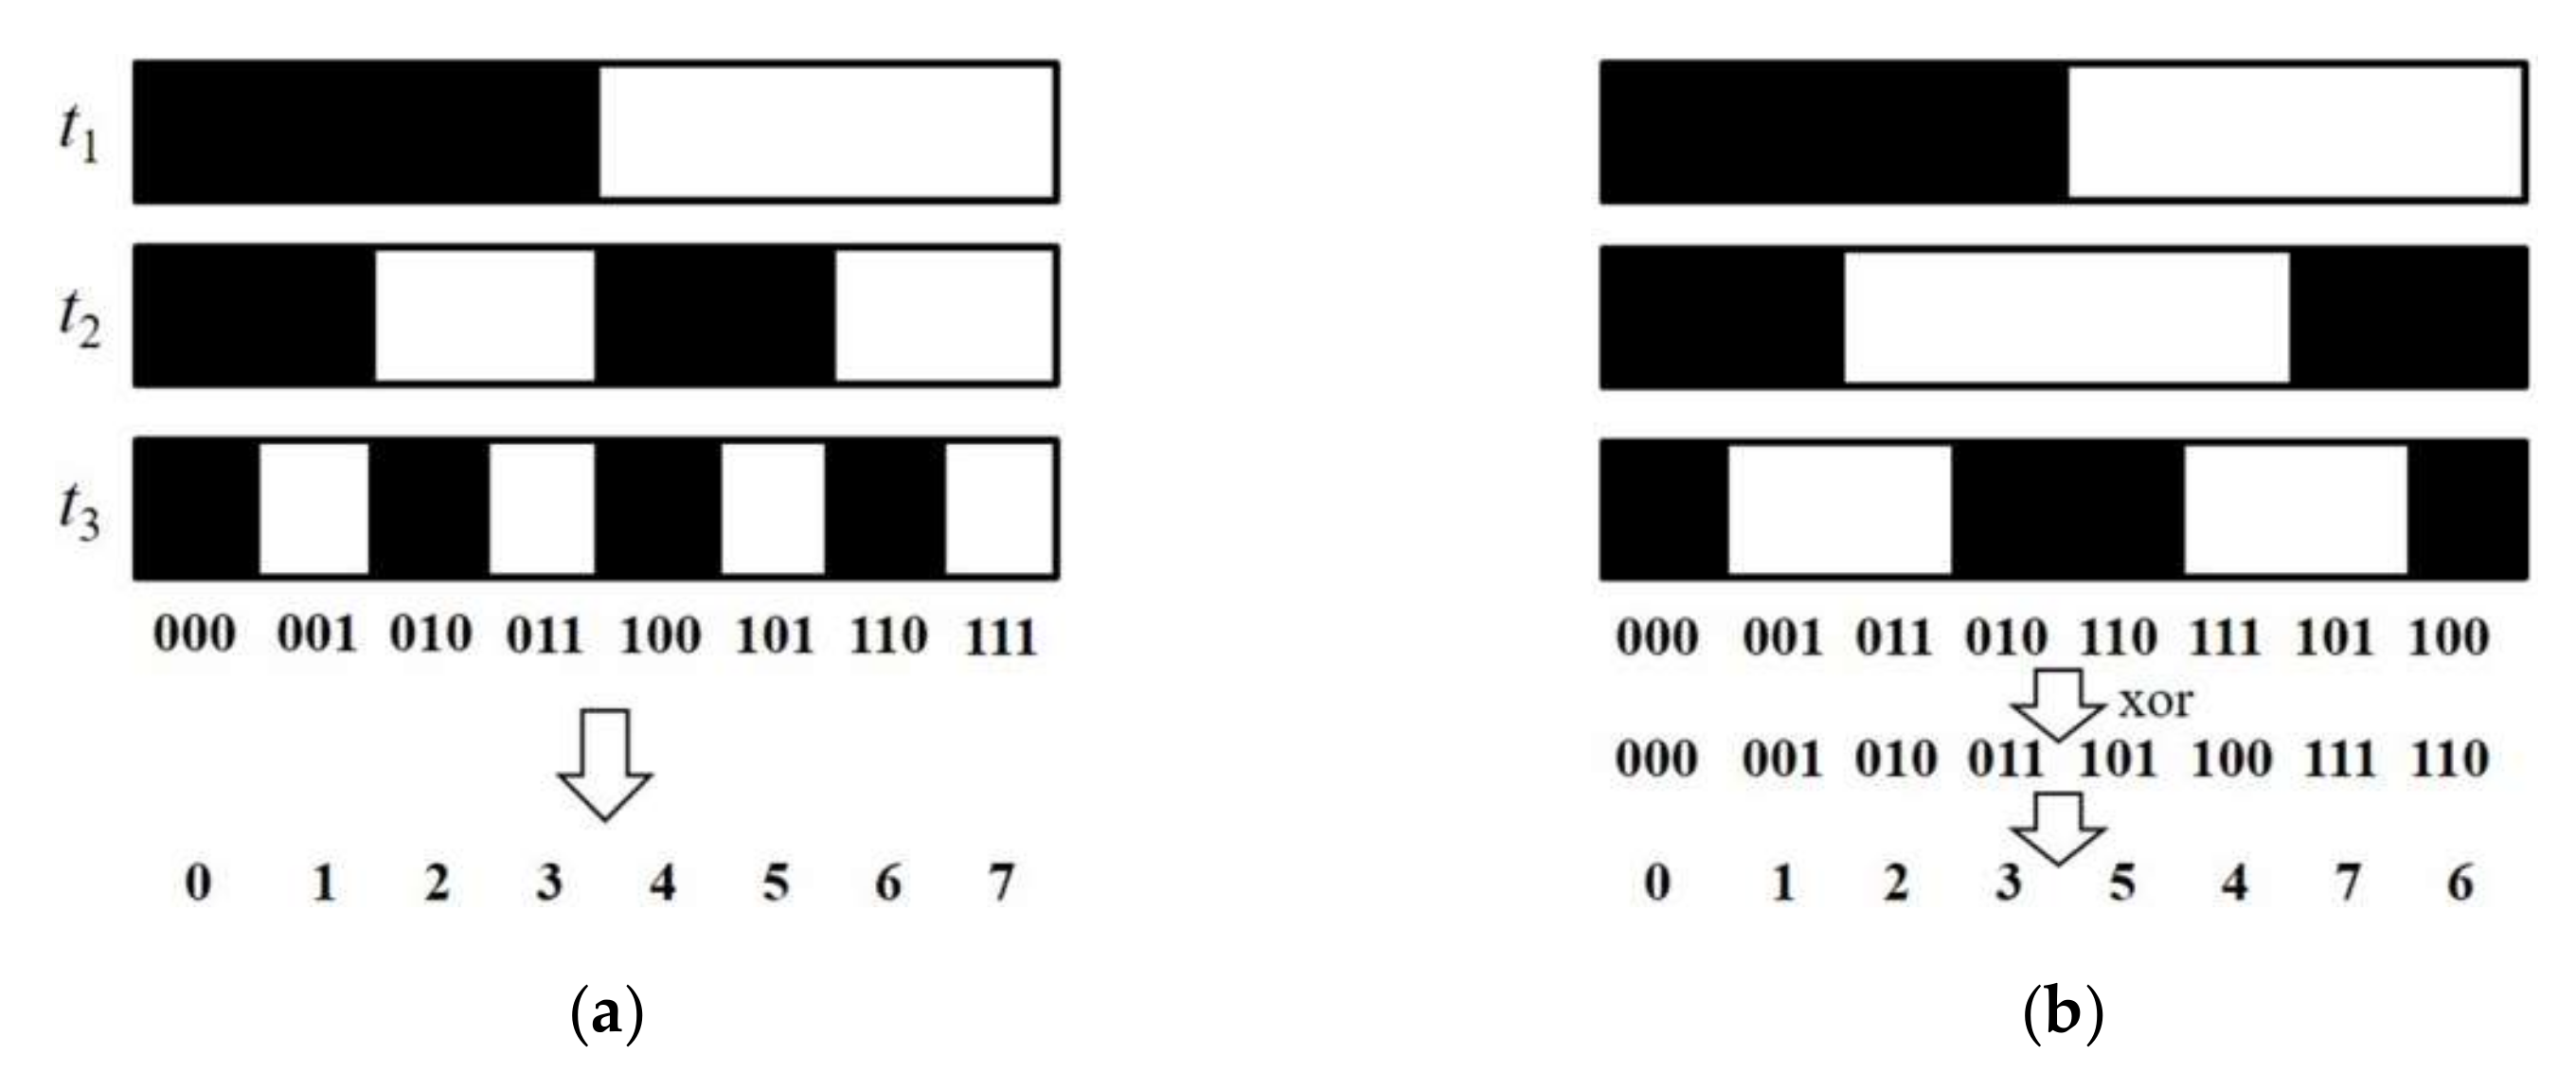
Figure 13.
Measurement results of the proposed DIC assisted PSP method [101]. (a–d) The captured fringe images and speckle images from left and right cameras; (e) absolute phase map from left camera; (f) phase deviation between proposed method and multi-frequency method; (g) statistical histogram of (f); (h) disparity map; (i) disparity deviation between proposed method and multi-frequency method; (j) statistical histogram of (i); (k) 3D point cloud; (l) 3D surface reconstruction result.
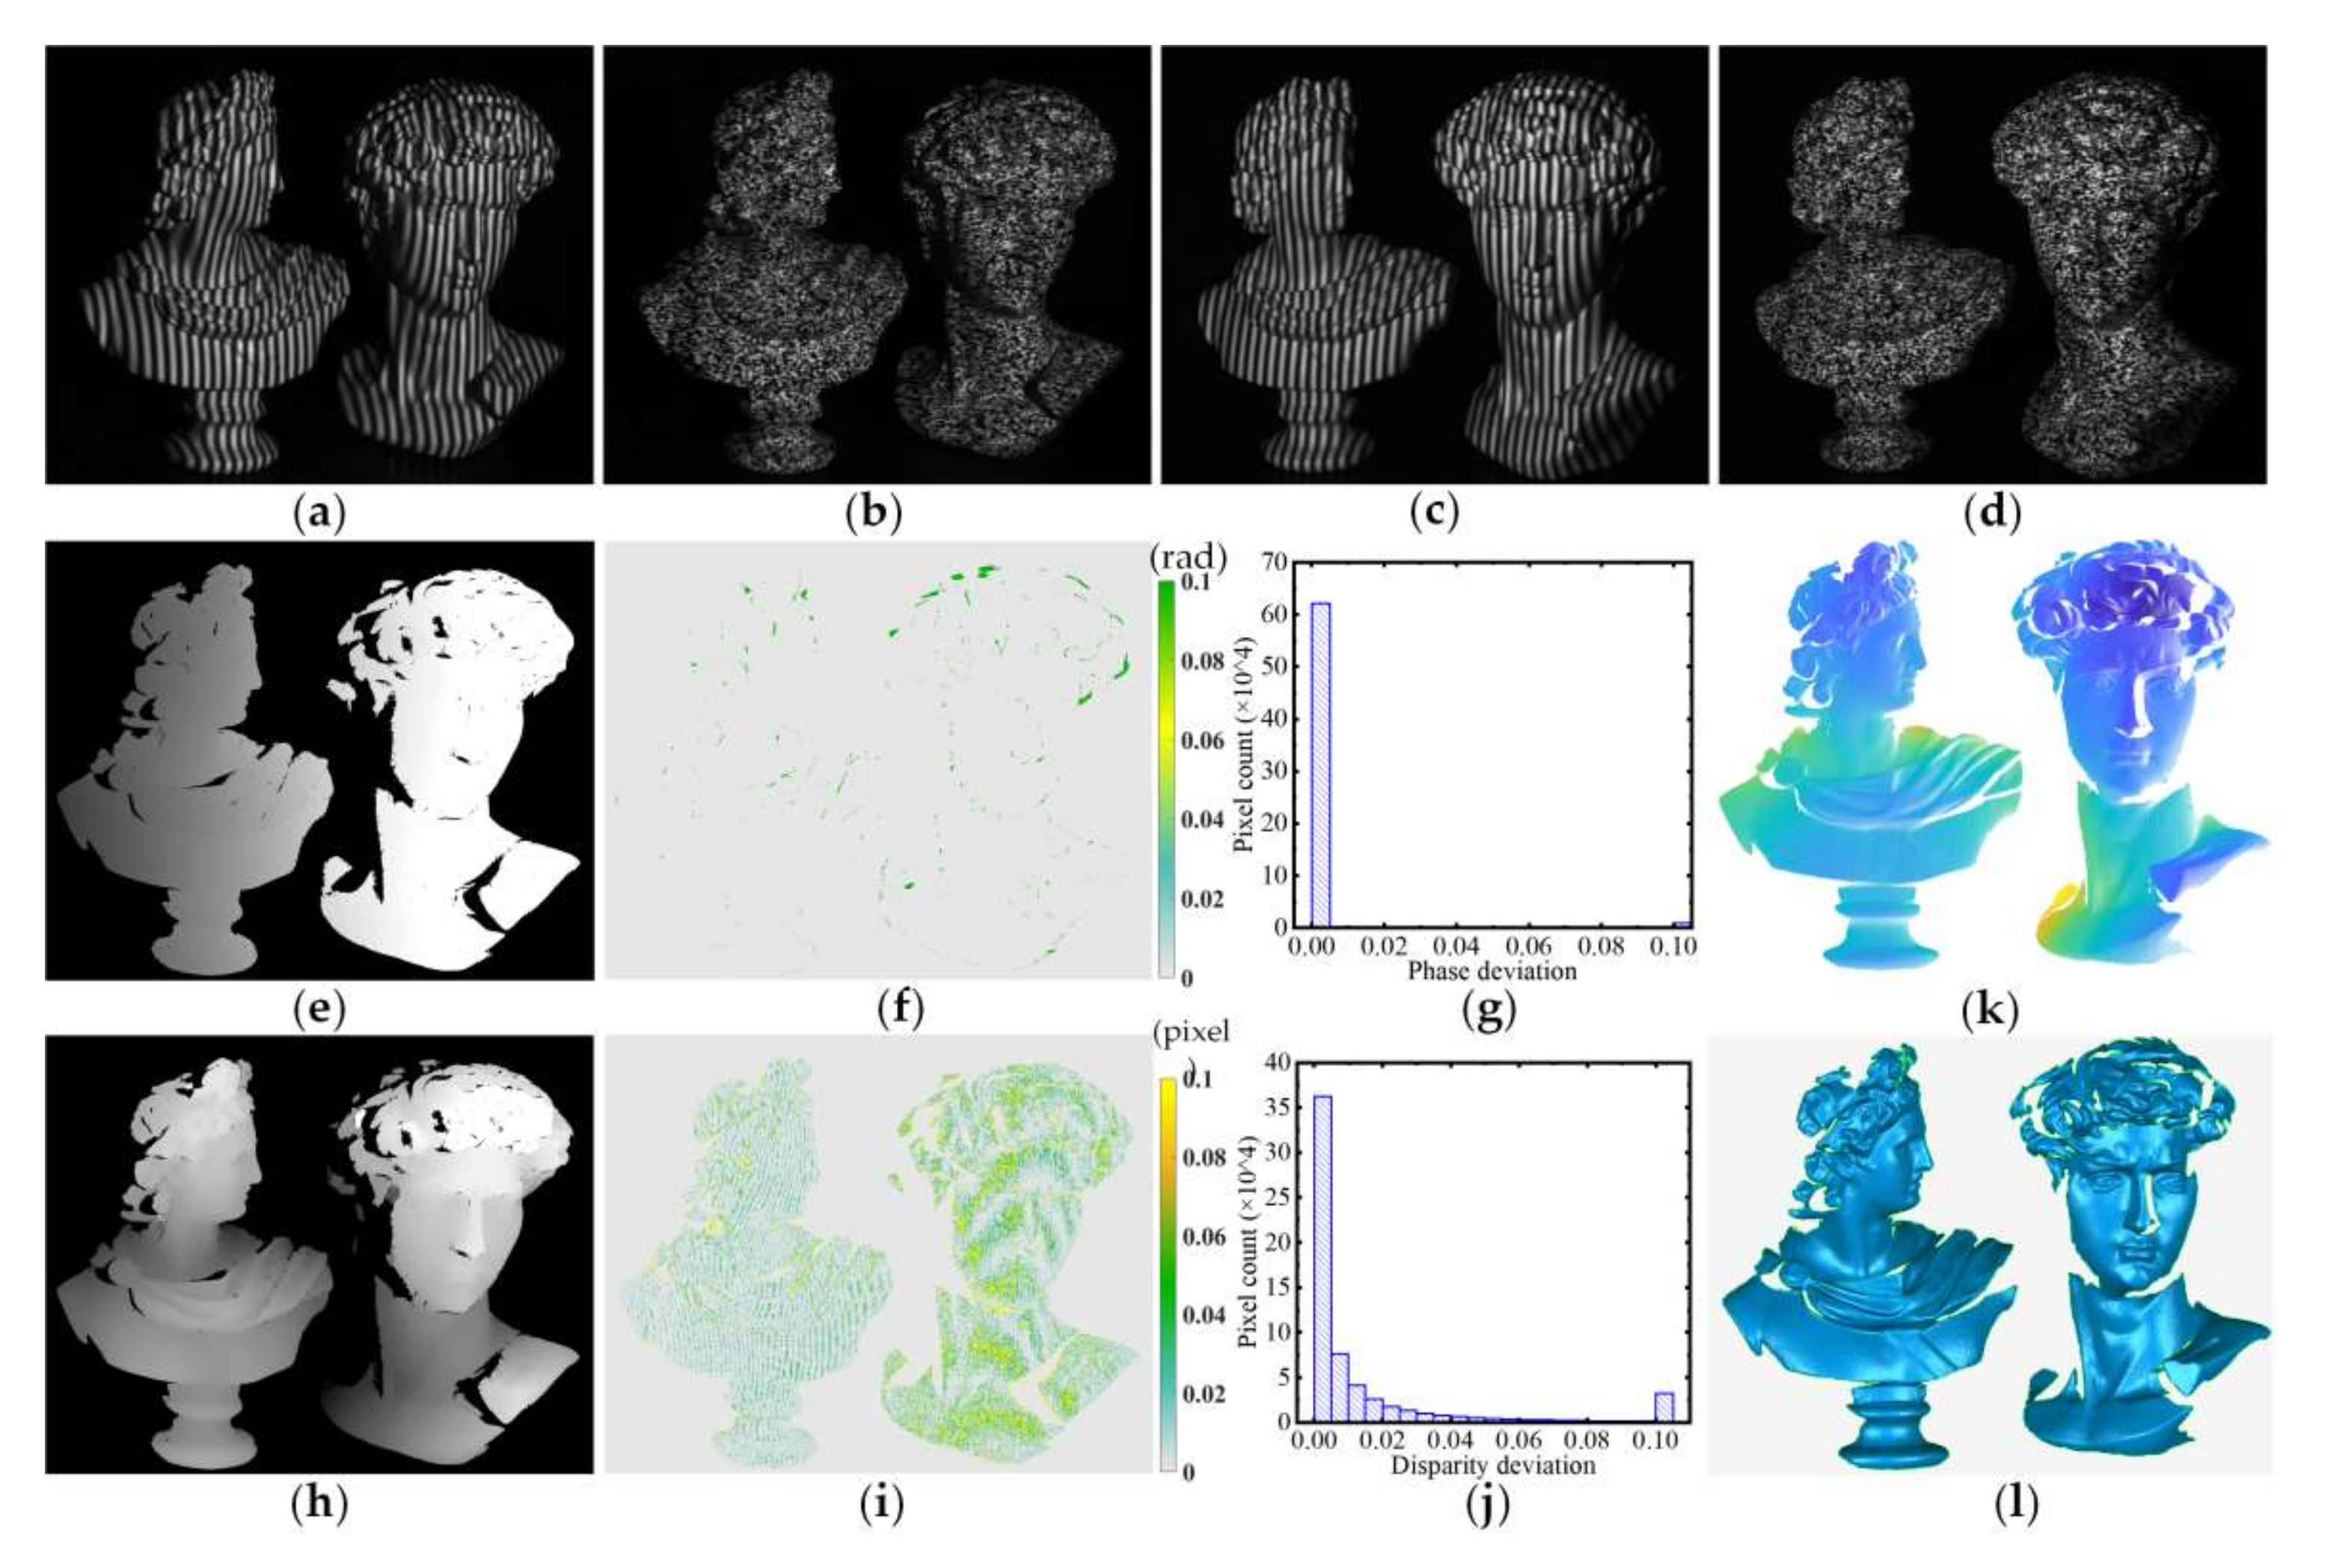
Figure 14.
Flowchart of non-end-to-end learning methods.
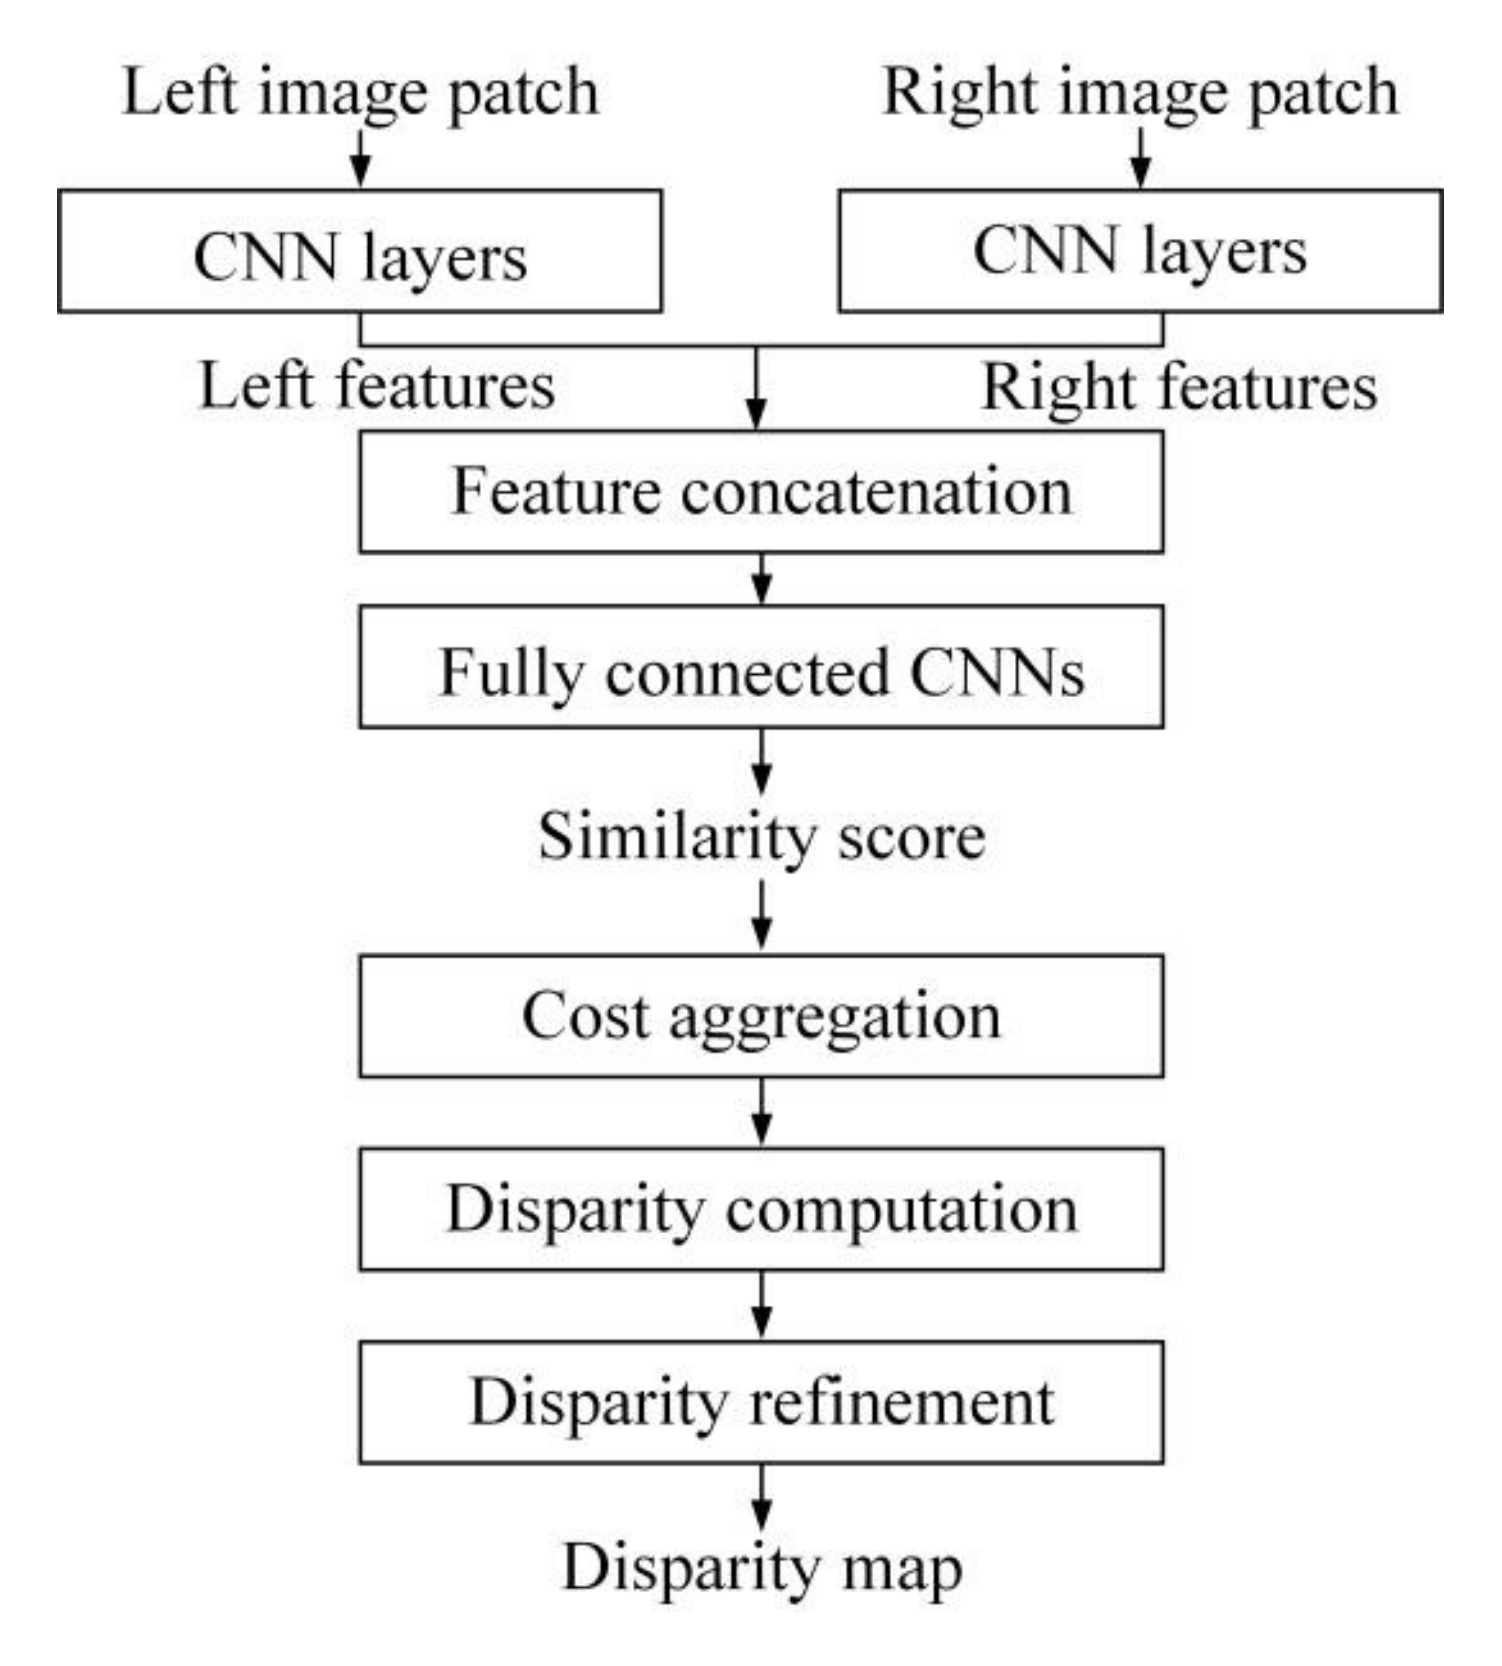
Figure 15.
Flowchart of GC-Net.
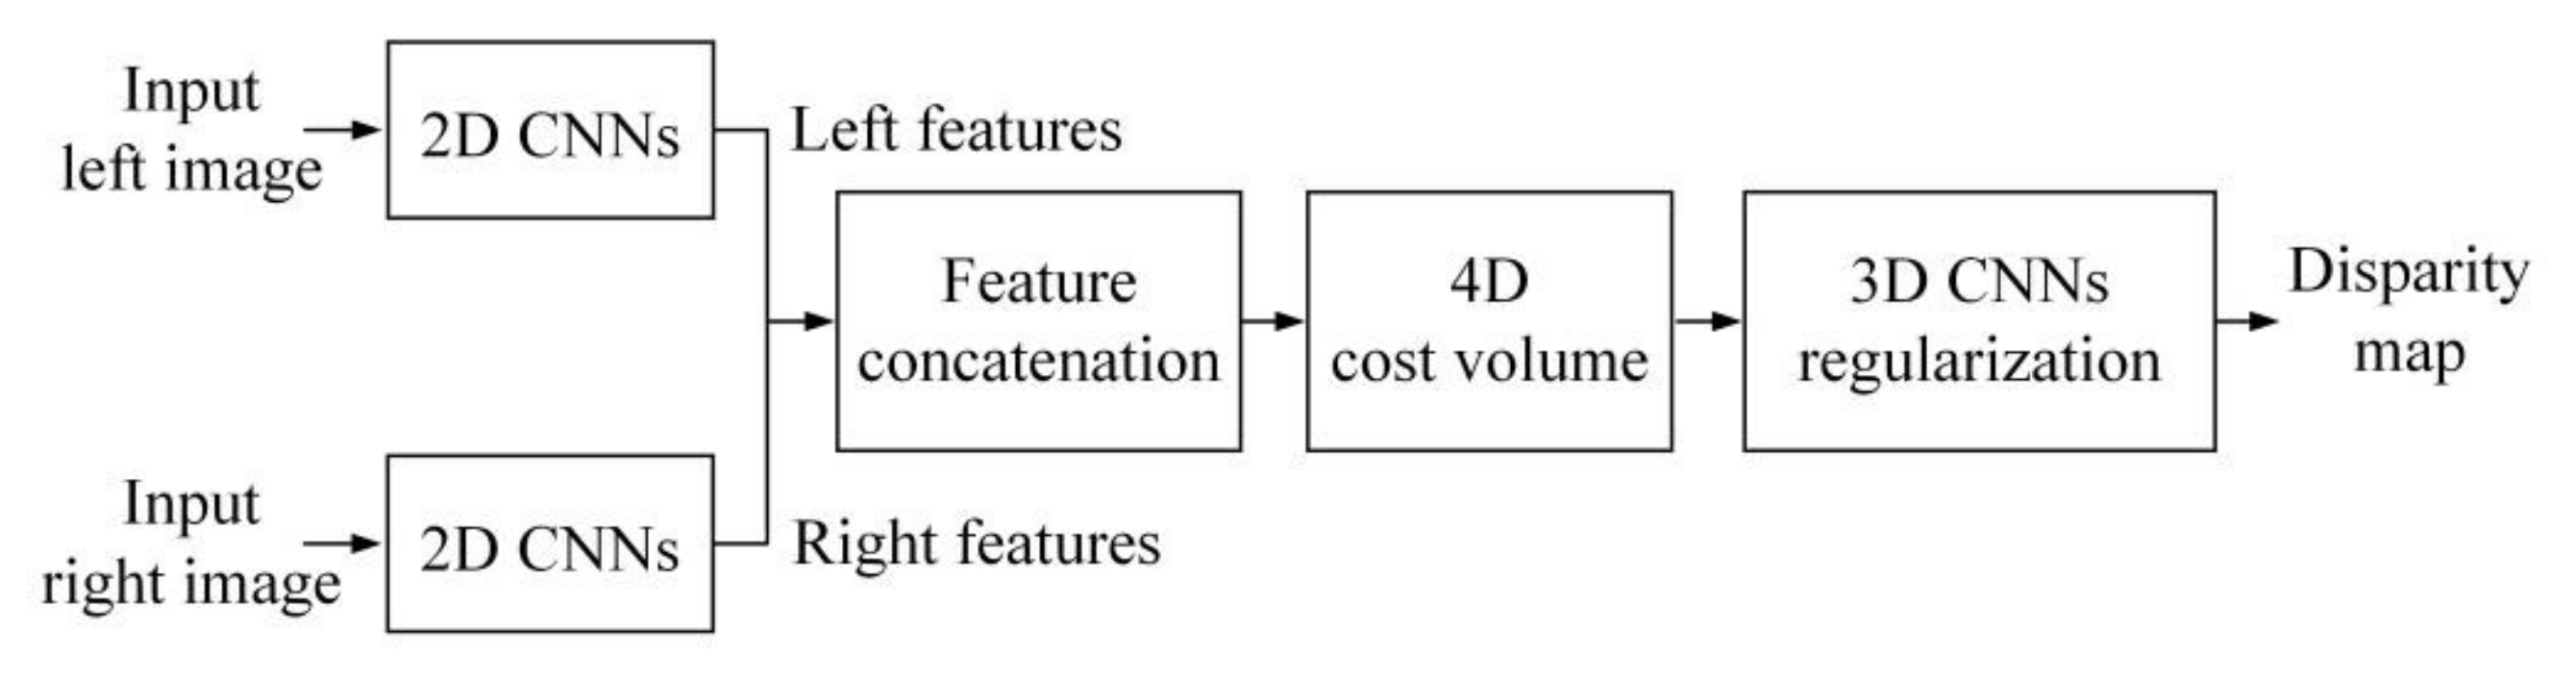
Figure 16.
Flowchart of GA-Net.

Figure 17.
Flowchart of ActiveStereoNet for RSP 3D measurement.
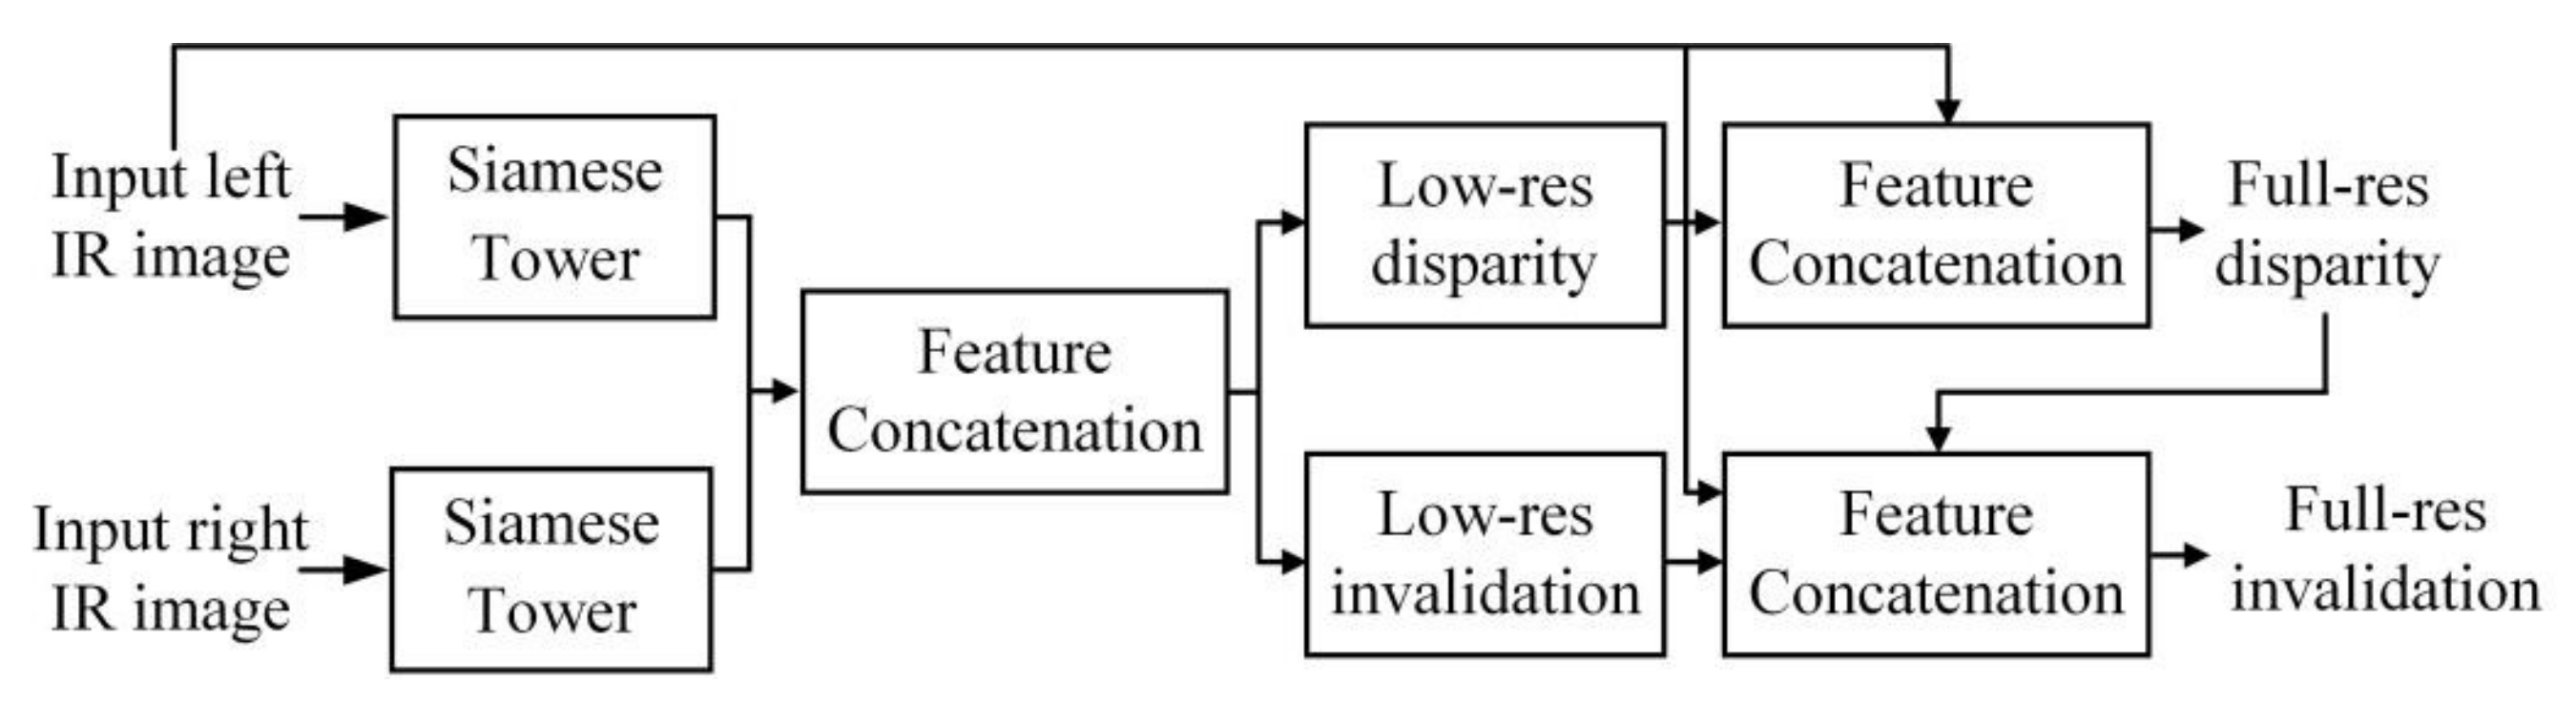
Figure 18.
Flowchart of phase extraction using CNNs.
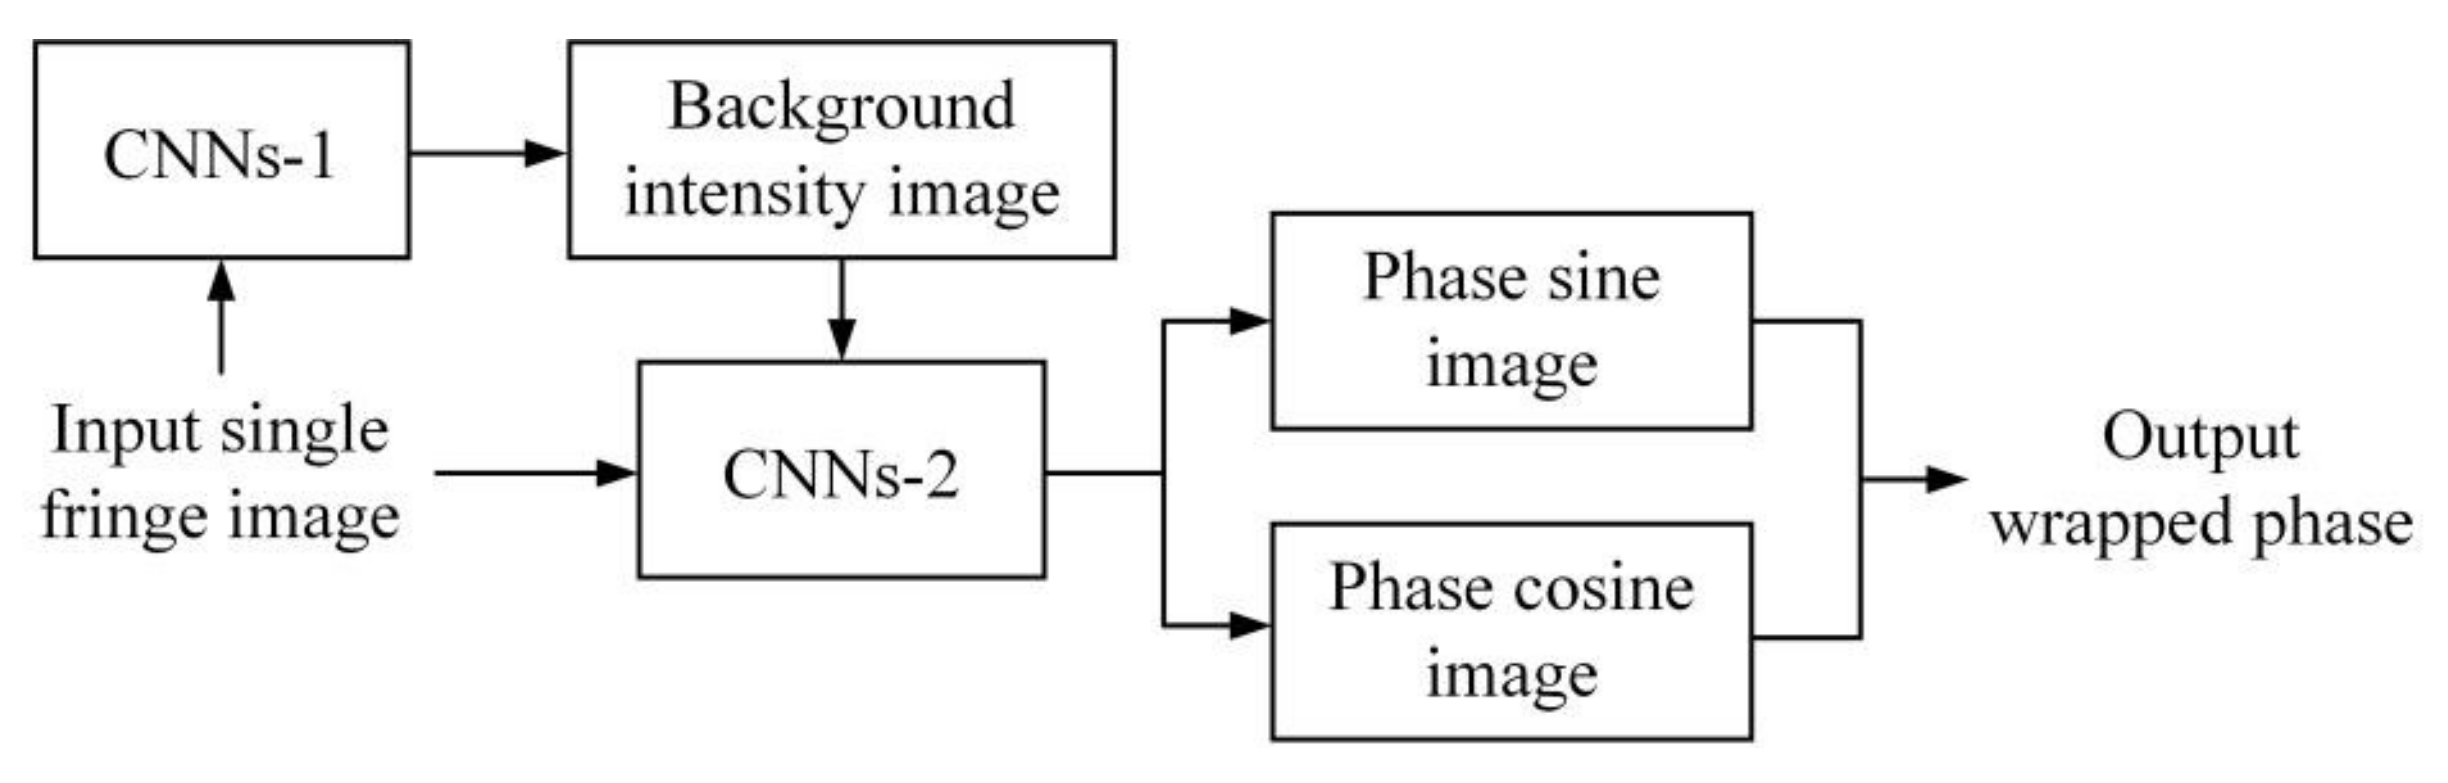

Table 1.
Comparisons of different vision-based 3D shape measurement methods.
| Methods | Hardware Configuration | Performance | Applicable Occasion | |||
|---|---|---|---|---|---|---|
| Number of Cameras | Lighting Device | Resolution | Representative Accuracy | Anti-Interference Capability | ||
| Stereo vision | 2 | None | Low | 0.18/13.95 mm (1.3%) [52]; 0.029/24.976 mm (0.12%) [53] | Medium | Target positioning and tracking |
| 3D laser scanning | 1 or 2 | Laser | Medium or high | 0.016/2 mm (0.8%) [15]; 0.05/60 mm (0.8%) [60,61]; 0.025 mm with the scanning area of 310 × 350 mm2 (CREAFORM HandySCAN) | High (against ambient light) | Static measurement for surfaces with high diffuse reflectance |
| RSP | 1 or 2 | Projector or laser | Medium | 0.392/20 mm (2%) [64]; 0.845/20 mm (Kinect v1) | Low (high sensitivity to noise) | Easy to miniaturize for use in consumer products |
| Binary coding projection | 1 or 2 | Projector | Medium | 0.098/12.6994 mm (0.8%) [76] | Medium | Static measurement with fast speed but relatively low accuracy |
| FTP | 1 or 2 | Projector | High | 0.2/35 mm (0.6%) [82] | Medium | Dynamic measurement for surfaces without strong texture |
| PSP | 1 or 2 | Projector | High | 0.02 mm within a 200 × 180 mm2 field of view [101]; up to 0.0025 mm (GOM ATOS Core) | Medium or high | Static measurement for complex surfaces with high accuracy and dense point cloud |
Publisher’s Note: MDPI stays neutral with regard to jurisdictional claims in published maps and institutional affiliations. |
© 2022 by the authors. Licensee MDPI, Basel, Switzerland. This article is an open access article distributed under the terms and conditions of the Creative Commons Attribution (CC BY) license (https://creativecommons.org/licenses/by/4.0/).
Share and Cite
MDPI and ACS Style
Zhang, G.; Yang, S.; Hu, P.; Deng, H. Advances and Prospects of Vision-Based 3D Shape Measurement Methods. Machines 2022, 10, 124. https://doi.org/10.3390/machines10020124
AMA Style
Zhang G, Yang S, Hu P, Deng H. Advances and Prospects of Vision-Based 3D Shape Measurement Methods. Machines. 2022; 10(2):124. https://doi.org/10.3390/machines10020124
Chicago/Turabian StyleZhang, Guofeng, Shuming Yang, Pengyu Hu, and Huiwen Deng. 2022. "Advances and Prospects of Vision-Based 3D Shape Measurement Methods" Machines 10, no. 2: 124. https://doi.org/10.3390/machines10020124
Note that from the first issue of 2016, this journal uses article numbers instead of page numbers. See further details here.