
Signal Processing of Acoustic Data for Condition Monitoring of an Aircraft Ignition System

Integrated Vehicle Health Management Centre, School of Aerospace, Transport, and Manufacturing, Cranfield University, Bedfordshire MK43 0AL, UK
*
Author to whom correspondence should be addressed.
Machines 2022, 10(9), 822; https://doi.org/10.3390/machines10090822
Submission received: 23 July 2022
/
Revised: 10 September 2022
/
Accepted: 14 September 2022
/
Published: 19 September 2022
(This article belongs to the Special Issue Fault Detection, Diagnosis and Prognostics of Machines: Applications and Advances)
Abstract
:Degradation of the ignition system can result in startup failure in an aircraft’s auxiliary power unit. In this paper, a novel acoustics-based solution that can enable condition monitoring of an APU ignition system was proposed. In order to support the implementation of this research study, the experimental data set from Cranfield University’s Boeing 737-400 aircraft was utilized. The overall execution of the approach comprised background noise suppression, estimation of the spark repetition frequency and its fluctuation, spark event segmentation, and feature extraction, in order to monitor the state of the ignition system. The methodology successfully demonstrated the usefulness of the approach in terms of detecting inconsistencies in the behavior of the ignition exciter, as well as detecting trends in the degradation of spark acoustic characteristics. The identified features proved to be robust against non-stationary background noise, and were also found to be independent of the acoustic path between the igniter and microphone locations, qualifying an acoustics-based approach to be practically viable.
1. Introduction
The auxiliary power unit (APU) is one of the key systems in aircraft. Its function is to supply electrical and pneumatic power during ground operation, and in the event of in-flight emergencies. An APU is a gas-turbine engine that is composed of multiple integrated sub-systems that are prone to degradation during operation. The APU has been reported to be one of the major drivers of aircraft maintenance [1], with an associated $4 billion worth of maintenance, repair, and overhaul costs reported within a single year (2018). These costs and activities increase further when operations are disrupted as a result of unscheduled maintenance. Around 10% of the time, startup failure has been reported to be the cause of such disruptions [2]. Some possible causes of startup failure can result from degradation of the starter motor [3], or anomalies in the fuel or ignition system [4].
An APU’s ignition system is responsible for generating a series of sparks to initiate the combustion process. The ignition system comprises an exciter that provides high-voltage signals to an igniter, and is activated by the APU controller during predefined ranges of rotational speeds. Any degradation/failure in the ignition system leads to weak and/or inconsistent sparks, which can delay the combustion process to such an extent that the APU does not reach the desired level of acceleration required for a successful startup. Therefore, monitoring of the ignition system is desirable so that any deviation from the designed characteristics can be detected in the early stages of component degradation; thus, monitoring can support proactive maintenance and prevent APU failures. The industry is proactively working towards the development of innovative strategies that can enable reductions in maintenance costs [5]. For legacy systems, developing a means for ignition system monitoring is challenging due to the lack of technical data [6] from the APU built-in test equipment (BITE). Furthermore, retrofitting any additional intrusive sensors will require hardware modifications, and may also impose additional testing and certification requirements.
A novel approach to support condition monitoring can be implemented by incorporating microphones that are installed in the near periphery of APU key sub-systems. This is a convenient, non-intrusive, readily deployable approach. The microphones do not interfere with the safety and performance of the machines, and therefore should not require extensive efforts for certification. For an APU ignition system, continuous analysis of the acoustics that are associated with spark discharge may provide useful information about the health of the system. During a spark discharge, an ionization process takes place that creates a channel of ionized gas between the electrodes; this gas expands as a result of intense Joule heating. The process radiates an intense shock wave that transforms into an acoustic pressure pulse that propagates into the surrounding medium at the local speed of sound [7,8]. This research aims to conduct a feasibility study on the implementation of spark acoustic characteristics to support an APU ignition system diagnostics solution.
1.1. Boeing 737-400 APU
In order to support successful implementation of the research addressed in this paper, experimental testing was conducted on an APU in situ. Cranfield University’s ground demonstrator Boeing 737 (B737) aircraft was utilized to support the experimentation. As illustrated in Figure 1a, the reference APU is shielded by a fire enclosure and is installed inside the tail section of the aircraft. As per the specifications provided in the aircraft maintenance manual (AMM), the APU is a single shaft gas-turbine engine that provides auxiliary power (electrical and pneumatic) to the aircraft using an electrical generator and pneumatic flow from the load compressor (LC) (see Figure 1b). The power section consists of a centrifugal compressor, reverse annular flow combustor, and a radial turbine. The compressor and turbine are mounted on the same shaft, and rotate at a constant (63,830) rpm throughout the APU operating modes. The APU pneumatic system consists of a load compressor, inlet guide vanes (IGV), surge control valve (SCV), and bleed valve (BV). The APU draws air from the atmosphere through an inlet door at the side of the fuselage, which remains open only during operation. The overall operation of the APU is controlled by a full authority digital engine controller (FADEC), which is installed in the cargo compartment. One of our previous studies [9] reported further on the details of the reference APU’s operation and parameters. Herein, our focus is on the startup operation of the APU.
The APU’s startup system consists of a starter motor assembly and ignition system (ignition exciter, igniter, and igniter lead). Aircraft DC power is required to start the APU, which can either be provided externally or by using onboard batteries. This power is utilized by the starter motor to spool up the APU so that the fuel and air mixture reaches the combustor. As per the AMM, from 7–95% of the rated rpm (7768–60,638 rpm), the ignition system is energized using the same DC power to produce a series of sparks that initiates combustion. In the case of a fault or degradation in any of the components of the ignition system, the combustion process will not initiate. Under such conditions, the FADEC terminates the startup sequence, and a ‘No Flame’ error is displayed.
The most common type of degradation that is associated with the igniters stems from their tips being exposed to water or ice, as well as due to their intrinsic wear and tear. As per the AMM, as illustrated in Figure 2, the wear can appear as erosion or damage to the outer surface. This can increase the gap between the electrodes to such an extent that the supplied voltage is unable to produce a spark, consequently leading to the loss of sparks during the startup sequence. On the other hand, a faulty ignition exciter will not produce a series of sparks at the desired frequency, or may not generate the desired voltage to produce a spark. Furthermore, a degraded igniter cable can also lead to a reduction in the amount of electrical energy that is supplied to the igniter, which can result in similar effects.
1.2. Literature Review
Condition monitoring of the ignition system can be performed by monitoring the high-energy voltage pulses at the output of the exciter [11]. However, the proposed analog circuitry needs to be electrically coupled with the ignition exciter, and should incorporate a safety mechanism while handling the high voltages. A similar solution was also reported [12] which determines the time period required for the current in a capacitive discharge ignition system to decay to a zero-ampere level, as an indicator of system health. In [13], it was suggested to use the accumulated number of spark counts as an indication of the wear on an igniter. However, this approach makes use of the commanded number of sparks from the engine controller, and does not utilize the actual number of sparks that may be taking place for more accurate results. A different methodology was presented in [14], which proposed the utilization of a spark detector and a pressure transducer to detect faults in the igniter. For a degraded igniter, the spark gap increases to such an extent that sparks do not take place at high ambient pressures. Such a solution requires intrusive sensors with associated hardware complexities that can withstand the harsh environment of the combustor. The safety measures recommended by [15] can ensure the reliability of the spark plugs in a gas turbine, but they require human involvement, and the procedures cannot be automated.
From the perspective of signal processing, the impulsive nature of the spark signal makes it comparable to the signals that are generated by faulty gears [16] and bearings [17,18,19,20,21]. However, during such studies, vibration sensors are used, and the foremost aim is to detect such signals without further characterization of the detected time domain signal; this could be used as a potential metric for monitoring the state of degradation. The reported acoustics-based condition monitoring applications are limited, and the experimentation is generally conducted in controlled environments. The research reported in [22] on bearings is among such examples. The applications where microphones have been used for impulsive sound detection are dissimilar to the scope of this paper (for example, for gunshot sound detection [23], detection of partial discharges on electrical transmission lines [24], and direction-finding applications [25]), but the underlying methodologies can be modified for the current application. The study conducted by [26] offers useful insight into spark characteristics, but the methodology used an elaborate set of sensing mechanisms that make it unsuitable for online condition monitoring.
The electrical and acoustic characteristics of spark discharge have been greatly studied by the research community. A study conducted by [27] extensively analyzed the time domain and frequency domain characteristics of acoustic radiation from electrical spark discharge, and related the time domain signal with N-wave acoustic pressure waves. A study by [28] investigated the directional characteristics of sparks, and found that the angular position of the microphone affects the widths and peak sound pressures of the received pulses. The authors in [29] observed the acoustic characteristics of lighting current discharge as a function of peak values of discharge currents. Spark characteristics have also been studied for enabling their utilization in studying acoustic phenomena on scale models [7]. The research by [30] focused on the electrical characteristics of sparks, and correlated them to variations in the capacitance, voltage, and spark gap. The above experiments were conducted in controlled environments using high sampling rates so that each acoustic pulse was clearly visible without corruption from background noise, multi-path reflections, and distortions due to low temporal resolutions. For an aircraft APU, such conditions cannot be achieved because of the presence of background noise from APU operation, as well as from multi-path effects caused by the acoustically reflecting aircraft surfaces around it. The requirement of a very high sampling rate for acoustic data acquisition cannot be satisfied, as it demands more complex hardware which is incompatible for onboard applications.
1.3. Scope of Research
In light of the aforementioned literature, there exists a gap in knowledge regarding the investigation of spark acoustic characteristics for online condition monitoring. The research addressed in this paper is dedicated to the evaluation of ignition system spark acoustic characteristics that can be implemented to support an ignition system diagnostics solution. The overall strategy involves the collection of data from microphones installed in the periphery of the APU sub-systems, and the exploration of features that can enable the conversion of noise into meaningful information for condition monitoring. The outcome of this research suggests that a well-placed microphone can capture certain characteristics of the sparking sound, which can potentially be employed to support an ignition system fault diagnostics solution. The paper is organized as follows: Section 2 describes the experimental setup utilized for this study; Section 3 explains the analyses that were carried out on the acquired data; and Section 4 presents the results.
2. Experimental Data Collection
For this study, experimental data were acquired from Cranfield University’s Boeing 737-400 aircraft APU. Multiple PCB Piezotronics 130F20 ¼ inch IEPE microphones were installed around the APU, as shown in Figure 3a. The microphones had a sensitivity of 45 mV/Pa, and a flat frequency response in the 20 Hz–20 kHz range. They were integrated with NI-DAQ using NI-9234 modules which sampled the acoustic data at 51.2 kHz for each channel. The sensitivity of the selected microphones and voltage limit of ±5 V of the NI-9234 modules allowed noise data acquisition with peak noise levels up to 111 Pa or 134 dB. Six of the nine microphones were placed inside the fire enclosure, two were installed outside but inside the APU compartment, while one microphone (shown as FF in Figure 3) was placed 10 m away in the far-field of the APU exhaust. Initially, vibration sensors were also considered for this study, but it was found that they were unable to detect any sparks, and were therefore excluded from the detailed study. The low energy produced by sparks is unlikely to induce considerable vibrations in the APU structure, and thus cannot be picked up by vibration sensors.
Initial Analysis and Data Preparation
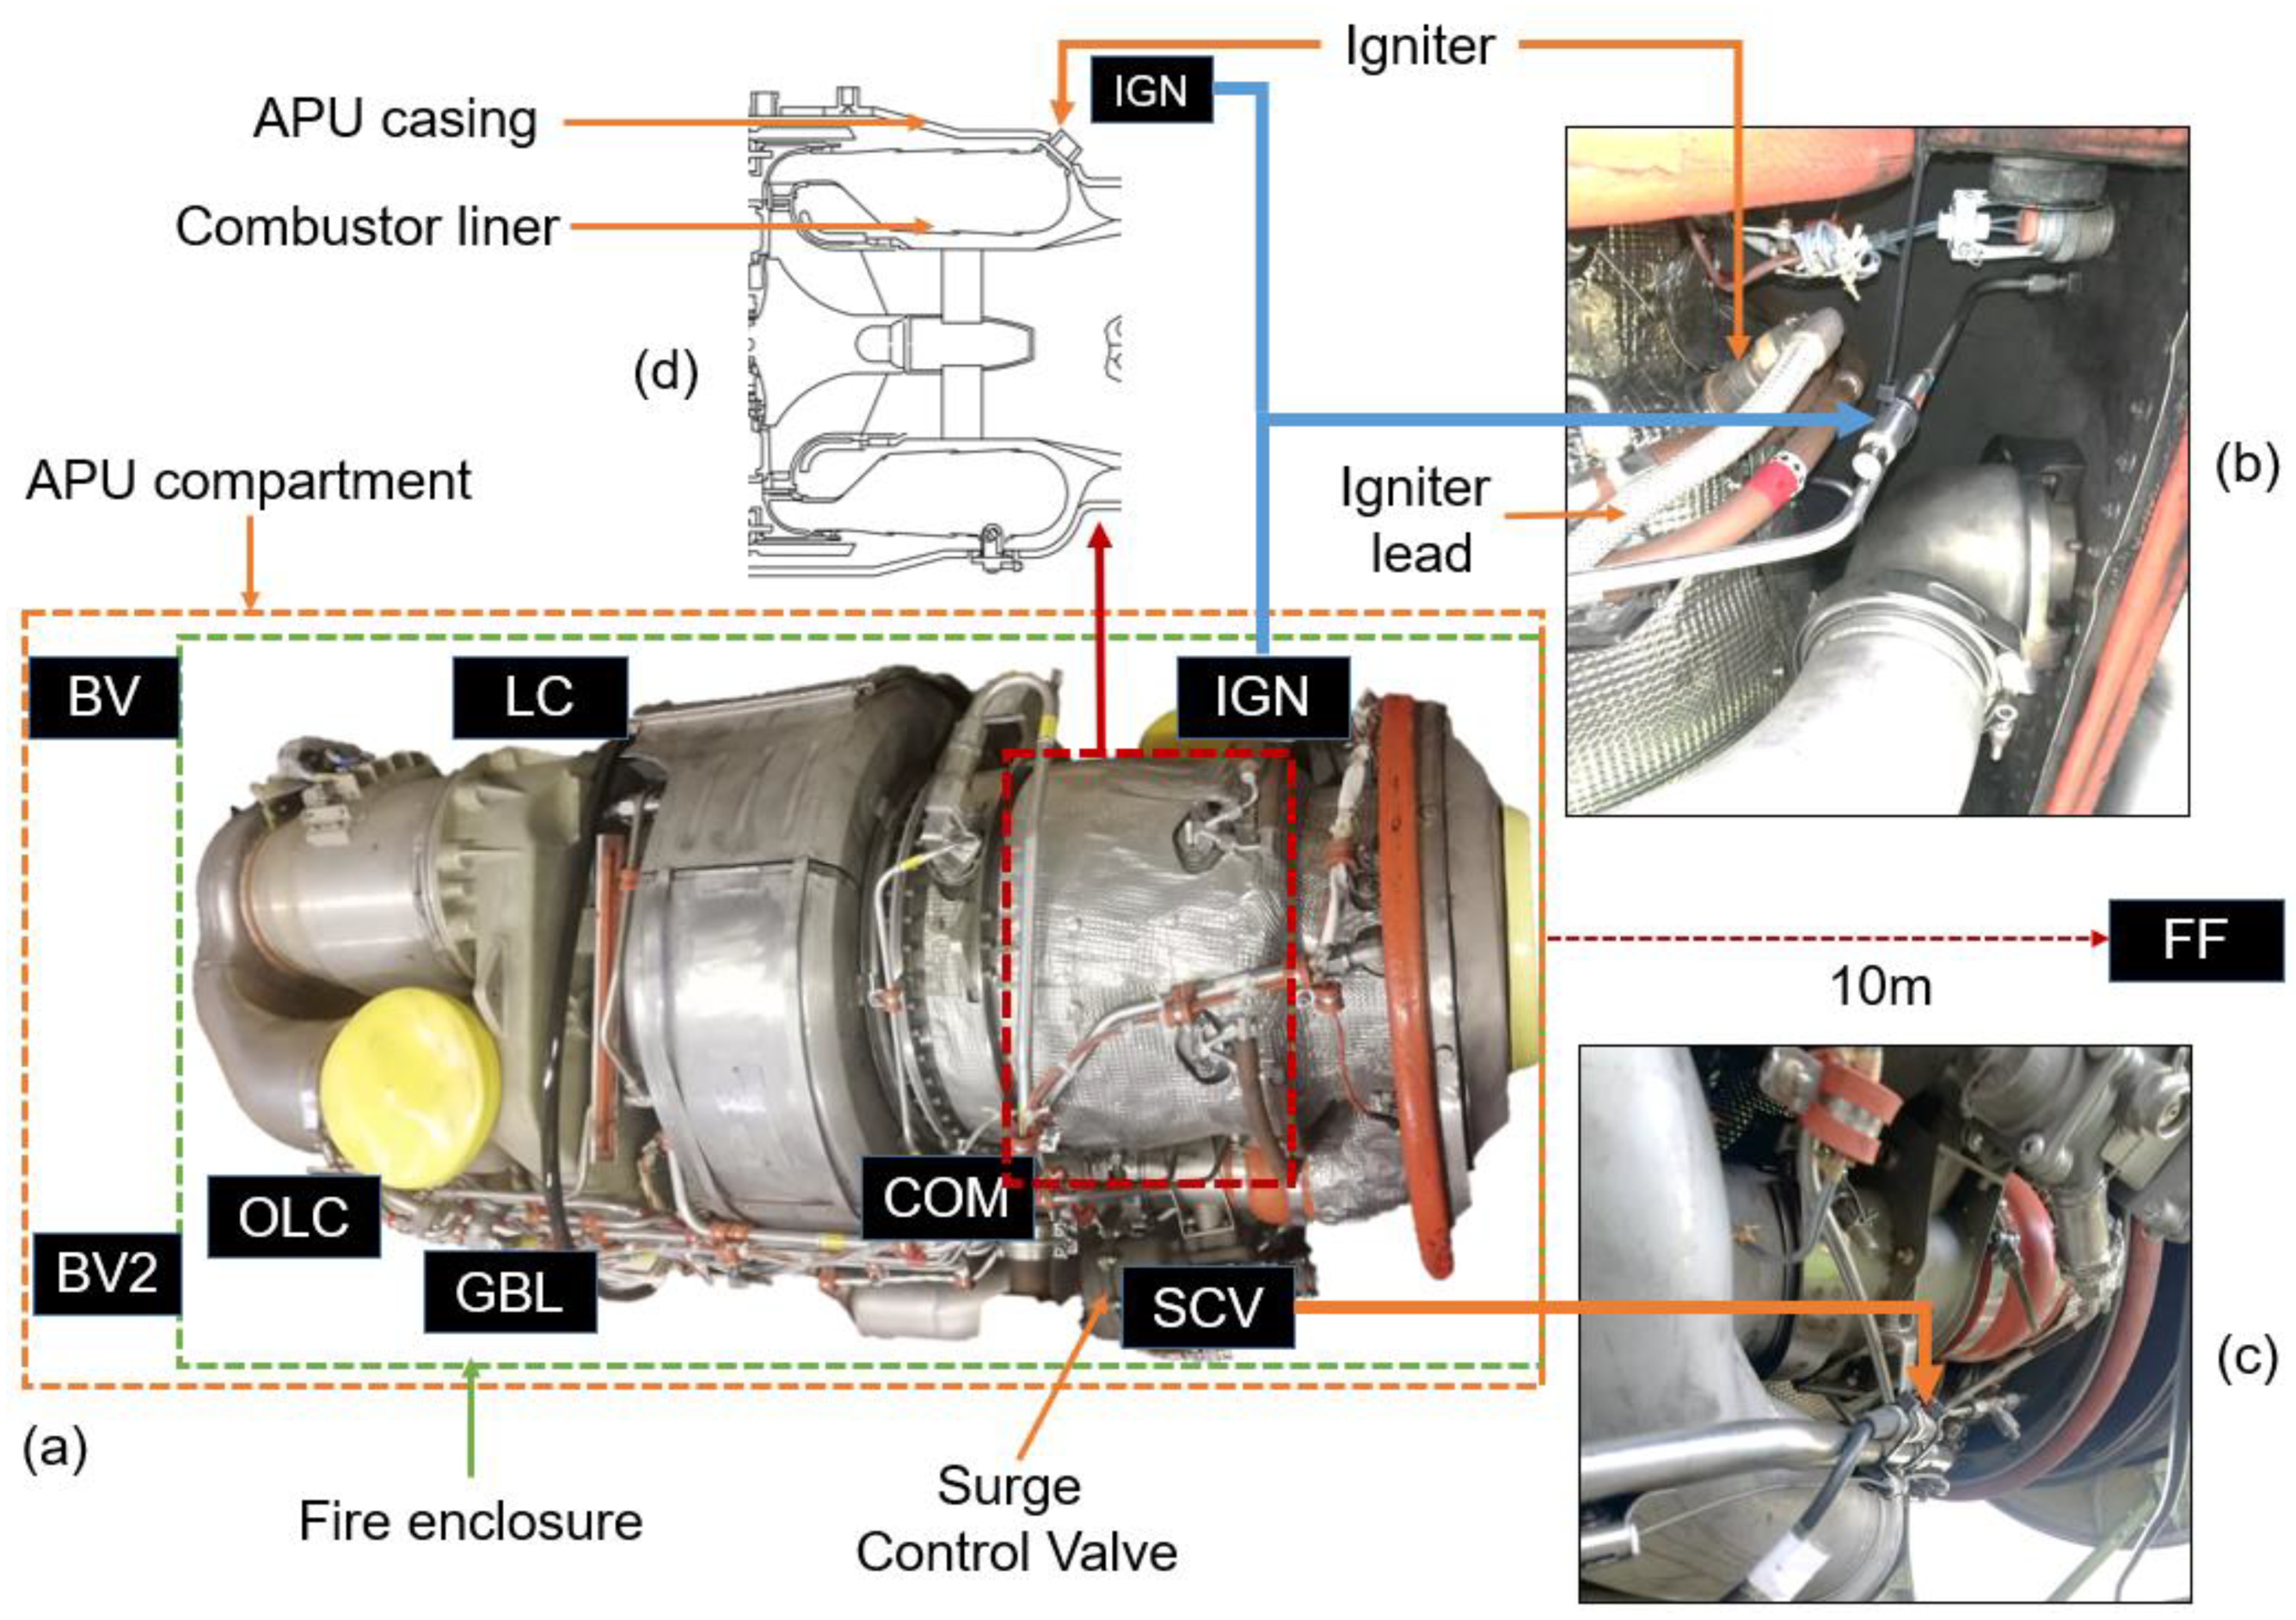
The acoustic data were acquired for APU startups on eight different occasions (represented as a day for the purposes of analysis demonstration), out of which six startups utilized the internal aircraft battery, while the remaining startups used external ground power. On six of these occasions, the aircraft was parked on a taxiway, while the other two experiments were conducted inside a partially enclosed hangar near the runway. Initially, the acoustic data were manually analyzed in order to identify the microphone locations where the spark noise was clear and remained audible for longer durations as the APU spooled up and the background noise increased. In the far-field of the APU, the spark signal was found to degrade sharply as soon as the combustion process initialized, making it impossible to detect the presence of a spark for a longer duration of time. This observation remained the same for all microphone locations where the background noise was high compared to the spark-generated noise. On the other hand, microphones that were placed closest to the igniter (the locations denoted by IGN and SCV in Figure 3b,c) were found to be the most suitable locations to capture spark characteristics, and therefore remained the primary focus of discussion in this paper. The IGN sensor location indicates that the microphone is near the igniter, while SCV specifies the sensor’s proximity to the surge control valve. These two sensor locations are the closest to the igniter, with the SCV being on the opposite side compared to the IGN’s location. Between the igniter and the microphones, there are multiple layers that may incur a shielding effect on the acoustics. These layers can be identified as, amongst others, combustor liner and APU casing (see zoomed-in cross-sectional view of the combustor in Figure 3d).
The acquired data were able to capture most of the events taking place throughout the APU startup sequence, which included: inlet door actuation, starter motor engagement, activation of ignition system from 7–95% rpm, combustion build up, IGVs opening at 45%, starter motor disengagement at 50%, and the APU settling at 100% rpm. Note that to support the spark characteristics evaluation in this paper, only the data segment that represented the spark was implemented. For this purpose, the time duration where the APU rpm was between 7–20% (4468–12,766 rpm) was found to contain information about the spark events; hence, a detailed analysis for this duration is presented in this paper.
3. Employed Methodology
The employed approach to investigate the spark characteristics from the aircraft’s APU startup is presented in Figure 4. There are two steps involved: Step 1 deals with the estimation of spark repetition frequency (), while Step 2 is related to the evaluation of various feature extraction techniques on the acquired spark signals. The initial application of a high-pass filter (Step 0) to suppress background noise was a precursor for each step. For , the envelope spectrum was analyzed to enable visualization of the degree of fluctuations for a given day of operation.
With regards to the second step of the overall approach, each spark signal was separately processed once the average time difference between spark events was known (equal to ). Within each spark event, the signal was further segregated into background noise, and the region between the onset of the spark and the peak acoustic pressure. The onset time for each spark was estimated by analyzing the slope of the acoustic signal, once a moving average filter was applied. The segregated segments were then analyzed using various feature extraction techniques, and their performance was evaluated using various metrics and visual inspection.
4. Results and Discussion
This section presents the results that were acquired through the successful implementation of the developed methodology elaborated in the preceding section. First, the acquired spark acoustics data were analyzed to devise and implement a high-pass filter to address background noise suppression. The filtered data were subsequently evaluated to determine the , their fluctuations, and the acoustic features for each spark throughout the complete data set. Finally, the acquired overall results were assessed to substantiate the potential of employing spark acoustics characteristics to support an online condition monitoring solution for the ignition system.
4.1. Implementation of High-Pass Filter
The noise generated during the spark event can be masked by the background noise. For an APU operating in situ, the background noise is a complex phenomenon. In general, a major part of the background noise stems from the superposition of tonal noise generated by the shaft, compressor blades, cooling fan blades, gears, the broadband noise produced by the combustion process, and acoustical reflections taking place within the APU compartment. The resultant overall background noise during APU startup is non-stationary, which is due to variations in the APU rpm and gradual build-up of the combustion process. The tonal noise dominates the lower frequencies because the rpm is low (e.g., APU shaft frequency is in the range of 75–210 Hz for 7–20% rpm). The combustion noise is also present at low frequencies [9]. Figure 5a shows a portion of one cycle of the sparking sequence; initially, a spark occurs and then gradually fades away into the background noise. In Figure 5b, the power spectrum of these two signals demonstrates that the noise generated by the spark is present for frequencies greater than 5 kHz. This observation is in agreement with the analysis reported in [31].
The application of a high-pass filter with a cut-off frequency of 5 kHz can be a good choice to suppress the no spark characteristics. However, the figure only shows the spark taking place at a very early stage of the startup sequence where the tones generated by the shaft, compressor blades, cooling fan blades, and gears are at lower frequencies. As the APU spools up, these frequencies also increase and begin to overlap with the spark noise frequencies. The impulse noise generated by a spark discharge is almost broadband in nature and peaks at around 10.5 kHz, with a 6 dB/octave drop on either side of the peak [27]. A high-pass filter with an at around 10.5 kHz represents an appropriate filter for suppressing the background noise at the lower frequencies. Therefore, a high-pass filter was applied to the raw acoustic data using MATLAB’s ‘highpass’ function with an kHz transition band steepness and stop-band attenuation of 0.98 and 80 dB, respectively. The filter produced by this function is a FIR filter with 829 coefficients and a stop-band frequency of 10.19 kHz (magnitude response of the filter is shown in Figure 5b).
The acquired results are shown in Figure 6; part (a) of the figure shows the raw signal for the selected duration, as well as how the noise levels progressively increase as the APU spools up. The weak spark signals are not observable in the graph; however, with the application of the high-pass filter, a series of impulse signals emerge after 7% RPM as illustrated in Figure 6b. The instances where the sparking sound was generated are noticeable, and the gradual increase in the background noise level in between these instances is also visible. After 20% of the rated RPM (at 18 s—see Figure 6c), the background was found to significantly increase, which resulted in it completely masking the sparking sound.
4.2. SRF Estimation
Envelope analysis was performed on the filtered acoustic signal to estimate the average . MATLAB’s ‘envspectrum’ function was used for this purpose. It initially computes the envelope of the input signal by taking the absolute of the analytic signal, and then takes the FFT of the envelope. For Day#1 of the operation, the results are shown in Figure 7a for the acquired acoustic data corresponding to location IGN (for location SCV, the results are identical and are not presented to avoid repetition). It can be seen that multiple peaks occurred in the envelope spectrum. The first peak is at 76 μHz, and does not correspond to the time period of the peaks occurring in the envelope signal. The next peak, which occurs at 6.6 Hz, is in line with the periodic spikes in the time series data, and can therefore be regarded as the repetition frequency () of the high-energy impulse signals.
The same analysis was repeated for the complete data set, and the results are presented in Figure 7b. The variation in the source of aircraft power modifies the ; 6.6 Hz on battery, and 8 Hz with external power. A similar variation in the can also occur if there is degradation in the components (resistances and capacitances) that control the repetition frequency; hence, the can be regarded as an appropriate metric to monitor the health of the ignition system. Moreover, the approximate number of sparks () can be estimated for a given startup, even if all of the sparks have not been detected by knowing the and the time required to transition from 7–95% rpm (); that is, the estimate can be obtained as follows:
The time is already known through the FADEC as it monitors the APU rpm. Eventually, the can be accumulated after each startup for estimating the RUL of the igniter. Furthermore, inconsistencies in the sparks that are caused by a fault in the ignition system will broaden the width of the peak, which can also be used as a potential condition monitoring indicator. These widths have been estimated using MATLAB’s ‘findpeaks’ function, and have been placed as bars on top of the values in Figure 7b. During experimentation, the fluctuations in are mostly marginal, with a slight exception on Day#2 (lowest and highest fluctuations). On this day, the APU was powered by the aircraft battery which may not have been sufficiently charged, leading to the low-frequency inconsistent sparks.
4.3. Spark Event Segmentation
Having successfully estimated the , each corresponding impulse signal could be individually analyzed to extract the acoustic features from the region where the spark characteristics were dominant. Each spark signal is composed of background noise, the onset of spark, peak acoustic pressure, and the gradual decay in energy which eventually diminishes due to the presence of the background noise, as shown in Figure 8. The region of significant interest occurs between the onset of the spark (), and the time () where peak pressure is observed. Within this region, spark characteristics are found to be dominant, and less affected by background noise.
In order to estimate , a change detection strategy based on slope values was applied to the moving averaged version of the filtered acoustic signal. In order to do this, an averaging filter with window size = 256 was applied after taking the absolute of the filtered signal; this allowed for the reduction in the background noise while preserving the spark event locations, as shown in Figure 9a. MATLAB’s ‘ischange’ function was then utilized to provide the time location () for each spark event where the highest positive change occurred in the slope of the averaged version of the signal. Figure 9b shows the time () where the rise in acoustic pressure is taking place, which was identified by the function. Using and , the high-pass filtered acoustic data was segmented around each of the spark events, as follows:
| Background noise | |
| Spark signal |
The initial 8 ms of the time was deemed appropriate to represent the background noise. In conjunction with this assumption, using the aforementioned approach, estimates were determined for the rise times that corresponded to each detected spark (). Figure 10 presents the acquired values of for all 8 test days at sensor locations IGN and SCV; the overall variation is captured in the form of boxplots. Each plot shows the range, median (red solid line), and mean (labeled as a black unfilled diamond symbol) values of the rise times on each day at a given sensor location. The median and mean values of remained stable (4–5 ms) for location IGN throughout the data set. For location SCV, large deviations (5–9 ms) were observed. The values also varied, due to the change in surroundings (see plots for SCV for Day#7 and Day#8, where the aircraft was parked inside a semi-enclosed hangar that led to high values of ). Based on the analysis, values were found to be an inappropriate feature to be observed for condition monitoring due to their inconsistent behavior. However, the samples existing between and were useful for characterizing the spark using various features.
4.4. Performance Metric for Feature Evaluation
Several features were computed for the background noise and the spark signal around each spark event. The aim was to identify those features that exhibited stable values across all the sparks for a given day of operation, regardless of the sensor location, while maintaining distinct behavior against the background noise. A performance metric was needed to compare the performance of each feature in terms of similarity between the results at the two sensor locations, and if applicable, its similarity with background noise features. For this purpose, the average values of the coefficients of overlap [32] were selected, and are defined as follows:
- Mean value of the coefficient of overlap between the distribution of feature values computed at the two sensor locations:
Here, is the number of days of data collection, and
In the above equation, and are the probability density functions of a feature at locations SCV and IGN, respectively, for a day ‘’. MATLAB’s ‘ksdensity’ function was used to estimate the probability density function of a feature, and the ‘trapz’ function was employed to perform the required numerical integration after the ‘min’ operation.
- 2.
- Mean value of the coefficient of overlap between the distribution of feature values computed at a sensor location, and for the corresponding background noise:
Here,
where can either be IGN or SCV depending on the selected sensor, and corresponds to the probability density function of the features computed for the background noise, using that sensor on day ‘’.
The values of the above coefficients of overlap (, and ) for a particular feature can range between [0,1]. A stable feature will exhibit very high values for , which means that the feature is insensitive to the change in sensor location. Moreover, it is desirable to have a feature that is dissimilar to the noise characteristics; this corresponds to low values for and . Such a feature will be sensitive to the igniter (or ignition system) degradations, and can therefore be utilized for ignition system condition monitoring.
4.5. Selected Features for Evaluation
Several categories (statistical, spectral descriptors impulsive metrics, and features from visibility graphs) of features were considered in this paper. An initial assessment of the features was done using the defined performance metrics, and the worst performing features were excluded from the detailed analysis. The least performing features were identified using the following criteria:
The low-performing features included, among others, ZCR, kurtosis, skewness, impulse factor, and spectral skewness. As an example, consider the zero cross rate (ZCR) feature that gives the average number of sign-changes in the signal [33]:
where is the sign function, defined as follows:
The ZCR values for the sparks and the background noise were found to be similar (very high values for and ), which shows that the feature is sensitive to the noise present within the spark duration, and is unable to capture any unique characteristics of the spark. Similarly, the kurtosis value was found to be highly sensitive to sensor location, and also indicated the level of Gaussian behavior in the data. Figure 11 shows the box plots for kurtosis values that were computed for the spark and background noise duration for the two sensor locations. The background noise can be seen to have a Gaussian response (kurtosis 3 [34]). For IGN, the mean kurtosis value is around 5–6, while for SCV it is less than 5, and falls as low as 4 for Day#7 and Day#8 (leading to a high value of ). This behavior indicates that the background noise corrupted the acoustic data, even during the sparking event. The low value of 0.62 for is also an indicator of the high level of dissimilarity that existed between the feature values at the two sensor locations.
After carrying out the initial assessment, the following appropriate features were identified for a detailed comparison:
- Peak value after application of moving average filter on the high-pass filtered signal ():
- :where is the high-pass filtered signal around each spark signal, and is the number of samples within the time duration.
- Difference between of spark signal and background noise ():
- Mean ()
- Shape factor ()
- The average number of connected nodes found using a visibility graph (). The horizontal visibility graph was chosen for evaluation, in which two nodes ( and ) are said to be connected only if a horizontal line can be drawn between them that does not intersect any of the intermediate data points [35]:
- Spectral arithmetic mean (
- Spectral geometric mean [
- Spectral flatness (
- Spectral crest (where is the spectral value at bin k, and b1 and b2 are the band edges, in bins, over which to calculate the spectral spread.
4.6. Feature Extraction Results
In this section, the results acquired for the selected feature extraction techniques are presented. The goal of this analysis was to identify features that have the potential to be employed for ignition system condition monitoring purposes. The values of , , and were used as a performance metric to systematically identify the most effective features. Table 1 presents the acquired results for all the selected features against the defined performance metrics. The features were sorted in decreasing order of values.
In terms of similarity with the background noise, the and features were the worst performing. The values of and are 0.07 and 0.13 for and 0.10 and 0.19 for . These numbers indicate the degree to which the feature values for spark and noise resemble one another, thus making them prone to noise. Similarly, the feature is also susceptible to background noise. Lastly, the feature is also slightly affected by background noise if the sensor is far from the igniter (. However, for this feature, the value of is 0.81, which indicates that it does not significantly vary with a change in the acoustic path, and can therefore be a direct consequence of the variations in spark discharge characteristics. Figure 12 shows how the peak values vary for spark and noise duration for the two sensor locations under different days of operation. Several useful observations can be made through the figure: the peak values are higher than the background noise if the sensor is close to the igniter; the mean values are similar (~0.25) across the two sensors; and there is a gradual decrease in the peak values as the time progresses from Day#1 to Day#8. The gradual decrease in these values may be an indicator of the level of degradation in the ignition system. It is to be noted that there was a five-month delay between the first day and the last day of operation, during which it is probable that atmospheric effects may have degraded the igniter. A similar trend was also observed for the feature (see Figure 13), which surpassed all of the other features in displaying a very high value for (0.84). The appears to gradually decrease after each day of operation. This feature corresponded to the energy that was added into the acoustic channel by the spark discharge, and can be an appropriate parameter to ascertain the health of the system.
The feature performed well in terms of its resistance against background noise (see Figure 14). This value refers to the mean number of samples which are horizontally visible in a time series data set. For the background noise, the mean value for the feature was 3.99, while for spark, the values ranged between 3.8 and 0.94. Although had very low values for and ; however, it was sensitive to the sensor location . For SCV, the values reduced for Day#8, which may have been attributed to the increase in the rise times at location SCV (see Figure 10), when more samples of background noise were captured and analyzed within the spark duration.
The results for feature are also interesting (see Figure 15). The value of for noise is zero, while for the spark it is positive for the majority of the data set. The wave that originated from the spark discharge took the shape of an N-wave, which has more energy towards the positive side [7], making the mean > 0. During the propagation of such a wave through a multi-path channel, it is likely that the outcome will also have a positive mean. Variations in the spark discharge characteristics due to ignition system degradation will lead to changes in the shape of the N-wave, which can be manifested in the change in the mean value of the samples taken during the spark duration. The remaining features (, and ) were also found to be highly robust against background noise, regardless of the sensor location ( and . These features, therefore, present strong potential for capturing the characteristics desired to support the development of an online condition monitoring solution. It is noted that, in order to fully comprehend the sensitivities of the acquired features, experimentation should be conducted under an actual degraded/faulty ignition system.
5. Conclusions
An ignition system plays a critical role in the startup of an APU. Failures during APU startup can have safety implications, and lead to disruptions in aircraft operation. The principal function of an ignition system is to generate sparks to initiate combustion. A faulty/degraded ignition system can lead to startup failure(s), compromising aircraft availability and safety. In order to monitor the health of the ignition system, an onboard condition monitoring strategy is needed; it must be universally applicable on any aircraft, with minimum hardware modifications. Existing methodologies require an electrical interface with the ignition system. Moreover, no consideration used thus far was dedicated to exploit the spark acoustic characteristics for formulating an ignition system monitoring solution.
The incorporation of microphones to support the condition monitoring of an APU ignition system have strong application potential due to their inherent non-intrusive and non-interfering nature. However, for an APU, the observation of spark acoustic characteristics can be convoluted, as they are subject to multi-path reflections as well as background noise produced by the turbomachinery components. In this paper, a feasibility study was conducted to determine the potential of using a microphone for monitoring an APU ignition system. The overall study was carried out based on the actual startup acoustic data set that corresponded to a Boeing 737-400 aircraft APU. The devised methodology enabled the translation of the acquired raw acoustic data into ignition system state-indicating parameters. The derived parameters can be compared against healthy limits to detect a fault or degradation in the system. The successful implementation of the reported methodology leads to the following conclusions:
- Signal processing of the raw acoustic data acquired from a well-placed microphone (preferably close to the igniter) can produce condition indicators that are representative of the health of an ignition system.
- A high-pass filter with kHz is suitable to suppress the background noise, while retaining the spark acoustic characteristics up to 20% RPM of the APU.
- Envelope spectrum technique can compute the spark repetition frequency (and the degree of its fluctuations), which can be compared against nominal limits in order to detect inconsistencies in the ignition exciter electrical characteristics (such as input voltage).
- The onset time () can be reliably estimated by detecting the slope of the signal, once a moving average filter has been applied.
- Samples taken between and of each spark pulse are appropriate for computing features that can be used as indicators of the ignition system’s health.
- The results show that there are certain features that are robust against time-varying background noise, and are insensitive to a change in sensor location; thus, these features can be employed as condition indicators. For example, the features and have been found to show a particular trend that is associated with igniter wear taking place over a period of five months.
Author Contributions
Conceptualization, U.A., F.A. and I.J.; methodology, U.A.; software, U.A.; validation, U.A.; formal analysis, U.A.; investigation, U.A. and F.A.; resources, I.J.; writing—original draft preparation, U.A.; writing—review and editing, F.A. and I.J.; visualization, U.A.; supervision, F.A. and I.J.; project administration, I.J.; funding acquisition, I.J. All authors have read and agreed to the published version of the manuscript.
Funding
This research was funded by The Boeing Company as part of the collaboration between The Boeing Company and IVHM Centre, Cranfield University, UK.
Data Availability Statement
Data are available on request.
Conflicts of Interest
The authors declare no conflict of interest, and the funders had no role in the design of the study; in the collection, analyses, or interpretation of data; in the writing of the manuscript; or in the decision to publish the results.
References
- Skliros, C.; Ali, F.; Jennions, I.K.; Fakhre, A. Experimental Investigation and Simulation of a Boeing 747 Auxiliary Power Unit. J. Eng. Gas Turbines Power 2020, 142, 081005. [Google Scholar] [CrossRef]
- Ahmed, U.; Ali, F.; Jennions, I. A review of aircraft auxiliary power unit faults, diagnostics and acoustic measurements. Prog. Aerosp. Sci. 2021, 124, 100721. [Google Scholar] [CrossRef]
- Zhang, Y.; Hanachi, H.; Liu, J.; Yang, C. Model-based degradation inference for auxiliary power unit start system. Eng. Fail. Anal. 2020, 118, 104895. [Google Scholar] [CrossRef]
- Kim, K.; Uluyol, O.; Parthasarathy, G.; Mylaraswamy, D. Fault diagnosis of gas turbine engine LRUs using the startup characteristics. Proc. Annu. Conf. Progn. Health Manag. Soc. 2012, 2012, 93–102. [Google Scholar]
- Jennions, I.K. Integrated Vehicle Health Management-Business Case Theory and Practice; SAE International: Warrendale, PA, USA, 2012. [Google Scholar]
- Esperon-Miguez, M.; John, P.; Jennions, I. A review of Integrated Vehicle Health Management tools for legacy platforms: Challenges and opportunities. Prog. Aerosp. Sci. 2012, 56, 19–34. [Google Scholar] [CrossRef]
- Ayrault, C.; Béquin, P.; Baudin, S.; Ayrault, C.; Béquin, P.; Baudin, S. Characteristics of a spark discharge as an adjustable acoustic source for scale model measurements. Proc. Acoust. 2012, 2012, 5. Available online: https://hal.archives-ouvertes.fr/hal-00810828/document (accessed on 17 August 2022).
- Zel’Dovich, Y.; Raizer, Y. Physics of Shock Waves and High-Temperature Hydrodynamic Phenomena; Academic Press: Cambridge, MA, USA, 1967. [Google Scholar] [CrossRef]
- Ahmed, U.; Ali, F.; Jennions, I.K. Development of a Far-Field Noise Estimation Model for an Aircraft Auxiliary Power Unit. IEEE Access 2021, 9, 127703–127719. [Google Scholar] [CrossRef]
- Boeing. 737-300/400/500: Aircraft Maintenance Manual; Boeing: Seattle, DC, USA, 2015. [Google Scholar]
- Frus, J.R. Diagnostic Device for Gas Turbine Ignition System. US Patent 5,155,437, 13 October 1992. [Google Scholar]
- Gary, R. Hoeflich, Ignition Performance Monitor and Monitoring Method for Capacitive Discharge Ignition Systems. US Patent 5,208,540, 4 May 1993. [Google Scholar]
- Youssef, M. Health Monitoring of Igniters. US Patent 2015/0036781 A1, 5 February 2015. [Google Scholar]
- Ponziani, R.L. Method and Apparatus for Gas Turbine Engines. US Patent 2006/0241886 A1, 26 October 2006. [Google Scholar]
- Pond, C.; Lucier, D. Caring for Spark Plugs. Turbomach. Int. 2006, 47, 36–37. [Google Scholar]
- Staszewski, W.; Tomlinson, G. Local Tooth Fault Detection In Gearboxes Using A Moving Window Procedure. Mech. Syst. Signal Process. 1997, 11, 331–350. [Google Scholar] [CrossRef]
- Bastami, A.R.; Bashari, A. Rolling element bearing diagnosis using spectral kurtosis based on optimized impulse response wavelet. J. Vib. Control 2020, 26, 175–185. [Google Scholar] [CrossRef]
- Liang, L.; Shan, L.; Liu, F.; Li, M.; Niu, B.; Xu, G. Impulse Feature Extraction of Bearing Faults Based on Convolutive Nonnegative Matrix Factorization. IEEE Access 2020, 8, 88617–88632. [Google Scholar] [CrossRef]
- Yang, W.-X.; Ren, X.-M. Detecting Impulses in Mechanical Signals by Wavelets. EURASIP J. Adv. Signal Process. 2004, 2004, 946162. [Google Scholar] [CrossRef] [Green Version]
- Liu, Y.; Chai, Y.; Liu, B.; Wang, Y. Impulse Signal Detection for Bearing Fault Diagnosis via Residual-Variational Mode Decomposition. Appl. Sci. 2021, 11, 3053. [Google Scholar] [CrossRef]
- Zhuang, Z.; Ding, J.; Tan, A.C.; Shi, Y.; Lin, J. Fault Detection of High-Speed Train Wheelset Bearing Based on Impulse-Envelope Manifold. Shock Vib. 2017, 2017, 2104720. [Google Scholar] [CrossRef]
- Wang, Y.; Chi, Y.; Wu, X.; Liu, C. Extracting acoustical impulse signal of faulty bearing using blind deconvolution method. In Proceedings of the 2009 Second International Conference on Intelligent Computation Technology and Automation, Changsha, China, 10–11 October 2009; Volume 1, pp. 590–594. [Google Scholar] [CrossRef]
- Arslan, Y. A new approach to real time impulsive sound detection for surveillance applications. arXiv 2019, arXiv:1906.06586. [Google Scholar]
- Dos Reis, C.F.; Altafim, R.A.P.; Gutnik, Y.; Altafim, R.A.C.; Cavalcanti, C.A. Comparative analysis between impulsive detection methods applied on partial discharge acoustic signals. In Proceedings of the 2014 IEEE International Instrumentation and Measurement Technology Conference (I2MTC) Proceedings, Montevideo, Uruguay, 12–15 May 2014; pp. 418–421. [Google Scholar] [CrossRef]
- Peck, C.H.; Moore, P. A direction-finding technique for wide-band impulsive noise source. IEEE Trans. Electromagn. Compat. 2001, 43, 149–154. [Google Scholar] [CrossRef]
- Tilz, A.; Meyer, G.; Kiesling, C.; Pirker, G.; Salbrechter, S.; Wimmer, A. Design of a test rig for fundamental investigations of spark characteristics. Int. J. Engine Res. 2020, 21, 1412–1425. [Google Scholar] [CrossRef]
- Edward, R. A Study of Acoustic Radiation from an Electrical Spark Discharge in Air. Master’s Thesis, Massachusetts Institute of Technology, Cambridge, MA, USA, 1974. [Google Scholar]
- Shibayama, H.; Fukunaga, K.; Kido, K. Directional characteristics of pulse sound source with spark discharge. J. Acoust. Soc. Jpn. 1985, 6, 73–77. [Google Scholar] [CrossRef]
- Wang, J.; Cao, J.; Cai, L.; Fan, Y.; Zhou, M.; Li, Q. Characteristics of acoustic response from simulated impulsive lightning current discharge. High Volt. 2019, 4, 221–227. [Google Scholar] [CrossRef]
- Liu, J.; Bi, M.; Jiang, H.; Gao, W. Evaluation of spark discharge. J. Electrost. 2020, 107, 103500. [Google Scholar] [CrossRef]
- Wyber, R. The design of a spark discharge acoustic impulse generator. IEEE Trans. Acoust. Speech Signal Process. 1975, 23, 157–162. [Google Scholar] [CrossRef]
- Eidous, O.M.; Al-Talafha, S.A.-D.A. Kernel method for overlapping coefficients estimation. Commun. Stat.-Simul. Comput. 2020, 1–18. [Google Scholar] [CrossRef]
- Giannakopoulos, T.; Pikrakis, A. Introduction to Audio Analysis; Academic Press: Cambridge, MA, USA, 2014. [Google Scholar]
- Najim, K.; Ikonen, E.; Daoud, A.K. Kaddour Najim, Stochastic Processes: Estimation, Optimization and Analysis; Kogan Page: London, UK, 2004. [Google Scholar]
- Miguez, M.E.; Uriondo, A.; Rodriguez, J.; Luque, B. A Feasibility Study on the Implementation of Visibility Algorithms for Fault Diagnosis in Aircraft Fuel Systems. Int. J. Progn. Health Manag. 2019, 10, 1. [Google Scholar] [CrossRef]
Figure 1.
The APU of a Boeing 737-400 (a) aircraft tail section and APU compartment; (b) components of the APU.
Figure 1.
The APU of a Boeing 737-400 (a) aircraft tail section and APU compartment; (b) components of the APU.

Figure 2.
APU igniter and faults: (a) actual igniter with eroded tip; (b) nominal limit of erosion; (c) burnt outer shell fault, adapted from [10].
Figure 2.
APU igniter and faults: (a) actual igniter with eroded tip; (b) nominal limit of erosion; (c) burnt outer shell fault, adapted from [10].
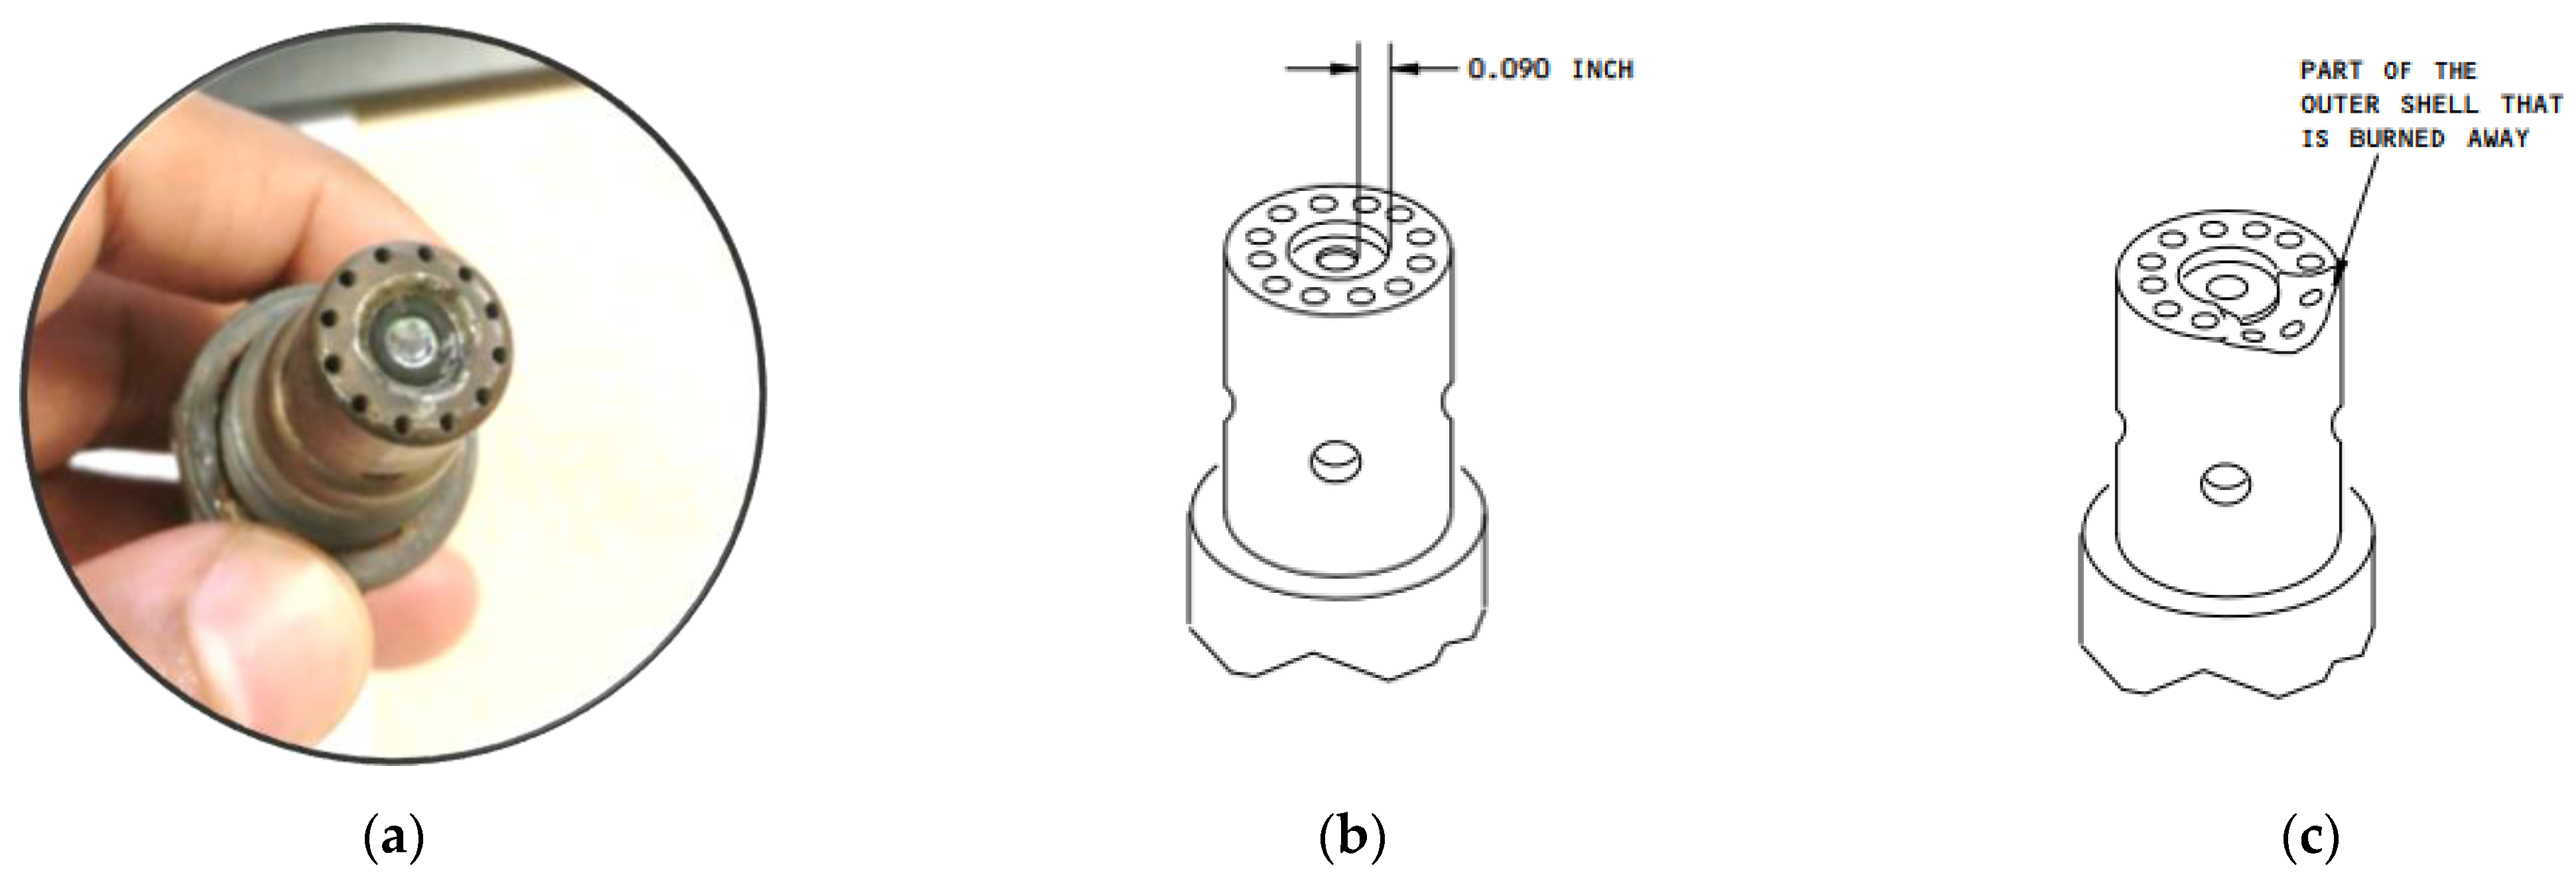
Figure 3.
Experimental setup: (a) APU and sensor locations; (b) IGN microphone location; (c) SCV microphone location; (d) cross-sectional view of the APU combustor, adapted from [10].
Figure 3.
Experimental setup: (a) APU and sensor locations; (b) IGN microphone location; (c) SCV microphone location; (d) cross-sectional view of the APU combustor, adapted from [10].

Figure 4.
Flow chart of the employed methodology.

Figure 5.
Comparison between spark and no spark signal: (a) time domain representation; (b) frequency domain analysis and magnitude response of the high-pass filter.
Figure 5.
Comparison between spark and no spark signal: (a) time domain representation; (b) frequency domain analysis and magnitude response of the high-pass filter.

Figure 6.
Results of the application of high-pass filtering on acquired data: (a) raw acoustic data; (b) filtered acoustic data; (c) APU RPM.
Figure 6.
Results of the application of high-pass filtering on acquired data: (a) raw acoustic data; (b) filtered acoustic data; (c) APU RPM.

Figure 7.
Results of computation: (a) envelope signal and envelope spectrum for acoustic data from Day#1; (b) computed and their fluctuations across all days of experimentation.
Figure 7.
Results of computation: (a) envelope signal and envelope spectrum for acoustic data from Day#1; (b) computed and their fluctuations across all days of experimentation.
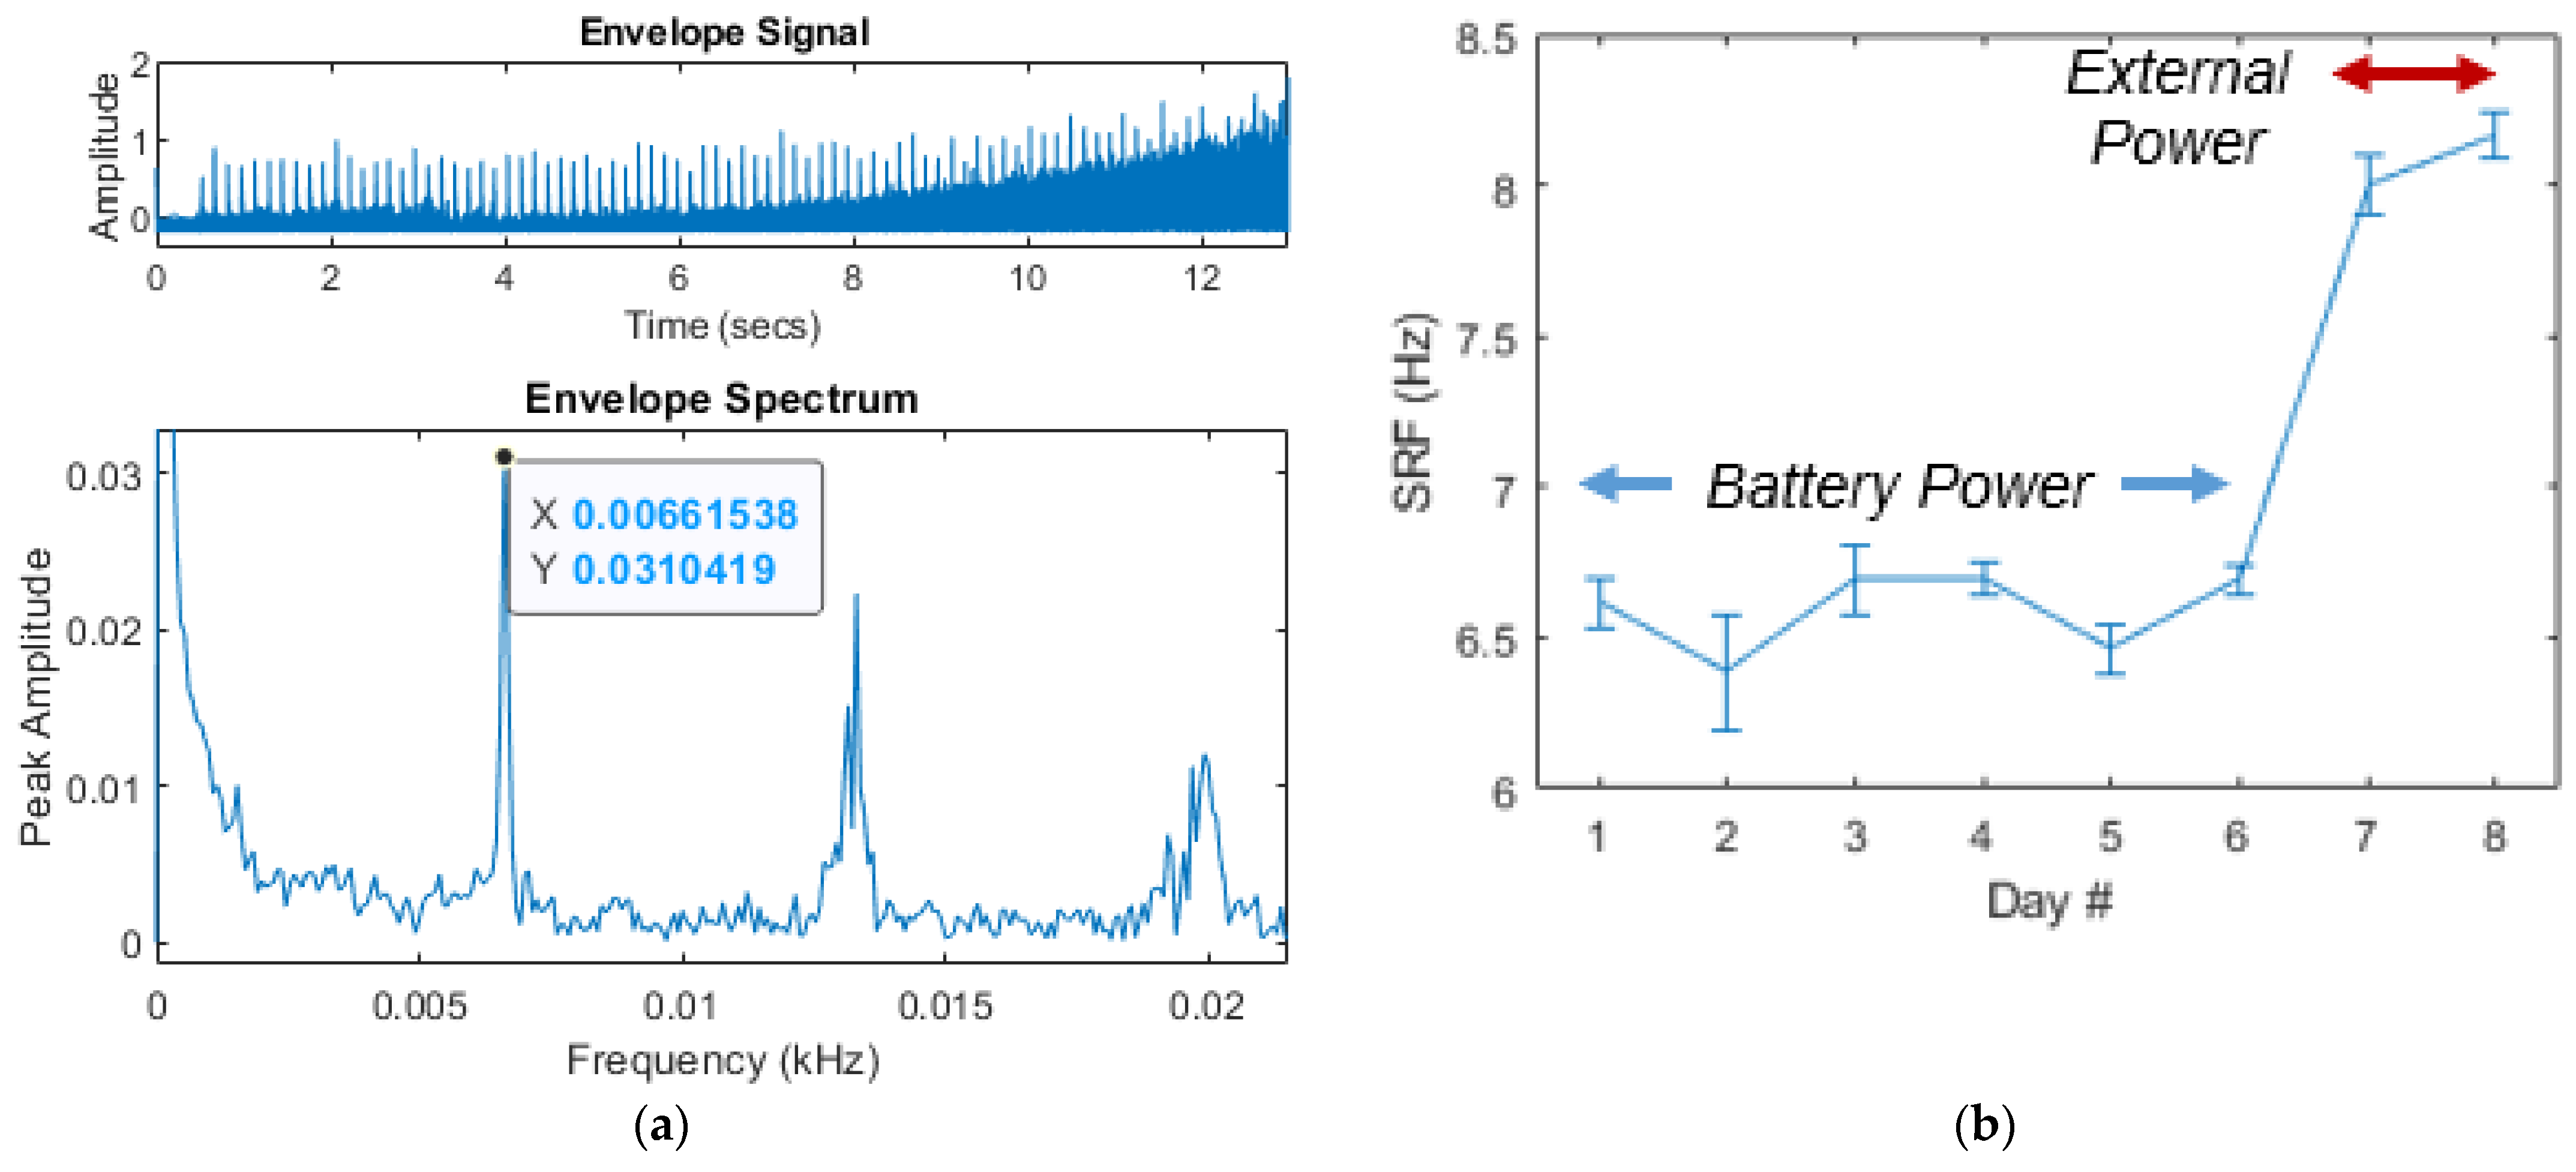
Figure 8.
Time series data around a spark event.
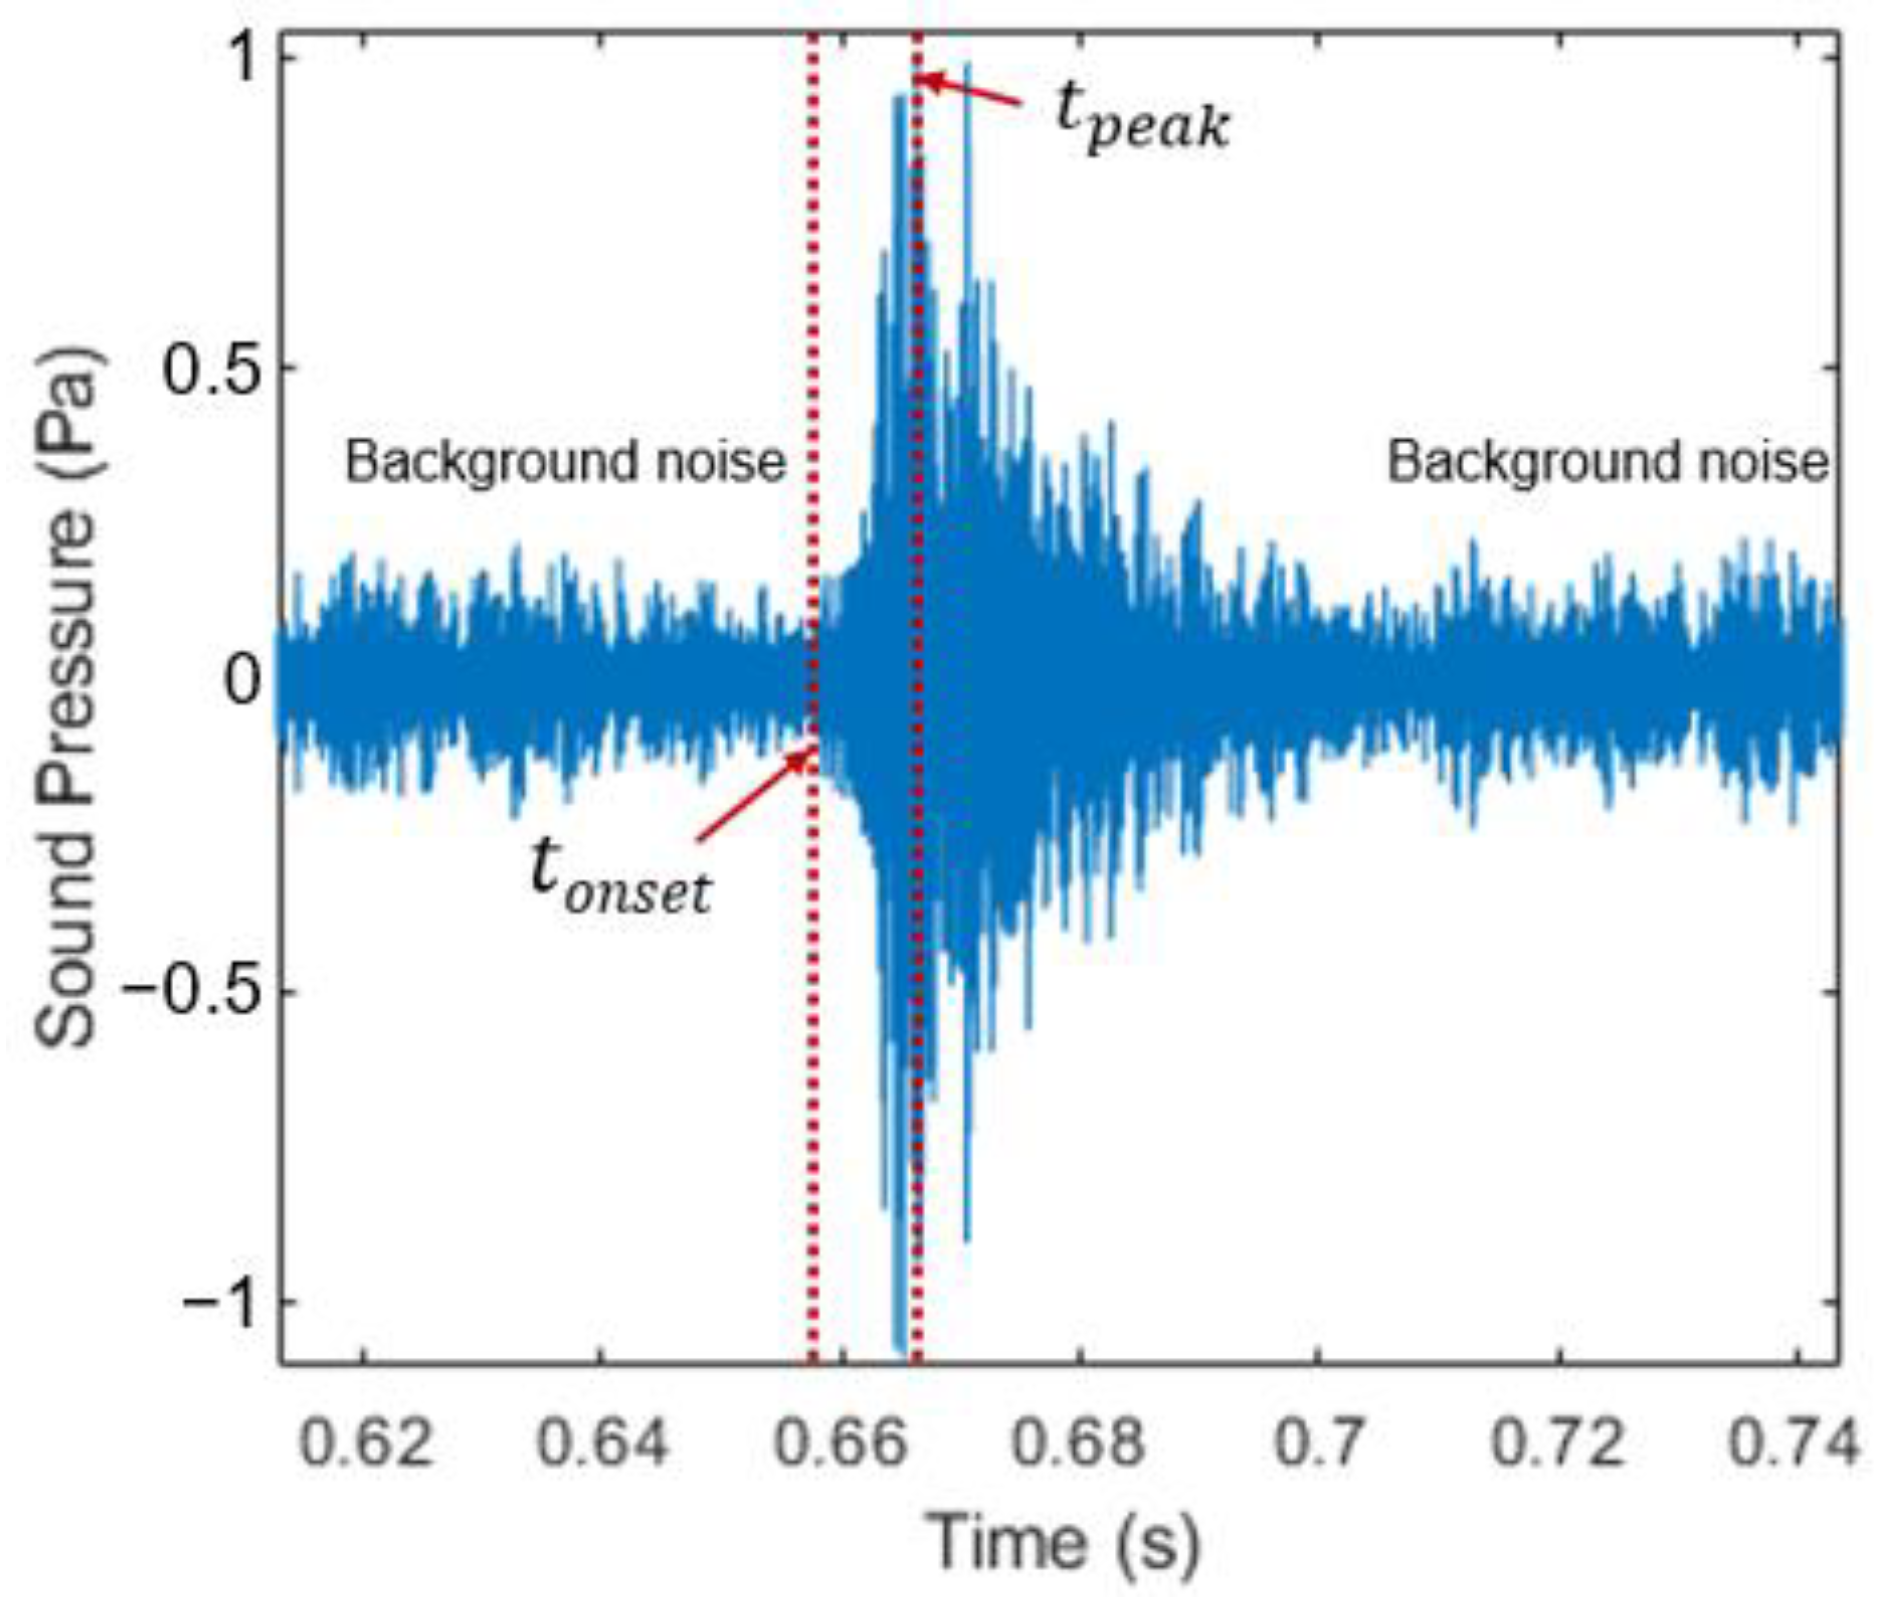
Figure 9.
Moving average filter results: (a) series of sparks; (b) single spark with identified location of .
Figure 9.
Moving average filter results: (a) series of sparks; (b) single spark with identified location of .

Figure 10.
Rise times computed for the complete data set at sensor locations IGN and SCV.
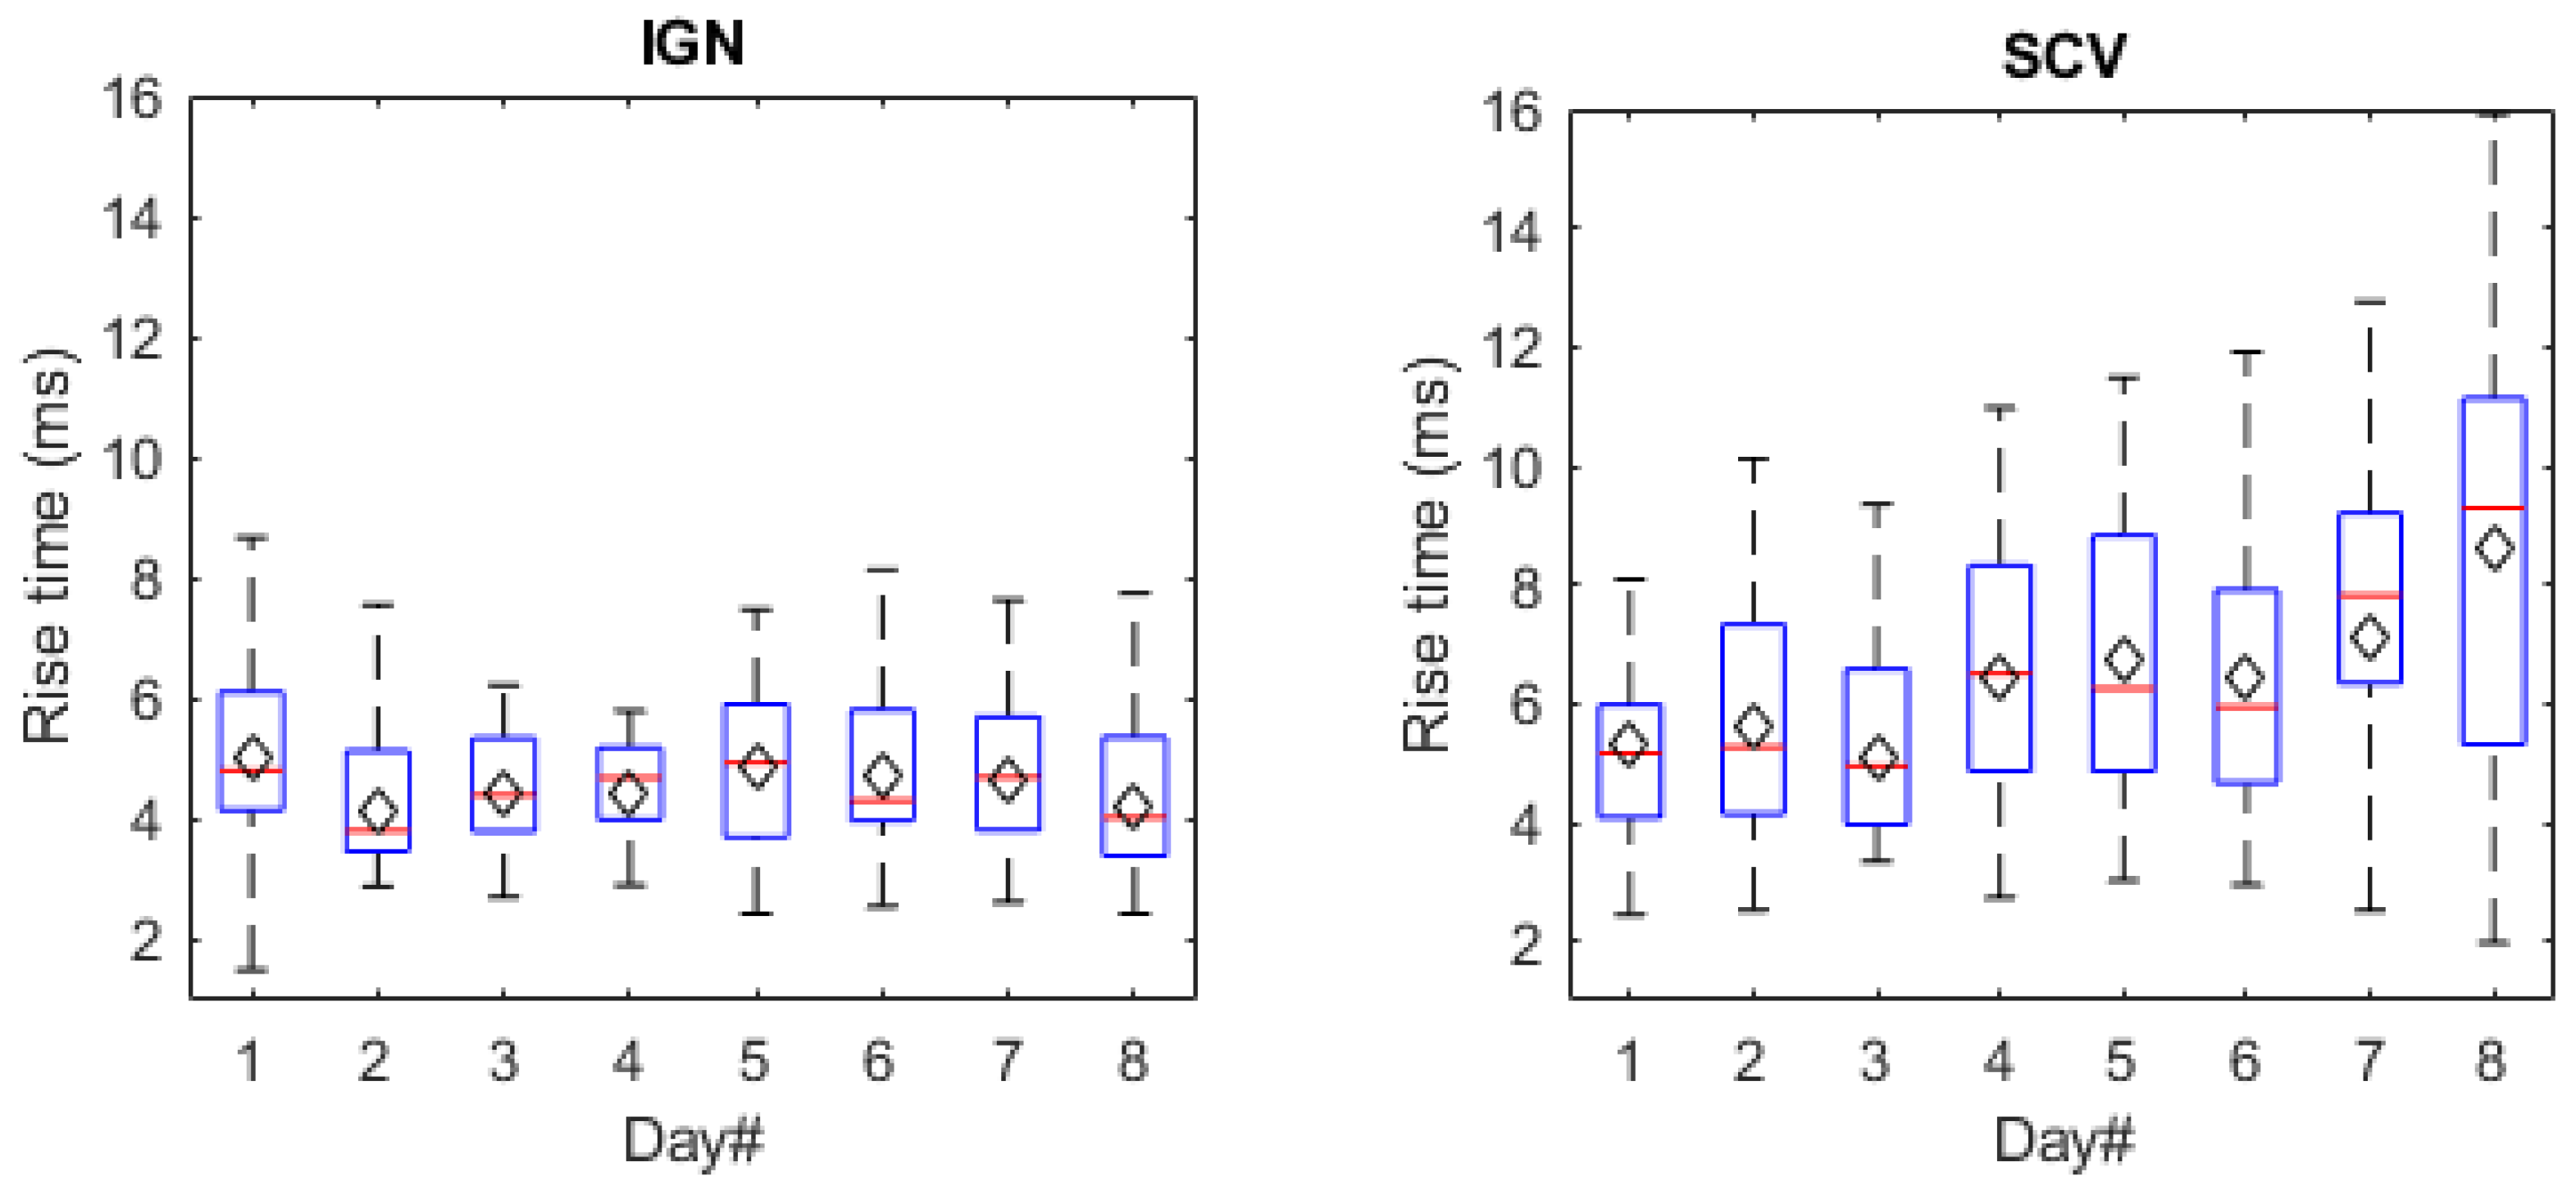
Figure 11.
Kurtosis values computed for spark and noise data at sensor locations IGN and SCV.
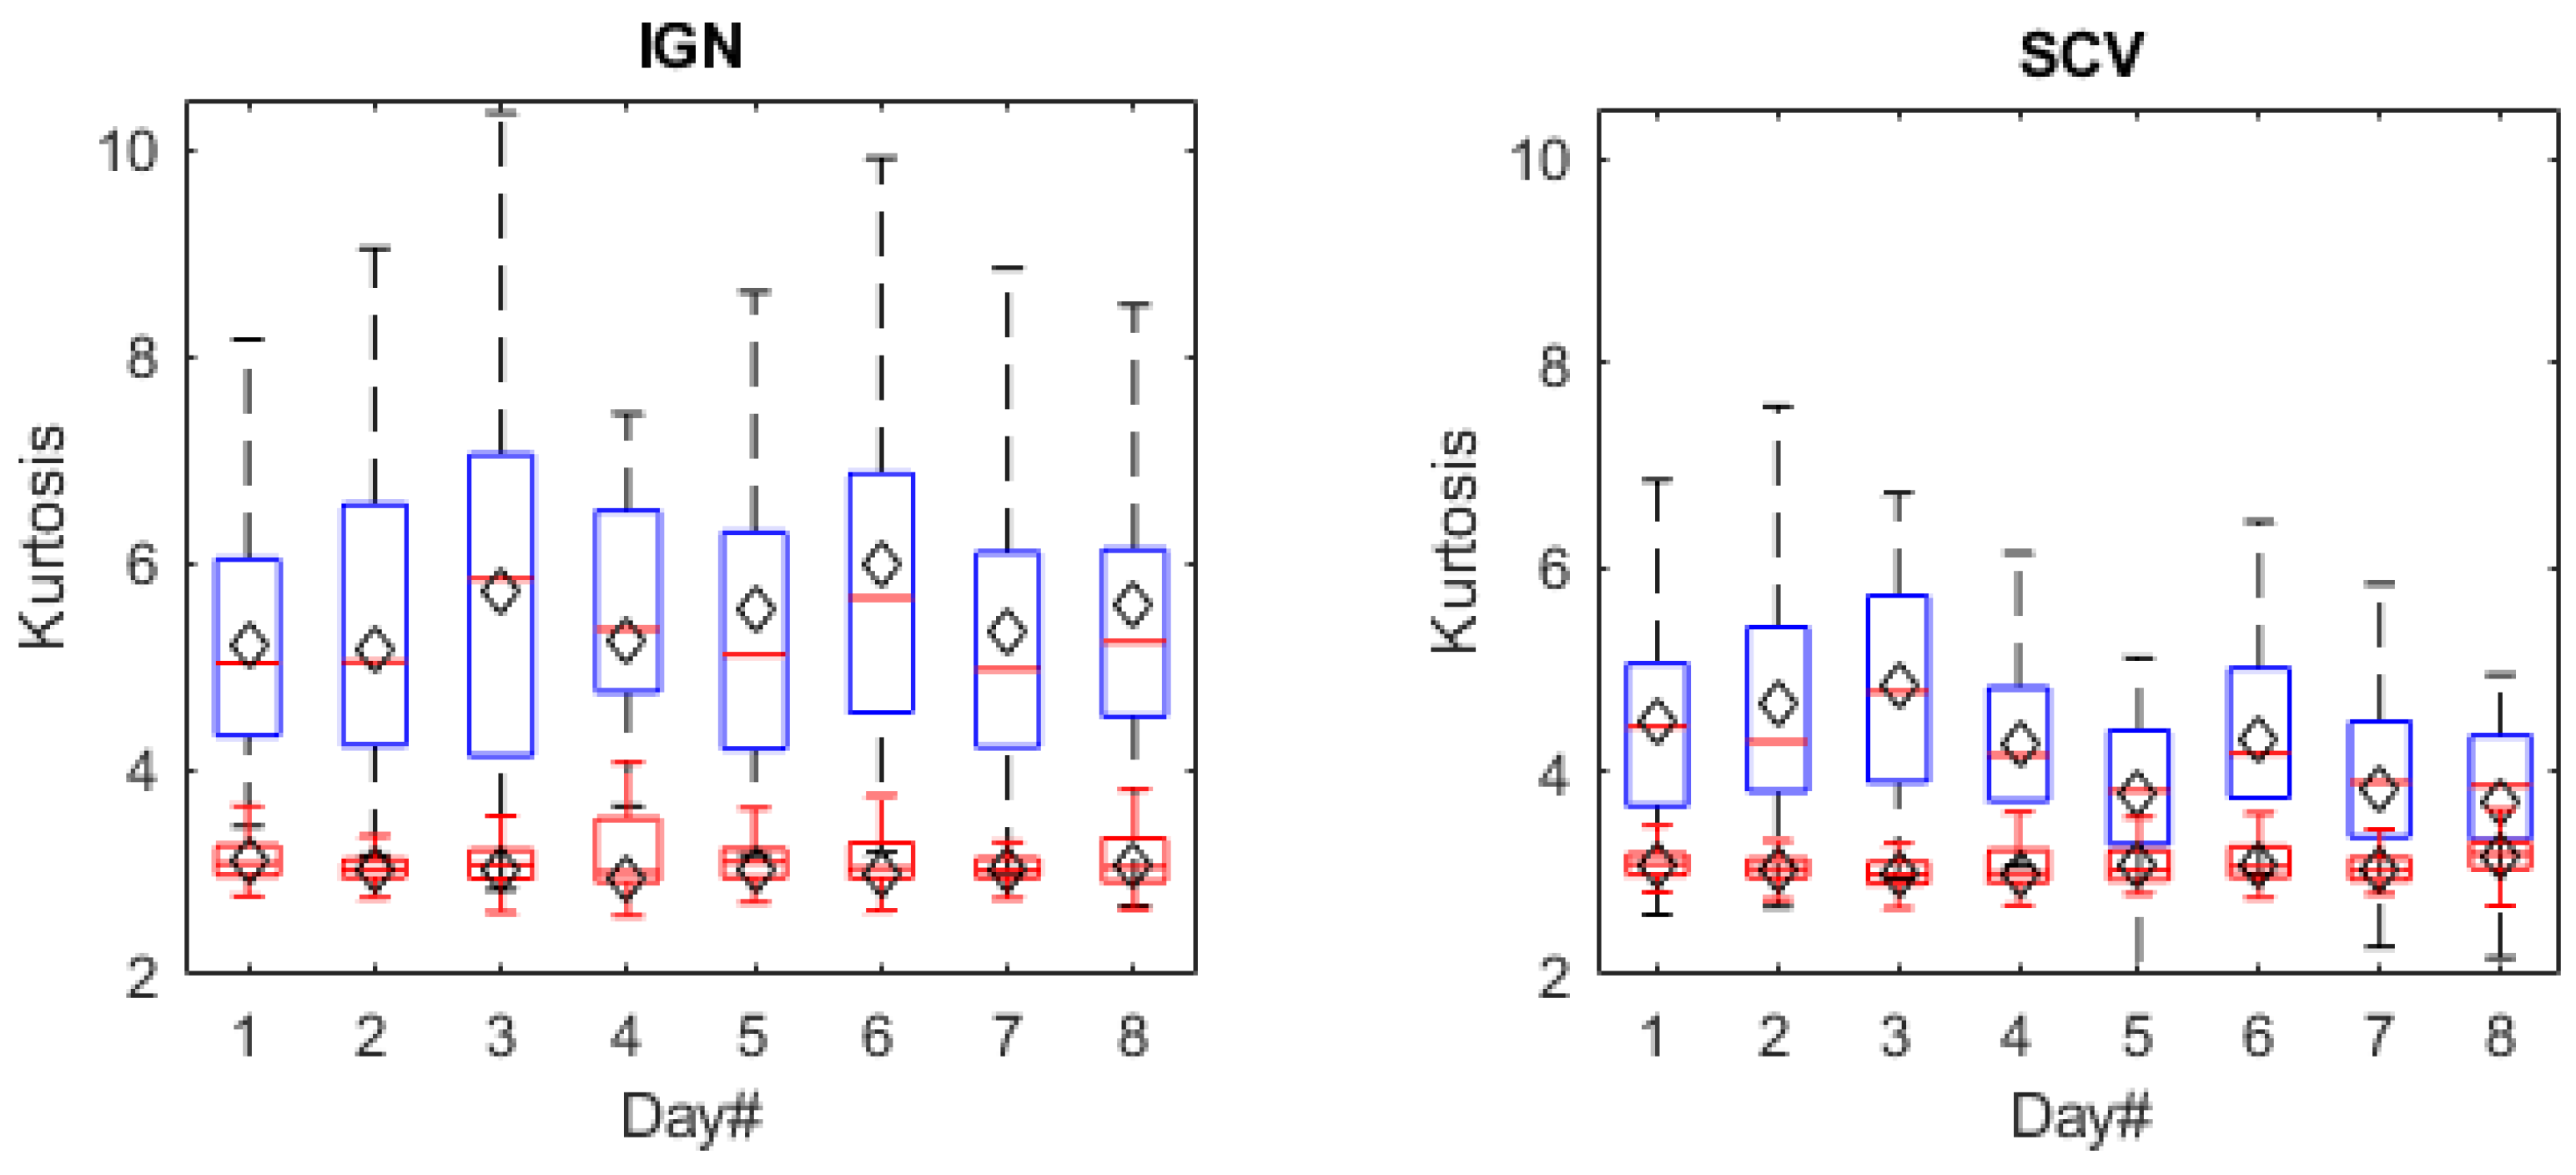
Figure 12.
Peak values computed for spark and noise data at sensor locations IGN and SCV.
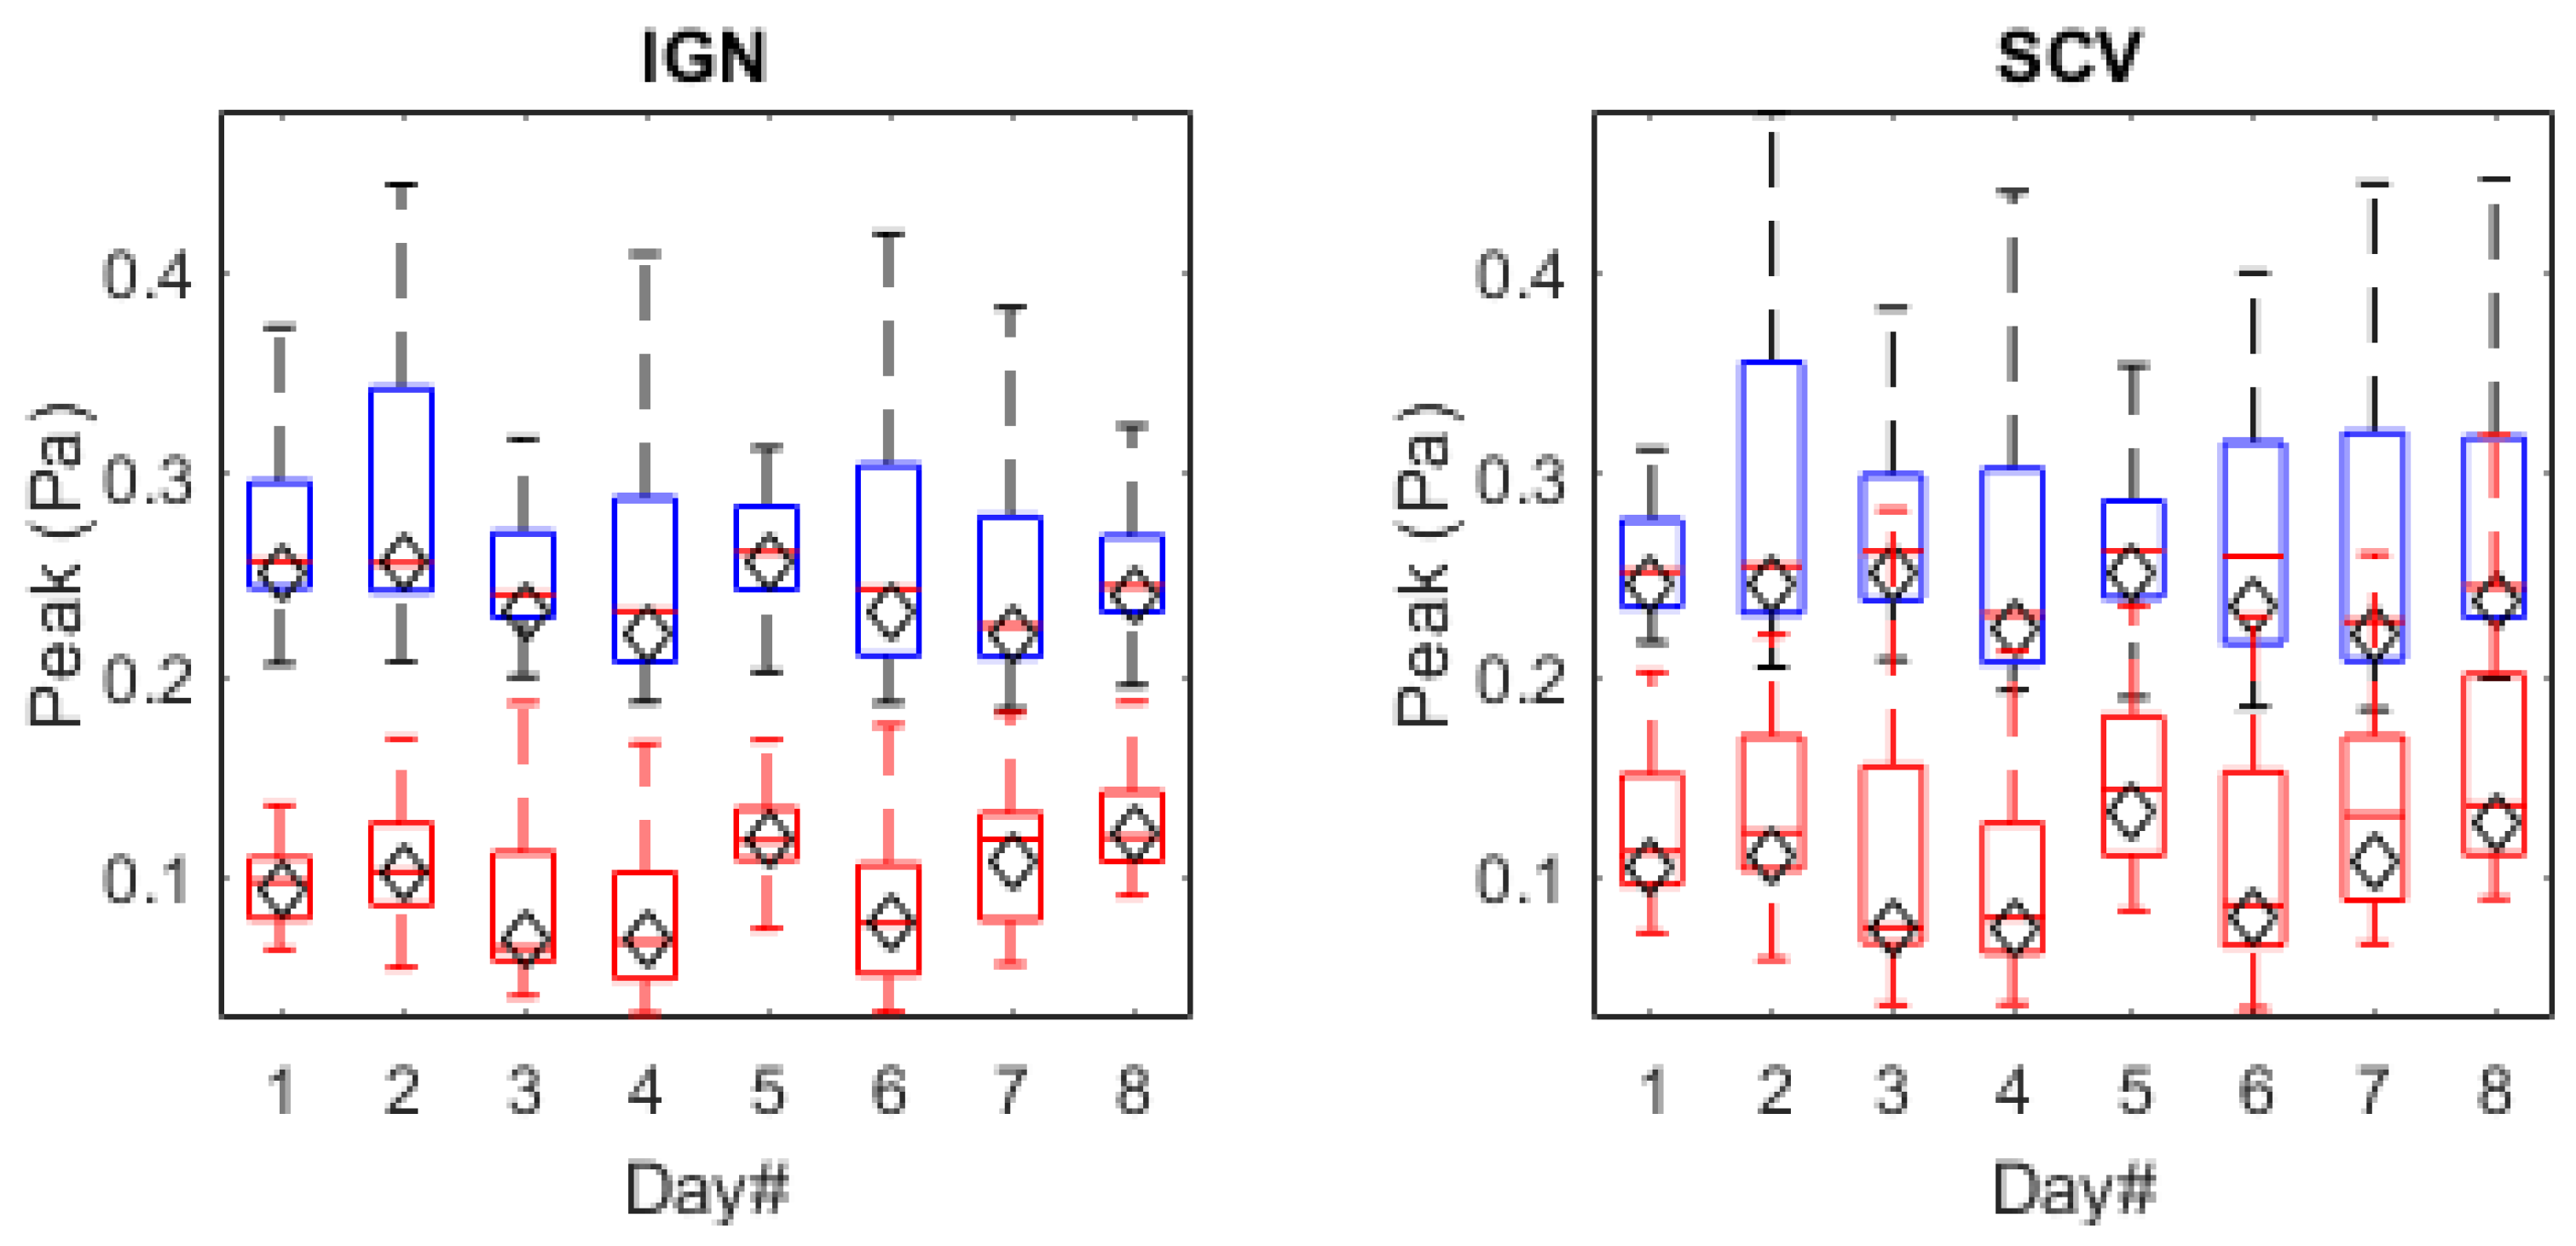
Figure 13.
values computed for spark signals at sensor locations IGN and SCV.

Figure 14.
values computed for spark and noise data at sensor locations IGN and SCV.
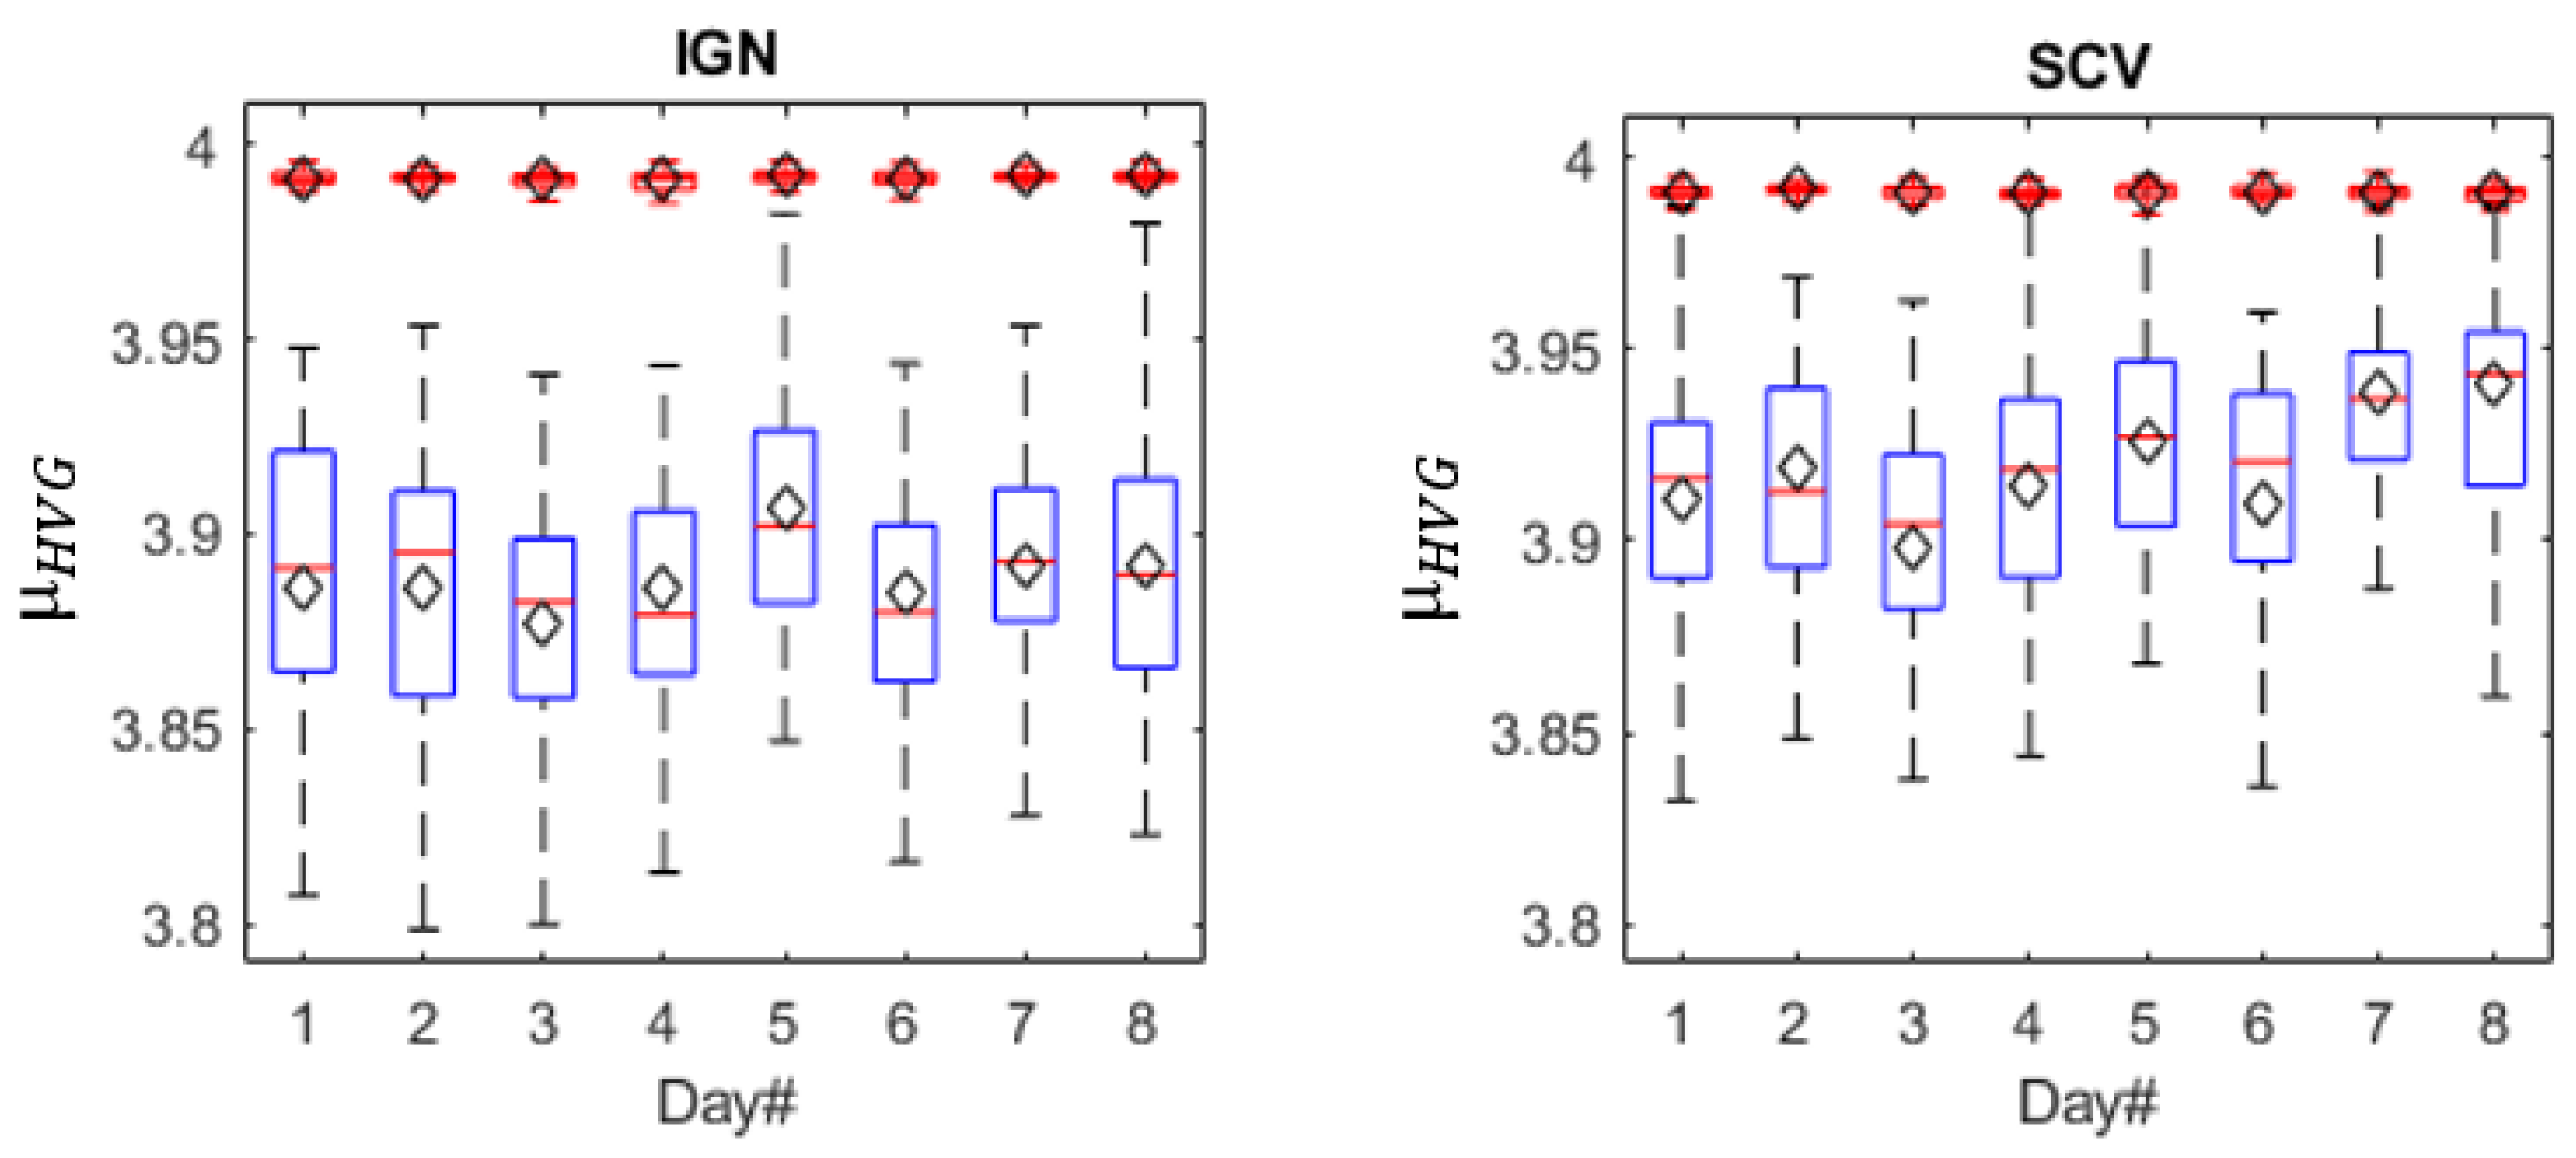
Figure 15.
Mean values computed for spark and noise data at sensor locations IGN and SCV.


Table 1.
Performance analysis of selected features.
| Feature Name | |||
|---|---|---|---|
| 0.83 | - | - | |
| 0.81 | 0.02 | 0.10 | |
| 0.80 | 0.10 | 0.19 | |
| 0.76 | 0.09 | 0.07 | |
| 0.72 | 0.02 | 0.05 | |
| 0.70 | 0.01 | 0.02 | |
| 0.65 | 0.07 | 0.13 | |
| 0.63 | 0.00 | 0.00 | |
| 0.62 | 0.00 | 0.00 | |
| 0.61 | 0.00 | 0.01 |
Publisher’s Note: MDPI stays neutral with regard to jurisdictional claims in published maps and institutional affiliations. |
© 2022 by the authors. Licensee MDPI, Basel, Switzerland. This article is an open access article distributed under the terms and conditions of the Creative Commons Attribution (CC BY) license (https://creativecommons.org/licenses/by/4.0/).
Share and Cite
MDPI and ACS Style
Ahmed, U.; Ali, F.; Jennions, I. Signal Processing of Acoustic Data for Condition Monitoring of an Aircraft Ignition System. Machines 2022, 10, 822. https://doi.org/10.3390/machines10090822
AMA Style
Ahmed U, Ali F, Jennions I. Signal Processing of Acoustic Data for Condition Monitoring of an Aircraft Ignition System. Machines. 2022; 10(9):822. https://doi.org/10.3390/machines10090822
Chicago/Turabian StyleAhmed, Umair, Fakhre Ali, and Ian Jennions. 2022. "Signal Processing of Acoustic Data for Condition Monitoring of an Aircraft Ignition System" Machines 10, no. 9: 822. https://doi.org/10.3390/machines10090822
Note that from the first issue of 2016, this journal uses article numbers instead of page numbers. See further details here.