

Optimization Study on the Comfort of Human-Seat Coupling System in the Cab of Construction Machinery
1
State Key Laboratory of Intelligent Manufacturing of Advanced Construction Machinery, Xuzhou Construction Machinery Group, Xuzhou 211162, China
2
School of Mechanical Engineering, Southwest Jiaotong University, Chengdu 610031, China
*
Author to whom correspondence should be addressed.
Machines 2023, 11(1), 30; https://doi.org/10.3390/machines11010030
Submission received: 22 November 2022
/
Revised: 6 December 2022
/
Accepted: 19 December 2022
/
Published: 27 December 2022
(This article belongs to the Special Issue Noise and Vibration Control in Dynamic Systems)
Abstract
:The seat of a construction machinery cab is used as the research object. For the current human-seat coupling system comfort research methods and optimization index deficiencies, the seat body pressure comfort and vibration comfort at the same time optimized. Based on the more specialized Toyota 50 percentile dummy model, a human-seat finite element simulation model is established, and the body pressure distribution and vibration response are simulated and calculated. The transverse and longitudinal pressure distributions of the backrest and seat cushion and the pressure map are used to verify the simulation model’s body pressure comfort evaluation indexes. At the same time, the vibration response test is used to verify the vibration comfort evaluation indexes of the simulation model. The test results show that the accuracy of each evaluation index of the established coupling model is greater than 85%, which can provide model support for the subsequent optimization work. In order to improve the comfort of the seat of construction machinery during operation, the hardness of the upper sponge and lower layer sponge is reduced and increased by 10% and 15%, respectively, on the original seat. The body pressure comfort evaluation indexes of the ischium peak pressure, ischium mean pressure, thigh peak pressure and thigh mean pressure are used to evaluate the improved seat. The proposed optimization scheme is to reduce the hardness of the upper sponge and lower layer sponge of the seat cushion by 10% to improve the seat body pressure comfort. Finally, the evaluation indexes of body pressure comfort and vibration comfort are verified by four subjects in an improved seat, and the cushion pressure of different subjects is reduced while the vibration isolation rate is increased, which shows the rationality of the proposed optimization scheme. In addition, the evaluation results of the improved seat are different for subjects of different body sizes, with the most significant improvement for the subject of greater height and weight. The modeling and comfort evaluation methods adopted in the paper can provide a reference for the design and development of the seat.
1. Introduction
As the driving operator’s attention to the safety and comfort of construction machinery continues to rise, more attention is paid to the comfort of the human-seat coupling system. Seat, as a critical component of the interaction between the driver and construction machinery, not only affects the driver’s comfort and driving feel, the uncomfortable seat will make the driver physically and psychologically fatigued and even cause safety accidents. Therefore, construction machinery seat comfort research is of great importance [1,2].
Seat comfort measures the magnitude of the physical and mental impact on the operating driver when the moving vehicle is moving, or the working construction machinery is working. It is mainly divided into comparisons through subjective and objective evaluations [3]. The subjective evaluation considers the subjective reflection of the occupant and can be used as a direct reference factor for comfort research [4]. However, the results of the subjective evaluation will inevitably bring about the subjective limitations of the evaluator. Objective evaluation is mainly conducted through various objective evaluation indexes, among which the objective seat evaluation includes body pressure comfortable and vibration comfort. Related research showed that the body pressure distribution between the human-seat interface was a vital evaluation index to measure the body pressure comfortable of the seat [5,6,7,8,9]. Some scholars used experimental tests to investigate the effect of body pressure distribution regularities on the body pressure comfortable of seats. A. Milivojevich et al. selected five vehicle seats for their study and demonstrated the relationship between subjective comfort and objective body pressure distribution of the subjects to assess the body pressure comfortable of vehicle seats and quantify the improvement potential of vehicle seats [10]. The mean pressure, peak pressure, and pressure gradient between the person-seat are important quantitative indicators of static seat comfort [11,12]. Christian Mergl et al. established the correlation between discomfort and body pressure distribution by contact pressure. Experimental validation showed that the method could reflect the ride performance of car seats based on pressure distribution [13]. By studying the relationship between the static physical properties of the seat cushion and seat comfort, K. Ebe and Griffin, M.J. showed that the total pressure in the 4 cm × 4 cm area under the hip bone was correlated with the comfort of the static seat and that seats with less total pressure in this area were more comfortable than those with total pressure [14]. At the same time, because the human-seat system is often in a dynamic environment, excessive vibration can lead to a series of strain and pain in the lumbar, cervical, and spine, so vibration comfort is also an important goal in the optimal design of the seat. The most commonly used methods to quantify seat vibration comfort are cushion vibration response values [15,16] and seat vibration transmission rate [17,18]. Fairley, T.E. and Griffin, M.J. predicted the vertical transfer rate from the floor to the seat surface by measuring the seat’s dynamic stiffness and the body’s vertical mass [19]. Immediately following, Fairley, T.E. and Griffin, M.J. used random vibration to measure the frequency response function of a subject’s human body. It was found that the relative motion between the feet and the seat would affect frequencies below resonance [20]. Toward, M.G. and Griffin, M.J. explored the effect of human body characteristics (age, gender, physical characteristics, and vibration amplitude) on seat vibration transmissibility and measured the vibration transmissibility in the vertical direction of the vehicle seat [21]. By measuring the seat vibration transmission rate of agricultural tractor operators for vertical vibration at the base of the seat, below the sciatic tuberosity, and at the thighs, Adam, S.A. and Jalil, N.A. showed that the vibration energy absorbed by the operator’s body is higher when the tractor is operated in off-road conditions [22]. Westhuizen, A.V. and Niekerk, J.L. reconstructed the vibration excitation to which the construction machinery was subjected on a shaker table on a rough road and demonstrated that the effective seat amplitude transmission rate could be used as a reliable indicator of seat vibration comfort, and the study showed a good correlation (R2 = 0.97) between subjective ratings on multiple subjects and seat vibration transmission rate [23].
Currently, the study of seat body pressure comfort and vibration comfort is usually performed by direct experimental methods, which usually require professional testing instruments and dummy models, which are costly and time-consuming, and computer simulation has become a low-cost and high-efficiency research tool, and scholars had established human and seat finite element models to conduct research. Du Xiaoming et al. established a detailed driver’s human finite element model and applied it to driver-seat interaction simulation, and the model has good consistency between body pressure distribution simulation and testing. The study’s results showed that the maximum stresses in the hips occurred below the sciatic tuberosity and the maximum stresses in the trunk occurred near the posterior scapula and lumbar region. Fatigue usually occurs in these areas [24]. Siefert, A., Pankoke, S. and Wölfel, H.P. adapted the seat structure and sponge material and built a human-seat finite element model to investigate comfort. Then, using the human model and the complete seat parameters, the human seat drop process was calculated by gravity loading to reflect the accurate seat pressure distribution. It was shown that the finite element model could better reflect the human-seat nonlinear characteristics, and the ABAQUS finite element solver thoroughly considered the effect of contact. Hence, the simulation results agreed with the measured results [25]. Thus, it can be seen that the use of computer simulation for seat comfort analysis has an essential significance in developing the whole seating system. Therefore, seat comfort simulation has become a crucial part of the seat product development process. Meanwhile, many scholars have optimized construction machinery seat-related parameters to improve static and vibration comfort. Gyi, D.E. and Porter, J.M. studied body pressure comfortability using two densities of sponge and two different human seating posts. Although the link between the pressure at the contact interface and comfort was not established, the effect of anthropometric data such as gender, weight, and seat stiffness on comfort was proposed [26]. Xiaolu Zhang et al. investigated the effect of dynamic stiffness on seat comfort for 12 subjects (6 men and 6 women) with three thicknesses of sponge cushions (60, 80, and 100 mm). The study showed the effect of the thickness of the sponge at the seat cushion and the sponge at the backrest on their longitudinal and transversal axis transmittance, and the results of the study can be applied to the design of construction machinery seats with a greater degree of attenuation of the vibrations transmitted to the body [27]. Pritpal Singh et al. investigated the effect of different amounts of padding thickness on the body pressure comfortable of the seat and the effect of increasing body weight on various body pressure indices at padding thicknesses ranging from 0 to 7 mm, with the same sponge density, hardness, and all other aspects of the seat [28]. Kolich, M. et al. compared car buyers’ road sensory feedback requirements in different market segments (SUVs and luxury vehicles) to optimize the seat vibration comfort line. It was found that seat designers can adapt the sponge performance to different market segments by controlling the seat sponge density, i.e., controlling the physical performance parameters of the seat sponge to adjust the seat dynamic performance and achieve different vibration transmission characteristics [29]. As a result of the above research, some research work has been performed by scholars on human-seat system comfort, and effective results have been achieved. However, the following common problems still exist in the analysis and optimization of the body pressure comfortable and vibration comfort of human-seating systems.
- (1)
- Most previous studies on the comfort of human-seat systems had used experimental methods, which were costly and less reproducible. At the same time, the finite element method currently used by a few scholars is too simple to equate to the dummy model, and the equivalence of human bones and organs is incomplete. Since the contact pressure between the dummy and the seat is mainly reflected by the seat body pressure distribution [30,31], therefore, the sponge material properties and the accuracy of the seat finite element model have a significant influence on the simulation result, and the existing seat model is inaccurate in defining the sponge material by equivalent stiffness.
- (2)
- More critical is that the previous research on human-seat system comfort only focused on one of the performance improvements of body pressure comfort or vibration comfort without considering both simultaneously. Especially for construction machinery in the work process, the operator faces strong vibration from the frame. Therefore, in optimizing seat performance, it is necessary to improve the seat vibration isolation performance while meeting the body pressure comfort so that the operator can obtain more excellent seat comfort performance.
Based on the above analysis, this paper takes the human-seat coupled system as the research object, establishes the finite element simulation model of the human-seat coupled system, and the body pressure distribution test and vibration response test are carried out to verify the established model on the simulation accuracy of body pressure comfort and vibration comfort indexes. Then, four quantitative evaluation indexes of body pressure comfortable, namely, ischium peak pressure, ischium mean pressure, thigh peak pressure, and thigh mean pressure, are used to evaluate the improved seat, and the optimization plan of seat cushion sponge hardness is proposed according to the evaluation results. Finally, the improved seat is tested and verified by subjects of different heights and weights concerning body pressure comfort and vibration comfort evaluation indexes. The test results can show the rationality of the proposed optimization scheme. The model and seat comfort evaluation methods adopted in this paper can provide a reference for the design and development of the seat. Figure 1 shows the optimization process of the human-seat coupled system comfort evaluation.
2. Human-Seat Coupling Finite Element Model
2.1. Dummy Model Introduction
In this study, a Toyota 50-percentile dummy model is used [32], and the 50-percentile model can provide a good equivalent simulation of a human body of 175 cm in height and 77 kg in weight. The model can accurately characterize the geometric features of the human body, with very accurate anatomical structure characteristics, complex material properties, and high biological fidelity, and can analyze the impact of vibration impact on internal organs such as the heart and liver, and more accurately simulate the natural form of a human motion under vibration, more realistically reproduce the internal skeletal form of the human body, and more realistically reflect the degree of damage to various parts of the human body. Studying human injury mechanisms in collision accidents can play an increasingly significant role in injury risk assessment and other aspects. It can better compensate for a series of limitations of the solid dummy, such as higher test costs, poor repeatability of the test, and limited human signs of the dummy model. The specific posture of the dummy model is shown in Figure 2.
2.2. Seat Model Introduction
The 3D model of the cab seat is shown in Figure 3a. The central part of the seat contains the cushion sponge, backrest sponge, seat skeleton, and other components. In order to carry the human body well, the seat cushion sponge is divided into upper and lower layers, where the upper layer is less hard, and the lower layer is harder. The body pressure distribution and vibration response reflect the contact pressure and vibration transmission between the human body and the sponge, so establishing the actual material properties of the sponge is the critical factor in ensuring the reliability of the human-seat coupling simulation model. The force-displacement curves (stiffness characteristics) of the backrest sponge and cushion sponge are obtained by the test, as shown in Figure 3c,d.
The essential structural parameters of the seat simulation model include the masses m of the cushion sponge, backrest sponge, and seat skeleton and the rotational inertia , and the performance parameters are shown in Table 1. The seat model meshes in Hypermesh software, and the geometric model is cleaned up before meshing to repair broken lines and surfaces. The center surface of the sheet metal components in the seated skeleton is extracted, and the extracted center surface is used as a 2D shell element and divided with a quadrilateral mesh. At the same time, the washer is set to simulate the position of the bolts involved, a realistic bolt structure is created, the mesh is divided, and the contact relationship between the bolts and the connecting parts is represented. As an essential component of the seat, the volume of the sponge is the largest compared with the other components, and the sponge is mainly used to bear the pressure of the human body. Set the sponge mesh size to 15 mm. The centerline of the spring is extracted, the 1D beam element is used to simulate the spring component, and the cell length is set to 6 mm. The rest of the solid structure is divided into reasonable element sizes according to the size, generally using tetrahedral elements. The mesh of critical locations can be refined to ensure that it conforms to the basic geometric features. At the same time, the seat backrest and seat cushion can be rotated for backrest angle adjustment, and they are constrained by the rotation sub. The seat frame is fully restrained with the backrest and cushion by the RBE2 fixed sub. The constraint between the seat frame steel plates is also performed by the fixed sub. The finite element model of the seat is shown in Figure 4a.
2.3. Human-Seat Coupling Finite Element Model
Based on the above-mentioned dummy model and seat model, this section proposes to construct a human-seat coupled finite element model for seat comfort simulation analysis. It should be noted that since the pressure information of the seat is collected using a pressure pad during the human-seat body pressure test [33], the size of the finite element pressure pad is set according to the size of the test pressure pad, which can better equate the simulation with the test to improve the simulation accuracy. The seat back is composed of 40 rows × 64 columns with 2560 pressure measurement points, and the seat cushion is composed of 48 rows × 48 columns with 2304 pressure measurement points, and the spacing of each pressure measurement point is 12.7 mm ± 1 mm. After the setup, the seat pad is imported into the seat’s finite element model. As shown in Figure 4a, it is the seat without the pressure pad. At this time, establish the contact between the pressure pad and sponge and export the model to Dyna software for a solution. In order to better lay the pressure pad on the seat backrest, turn the backrest to be parallel to the ground so that the pressure pad falls on the seat cushion and backrest under the effect of gravity and the gravity field is loaded to 9.81 N/kg in the simulation. Export the calculated seat and pressure pad model from the post-processing software, and adjust the backrest to the initial angle. The backrest pressure pad z-direction is finally constrained to prevent the pressure cushion from sliding off the backrest, as shown in Figure 4b.
In order to construct the coupled human-seat finite element model, the model’s boundary conditions need to be set. The 50-percentile dummy model and the seat model were adjusted to the specified state to simulate the operation process of the operator driving the construction machinery, including a hand-operated joystick and leg-operated pedal, and the initial boundary conditions were set as shown in Table 2. Then, the contact between the dummy model and the seat back, seat cushion, and floor is established, and the human-seat coupling finite element model is shown in Figure 5. In the body pressure distribution simulation, the gravitational field is applied to the seat and the dummy model with the size of 9.81 N/kg. In order to avoid a long iterative process of the simulation model, the person is dropped vertically from a position close to the seat (about 3 cm) until the contact with the seat reaches a steady state with a loading time of 1500 ms. At the same time, in the vibration response analysis, because the vibration response of the excavator operating under the crushing condition is large and has the most significant impact on human comfort, the crushing condition vibration acceleration is applied at the z-direction of the seated skeleton as the excitation signal, and the analysis is carried out accordingly.
3. Human-Seat Coupling Model Comfort Test and Validation
3.1. Test Scheme
The body pressure distribution test and vibration response test are conducted in an actual excavator, with the height and weight of the driver being 175 cm and 77 kg, respectively. Each subject is tested independently during the test to reduce mutual interference between different subjects. Roho’s Xsensor pressure measurement system with X3 PRO V7 test software and X3 PX100:40.40.02 cushion pressure imaging sensor, and X3 PX100:40.64.02 backrest pressure imaging sensor is used for the body pressure distribution test. The system uses capacitive sensing technology and can be used to measure the pressure on the human body at different support surfaces. The test system has an absolute accuracy of 10 mmHg. The backrest sensor used in this test is 40 mm * 64 mm, consisting of a total of 2560 (40 × 64) sensors; the size of the cushion sensor is 48 mm * 48 mm, consisting of a total of 2304 (48 × 48) sensors. When conducting the test, the pressure cushion was laid between the seat cushion and the seat backrest, ensuring that the pressure cushion was in the middle of the transversal and longitudinal position and without wrinkles. In addition, the vibration response test is conducted using the LMS SCADA acquisition front-end with a PCB cushion/vibration acceleration sensor. During the test, the cushion sponge vibration acceleration response was acquired, the vibration isolation rate was calculated, and the cushion sensor was attached to the seat cushion above and the seat cushion below the skeleton, as shown in Figure 6. During the test, the form of the subject and the seat were the same as in the simulation.
3.2. Evaluation Index
3.2.1. Body Pressure Distribution Test Verification Indexes
According to ergonomic principles, the most comfortable body pressure distribution should ensure that most of the body’s mass is reasonably distributed in the cushion with a large support area and a small unit pressure. The pressure distribution from small to large smooth transition without abrupt changes. Seat body pressure distribution evaluation indexes include transversal pressure distribution curves and longitudinal pressure distribution curves. The backrest and cushion pressure distributions are shown in Figure 7. The pressure value is affected by the seat sponge’s hardness and surface shape. Usually, the poorly designed seat of the transversal and longitudinal pressure distribution is larger.
Transversal pressure distribution curve, the arithmetic mean value curve of pressure at each column measurement point of the seat.
where: PC indicates the transversal distribution pressure; NC is the number of measurement points in the jth column; P(xi,yi) is the pressure of the ith measurement point in the jth column.
Longitudinal pressure distribution curve, the arithmetic mean value curve of pressure at each row measurement point of the seat.
where: PR indicates the longitudinal distribution pressure; NR is the number of measurement points in the ith row; P(xi,yi) is the pressure of the jth measurement point in the ith row.
3.2.2. Vibration Response Test Verification Indexes
The larger the seat cushion’s total value of the vibration response, the more violent the vibration. The magnitude of the vibration response of the seat can be characterized by the root mean square (RMS) value of acceleration. The root mean square value of acceleration is calculated according to the following equation:
where: ax, ay, and ax are the weighted root mean square acceleration in m/s2 on the coordinate axes x, y, and z, respectively.
In addition, the larger the value of the seat cushion vibration isolation rate, the more significant the mitigation effect of the system on vibration. The vibration isolation rate is calculated from the vibration acceleration of the active and passive sides of the vibration isolation system. In engineering, the vibration isolation rate can be expressed as:
where: T is the vibration isolation rate in dB; aactive for the acceleration of the active side; apassive for the acceleration of the passive side.
3.3. Test Verification
In order to verify the simulation analysis results, the human-seat coupling system’s body pressure distribution test work is carried out. In the test, the subject’s height is 175 cm, and weight is 77 kg. In addition, the subject’s posture and seat backrest angle is also consistent with the simulated model. In the balance state of the human-seat coupling system, the pressure at the human-seat contact position in the simulation and the test are extracted, respectively, and the transversal and longitudinal pressure distribution curves of the backrest and cushion are calculated accordingly. However, there is a deviation between the simulation and test because a dummy free fall motion is imposed to simulate the cushion pressure process, and each evaluation index is calculated at equilibrium. In addition, the existence of the seat cushion pull-type slot. Moreover, the simulation model through the fixed constraint linkage of each sponge part to equate may be one of the reasons for the deviations. The results are shown in Figure 8. It can be seen that the simulation results of the transversal and longitudinal pressure distribution curves have the same peak trend as the test results, as shown in Figure 8a. The peak pressure of the simulation and test backrest transversal distribution curves are 0.0621 N/mm2 and 0.0679 N/mm2, respectively, with a relative error of 8.5%. As in Figure 8b, the peak pressures of the simulated and test backrest longitudinal distribution curves are 0.0882 N/mm2 and 0.0821 N/mm2, respectively, with a relative error of 7.4%. As in Figure 8c, the peak pressures of the simulated and test cushion transversal distribution curves are 0.2528 N/mm2 and 0.2257 N/mm2, respectively, with a relative error of 12.0%. As in Figure 8d, the pressure peaks of the simulated and test cushion longitudinal distribution curves are 0.2280 N/mm2 and 0.2580 N/mm2, respectively, with a relative error of 11.6%. It shows that the accuracy of the simulated and tested seat transversal and longitudinal pressure distribution is greater than 85%, and the accuracy of the simulation results meets the analysis requirements. In addition, the results of the simulated and test pressure maps of the backrest and cushion are shown in Figure 9. Since the seat backrest supports the human back, the pressure extremes of both simulated and tested backrests appear at the spine and its two sides. At the same time, both the simulated and tested seat cushion pressure extreme value points appear in the front side of the thigh, and both at the ischium joint pressure are more significant, and this is the center of the outward diffusion and decay. In summary, the pressure distribution of the backrest and cushion is reasonable.
From Figure 8 and Figure 9, it can be seen that the pressure distribution of the human-seat coupling system is mainly concentrated in the cushion position. In contrast, the pressure distribution in the backrest position is less. Therefore, the cushion plays a significant role in the impact of comfort. When considering the cost factor of optimization, this paper mainly focuses on the optimization design of cushion sponges.
In order to further verify the accuracy of the model, the acceleration excitation signal under the crushing condition of the excavator is applied to the seat skeleton (this is because the crushing condition is more violent than other conditions such as sand digging and walking, which has a greater impact on the vibration comfort). Figure 10 show the time and frequency domain signals of seat vibration excitation under crushing condition. The excitation frequency peaks are distributed around 5 Hz, 7.5 Hz, 10 Hz, 12.5 Hz, 15 Hz, and 17.5 Hz, mainly generated by the excavator crushing hammer head vibration excitation.
Under the crushing condition, the seat cushion vibration acceleration response is extracted from the simulation model and compared with the test results. The mesh size and the coupling relationship between the seat skeleton steel plates are the main reasons for the deviations. The fixed constraint equivalence of the mutually welded steel plates may reduce the simulation model accuracy. The vibration response curve comparison and error analysis are shown in Figure 11 and Table 3, respectively. The peak frequencies of the simulated and tested vibration response curves achieve an accuracy of over 98%. At 5 Hz, the amplitudes of the simulated and tested vibration response curves are 0.0566 m/s2 and 0.0599 m/s2, respectively, with an accuracy of 94.44%. At 7.5 Hz, the amplitudes of the simulated and tested vibration response curves are 0.0426 m/s2 and 0.0424 m/s2, respectively, with an accuracy of 99.67%. In addition, at 10 Hz, the amplitudes of the simulated and tested vibration response curves are 0.0856 m/s2 and 0.0807 m/s2, respectively, with an accuracy of 97.68%. At 12.5 Hz, the amplitudes of the simulated and tested vibration response curves are 0.0561 m/s2 and 0.0519 m/s2, respectively, with an accuracy of 92.52%. Meanwhile, according to the RMS value of the vibration response curve, the simulation and test results are 0.0102 m/s2 and 0.0098 m/s2, respectively, with an accuracy of 96.08%. According to the above analysis, the accuracy of each index reaches more than 90%, so it shows that the simulation accuracy of this human-seat model meets the requirements.
4. Seat Comfort Optimization Research
4.1. Optimized Scheme
In order to improve the body pressure comfort and vibration comfort of the seat, the design of the experiment in [34] is used to evaluate and optimize seat comfort, and the influence of different regions on seat comfort is divided, as shown in Figure 12. Precisely, regions one and two correspond to the ischium region; three, four, five, and six correspond to the thigh region. A reasonable comfort requirement should meet the body pressure distribution in normal posture corresponding to human biomechanics, i.e., the body pressure distribution between the contact interface of the passenger and the seat cushion should gradually decrease from the ischium joint as the center of pressure to the surrounding [35].
The peak pressure is the maximum value among all the measurement points. The higher the peak pressure, the stiffer the cushion. The following equation is used to calculate the ischium peak pressure and the thigh peak pressure:
where: Pm indicates the ischium peak pressure or the anterior thigh peak pressure; N is the number of measurement points in the corresponding area; Pi (I = 1~N) is the pressure of the measurement points in the corresponding area.
The mean pressure is the arithmetic mean at all pressure points. It is directly affected by the hardness of the sponge. The greater the mean pressure, the harder the cushion. The ischium and thigh mean pressure is calculated using the following equation:
where: Pv indicates the ischium mean pressure or the thigh mean pressure.
The seat sponge hardness is an important characteristic that reflects the seat’s comfort. As mentioned before, the seat backrest mainly plays a supportive role. It has a small carrying area for the human body compared to the cushion, which is more effective for optimizing the seat cushion [36]. Therefore, in this paper, only the hardness of the cushion sponge is optimized, and this paper adjusts the upper and lower sponge materials’ force-displacement curves (stiffness characteristics) to change their hardness. According to the test design, the stiffness of the upper and lower layers is reduced and increased by 10% and 15%, respectively, on the original seat. In order to achieve the best comfort with different stiffness of the upper and lower layers of the cushion. Accordingly, the test analysis is carried out, and the design scheme of two factors (upper layer sponge and lower layer sponge) and four levels (hardness −10%, hardness −15%, hardness +10%, hardness +15%) is generated. The different hardness seat surfaces are shown in Figure 13. In the simulation software, to study its influence on the comfort evaluation indexes of body pressure distribution, the ischium peak pressure, the ischium mean pressure, the thigh peak pressure, and the thigh mean pressure are calculated, respectively.
There are 16 combinations of all combinations in this program. Since the study results are too large, only the results with more obvious improvement effects and representative ones are selected in this section for presentation and explanation. The pressure map and evaluation indexes of the cushion with different hardness are obtained by simulation, as shown in Figure 14 and Table 4, respectively. First, the upper sponge hardness is reduced on the original sponge. It can be seen that when the sponge hardness is changed from the original state to −10%/+15%, the ischium peak pressure does not change much, the other indexes are reduced, and the pressure map is reasonably distributed, so the comfort of the −10%/+15% cushion is better than that of the original state. The sponge hardness is reduced to −10%/−10%, the ischium peak pressure and the thigh peak pressure are comparable, but the mean pressure is reduced, and the distribution of the pressure map is reasonable, so −10%/−10% comfort is better than −10%/+15%. When the sponge hardness is reduced to −15%/−15%, the pressure distribution map appears with extreme value points in a minimal area; at this time, the human hip is locally stressed, and the comfort is reduced. It can be seen that, relative to the original state, the sponge hardness changes to −10%/−10% when the four indexes are reduced.
Subsequently, the upper layer of sponge hardness is increased on top of the original sponge. As the sponge hardness is changed from the original state to +15%/−10%, the values of all four indexes increase, making the seat less comfortable. When the sponge hardness is changed from the original state to +15%/+10%, the pressure indexes in the ischium region increase while the pressure indexes in the thigh region decrease, which is due to the reason that as the cushion sponge hardness increases, the weight of the body in the ischium region increases while the thigh region decreases accordingly. This change is more apparent when the sponge hardness is changed from the original state to +15%/+15%. In summary, reducing the hardness of the upper and lower cushion sponge to about 10% at the same time can be more obvious to improve body pressure comfort.
4.2. Optimization Validation
4.2.1. Optimized Verification of the Body Pressure Distribution Comfort
Based on the above analysis, the upper and lower cushion sponge hardness is reduced by 10%, and the reasonableness of the above optimization scheme is verified through the test. Since excavator drivers vary in stature, the body pressure distribution test is carried out on the original cushion sponge and the improved cushion sponge by four subjects of different heights and weights (including the 50 percentile test subject). The subjects’ height and weight information are shown in Table 5. The ischium peak pressure, ischium mean pressure, thigh peak pressure, and thigh mean pressure of different subjects are measured. The test state and boundary conditions are consistent with Section 3.3, and the pressure distribution maps and body pressure distribution comfort evaluation indexes of the original cushion sponge and the improved cushion sponge are obtained, as shown in Figure 15 and Table 6, respectively. In the body pressure distribution test of four different subjects, the body pressure distribution evaluation indexes of the improved seat are smaller than the original seat. For subject three (50 percentile human), the four items of body pressure distribution comfort performance are improved by 1.5%, 26.2%, 15.5%, and 11.9%, respectively. In addition, the fourth subject (operator with high height and weight) has the most apparent improvement effect of the indexes. At the same time, the red area (extreme pressure area) of the improved seat is reduced when observing the pressure map of the body pressure distribution. This shows that reducing the hardness of the sponge can significantly improve the body pressure comfort of the seat.
4.2.2. Vibration Comfort Optimization Verification
The vibration response is conducted in parallel with the body pressure distribution test, i.e., the crushing condition vibration acceleration excitation signal is applied in the z-direction of the seat skeleton, and the seat cushion vibration acceleration response is extracted. Figure 16 shows the total vibration values of different subjects in the original and improved seat under crushing conditions. RMS of 0.0489 m/s2 and 0.0432 m/s2 for subject one on the original seat and improved seat; 0.0685 m/s2 and 0.0476 m/s2 for subject two; 0.0551 m/s2 and 0.0488 m/s2 for subject three; 0.0673 m/s2 and 0.0415 m/s2 for subject four. Meanwhile, Table 7 shows the vibration isolation rates of the original seat and the improved seat under the crushing condition, which are 4.30 dB and 5.37 dB for subject one; 1.37 dB and 4.53 dB for subject two; 3.26 dB and 4.31 dB for subject three; 1.52 dB and 5.72 dB for subject four. It can be seen that the total value of the vibration response of the improved seat is smaller than that of the original seat for all four subjects, and the vibration isolation rate is improved compared with that of the original seat. Through the critical frequencies of the response curves of each subject, it can be seen that different heights and weights affect the seat’s vibration frequency. The vibration comfort performances of the seat are improved by 11.7%, 30.5%, 11.4%, and 38.3% for different subjects. It can be found that the seat optimization scheme is the most noticeable improvement for the fourth subject, with the most significant decrease in the vibration response curve at each frequency point. Combining the above results, it can be shown that reducing the hardness of the upper and lower layers of the cushion by 10% can significantly improve the seat’s comfort.
5. Conclusions
In this paper, the human-seat coupling system of construction machinery was taken as the research object, and body pressure comfortable and vibration comfort were used as the optimization evaluation indexes to improve the comfort of construction machinery in the working process. Based on the Toyota 50 percentile human model, the finite element simulation model of the human-seat coupling system was established, and the model was verified by the body pressure distribution test and the vibration response test, respectively. Through the test, it could be seen that the simulation and test seat pressure map extreme value points and the cushion transversal and longitudinal pressure distribution curve were in good agreement, the accuracy is higher than 85%, the evaluation indexes and RMS accuracy of the simulation and test vibration response curve at each key frequency points were higher than 90%, which could indicate that the established simulation model had a high degree of confidence. Subsequently, based on the simulation model, the seat cushion sponge hardness was changed based on the original seat performance, and the body pressure comfortable evaluation indexes of ischium peak pressure, ischium mean pressure, thigh peak pressure, and thigh mean pressure were used to evaluate the improved seat, and the optimization scheme was proposed. Finally, four subjects with different heights and weights were selected to evaluate the comfort of body pressure distribution and vibration comfort under crushing conditions of the improved seat, and it could be seen that the pressure indexes of the four subjects on the improved seat were lower than that of the original seat, and the vibration isolation rate was improved. Therefore, reducing the hardness of the upper and lower layers of the seat cushion sponge by 10% could significantly improve the seat’s comfort.
Author Contributions
L.C., writing—review and editing; H.W., writing—original draft preparation; X.N., visualization; C.Z., validation; W.Z., methodology; H.H., conceptualization, funding acquisition. All authors have read and agreed to the published version of the manuscript.
Funding
This research was funded by the National Natural Science Foundation of China (No. 51905408), the SWJTU Science and Technology Innovation Project, grant number 2682022CX008, 2682021ZTPY068.
Data Availability Statement
Not applicable.
Conflicts of Interest
The authors declare no conflict of interest.
References
- Kolich, M.; Taboun, S. Ergonomics modelling and evaluation of automobile seat comfort. Ergonomics 2004, 47, 841–863. [Google Scholar] [CrossRef] [PubMed]
- Manentca, I.; Corlett, A. A Model of Vehicle Comfort and a Method for Its Assessment. Ergonomics 1973, 16, 849–854. [Google Scholar] [CrossRef]
- Huang, H.B.; Wu, J.H.; Huang, X.R.; Yang, M.L.; Ding, W.P. A generalized inverse cascade method to identify and optimize vehicle interior noise sources. J. Sound Vib. 2020, 467, 115062. [Google Scholar] [CrossRef]
- McMahon, K.J. Whole-Body Vibration Comfort Measurement aboard the S. A. Agulhas II and just Noticeable Difference Threshold Testing in the Laboratory. Master’s Thesis, Stellenbosch University, Stellenbosch, South Africa, 2014. [Google Scholar]
- Park, S.; Kim, C. The Evaluation of Seating Comfort by the Objective Measures; SAE International: Warrendale, PA, USA, 1997. [Google Scholar] [CrossRef]
- Huang, H.; Huang, X.; Ding, W.; Zhang, S.; Pang, J. Optimization of electric vehicle sound package based on LSTM with an adaptive learning rate forest and multiple-level multiple-object method. Mech. Syst. Signal Process. 2023, 187, 109932. [Google Scholar] [CrossRef]
- Inagaki, H.; Taguchi, T.; Yasuda, E.; Iizuka, Y. Evaluation of riding comfort: From the viewpoint of interaction of human body and seat for static, dynamic, long time driving. SAE Trans. 2000, 109, 960–964. [Google Scholar] [CrossRef]
- Hartung, J.; Mergl, C.; Bubb, H. Reliability of Pressure Measurement on Car Seats. SAE Trans. 2004, 113, 874–880. [Google Scholar] [CrossRef]
- Huang, H.; Huang, X.; Ding, W.; Yang, M.; Yu, X.; Pang, J. Vehicle vibro-acoustical comfort optimization using a multi-objective interval analysis method. Expert Syst. Appl. 2023, 213, 119001. [Google Scholar] [CrossRef]
- Milivojevich, A.; Stanciu, R.; Russ, A.; Blair, G.R.; Heumen, J.D. Investigating Psychometric and Body Pressure Distribution Responses to Automotive Seating Comfort; SAE International: Warrendale, PA, USA, 2000. [Google Scholar] [CrossRef]
- Gruevski, K.M.; Holmes, M.W.; Gooyers, C.E.; Dickerson, C.R.; Callaghan, J.P. Lumbar postures, seat interface pressures and discomfort responses to a novel thoracic support for police officers during prolonged simulated driving exposures. Appl. Ergon. 2016, 52, 160–168. [Google Scholar] [CrossRef]
- Park, S.; Min, S.N.; Subramaniyam, M.; Lee, D.; Lee, H.; Kim, D.G. Analysis of Body Pressure Ratio for Evaluation of Automotive Seating Comfort; SAE International: Warrendale, PA, USA, 2014. [Google Scholar] [CrossRef]
- Mergl, C.; Klendauer, M.; Mangen, C.; Bubb, H. Predicting Long Term Riding Comfort in Cars by Contact Forces between Human and Seat; SAE International: Warrendale, PA, USA, 2005. [Google Scholar] [CrossRef]
- Ebe, K.; Griffin, M.J. Factors affecting static seat cushion comfort. Ergonomics 2001, 44, 901–921. [Google Scholar] [CrossRef]
- Basri, B.; Griffin, M.J. The application of SEAT values for predicting how compliant seats with backrests influence vibration discomfort. Appl. Ergon. 2014, 45, 1461–1474. [Google Scholar] [CrossRef] [Green Version]
- Nawayseh, N. Effect of the seating condition on the transmission of vibration through the seat pan and backrest. Int. J. Ind. Ergon. 2015, 45, 82–90. [Google Scholar] [CrossRef]
- Huang, H.; Huang, X.; Ding, W.; Yang, M.; Fan, D.; Pang, J. Uncertainty optimization of pure electric vehicle interior tire/road noise comfort based on data-driven. Mech. Syst. Signal Process. 2022, 165, 108300. [Google Scholar] [CrossRef]
- Bhiwapurkar, M.K.; Saran, V.H.; Harsha, S.P. Seat to Head Transmissibility during Exposure to Vertical Seat Vibration: Effects of Posture and Vibration Magnitude. Int. J. Acoust. Vib. 2019, 24, 3–11. [Google Scholar] [CrossRef]
- Fairley, T.E.; Griffin, M.J. A Test Method for the Prediction of Seat Transmissibility; SAE International: Warrendale, PA, USA, 1986. [Google Scholar] [CrossRef]
- Fairley, T.E.; Griffin, M.J. The apparent mass of the seated human body: Vertical vibration. J. Biomech. 1989, 22, 81–94. [Google Scholar] [CrossRef]
- Toward, M.G.; Griffin, M.J. The transmission of vertical vibration through seats: Influence of the characteristics of the human body. J. Sound Vib. 2011, 330, 6526–6543. [Google Scholar] [CrossRef]
- Adam, S.A.; Jalil, N.A. Vertical Suspension Seat Transmissibility and SEAT Values for Seated Person Exposed to Whole-body Vibration in Agricultural Tractor Preliminary Study. Procedia Eng. 2017, 170, 435–442. [Google Scholar] [CrossRef]
- Westhuizen, A.V.; Niekerk, J.L. Verification of seat effective amplitude transmissibility (SEAT) value as a reliable metric to predict dynamic seat comfort. J. Sound Vib. 2006, 295, 1060–1075. [Google Scholar] [CrossRef]
- Du, X.; Ren, J.; Sang, C.; Li, L. Simulation of the interaction between driver and seat. Chin. J. Mech. Eng. 2013, 26, 1234–1242. [Google Scholar] [CrossRef]
- Siefert, A.; Pankoke, S.; Wölfel, H.P. Virtual optimisation of car passenger seats: Simulation of static and dynamic effects on drivers’ seating comfort. Int. J. Ind. Ergon. 2008, 38, 410–424. [Google Scholar] [CrossRef]
- Gyi, D.E.; Porter, J.M. Interface pressure and the prediction of car seat discomfort. Appl. Ergon. 1999, 30, 99–107. [Google Scholar] [CrossRef] [Green Version]
- Zhang, X.; Qiu, Y.; Griffin, M.J. Transmission of vertical vibration through a seat: Effect of thickness of foam cushions at the seat pan and the backrest. Int. J. Ind. Ergon. 2015, 48, 36–45. [Google Scholar] [CrossRef]
- Singh, P.; Raina, S.; Pandey, K.K.; Bansal, S. Effect of Fabric Type and Construction on Automotive Seating Comfort; SAE International: Warrendale, PA, USA, 2013. [Google Scholar] [CrossRef]
- Kolich, M.; Essenmacher, S.D.; McEvoy, J.T. Automotive seating: The effect of foam physical properties on occupied vertical vibration transmissibility. J. Sound Vib. 2005, 281, 409–416. [Google Scholar] [CrossRef]
- Juan, C. Soft Tissue Stress Distribution in Hip-Legs During Sitting. J. Xi’an Jiaotong Univ. 2008, 5, 569–572. [Google Scholar]
- Choi, H.Y.; Kim, K.M.; Kim, C.; Sah, S.; Kim, S.; Hwang, S.H.; Lee, K.; Pyun, J.K.; Montmayeur, N.; Lee, I. Challenge of Lumbar Support Design Using Human Body Models. SAE Int. J. Passeng. Cars—Electron. Electr. Syst. 2008, 1, 1078–1084. [Google Scholar] [CrossRef]
- Iwamoto, M.; Kisanuki, Y.; Watanabe, I.; Furusu, K.; Miki, K.; Hasegawa, J. Development of a finite element model of the total human model for safety (THUMS) and application to injury reconstruction. In Proceedings of the International IRCOBI Conference, Munich, Germany, 18–20 September 2002. [Google Scholar]
- Gyi, D.E.; Porter, J.M.; Robertson, N.K. Seat pressure measurement technologies: Considerations for their evaluation. Appl. Ergon. 1998, 29, 85–91. [Google Scholar] [CrossRef]
- Huang, H.B.; Li, R.X.; Yang, M.L.; Lim, T.C.; Ding, W.P. Evaluation of vehicle interior sound quality using a continuous restricted Boltzmann machine-based DBN. Mech. Syst. Signal Process. 2017, 84, 245–267. [Google Scholar] [CrossRef] [Green Version]
- Dhingra, H.S.; Tewari, V.K.; Singh, S. Discomfort, Pressure Distribution and Safety in Operator’s Seat—A Critical Review. Agric. Eng. Int. 2003, 5, 1–16. [Google Scholar]
- Zhang, X.; Zhang, Q.; Li, Y.; Liu, C.; Qiu, Y. Effect of the thickness of polyurethane foams at the seat pan and the backrest on fore-and-aft in-line and vertical cross-axis seat transmissibility when sitting with various contact conditions of backrest during fore-and-aft vibration. Appl. Ergon. 2021, 93, 103354. [Google Scholar] [CrossRef]
Figure 1.
Human-seat coupling system comfort evaluation and optimization process.
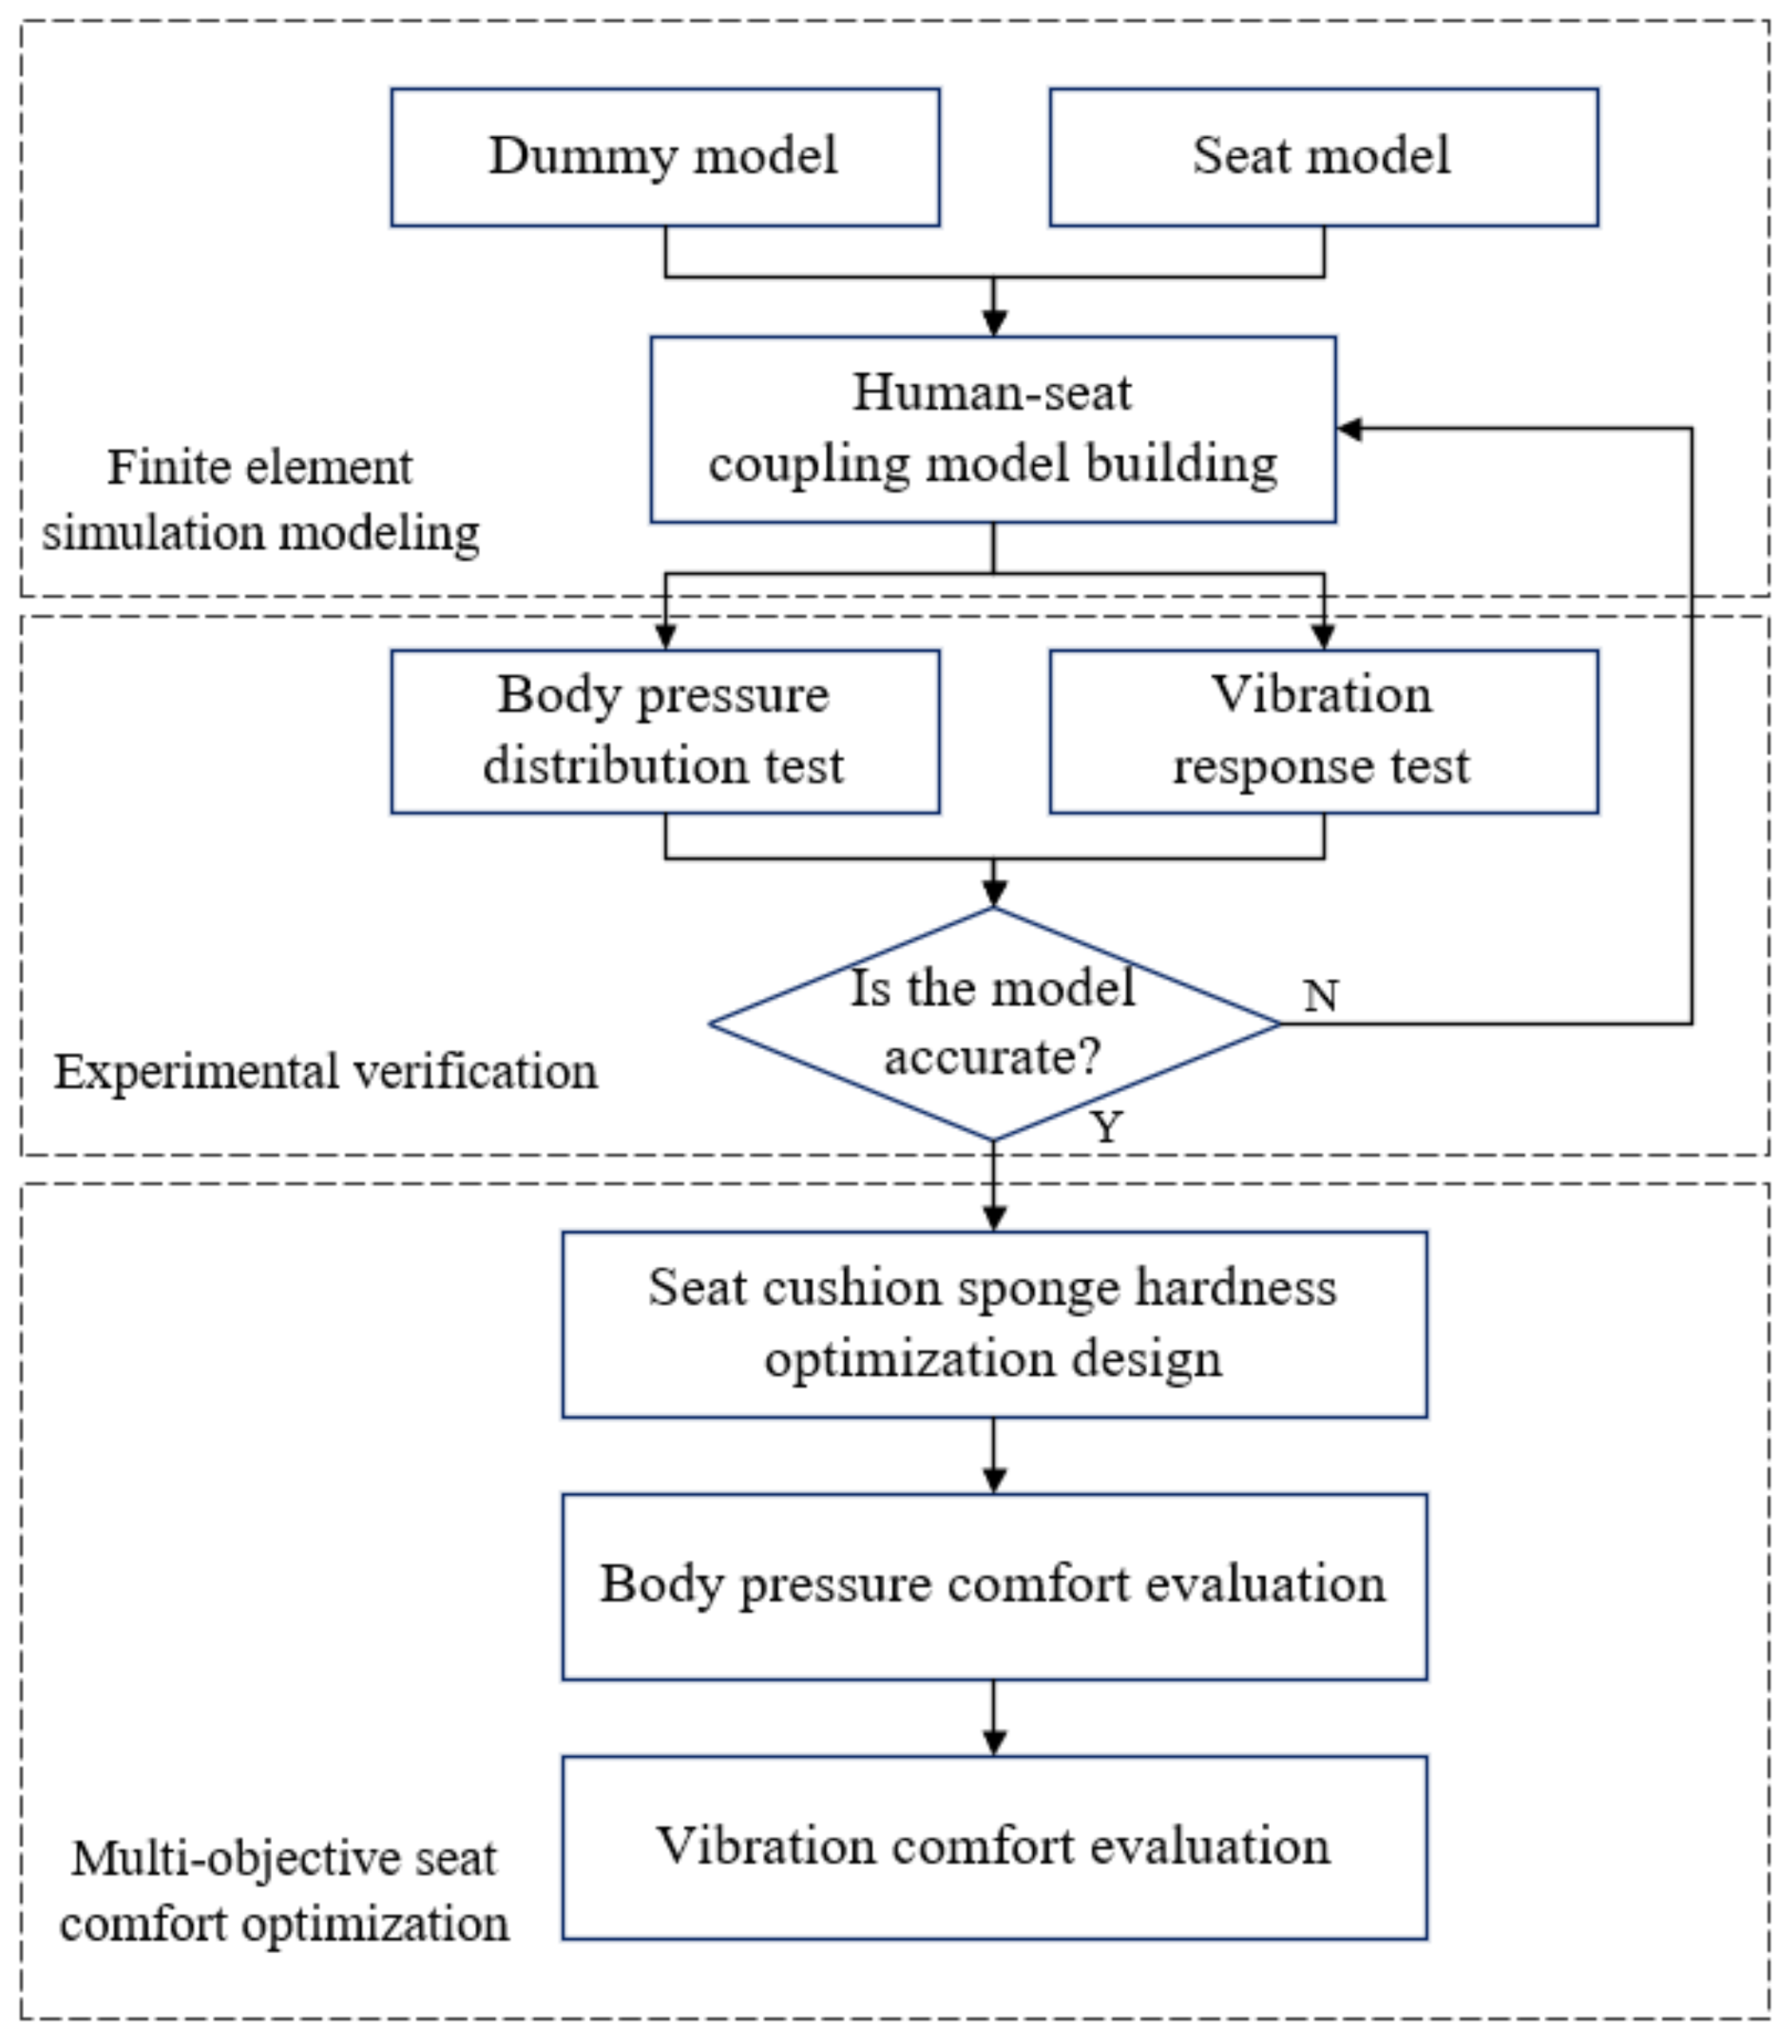
Figure 2.
Toyota 50 percentile dummy model.
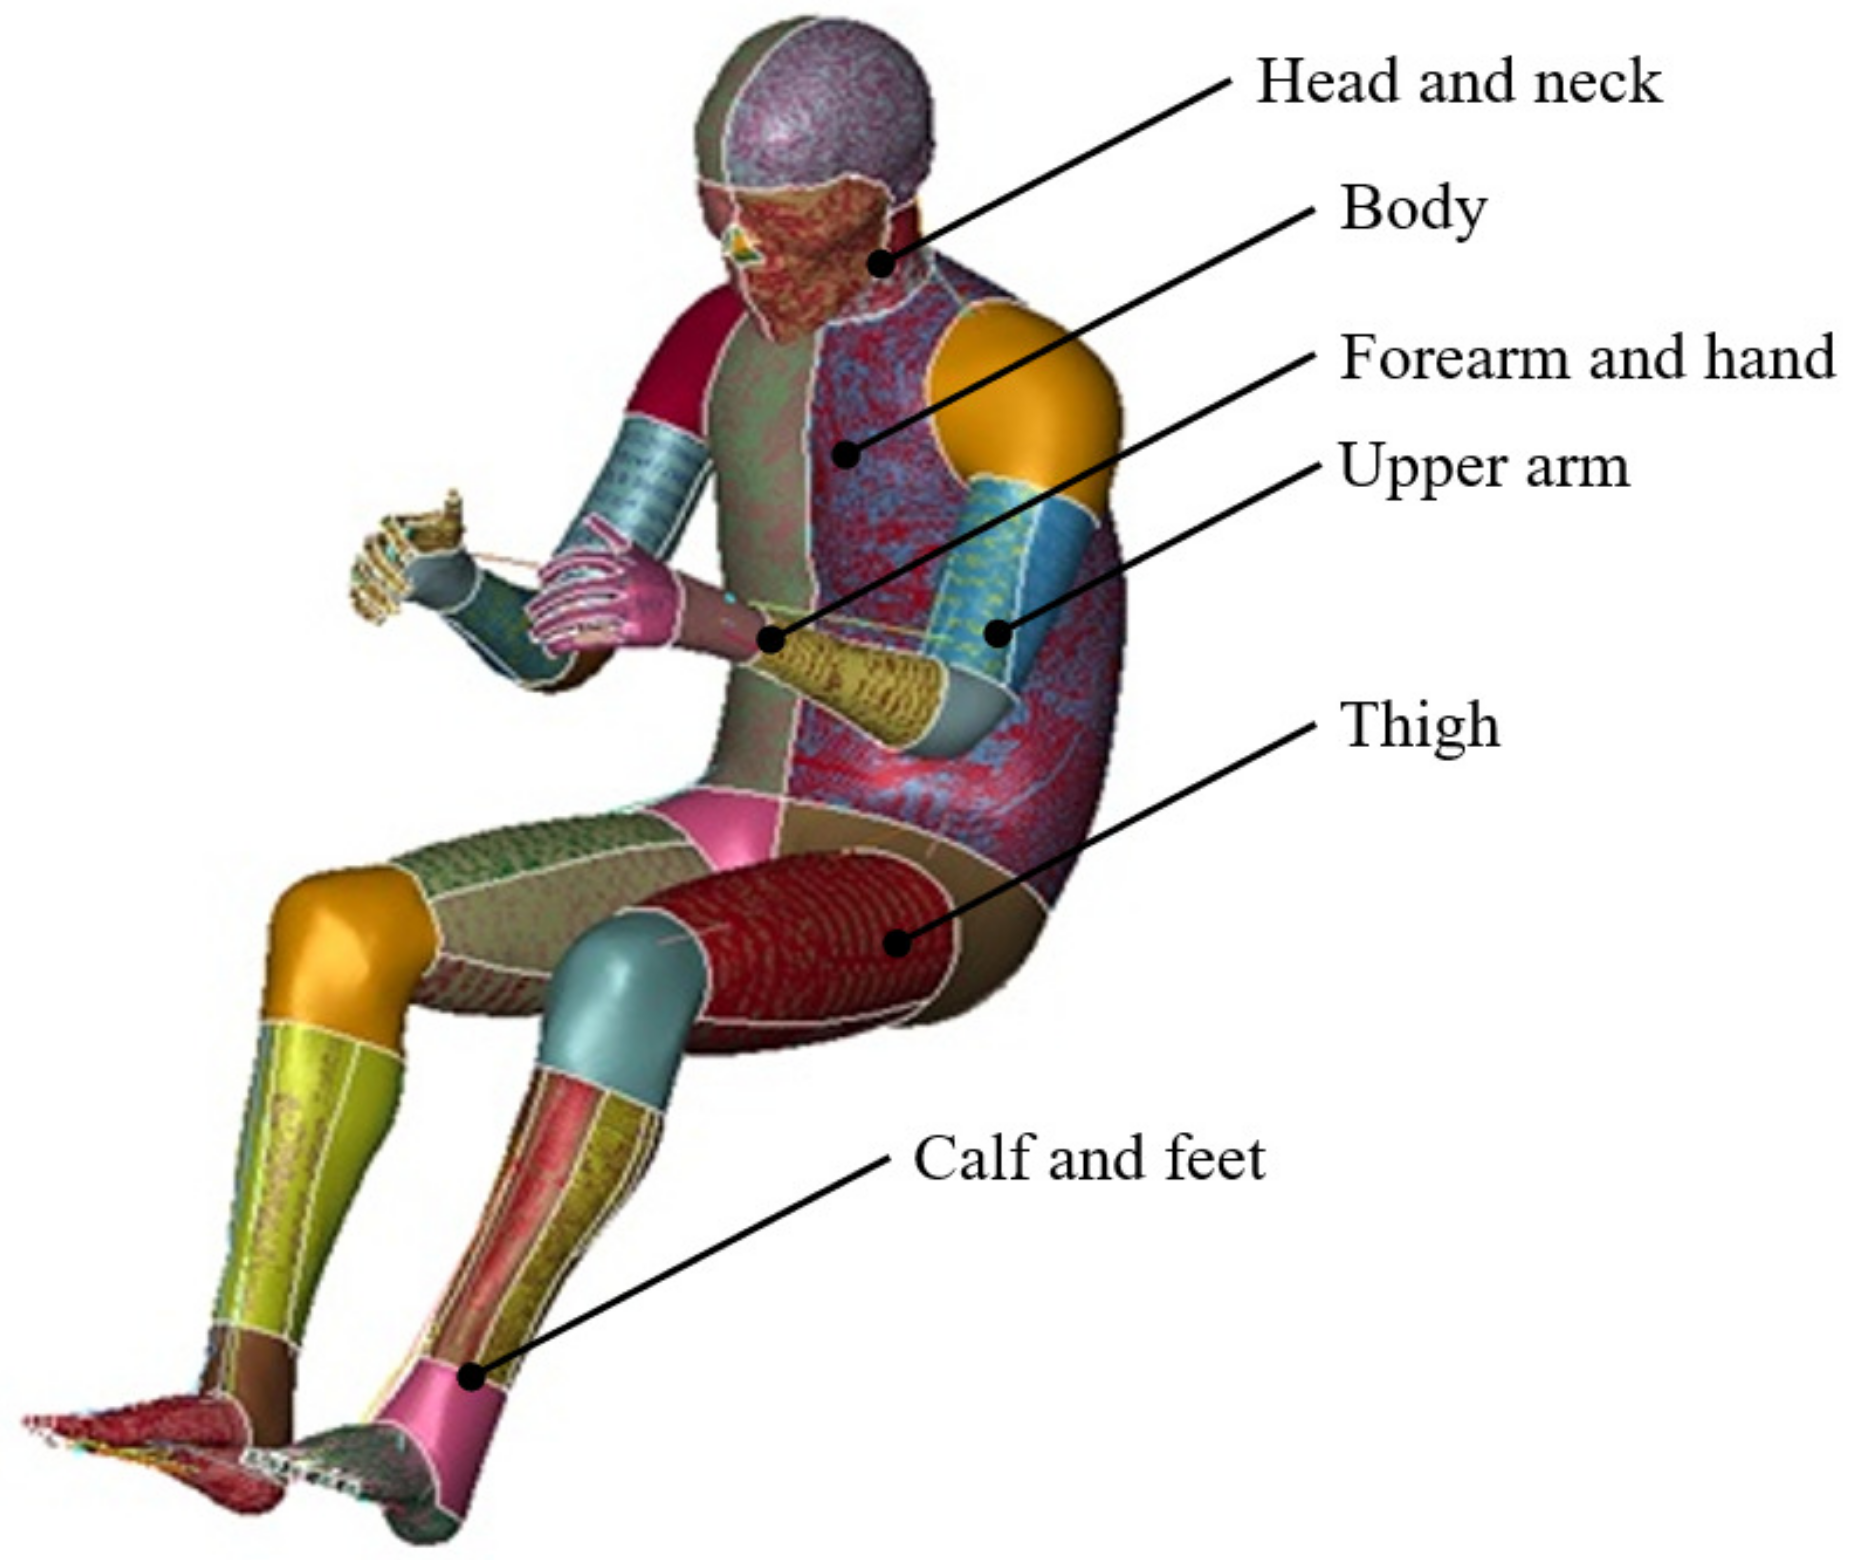
Figure 3.
(a) Seat structure model; (b) Backrest sponge stiffness characteristic; (c) Stiffness characteristic of upper cushion sponge; (d) Stiffness characteristic of lower cushion sponge.
Figure 3.
(a) Seat structure model; (b) Backrest sponge stiffness characteristic; (c) Stiffness characteristic of upper cushion sponge; (d) Stiffness characteristic of lower cushion sponge.
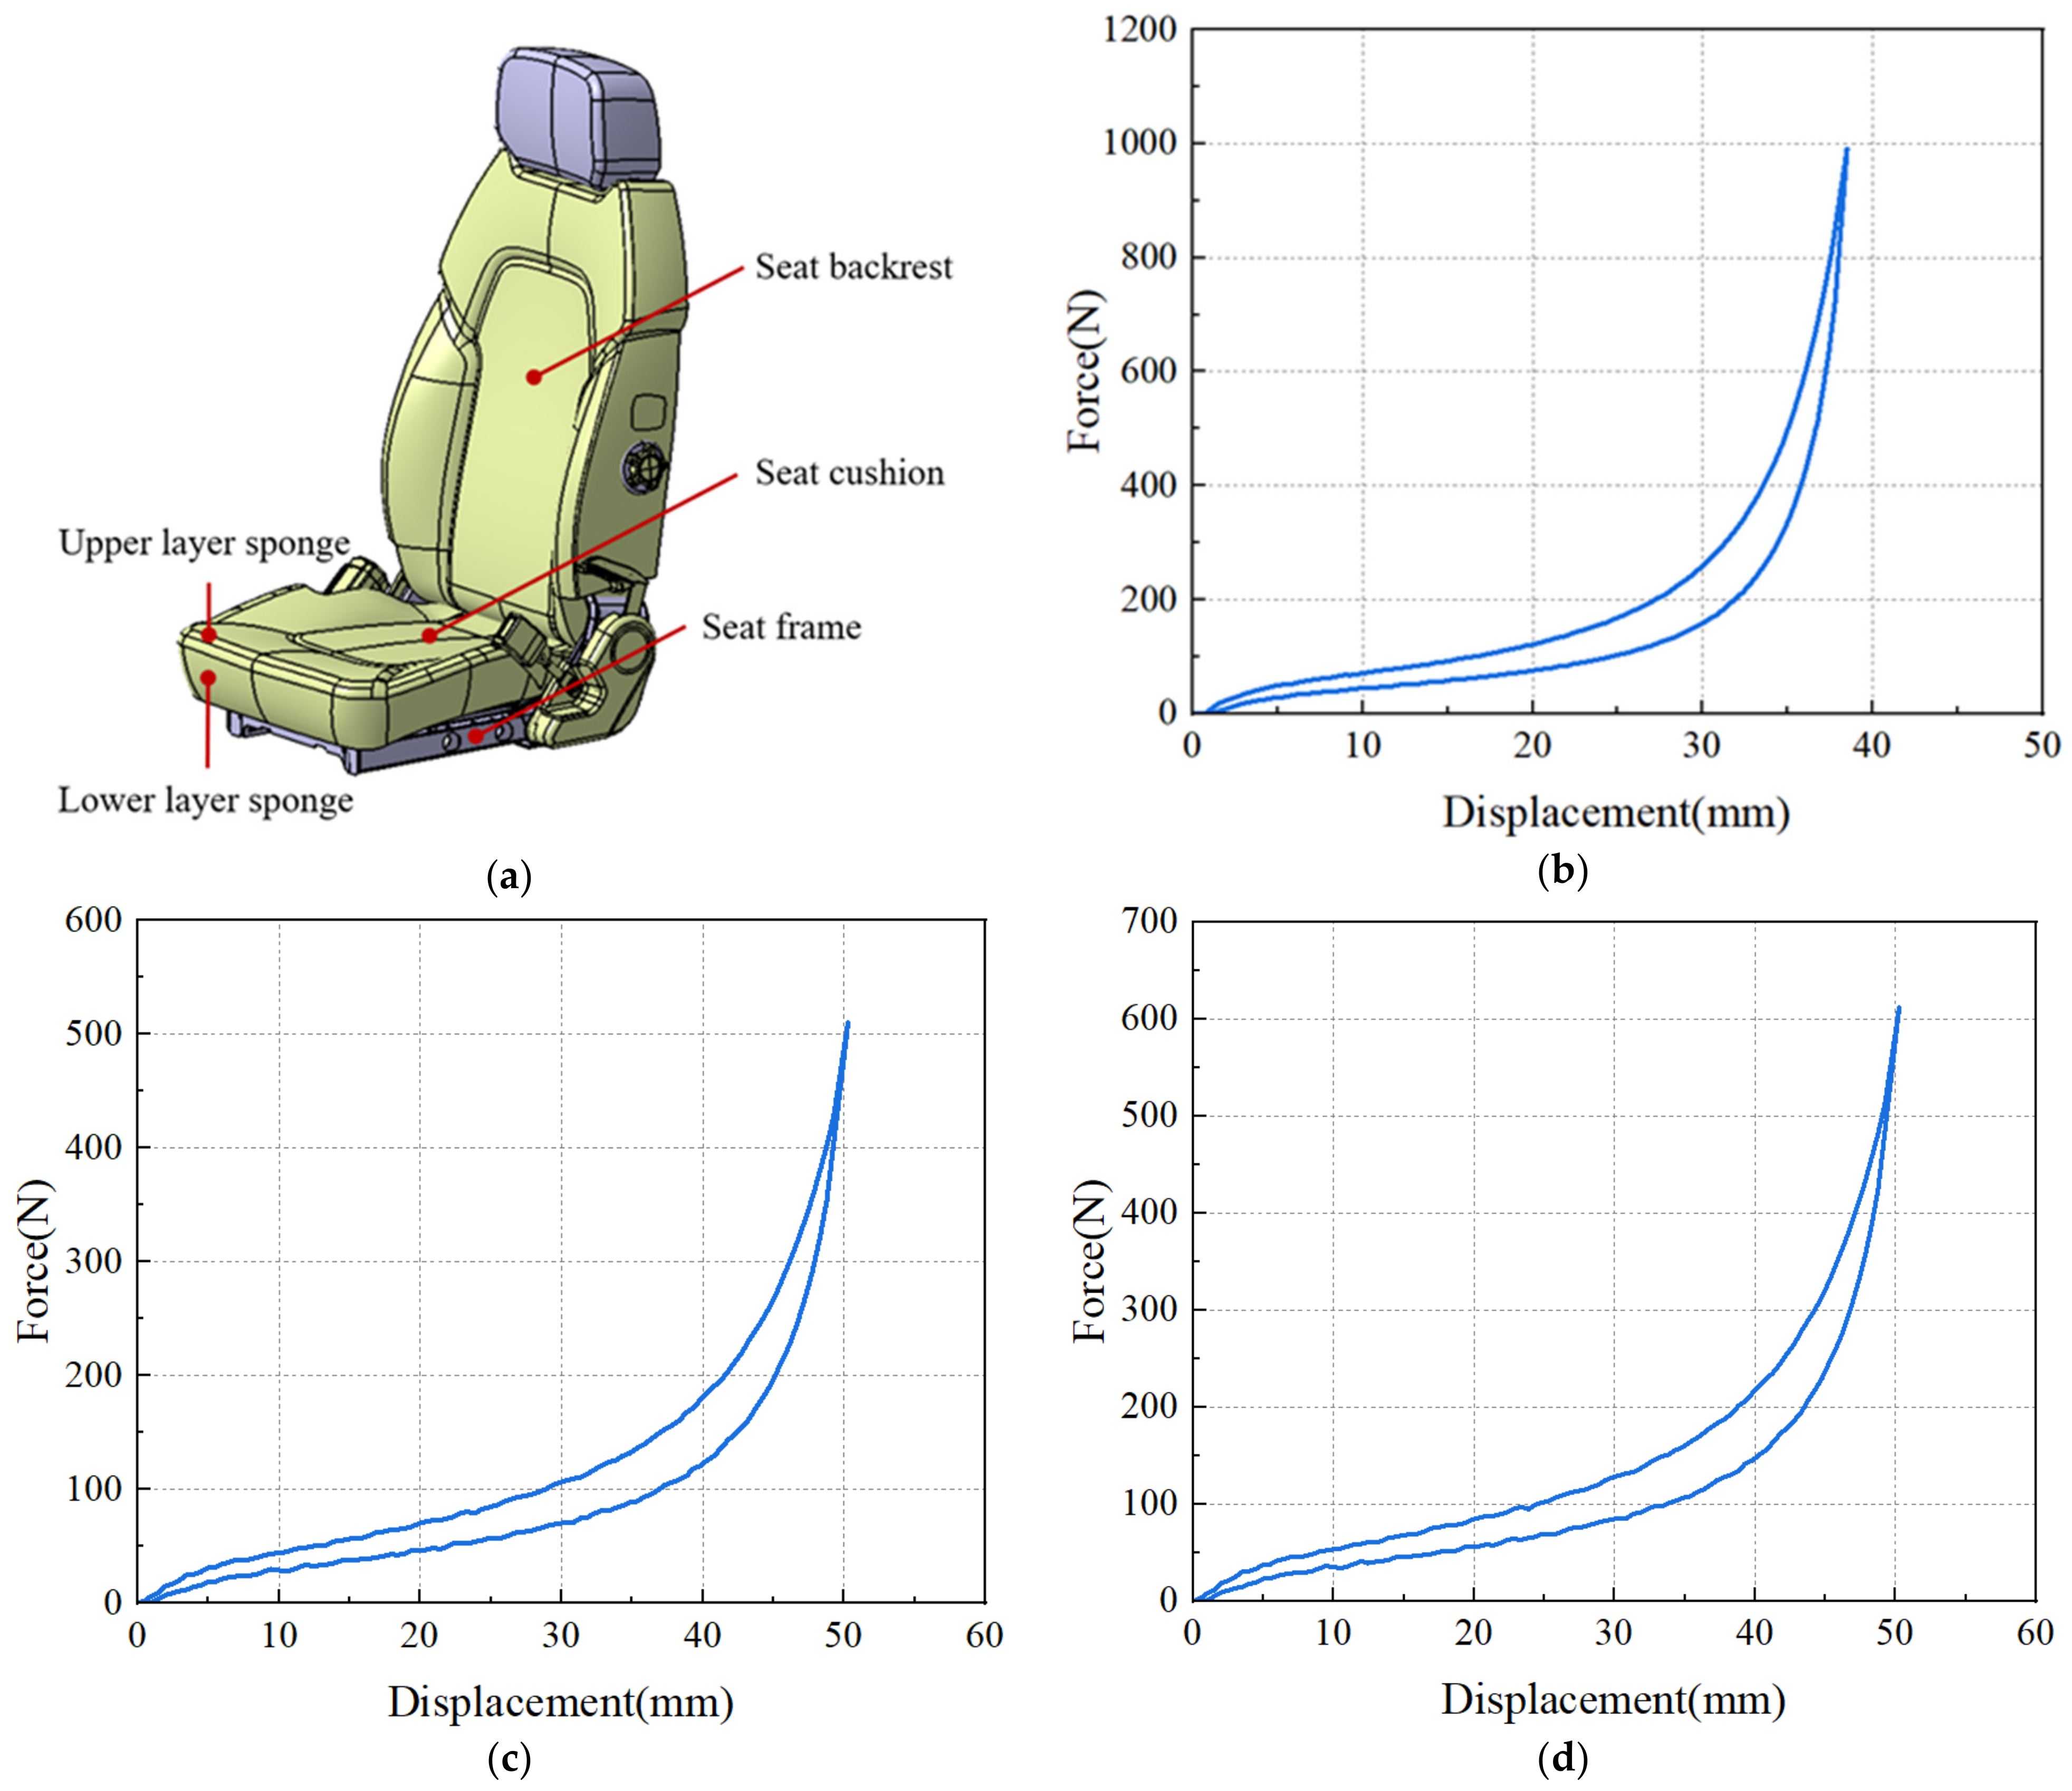
Figure 4.
(a) The seat finite element model without pressure pad; (b) The seat finite element model with pressure pad.
Figure 4.
(a) The seat finite element model without pressure pad; (b) The seat finite element model with pressure pad.
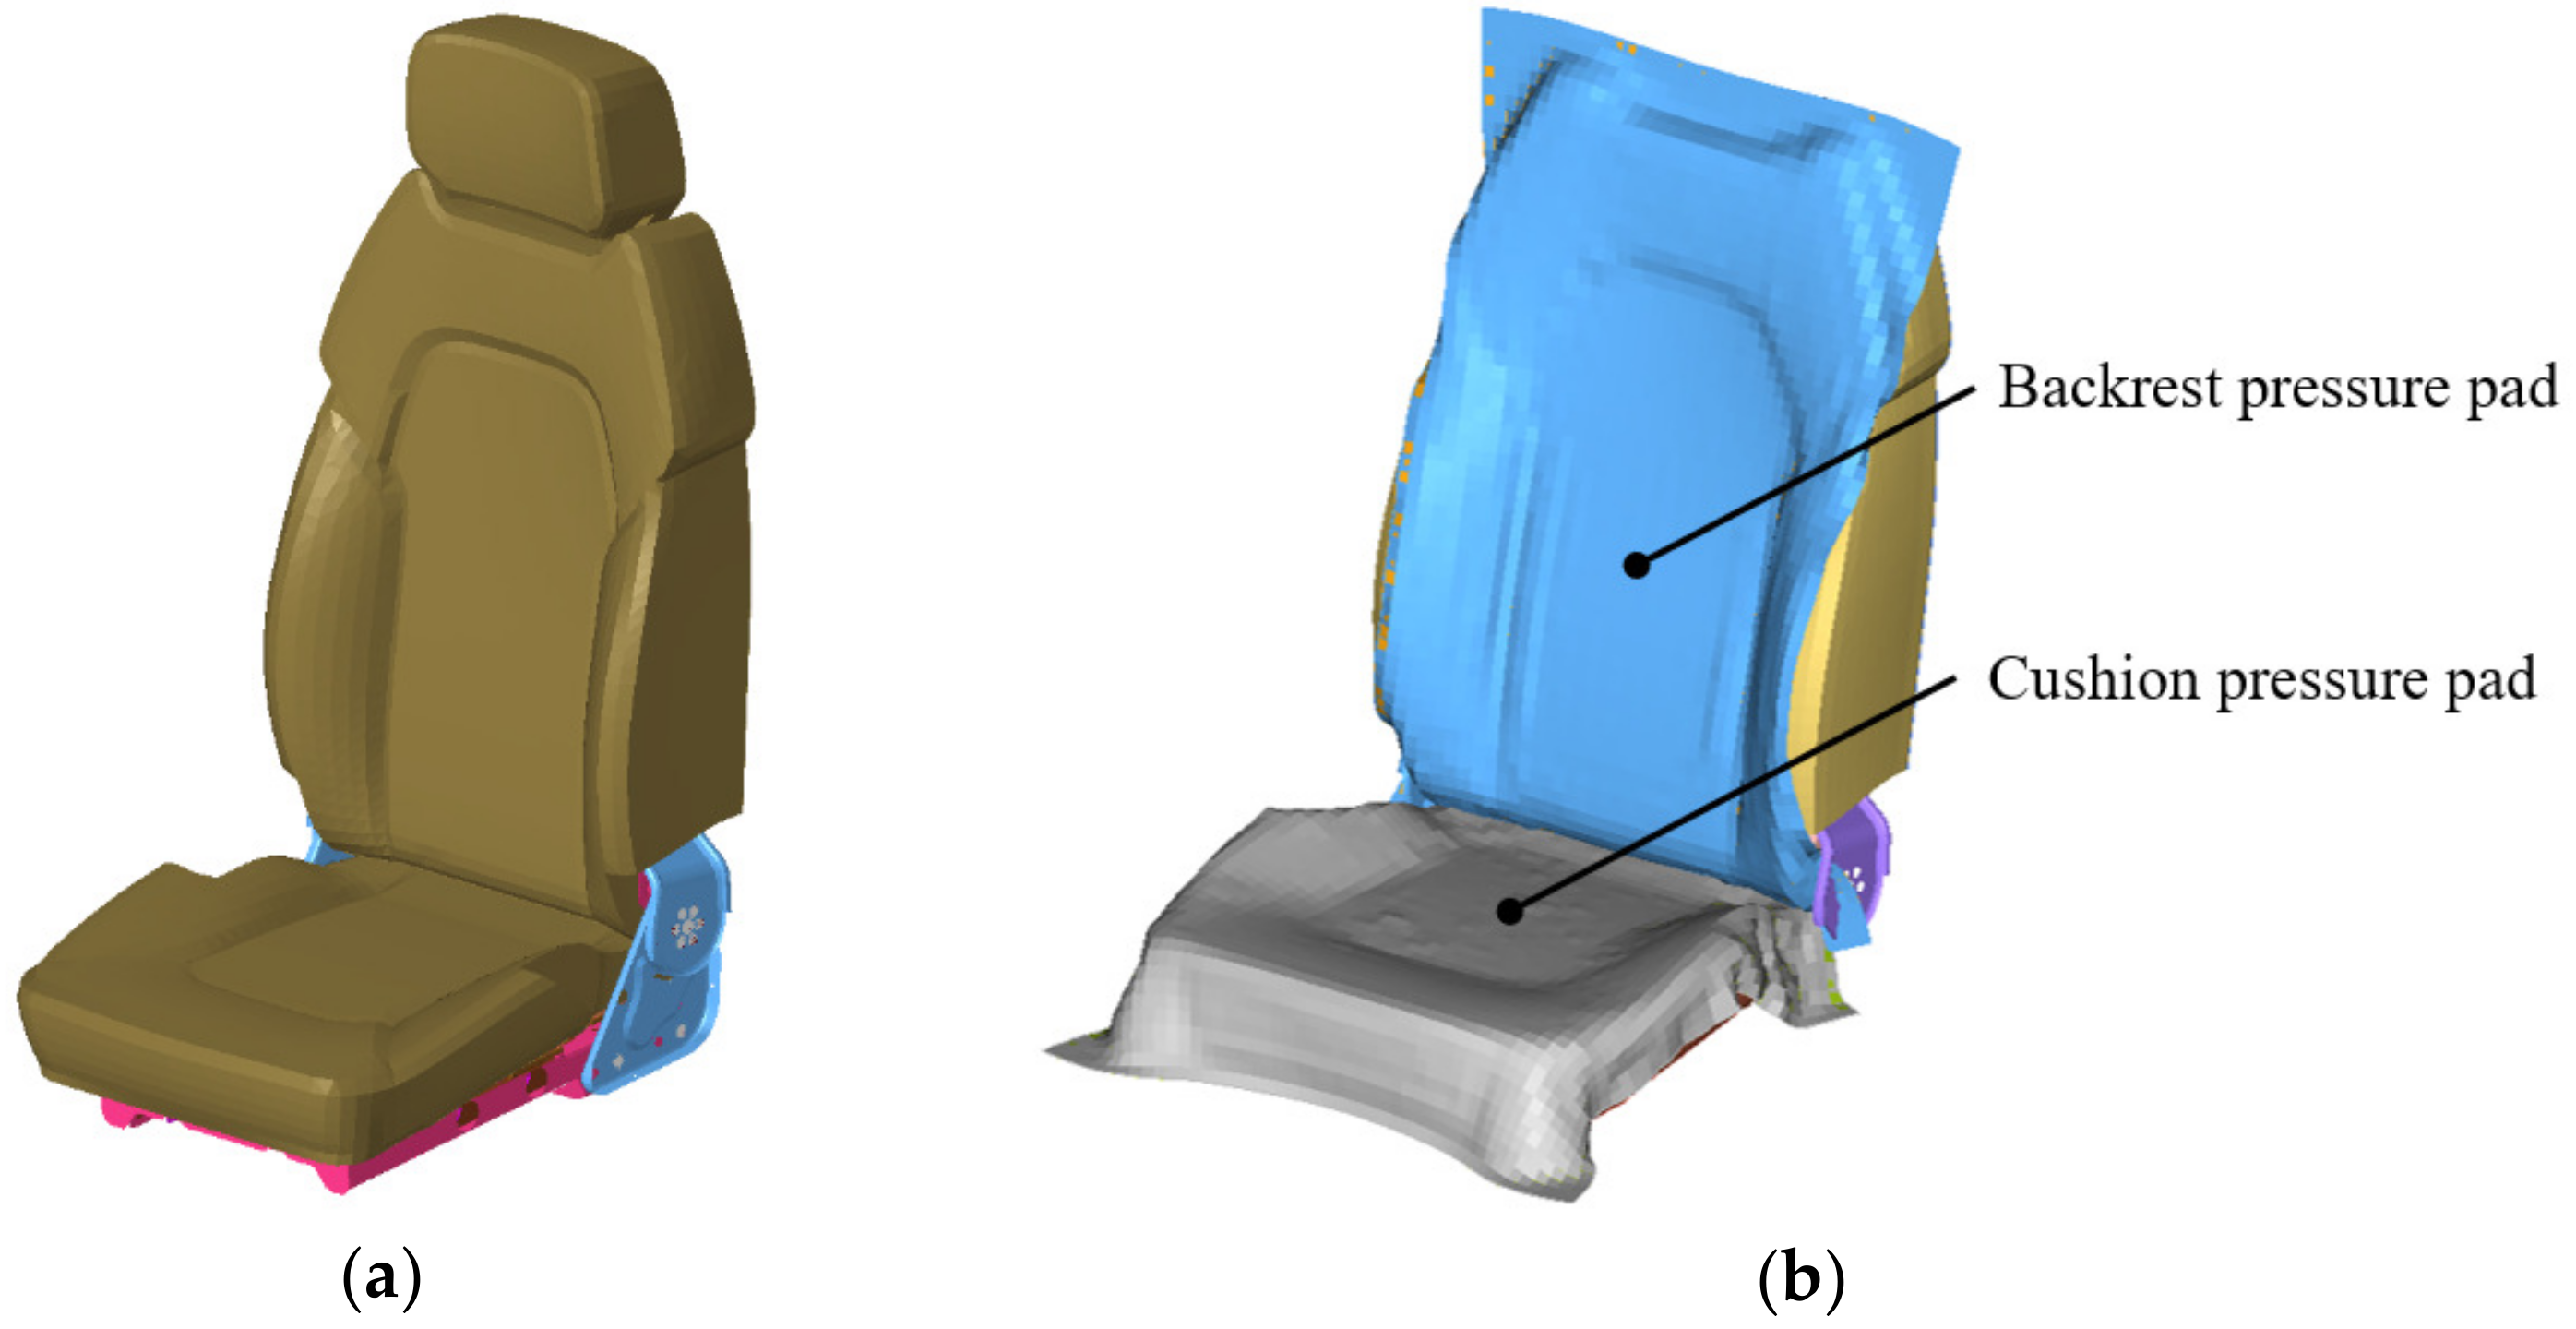
Figure 5.
Human-seat coupling finite element model.
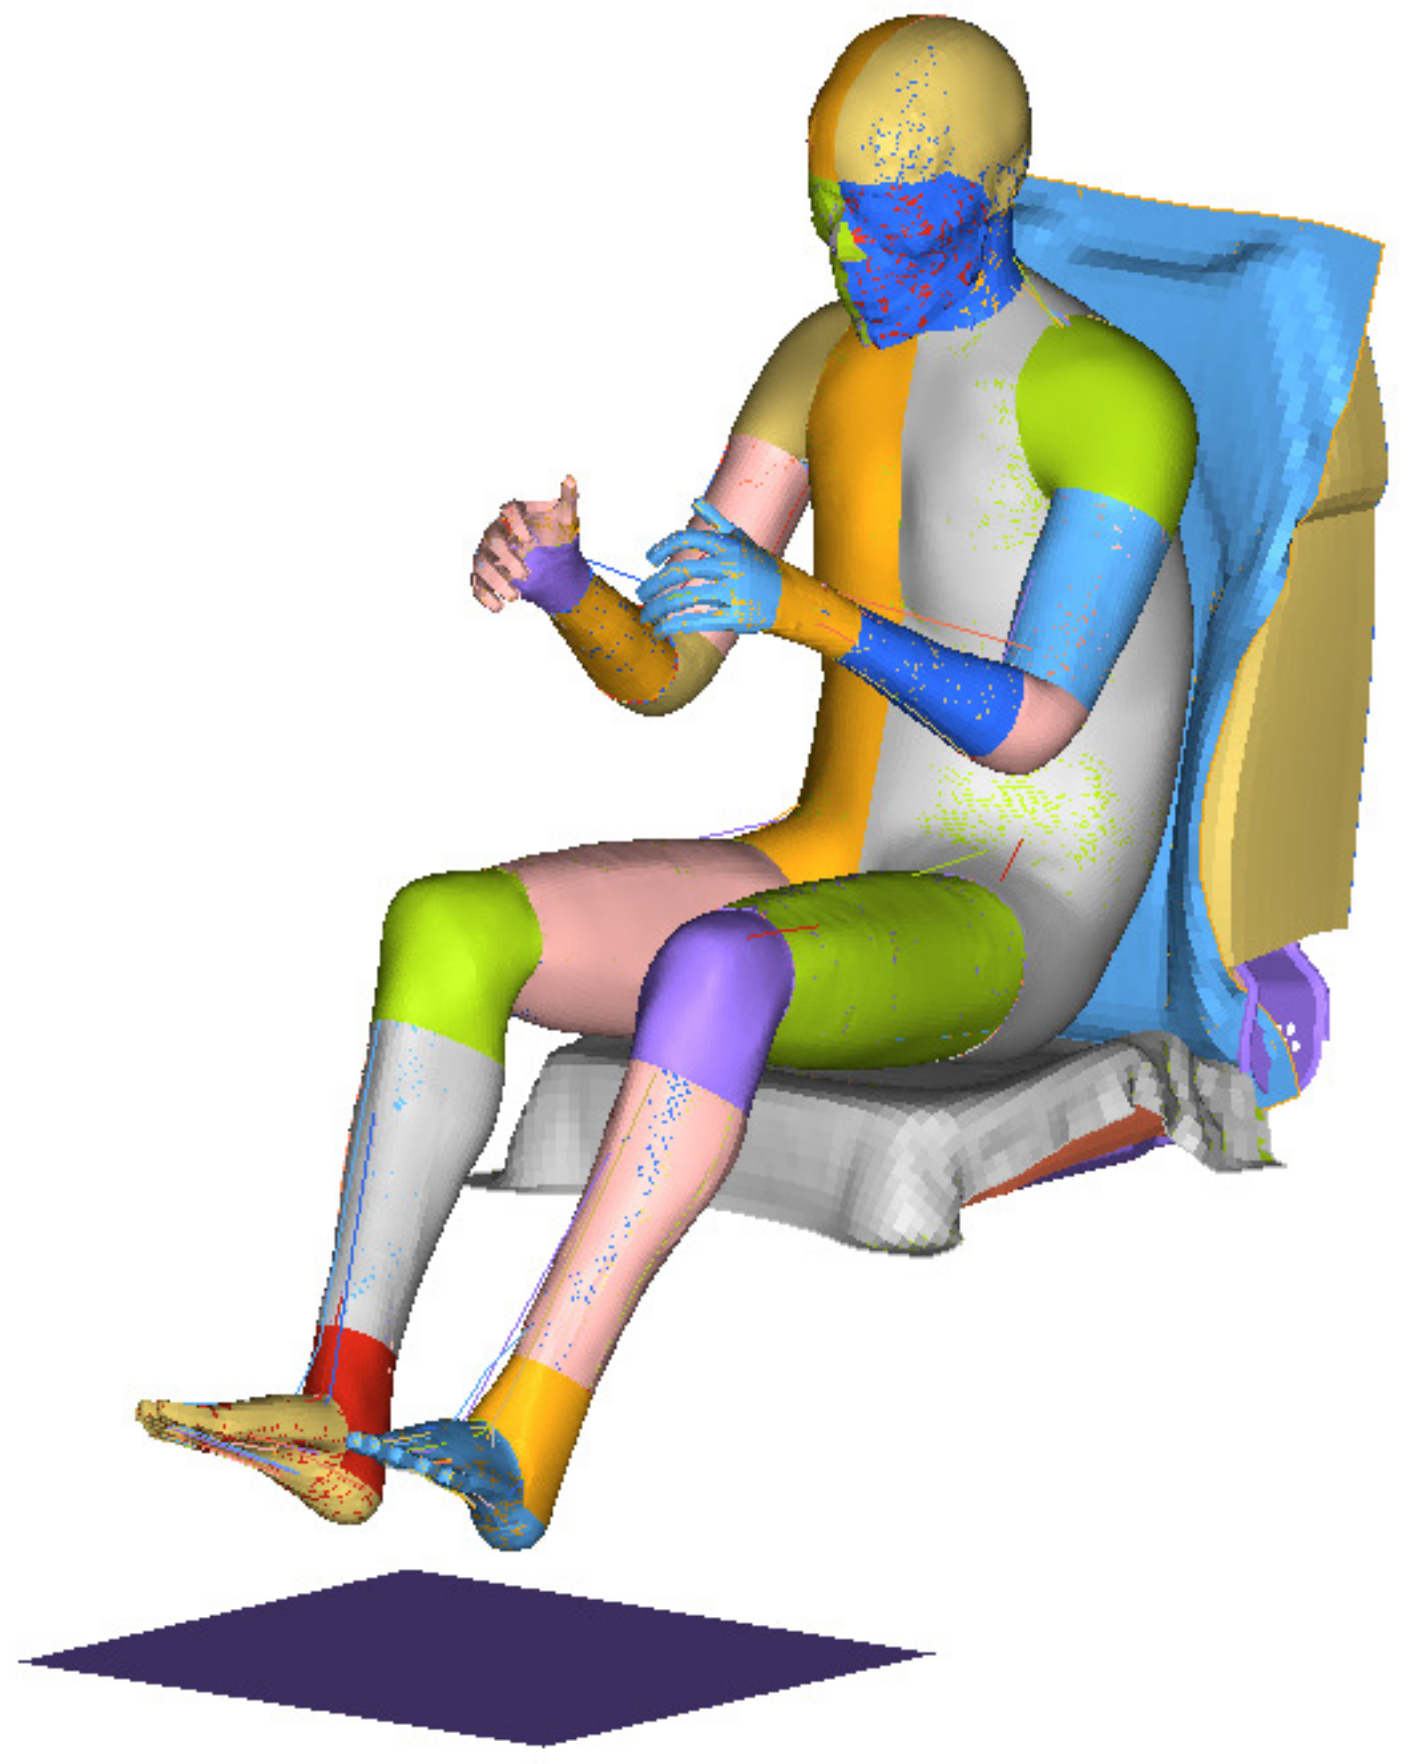
Figure 6.
Body pressure distribution test and vibration response test.

Figure 7.
(a) Seat backrest transversal and longitudinal pressure distribution; (b) Seat cushion transversal and longitudinal pressure distribution.
Figure 7.
(a) Seat backrest transversal and longitudinal pressure distribution; (b) Seat cushion transversal and longitudinal pressure distribution.

Figure 8.
(a) Simulation and test curve comparison of transversal pressure distribution of backrest; (b) Simulation and test curve comparison of longitudinal pressure distribution of backrest; (c) Simulation and test curve comparison of transversal pressure distribution of cushion; (d) Simulation and test curve comparison of longitudinal pressure distribution of cushion.

Figure 9.
(a) The backrest and cushion simulation pressure map; (b) The backrest and cushion test pressure map.
Figure 9.
(a) The backrest and cushion simulation pressure map; (b) The backrest and cushion test pressure map.
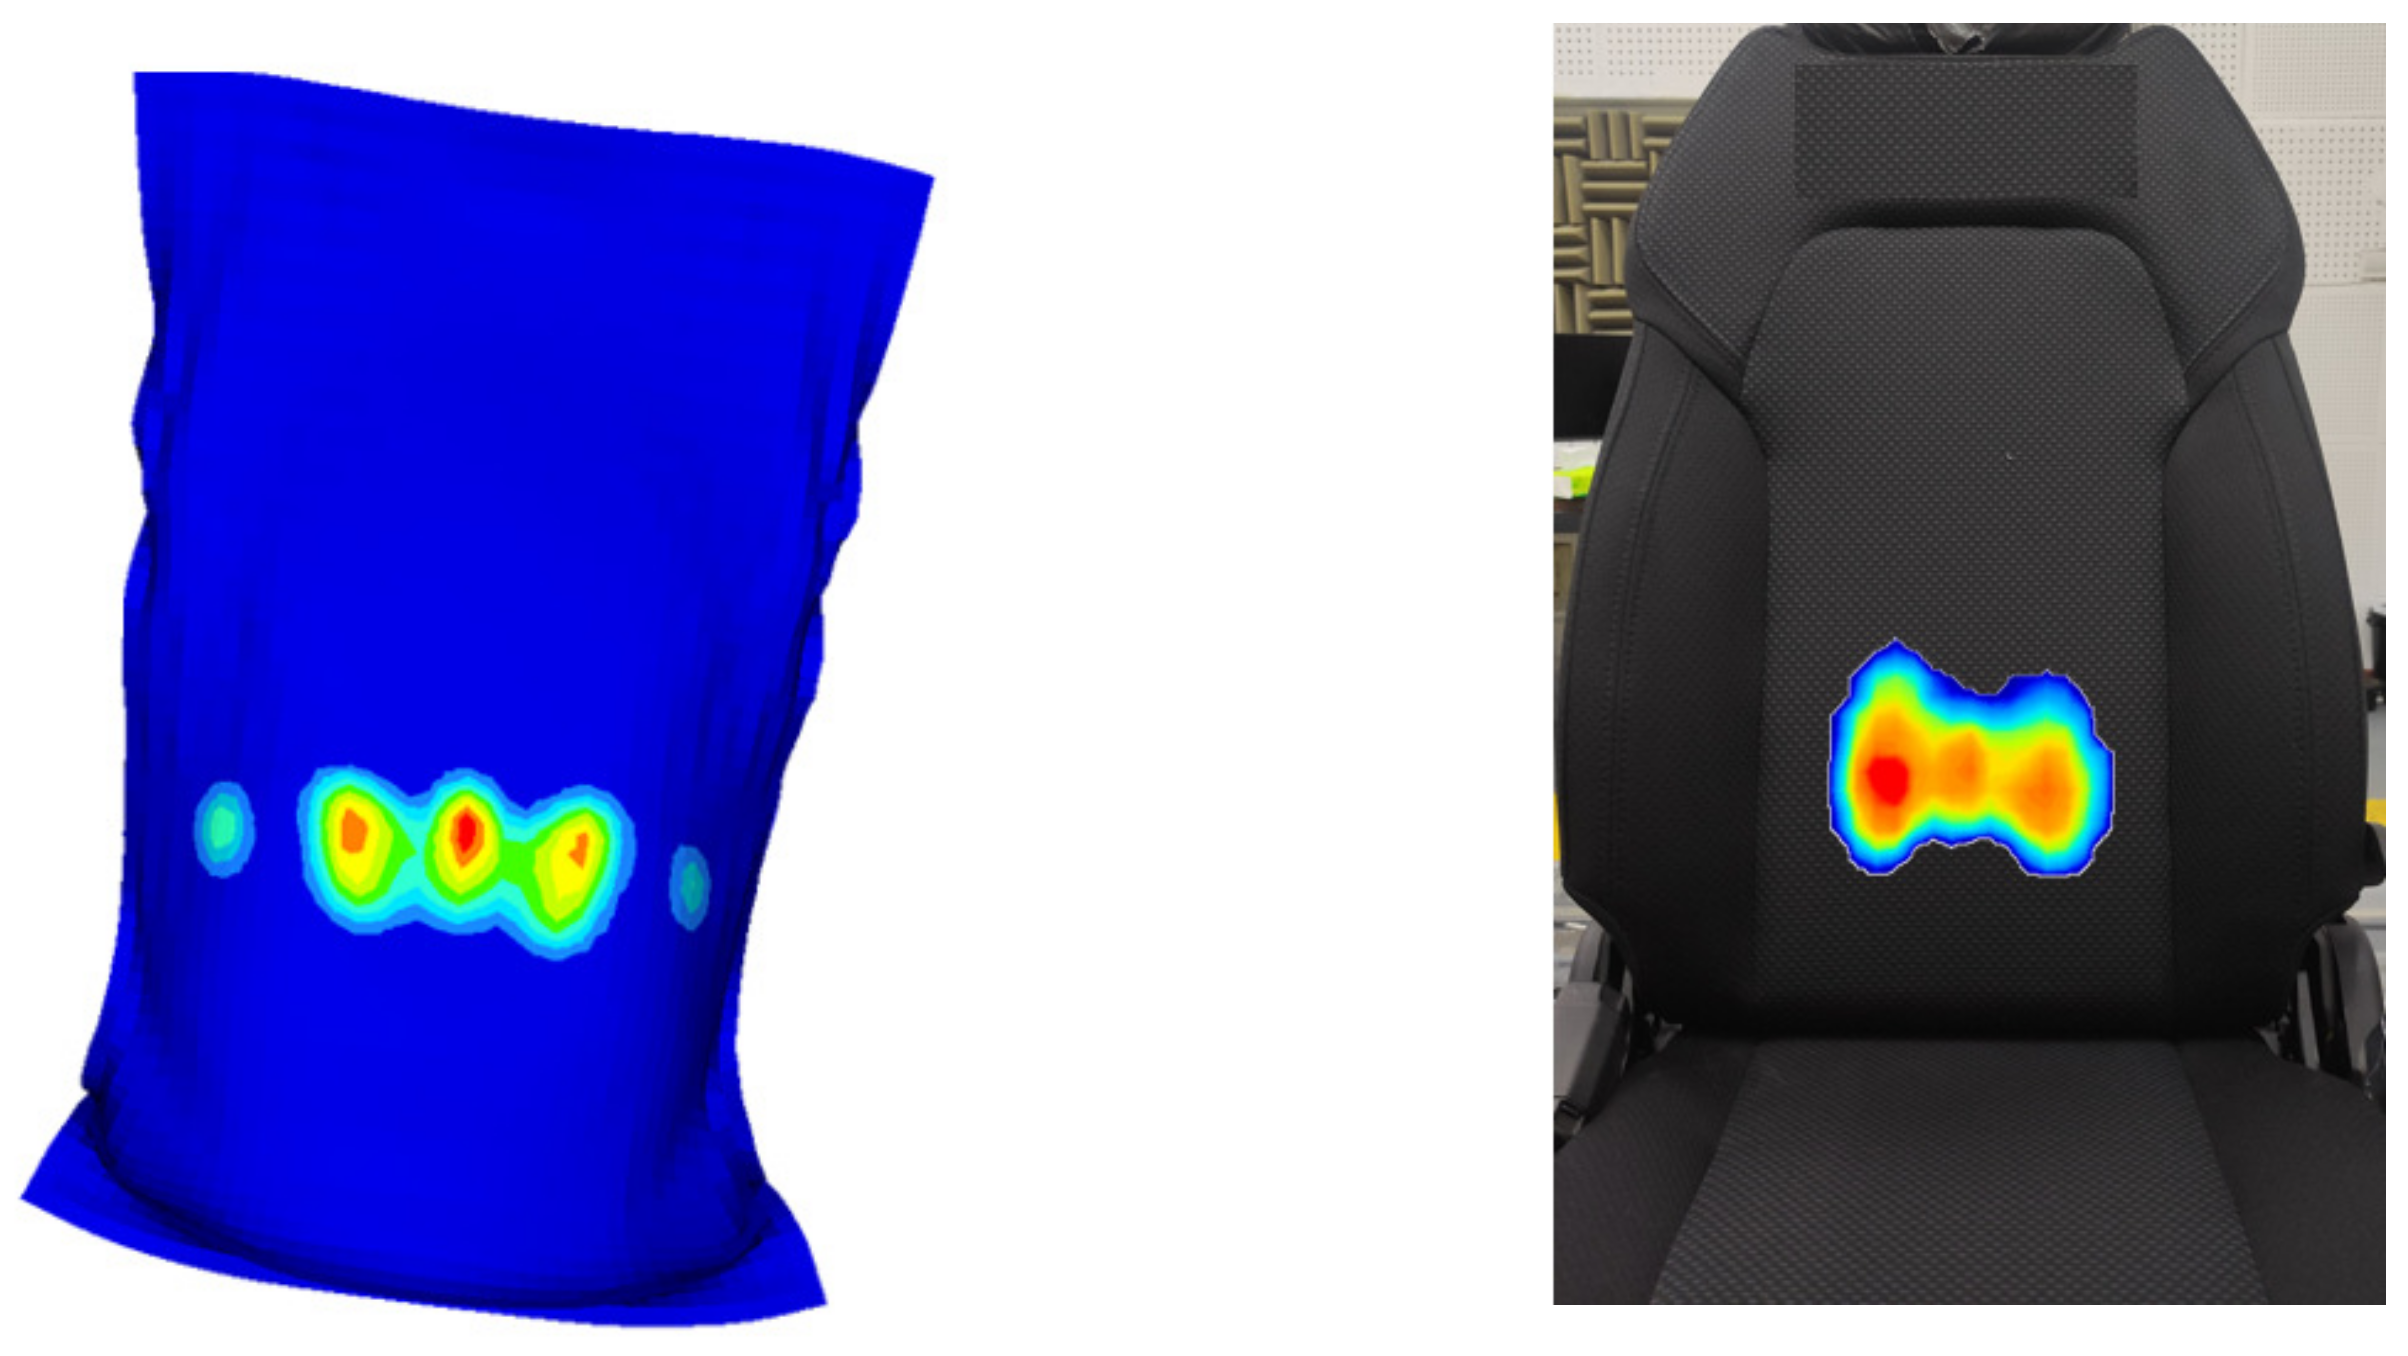
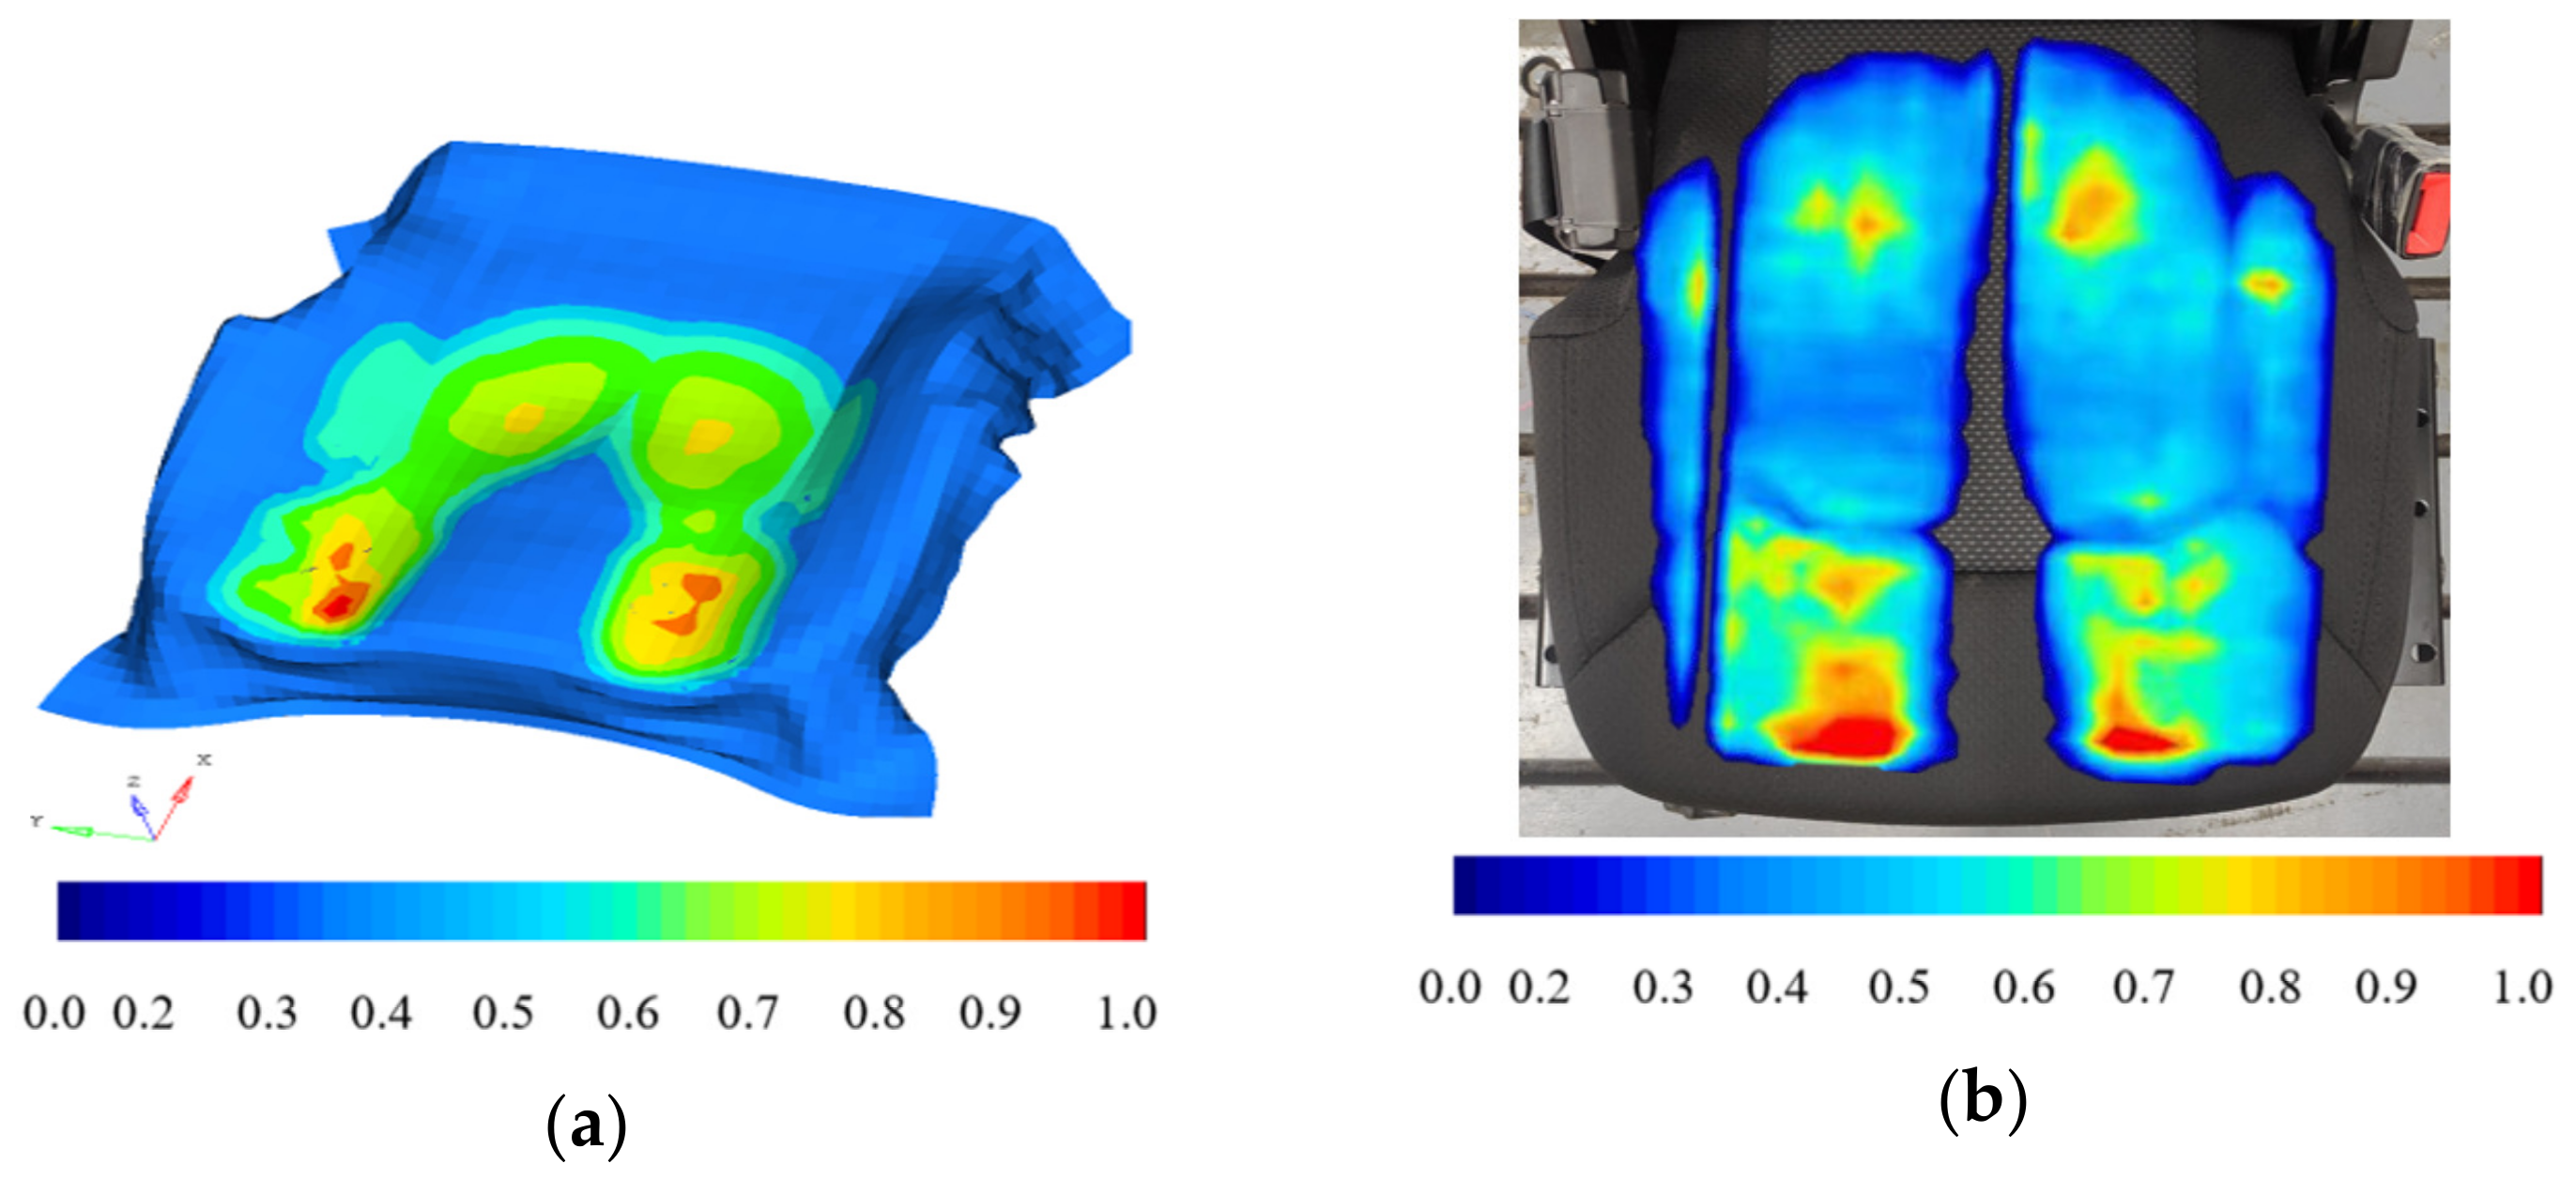
Figure 10.
Vibration acceleration excitation for crushing condition: (a) Time domain; (b) Frequency domain.
Figure 10.
Vibration acceleration excitation for crushing condition: (a) Time domain; (b) Frequency domain.
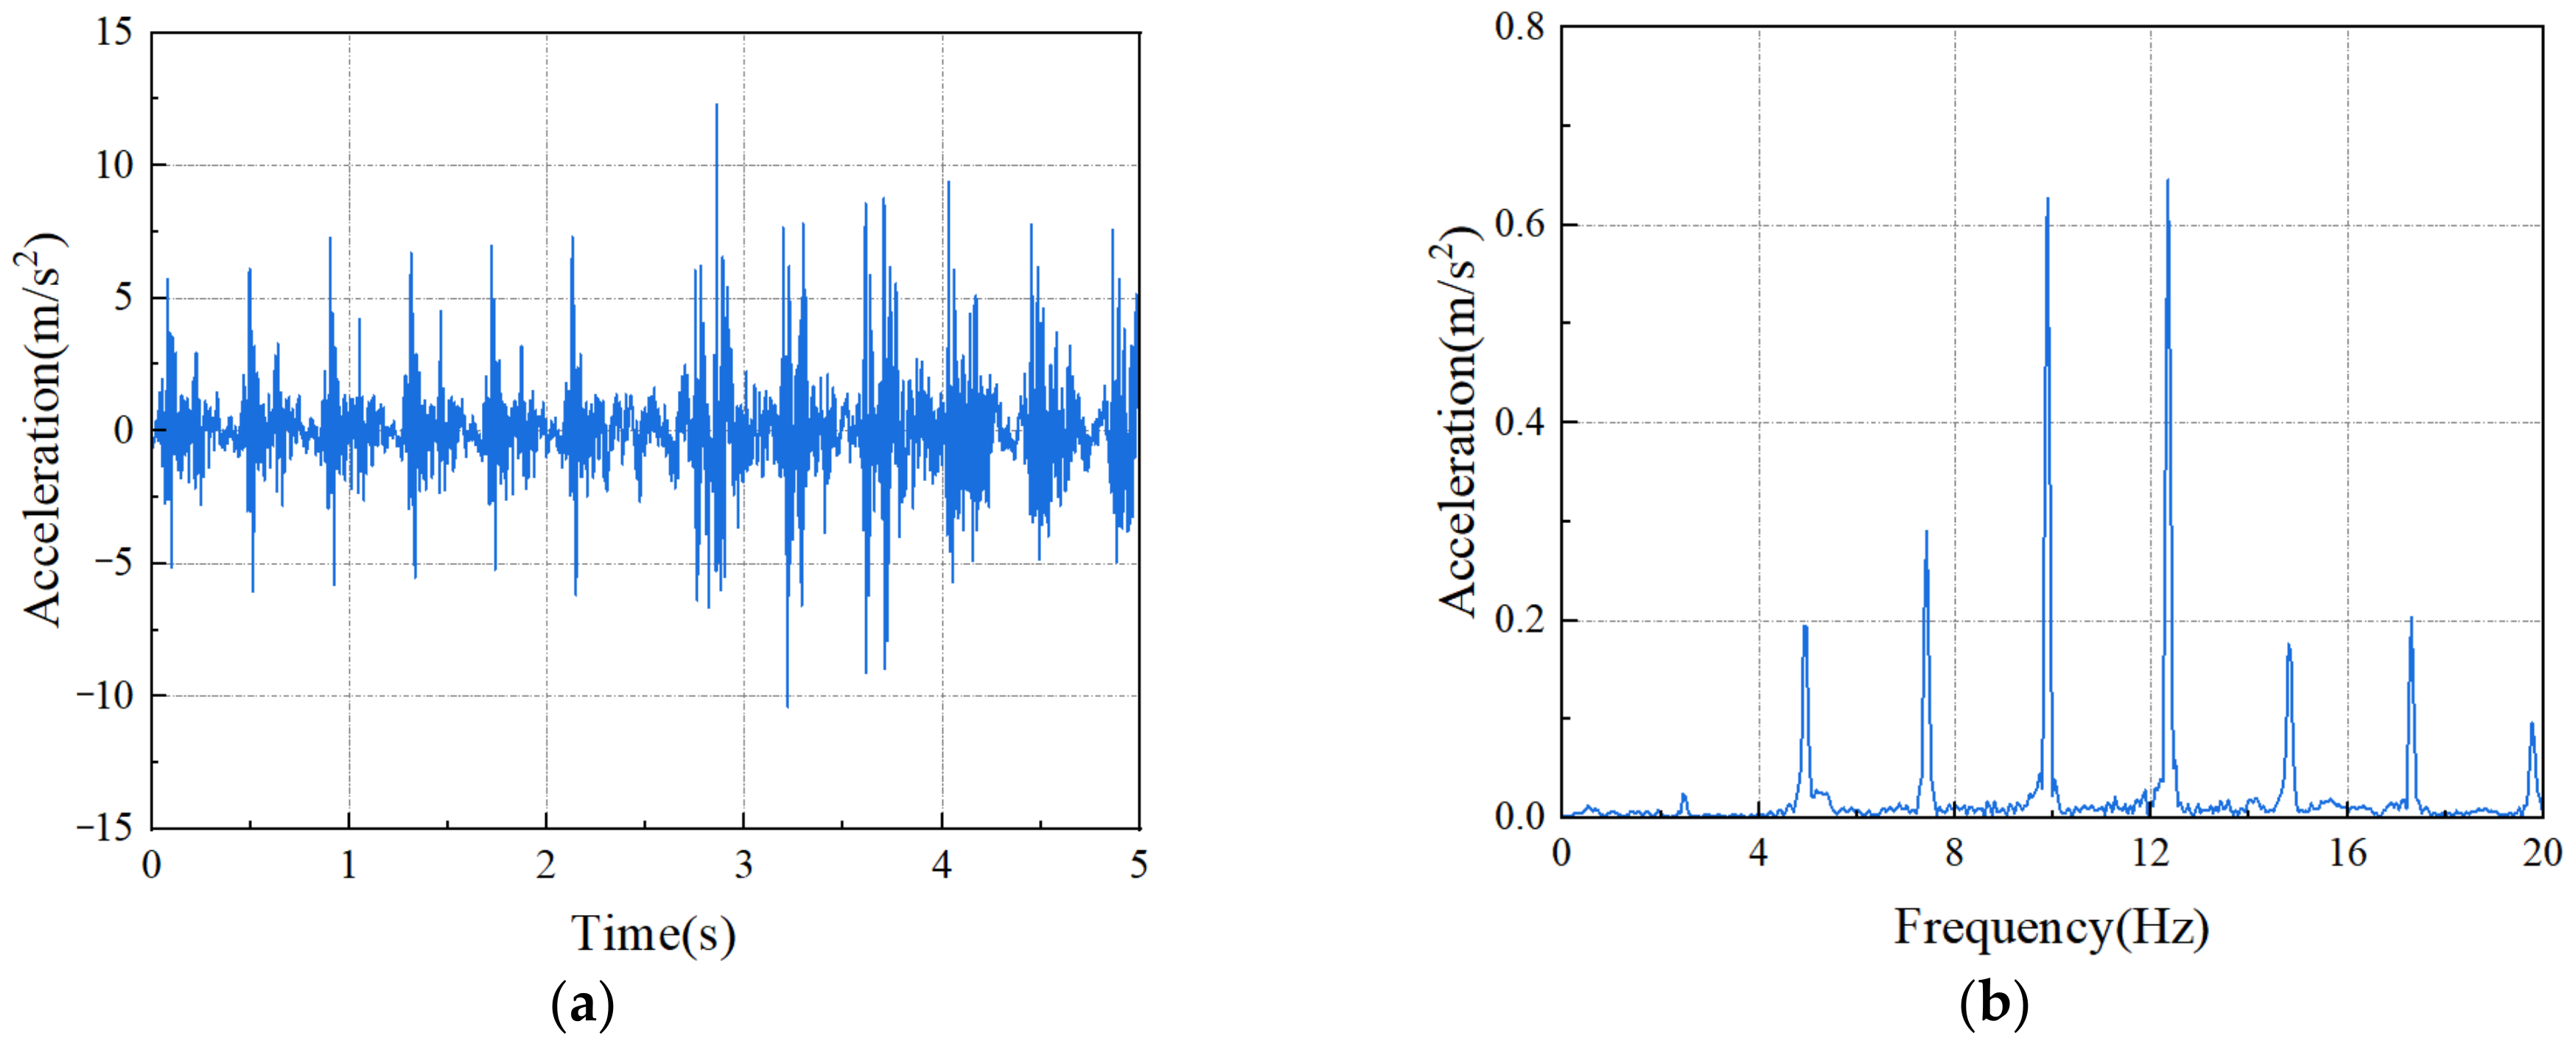
Figure 11.
Seat cushion vibration response for crushing condition.
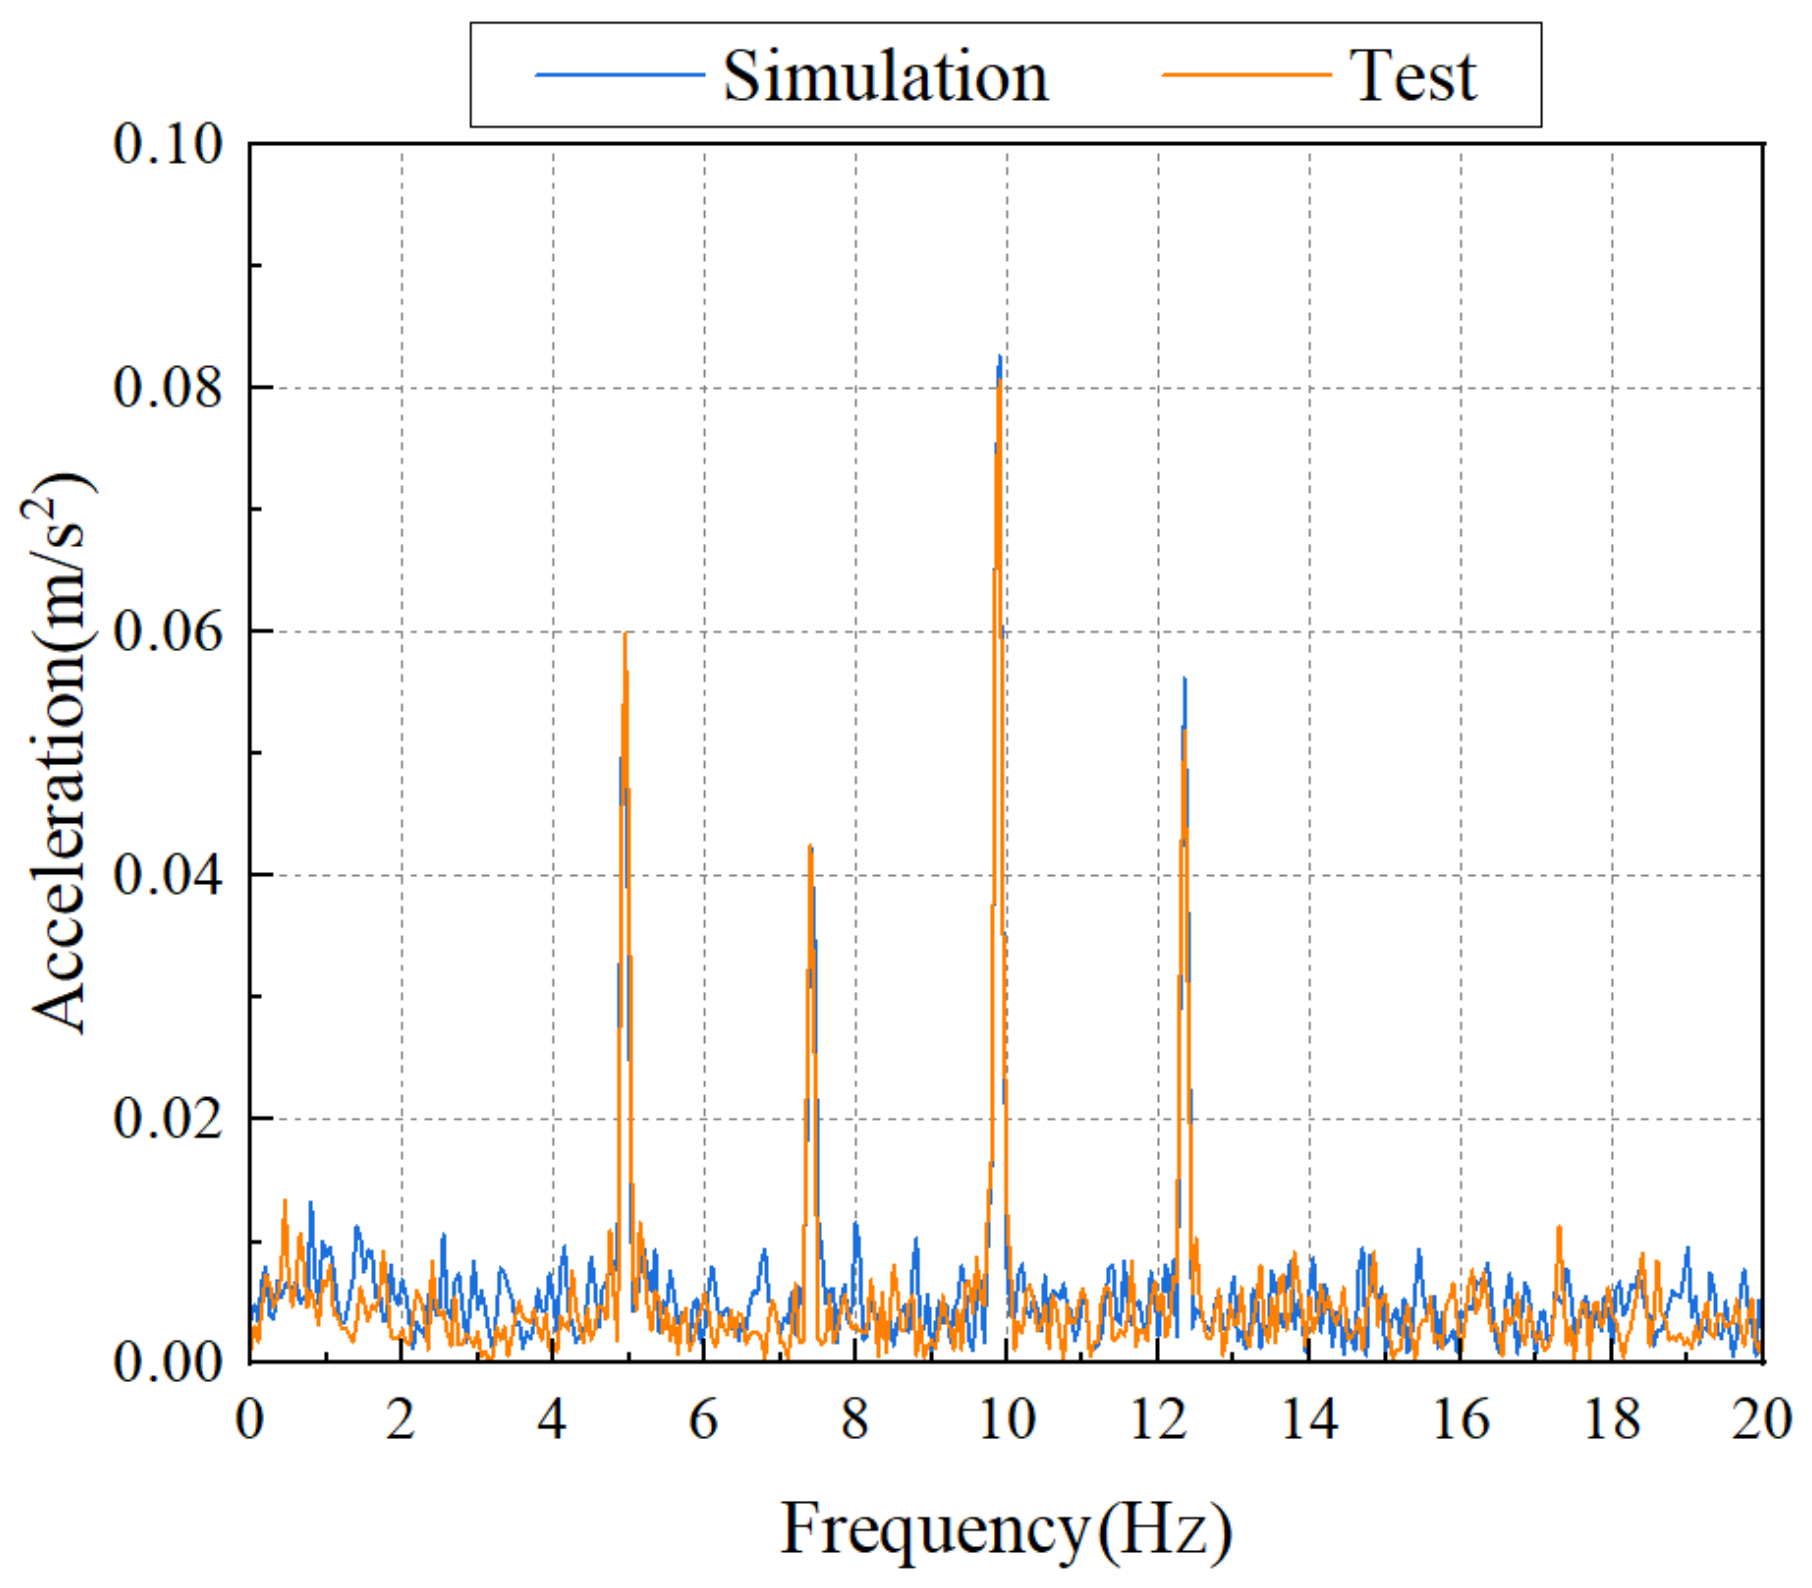
Figure 12.
Human body area division.
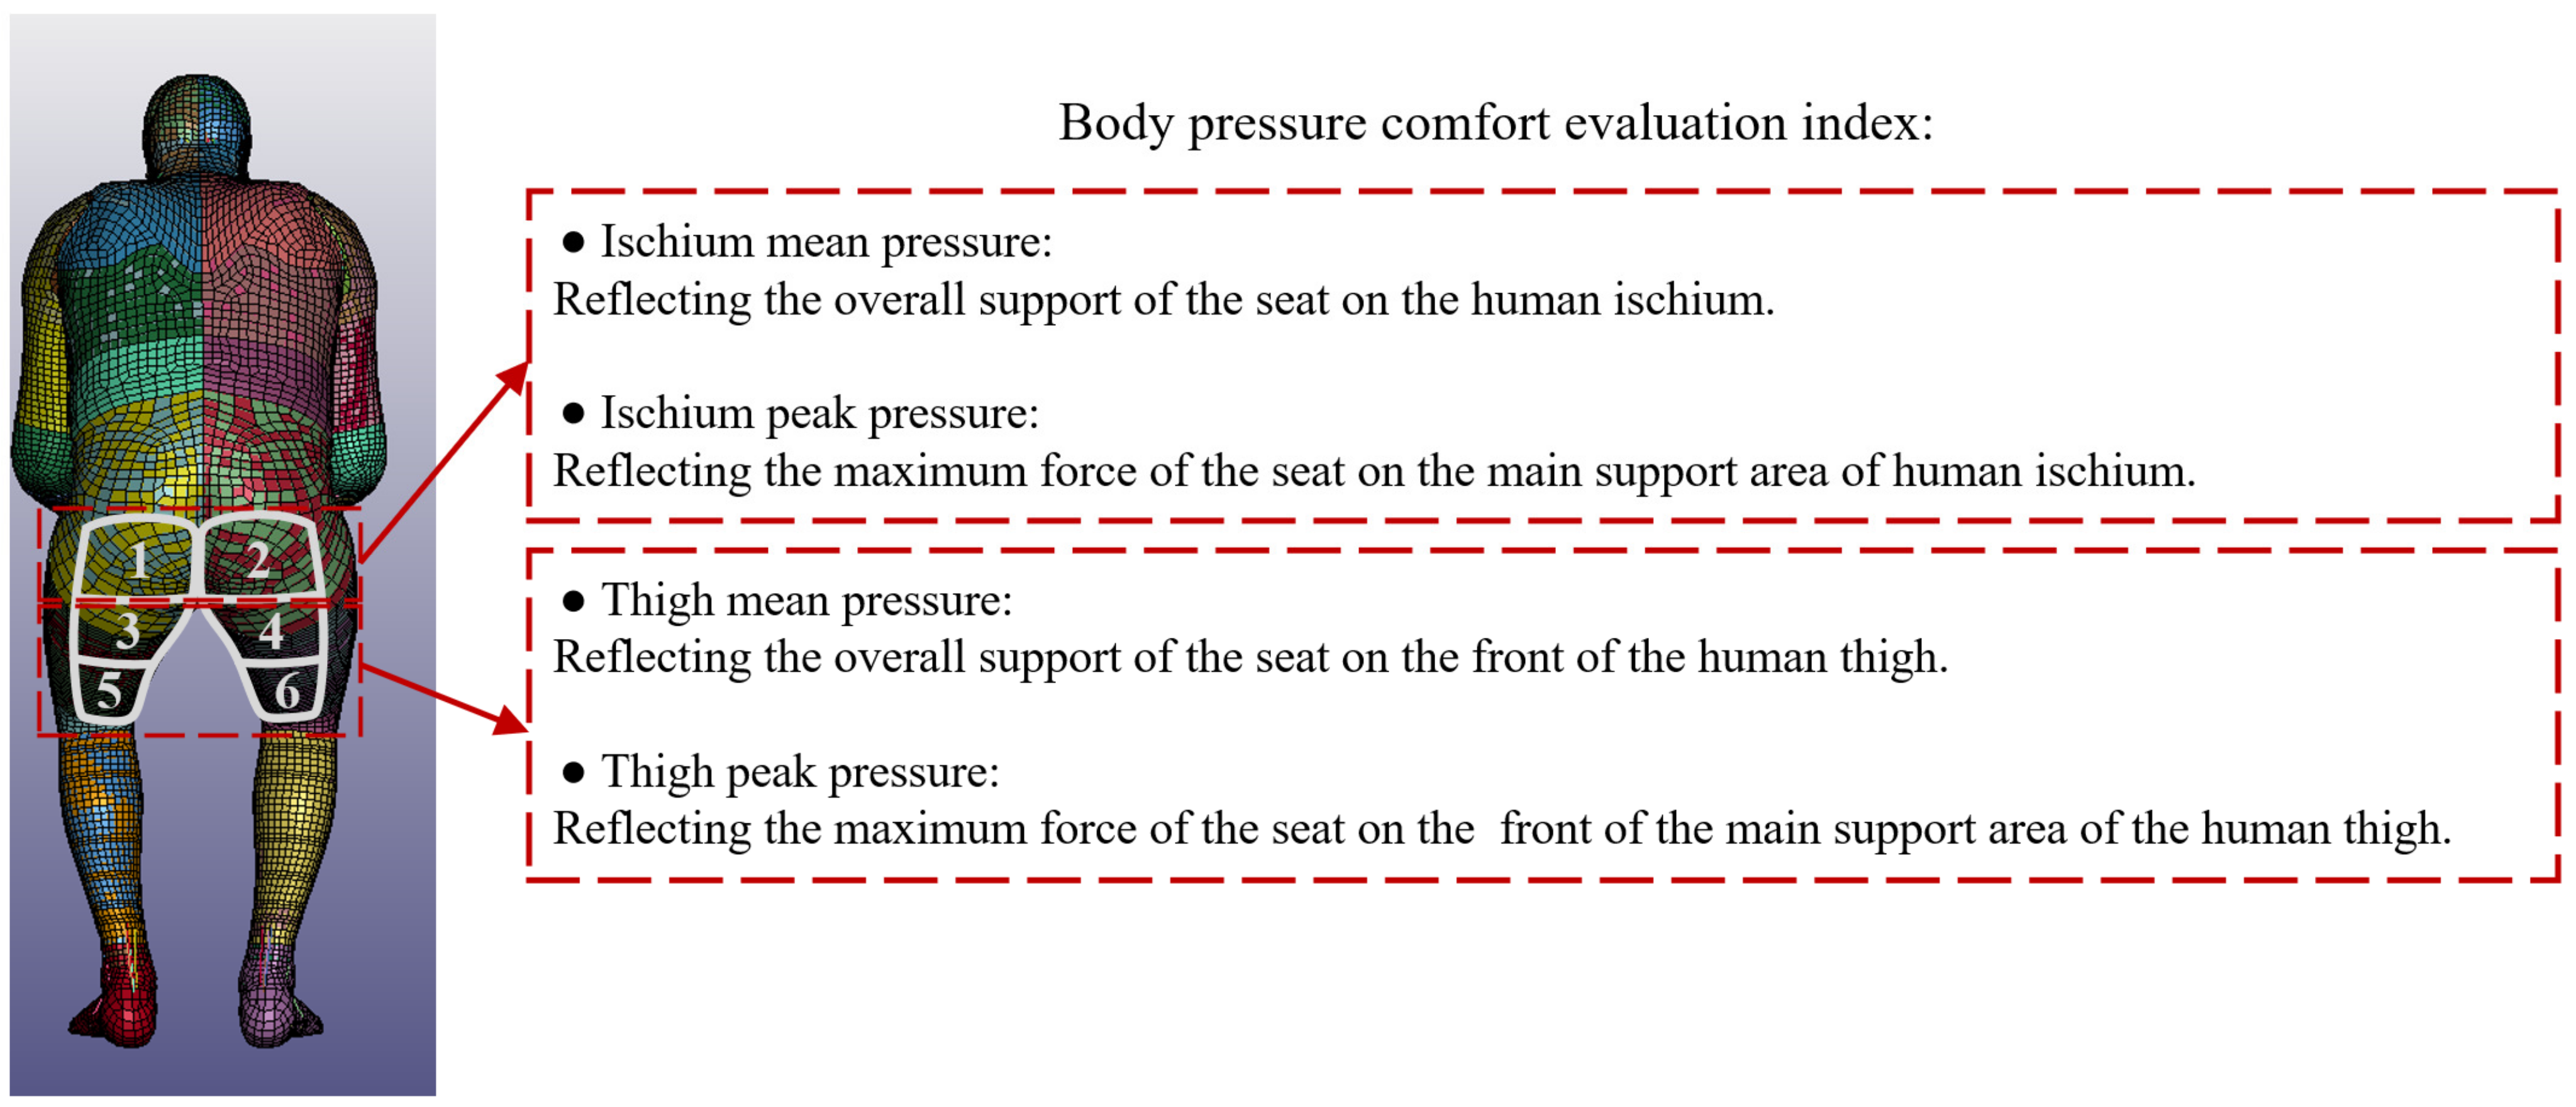
Figure 13.
Sponge stiffness characteristic: (a) cushion upper layer sponge stiffness; (b) cushion lower layer sponge stiffness.
Figure 13.
Sponge stiffness characteristic: (a) cushion upper layer sponge stiffness; (b) cushion lower layer sponge stiffness.
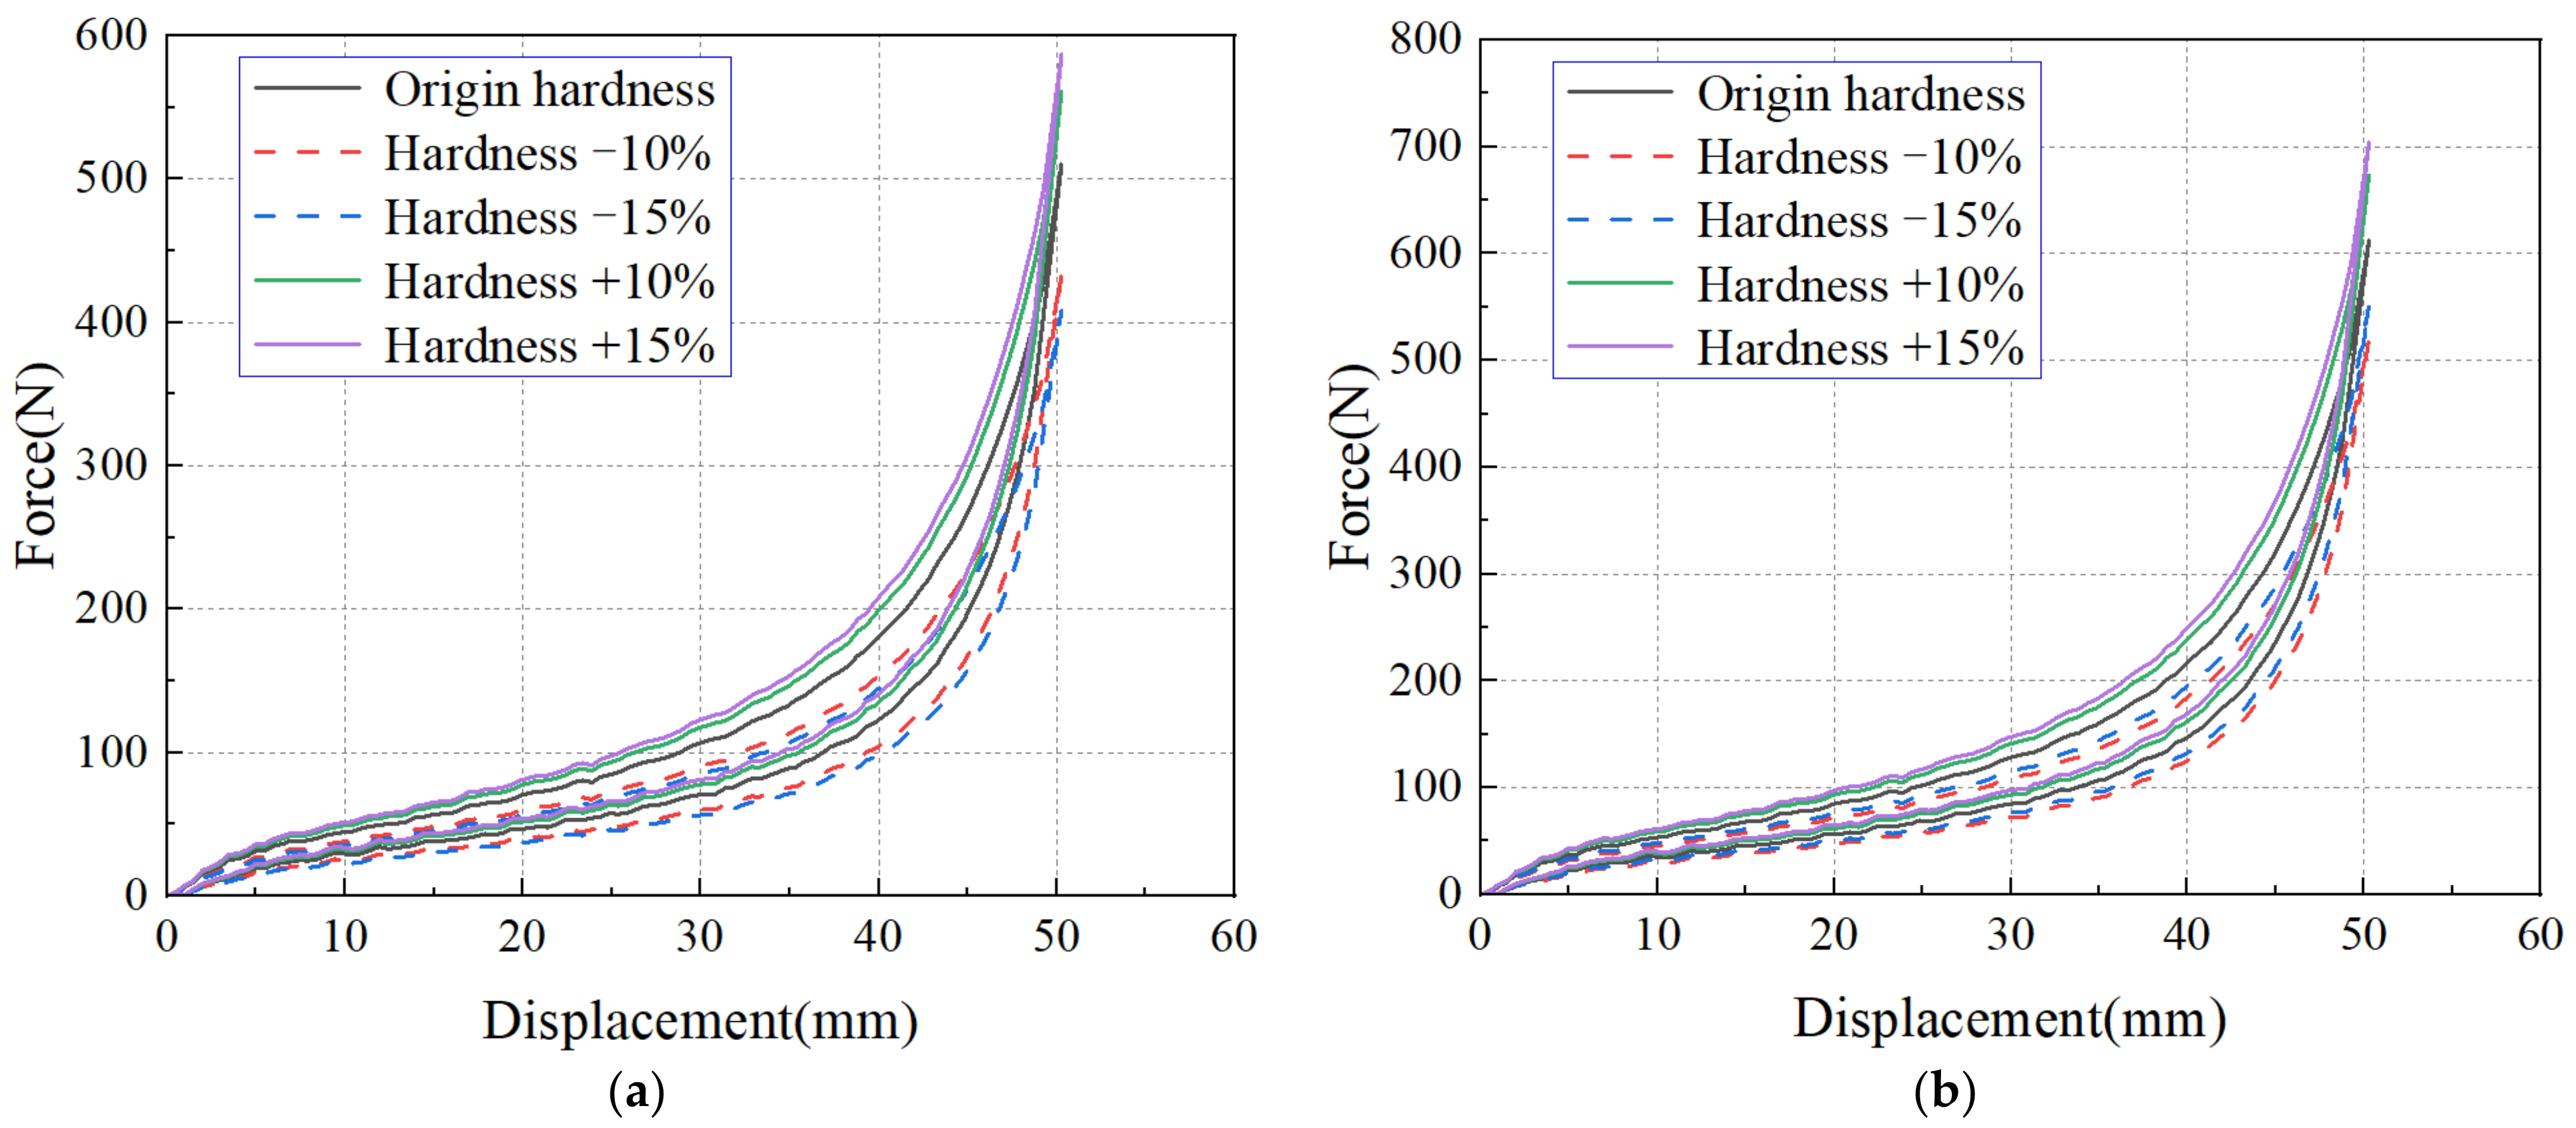
Figure 14.
Seat cushion simulation pressure map: (a) Sponge hardness −15%/−15%; (b) Sponge hardness −10%/−10%; (c) Sponge hardness −10%/+15%; (d) Sponge hardness +15%/−10%; (e) Sponge hardness +15%/+10%; (f) Sponge hardness + 15%/+15%.
Figure 14.
Seat cushion simulation pressure map: (a) Sponge hardness −15%/−15%; (b) Sponge hardness −10%/−10%; (c) Sponge hardness −10%/+15%; (d) Sponge hardness +15%/−10%; (e) Sponge hardness +15%/+10%; (f) Sponge hardness + 15%/+15%.
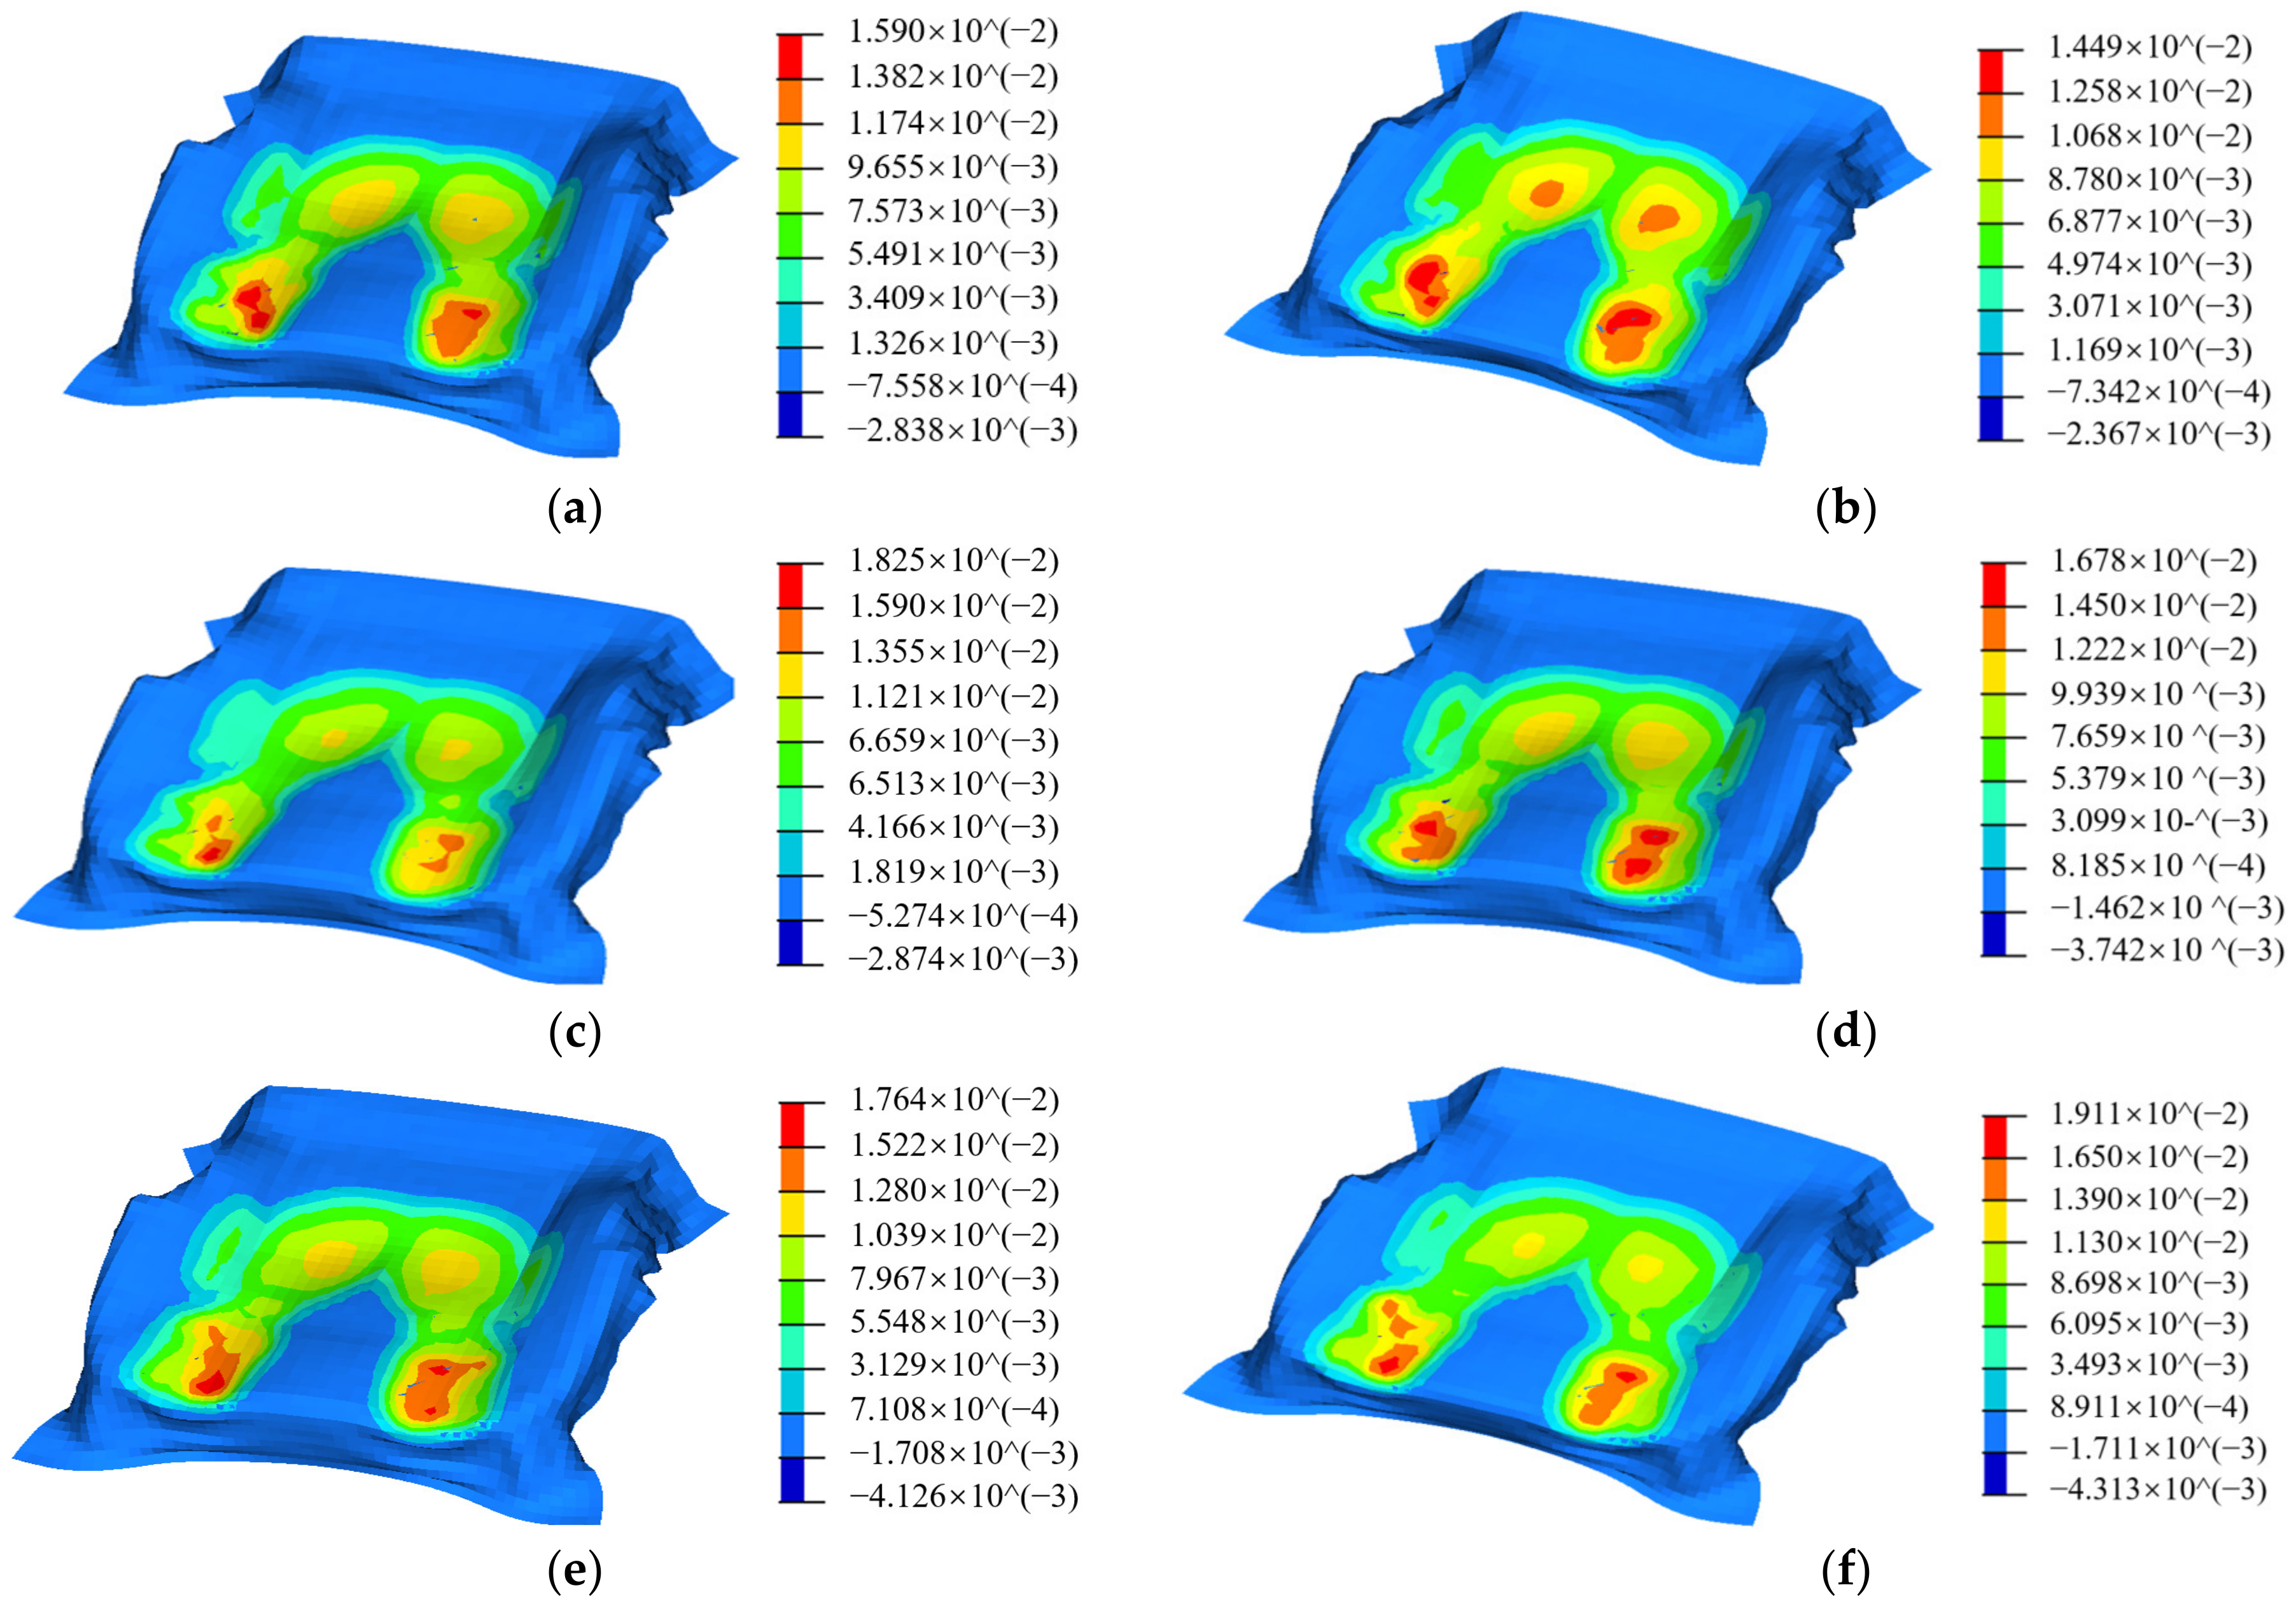
Figure 15.
Seat cushion test pressure map: (a) Subject 1, original sponge; (b) Subject 1, improved sponge; (c) Subject 2, original sponge; (d) Subject 2, improved sponge; (e) Subject 3, original sponge; (f) Subject 3, improved sponge; (g) Subject 4, original sponge; (h) Subject 4, improved sponge.
Figure 15.
Seat cushion test pressure map: (a) Subject 1, original sponge; (b) Subject 1, improved sponge; (c) Subject 2, original sponge; (d) Subject 2, improved sponge; (e) Subject 3, original sponge; (f) Subject 3, improved sponge; (g) Subject 4, original sponge; (h) Subject 4, improved sponge.

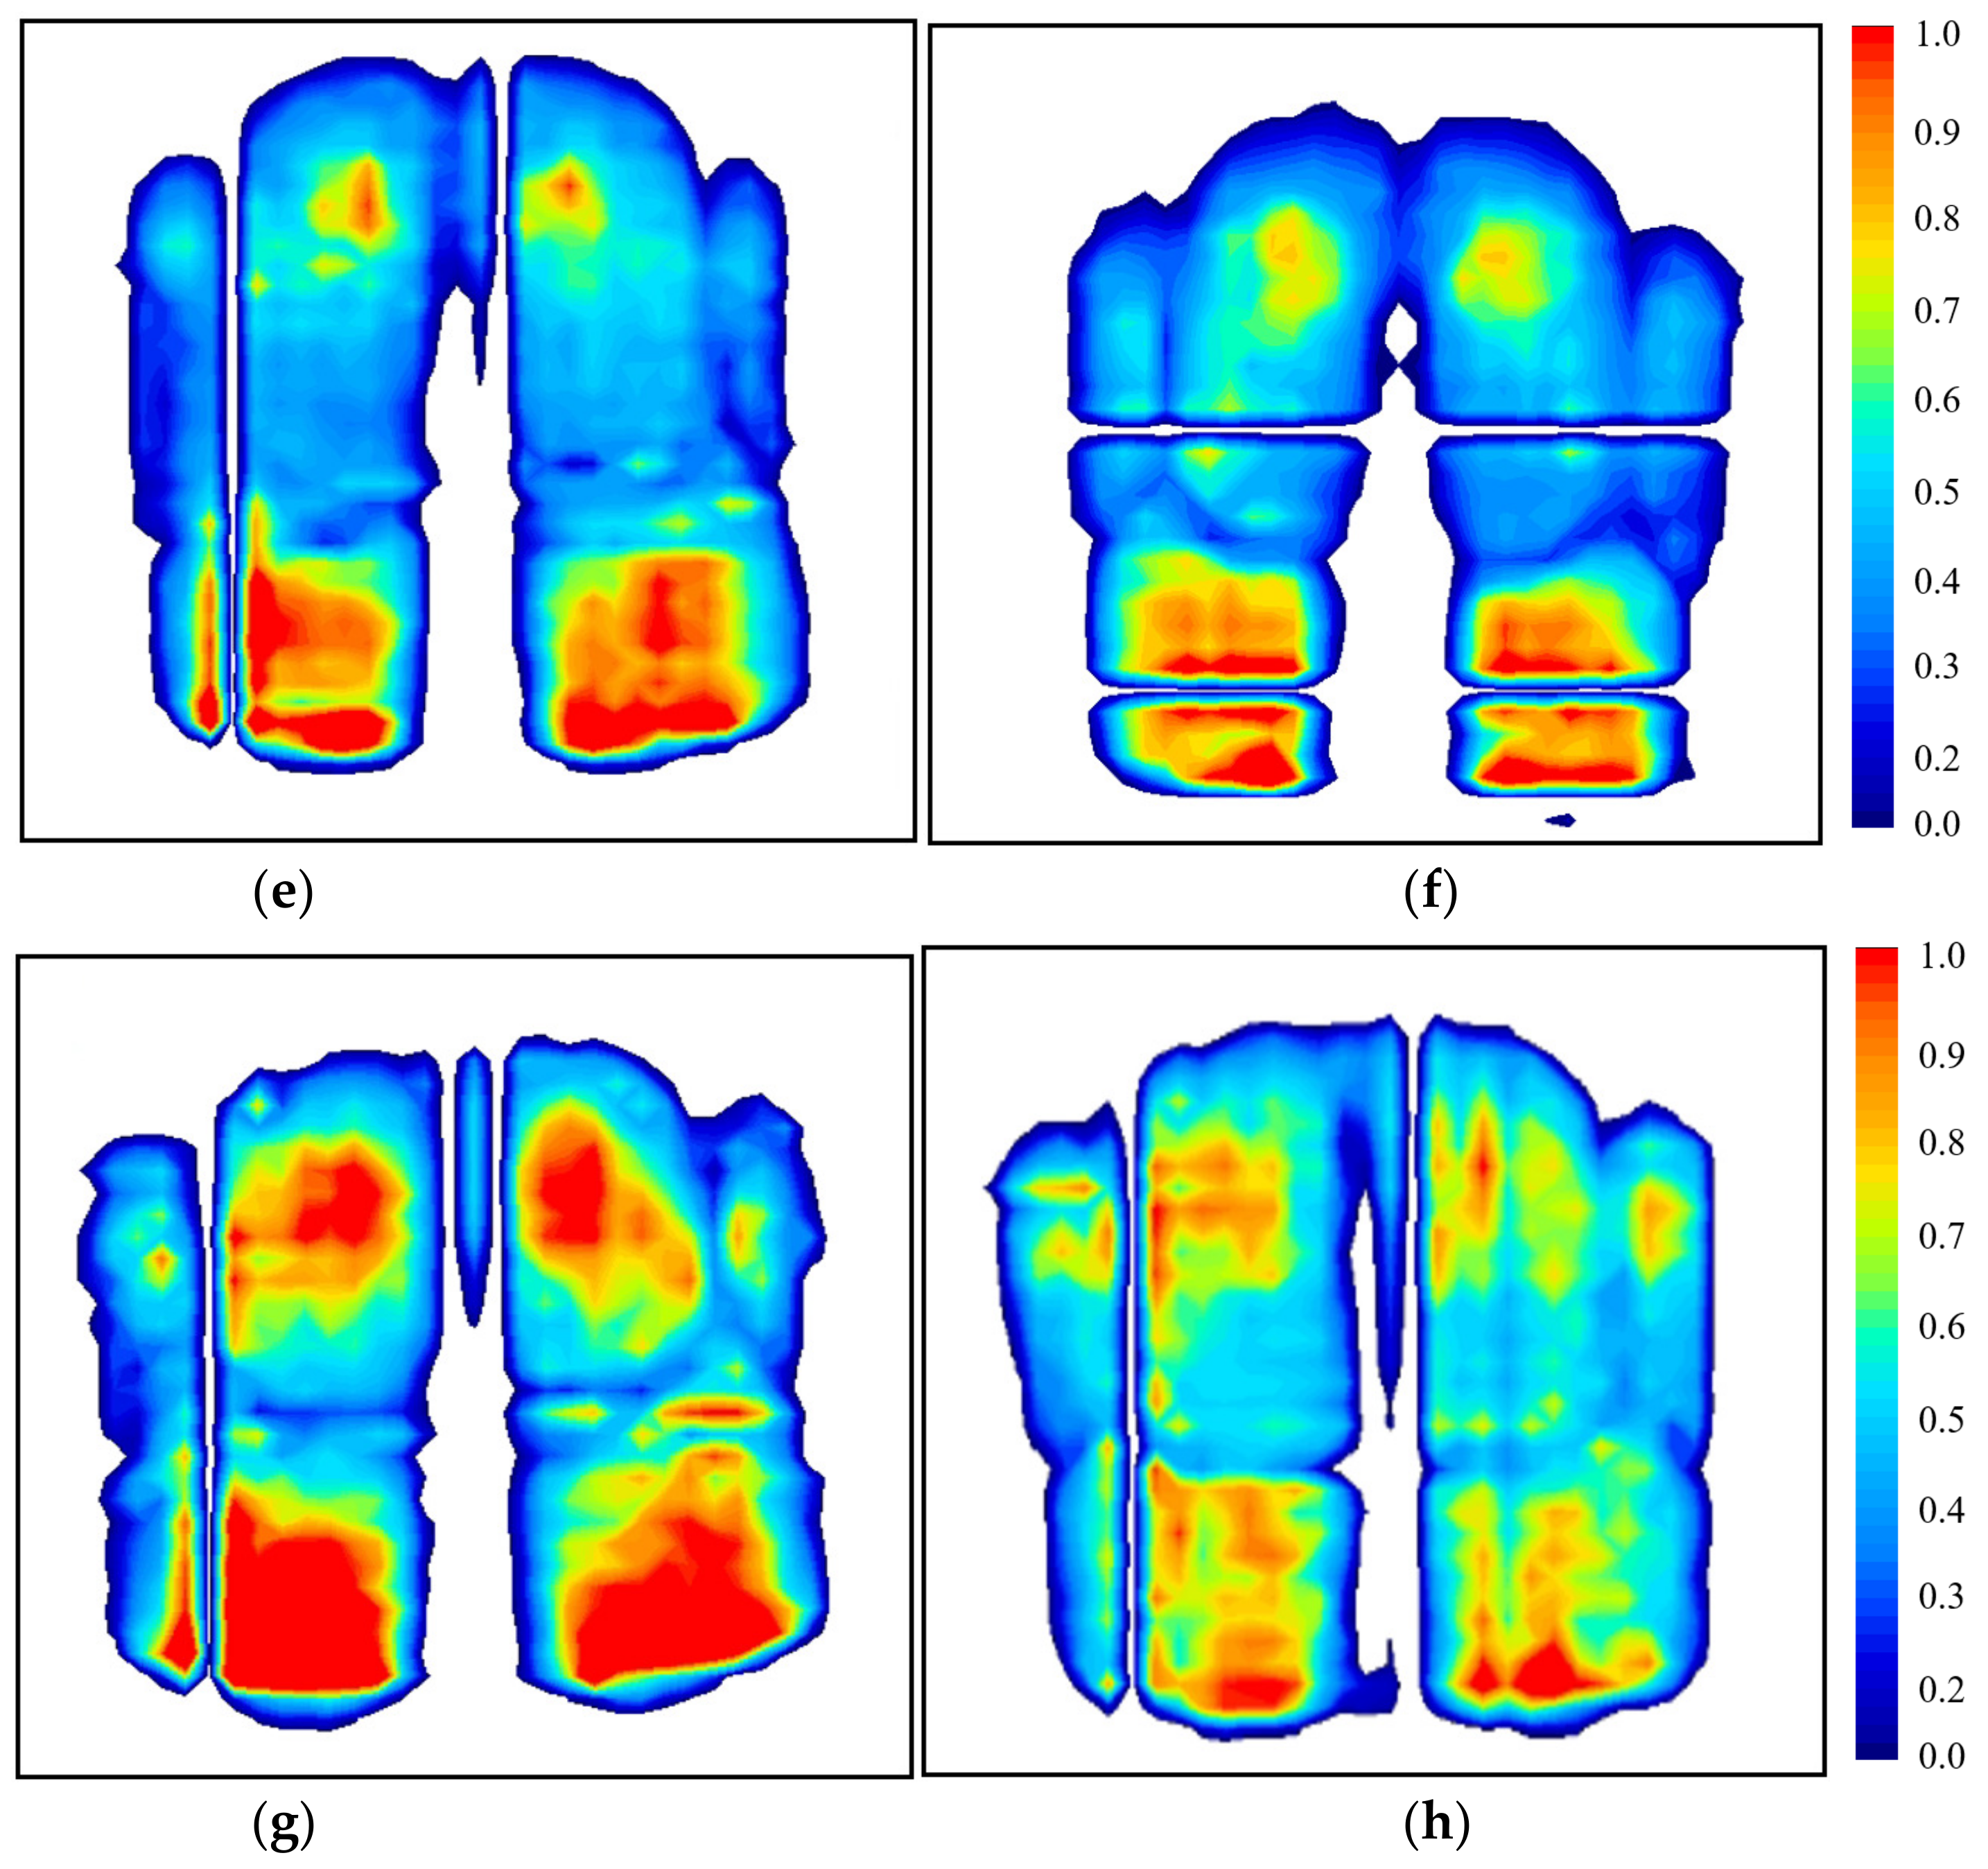
Figure 16.
Original and improved seat vibration response with crushing condition: (a) Subject 1; (b) Subject 2; (c) Subject 3; (d) Subject 4.
Figure 16.
Original and improved seat vibration response with crushing condition: (a) Subject 1; (b) Subject 2; (c) Subject 3; (d) Subject 4.


Table 1.
Seat structure performance parameters.
| Structure | m (kg) | Ixx (kg·m2) | Iyy (kg·m2) | Izz (kg·m2) | Ixy (kg·m2) | Iyz (kg·m2) | Ixz (kg·m2) |
|---|---|---|---|---|---|---|---|
| Cushion sponge (upper layer) | 1.134 | 0.021 | 0.022 | 0.041 | 0.00019 | 0.00006 | 0.001 |
| Cushion sponge (lower layer) | 1.551 | 0.027 | 0.031 | 0.056 | 0.00025 | 0.00008 | 0.0014 |
| Backrest sponge | 1.756 | 0.084 | 0.051 | 0.042 | 0.000006 | −0.000088 | −0.011 |
| Seat skeleton | 65.202 | 5.522 | 3.159 | 4.87 | −0.006 | 0.05 | −0.0047 |
Table 2.
Simulation and test posture of human-seat coupling system.
| Human | Seat |
|---|---|
| The arms are bent in a forward position. | In the initial position, the guide is at the front of the seat slide design. |
| Adjust the backrest arch, the person’s back and backrest only in the waist. | Backrest inclination angle 12.5°. |
| Feet are stepped on the pedal posture, heel on the ground, calf and ground normal inclination of 20–25 degrees. | Cushion is 50 cm from the ground. |
Table 3.
Key frequency points and key frequency point amplitudes for seat cushion simulation and test.
Table 3.
Key frequency points and key frequency point amplitudes for seat cushion simulation and test.
| Frequency | Amplitude | ||||
|---|---|---|---|---|---|
| Simulation Value (Hz) | Test Value (Hz) | Accuracy (%) | Simulation Value (m/s2) | Test Value (m/s2) | Accuracy (%) |
| 4.95 | 5 | 99.0 | 0.0566 | 0.0599 | 94.4 |
| 7.4 | 7.5 | 98.7 | 0.0426 | 0.0424 | 99.5 |
| 9.9 | 10 | 99.0 | 0.0826 | 0.0807 | 97.7 |
| 12.35 | 12.5 | 98.8 | 0.0561 | 0.0519 | 92.5 |
Table 4.
Body pressure comfortable evaluation index of different cushion sponge hardness.
| Sponge Stiffness (Upper Layer Sponge/Lower Layer Sponge) (N/mm2) | Ischium Peak Pressure (N/cm2) | Ischium Mean Pressure (N/cm2) | Thigh Peak Pressure (N/cm2) | Thigh Mean Pressure (N/cm2) |
|---|---|---|---|---|
| −15%/−15% | 1.25 | 0.78 | 1.51 | 0.75 |
| −10%/−10% | 1.24 | 0.88 | 1.26 | 0.71 |
| −10%/+15% | 1.27 | 1.01 | 1.59 | 0.89 |
| original | 1.28 | 1.03 | 1.61 | 0.92 |
| +15%/−10% | 1.12 | 0.64 | 1.67 | 1.13 |
| +15%/+10% | 1.13 | 0.72 | 1.64 | 1.10 |
| +15%/+15% | 1.16 | 0.74 | 1.56 | 1.08 |
Table 5.
Subjects’ physical information.
| Subject | Body Information | |
|---|---|---|
| Height(cm) | Weight(kg) | |
| 1 | 165 | 60 |
| 2 | 171 | 70 |
| 3 | 175 | 77 |
| 4 | 182 | 86 |
Table 6.
Body pressure comfortable evaluation indexes of the original sponge and improved sponge.
| Subject | Ischium Peak Pressure (N/cm2) | Ischium Mean Pressure (N/cm2) | Thigh Peak Pressure (N/cm2) | Thigh Mean Pressure (N/cm2) | ||||
|---|---|---|---|---|---|---|---|---|
| Original | Improved | Original | Improved | Original | Improved | Original | Improved | |
| 1 | 1.43 | 1.27 | 0.86 | 0.53 | 1.49 | 1.46 | 0.62 | 0.56 |
| 2 | 1.48 | 1.16 | 0.94 | 0.50 | 1.55 | 1.48 | 0.54 | 0.44 |
| 3 | 1.28 | 1.26 | 1.03 | 0.76 | 1.61 | 1.36 | 0.92 | 0.81 |
| 4 | 1.82 | 1.58 | 1.26 | 0.84 | 1.85 | 1.52 | 1.45 | 0.92 |
Table 7.
RMS and vibration isolation rate of the original sponge and the improved sponge under crushing condition.
Table 7.
RMS and vibration isolation rate of the original sponge and the improved sponge under crushing condition.
| Subject | RMS (m/s2) | Vibration Isolation Rate (dB) | ||
|---|---|---|---|---|
| Original | Improved | Original | Improved | |
| 1 | 0.0489 | 0.0432 | 4.30 | 5.37 |
| 2 | 0.0685 | 0.0476 | 1.37 | 4.53 |
| 3 | 0.0551 | 0.0488 | 3.26 | 4.31 |
| 4 | 0.0673 | 0.0415 | 1.52 | 5.72 |
Disclaimer/Publisher’s Note: The statements, opinions and data contained in all publications are solely those of the individual author(s) and contributor(s) and not of MDPI and/or the editor(s). MDPI and/or the editor(s) disclaim responsibility for any injury to people or property resulting from any ideas, methods, instructions or products referred to in the content. |
© 2022 by the authors. Licensee MDPI, Basel, Switzerland. This article is an open access article distributed under the terms and conditions of the Creative Commons Attribution (CC BY) license (https://creativecommons.org/licenses/by/4.0/).
Share and Cite
MDPI and ACS Style
Cheng, L.; Wen, H.; Ni, X.; Zhuang, C.; Zhang, W.; Huang, H. Optimization Study on the Comfort of Human-Seat Coupling System in the Cab of Construction Machinery. Machines 2023, 11, 30. https://doi.org/10.3390/machines11010030
AMA Style
Cheng L, Wen H, Ni X, Zhuang C, Zhang W, Huang H. Optimization Study on the Comfort of Human-Seat Coupling System in the Cab of Construction Machinery. Machines. 2023; 11(1):30. https://doi.org/10.3390/machines11010030
Chicago/Turabian StyleCheng, Lei, Hansheng Wen, Xiangyu Ni, Chao Zhuang, Wenjian Zhang, and Haibo Huang. 2023. "Optimization Study on the Comfort of Human-Seat Coupling System in the Cab of Construction Machinery" Machines 11, no. 1: 30. https://doi.org/10.3390/machines11010030
Note that from the first issue of 2016, this journal uses article numbers instead of page numbers. See further details here.