
A Novel Individual Aircraft Life Monitoring Method Based on Reliable Life Consumption Assessment

School of Aeronautic Science and Engineering, Beihang University, Beijing 100191, China
*
Author to whom correspondence should be addressed.
Machines 2023, 11(11), 1016; https://doi.org/10.3390/machines11111016
Submission received: 26 September 2023
/
Revised: 31 October 2023
/
Accepted: 6 November 2023
/
Published: 8 November 2023
(This article belongs to the Section Machines Testing and Maintenance)
Abstract
:Individual life monitoring is crucial for ensuring aircraft flight safety. Conventional life-consumption-based monitoring methods ignore reliability, thus disjoining them from the aircraft’s reliable life determination and extension, where high confidence and reliability are required. Therefore, this paper proposes a reliable life consumption and individual life monitoring method for aircraft structure fatigue. In the paper, the P-S-N curve, i.e., the relationship between the aircraft structure’s life (N) and fatigue load (S) under a certain probability (P), is established, by which the lower confidence limit of the aircraft structure’s reliable life can be evaluated under any fatigue loads. Based on that and the aircraft’s monitored fatigue loads, the indexes of reliable life consumption and remaining reliable life percentages are proposed and assessed in real time for individual aircraft life monitoring and online life management. Case studies indicate that the proposed method can guarantee high confidence and reliability requirements in individual life monitoring, consistent with the aircraft’s life determination and extension, which are widely accepted nowadays in engineering practice.
1. Introduction
Structural life and reliability management are critical to ensuring the aircraft’s flight safety [1,2]. In past decades, the concept of “aircraft fleet management” was widely adopted, which means that each outfield aircraft is managed with a uniform standard based on the evaluated reliable life in the aircraft’s full-scale fatigue test (i.e., flight hours, flight cycles, and calendar life with a specified reliability level). Currently, many types of aircraft still use this life management style. However, an aircraft’s actual service loads differ from the test or design loads, and the service loads of each aircraft are also different [3,4]. Thus, the service life of each aircraft varies. If the aircraft’s load is severe, its service life will be relatively short, and fleet life management based on the above life indexes will be dangerous. In contrast, if the aircraft’s load is mild, the aircraft’s life potential will be underestimated, resulting in significant economic waste [5]. Therefore, to ensure flight safety and improve economic efficiency simultaneously, individual life monitoring (or individual aircraft tracking) for aging and new aircraft has attracted widespread attention from industry and academia [3,6].
The main procedure of individual aircraft life monitoring is illustrated in Figure 1, including load monitoring and handling of individual aircraft, damage definition and evaluation of individual aircraft, and life prediction and management of individual aircraft [7]. Load monitoring of aircraft structures is a prerequisite. It can be realized based on flight parameter monitoring systems and strain gauges in critical parts, incorporating techniques such as finite element analysis, multiple linear regression, and artificial neural networks [8,9,10,11]. This lays a solid foundation for individual aircraft life monitoring. After obtaining service loads, the core content for individual aircraft load monitoring is defining and evaluating aircraft damage caused by service loads [5]. Nowadays, commonly used damage indexes include FI (fatigue index), FDI (fatigue damage index), FLE (fatigue life expended), FLEI (fatigue life expended index), and CSI (crack severity index) [3,12,13,14,15,16]. Essentially, they can be divided into two aspects: one defines damage through aircraft’s fatigue life under different loads and conducts damage accumulation or life consumption assessment based on Miner’s linear cumulative damage theory [5,17]; the other defines damage in terms of crack expansion under various loads, in which damage tolerance theory is the technical core [13,16,18]. Since the former is simple for engineering practice and widely studied (e.g., Chinese military aircraft) [12], this paper focuses on individual aircraft life monitoring based on life consumption assessment.
In the aircraft’s life consumption, damage per fatigue cycle is defined as the inverse of the aircraft’s life , and damage accumulation under variable loads is performed according to Miner’s law [19]. For example, if an aircraft structure experiences cycles under fatigue load , its cumulative damage or life consumption percentage is calculated by
where is the aircraft structure’s life under fatigue load . The aircraft structure cannot continue being used when the damage reaches a certain threshold. Due to the dispersion of material defects, structural manufacturing, structural assembly, and others, aircraft structure life is a random variable [20]. That is, different individuals correspond to different life values, although under the same fatigue load. However, current methods generally adopt median life for the aircraft’s life consumption calculation. That is,
where is the median value of . In fact, Equation (2) represents an average level of aircraft damage, ignoring confidence level and reliability [3]. In this case, the calculated damage of the individual aircraft will be smaller than its actual value with a 50% probability; that is, the actual life consumption of half of the aircraft may be underestimated. It is dangerous in engineering practice.
As a substitute for aircraft fleet management, individual aircraft monitoring is advanced because it additionally considers the specific service load of individual aircraft. However, the high reliability requirement in aircraft fleet management has been proven successful for aircraft safety [21,22], which should be inherited in individual aircraft life monitoring. As shown in Table 1, there is a lack of life-consumption-based individual aircraft life monitoring nowadays. In other words, the reliability requirement of individual aircraft monitoring is disconnected from the aircraft’s life determination and extension (basic work in aircraft fleet management) conducted with high confidence and high reliability. The problem is addressed in this paper.
To solve the above reliability contradiction and make individual aircraft monitoring more reliable and scientific, this paper proposes a reliable life consumption assessment and individual life monitoring method for aircraft structures, such as wing, fuselage, and landing gear. The main contributions are as follows:
- Based on the aircraft structure’s full-scale fatigue life test, the aircraft structure’s P-S-N curve, i.e., the relationship curve between the aircraft structure’s life (N) and fatigue load (S) under a certain probability (P), is established. By doing so, the lower confidence limit of the aircraft structure’s reliable life under any fatigue loads can be evaluated with the required confidence and reliability. This is the premise of reliable life consumption assessment.
- Based on the established P-S-N curve and the monitored service loads or flight missions of individual aircraft, the reliable life consumption percentage and remaining reliable life percentage of each aircraft can be assessed in real time. By doing so, individual aircraft life monitoring and online life management can be conveniently achieved.
- By this method, the aircraft structure’s full-scale fatigue test, reliable life determination, individual life monitoring, and reliable life extension (or other life management work) can be strung together. The disconnection between individual aircraft life monitoring and reliable life determination and extension is solved.
The technology roadmap of this paper is concluded in Figure 2. Section 2 proposes a small-sample assessment method for the aircraft structure’s P-S-N curve and reliable life. On this basis, Section 3 and Section 4 further propose the aircraft’s reliable life consumption and individual life monitoring methods, respectively. Section 5 provides an example for the method’s illustration. Finally, Section 6 presents a summary of the research in this paper.
2. Small-Sample Assessment Method for the Aircraft Structure’s Reliable Life
Denote an aircraft structure’s life as under the fatigue load . It is a random variable. The reliable life satisfies
where is the required reliability with a common value of 0.999 [21,23].
Before the aircraft’s delivery, full-scale fatigue life tests need to be conducted for reliability assessment. In this section, the aircraft structure’s reliable life under different fatigue loads is evaluated based on the structure’s fatigue tests. Since the true value of the reliable life is not available, this section will instead target its lower confidence limit with a high-confidence requirement.
2.1. Reliable Life Assessment under Test Load Spectrum
Assume that the aircraft structure is adopted for the full-scale fatigue life test under a load block spectrum composed of load and cycle number , , and the test result is (block number). According to the test result, the lower confidence limit of the aircraft structure’s reliable life with confidence can be inferred as . For example, if the aircraft structure’s life follows a lognormal distribution with a known standard deviation (generally 0.176 or others in China [21,22]), that is
then can be estimated as
where is the mean parameter; and ; and is the cumulative distribution function of the standard normal distribution. If the aircraft structure’s life follows a lognormal distribution with an unknown standard deviation , that is
then can be estimated by
where is -quantile of the non-central t distribution with freedom degree of .
In aircraft fleet management, the aircraft structure’s reliable life is determined based on Equation (5) or (9) and full-scale fatigue tests. Then, all aircraft structures of the same type are managed by the calculation result without considering the aircraft’s load difference. To further achieve individual aircraft monitoring, the premise is to establish the relationship between the aircraft structure’s reliable life and fatigue load.
2.2. P-S-N Curve Determination and Reliable Life Assessment under Service Load
The aircraft structure’s S-N curve describes the relationship between the life and fatigue load , while the P-S-N curve (probability S-N curve) is defined as the relationship between the aircraft structure’s reliable life (with failure probability of 1-R) and fatigue load . In general, the metal structure’s S-N curve follows an inverse power law model [24,25], so the aircraft structure’s P-S-N curve can be expressed as
where (the slope of the P-S-N curve in log-log plot) and are parameters to be determined.
For aircraft structures such as wings, fuselage, and landing gear, it is generally impossible to conduct numerous full-scale fatigue tests under various load levels. Therefore, the slope parameter of the P-S-N curve cannot be obtained by full-scale fatigue tests. Instead, it is generally fitted by numerous accumulated life test data of material specimens or simulation specimens in engineering practice [5]. Conventional life consumption methods assume that the slope parameter is known [6,12]. This paper also retains this assumption. Then, the determination method of is explained below.
Denote the lower confidence limit of the aircraft structure’s reliable life under fatigue load as with the confidence level of and reliability of . According to the aircraft structure’s P-S-N curve, it can be expressed as
Then, the aircraft structure’s reliable damage (defined in Section 3) caused in each test load spectrum of the full-scale fatigue life test with the confidence level of and reliability of can be expressed as
In addition, according to the estimated reliable life in Section 2.1, the above reliable damage can also be calculated as
According to Equations (14) and (15), the following can be derived
Then the aircraft structure’s P-S-N curve with the confidence level of and reliability of can be obtained as
Given any fatigue load , the lower confidence limit of the aircraft structure’s reliable life can be calculated as
It is worth noticing that is assumed to be known in this paper. When the point estimate and lower confidence limit of differ significantly in the fitting process, should be adopted to obtain a more conservative P-S-N curve. The specific process will not be explained here.
3. Reliable Life Consumption Assessment Method for the Aircraft Structure
Based on the aircraft structure’s P-S-N curve, this section further proposes a reliable life consumption assessment method. It can evaluate the reliable life consumption percentage and remaining reliable life percentage of individual aircraft in real time with high reliability and confidence according to the monitored fatigue loads in outfield service.
3.1. Reliable Damage and Damage Threshold
Since the aircraft structure’s life under fatigue load is a random variable and generally presents obvious dispersivity, high confidence and high reliability must be taken into consideration for safety demands. When an aircraft structure works cycles under the fatigue load , the damage is also a random variable. Therefore, the reliability of aircraft damage must also be considered.
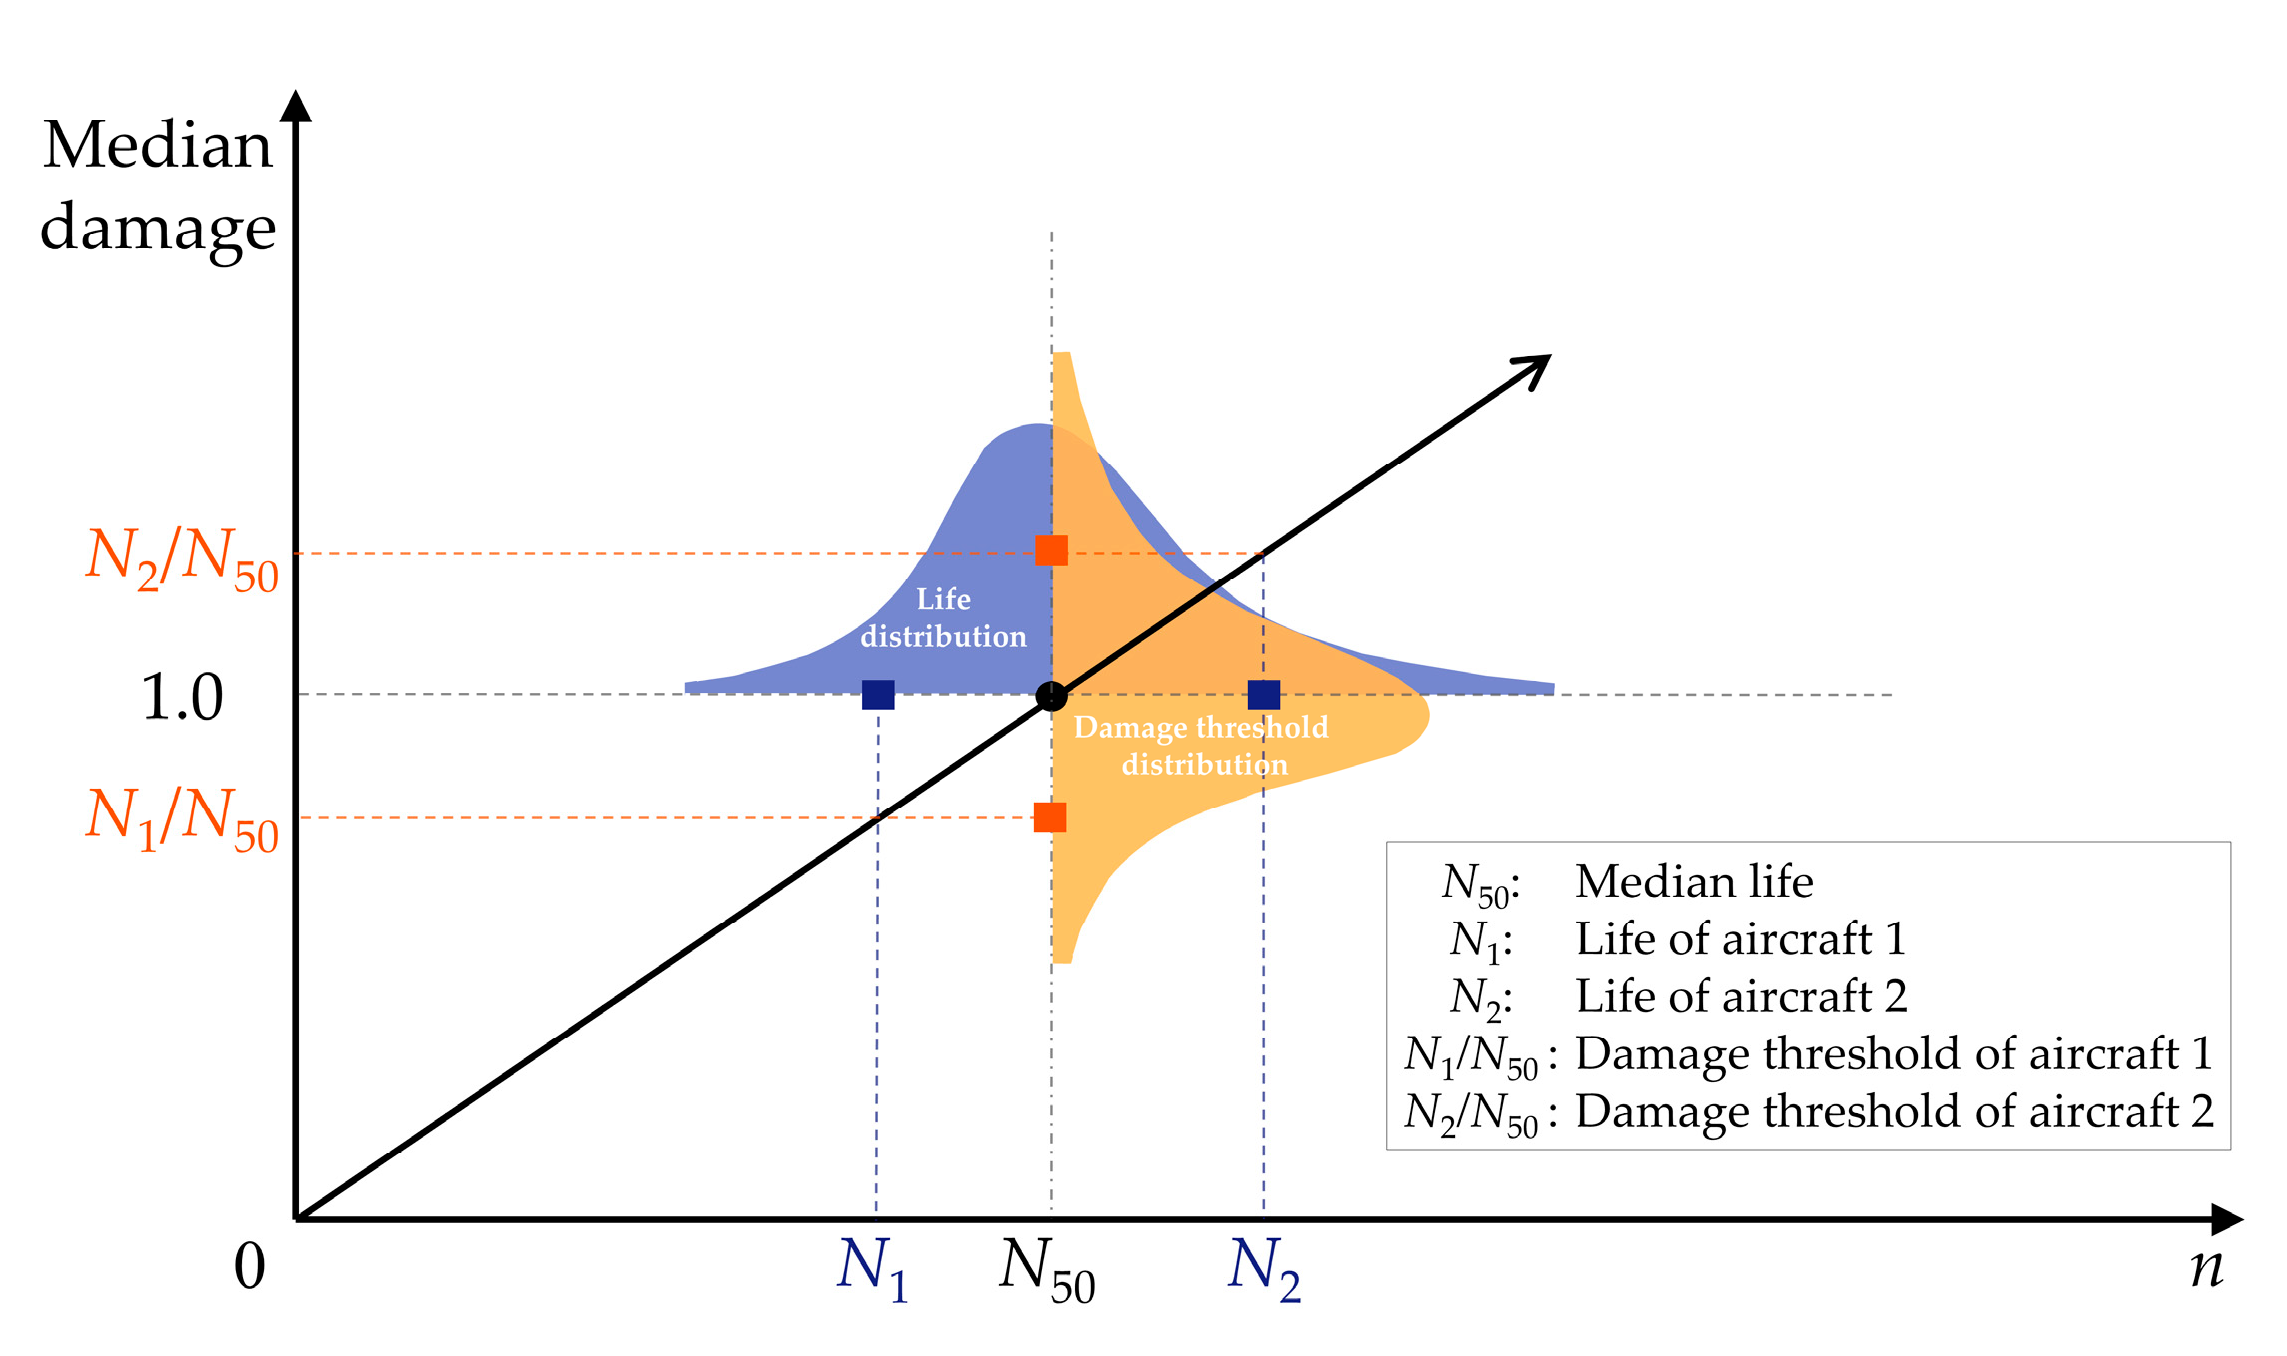
Traditional methods define the aircraft’s damage in terms of its median life, i.e., median damage, then
It can be found that half of the aircraft structure’s actual damage is higher than the median damage , which is contrary to the aircraft’s high-reliability requirement. In addition, if median damage is applied, as shown in Figure 3, the aircraft structure’s damage threshold is a random variable and satisfies
It means that half of the aircraft structure’s actual damage threshold is lower than 1. In this case, setting the threshold at 1 will be dangerous, whereas conducting research on the probability distribution of the threshold might make the issues complicated and inconvenient in engineering [26].
Figure 3.
Schematic diagram for the threshold distribution of the median damage.
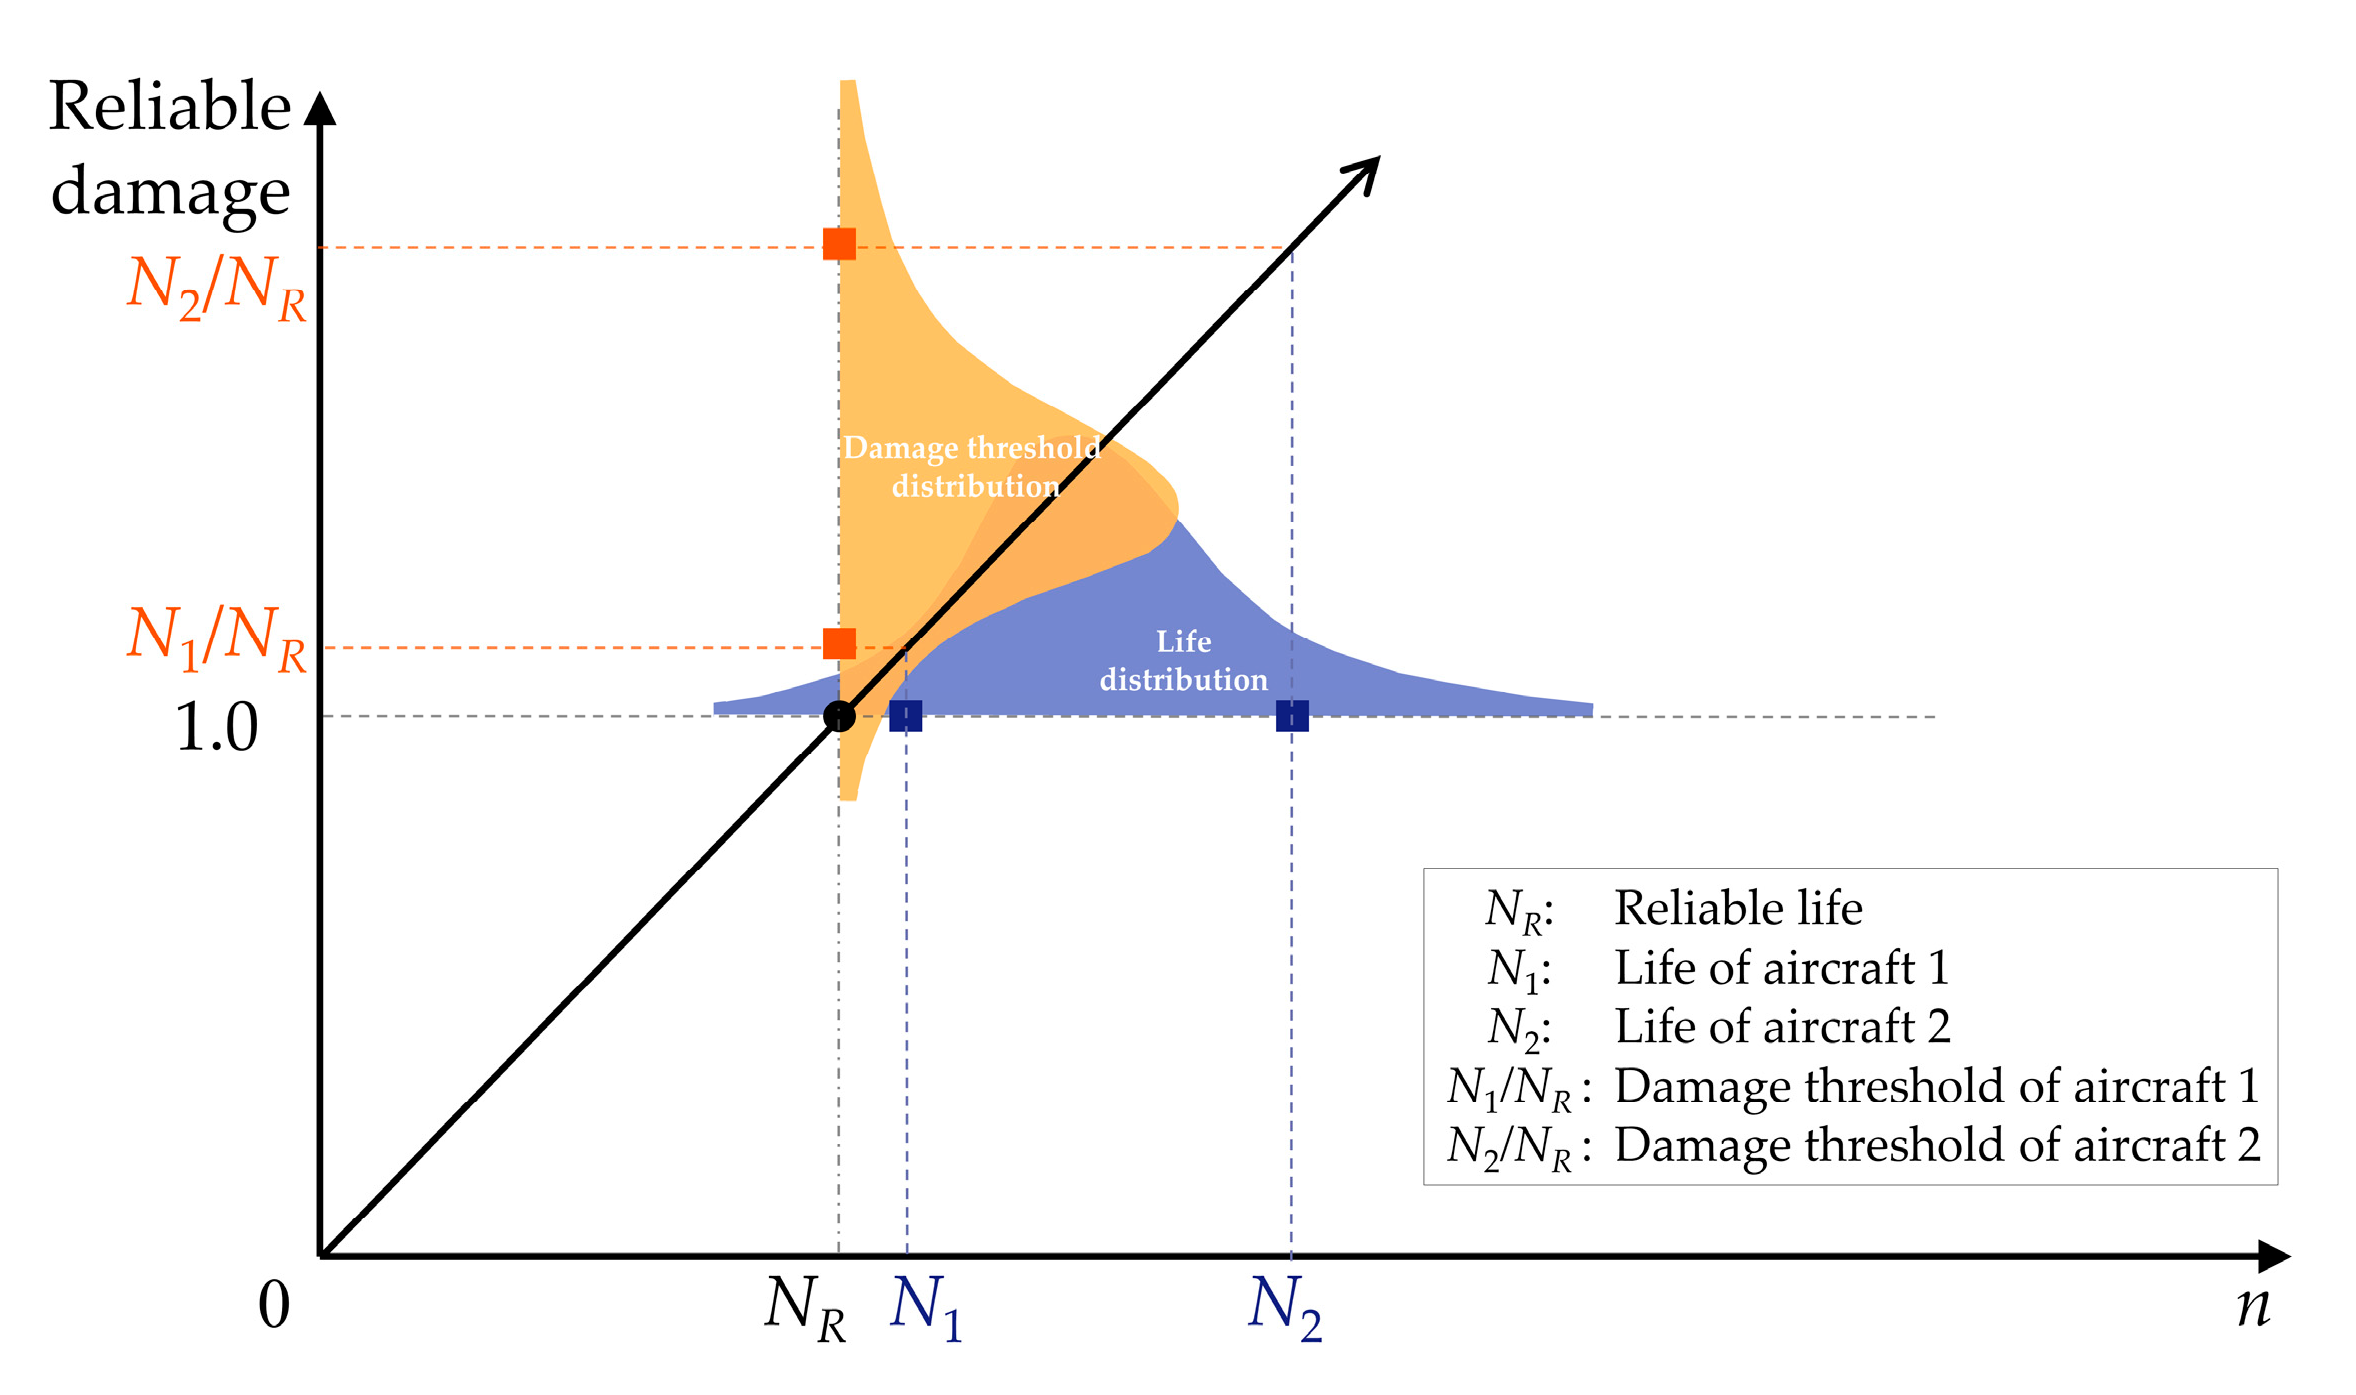
This paper defines the aircraft structure’s damage in terms of its reliable life, i.e., reliable damage [27,28], then
That is, it can be guaranteed that 100R% of the aircraft structure’s actual damage is less than reliable damage , which is safe in engineering and consistent with the concept of reliability. In addition, if reliable damage is applied, the aircraft structure’s damage threshold is also a random variable, but as shown in Figure 4, it satisfies
That is, it can be ensured that 100R% of the aircraft structure will not fail before the reliable damage reaches 1. Therefore, the damage threshold can be directly taken as 1. This can meet the reliability requirements and, meanwhile, facilitate engineering applications.
Figure 4.
Schematic diagram for the threshold distribution of the reliable damage.
3.2. Reliable Life Consumption Percentage and Its Confidence Limit
Assume that an individual aircraft structure has worked for cycles under fatigue load at time t, . Then, according to Miner’s law, the aircraft structure’s reliable life consumption percentage (reliable damage) with the required reliability of is
Its upper confidence limit can be evaluated by
The aircraft’s remaining reliable life percentage with the required reliability of is
Its lower confidence limit can be evaluated by
where is the aircraft’s reliable life under load ; is the lower confidence limit of with the confidence level of , and can be calculated through Equation (19), that is
It can be proven that the confidence level of or is still [27], that is
The indexes and are normalized and universal. They are applicable to all load levels and combinations, and can therefore serve well in individual aircraft life monitoring and life management. For example, if the upper confidence limit of an aircraft structure’s reliable life consumption percentage is , and the lower confidence limit of its remaining reliable life percentage is , then the aircraft structure’s equivalent consumption fatigue cycle under load is , and the remaining reliable life under load with the confidence level of and reliability of is .
4. Individual Aircraft Life Monitoring Method
Based on the reliable life consumption assessment method in Section 3 and the aircraft’s load monitoring system, the aircraft’s reliable life consumption percentage and remaining reliable life percentage in outfield service can be easily evaluated in real time, thus realizing individual aircraft life monitoring and online life management. In this section, load-based individual aircraft life monitoring, mission-based individual aircraft life monitoring, and online aircraft life management are introduced, respectively.
4.1. Load-Based Individual Aircraft Life Monitoring
Load-based life monitoring requires real-time fatigue load monitoring for the aircraft structure throughout the service. Much literature currently aims at fatigue load monitoring research on aircraft structures, such as [8,9,10,11]. Overall, they can be divided into two categories. One realizes structure load monitoring according to the aircraft’s flight parameter system. During aircraft flight, the aircraft’s flight parameters (e.g., vertical overload, mach number, height, velocity pressure, sideslip, attack angle, and others) should be recorded in real time, and the structure’s fatigue load can be solved through the mapping relationship (established by multiple linear regression or artificial neural networks) between flight parameters and structural loads. Another is structure load monitoring according to strain gauges in critical parts and finite element analysis. Currently, advanced aircraft such as the F-35 generally use a mixture of the above two methods. In engineering practice, a suitable load monitoring scheme should be selected according to the aircraft’s specific conditions.
The procedure for load-based individual aircraft life monitoring is illustrated in Figure 5. Assume that an individual aircraft structure has experienced load cycles of at time t, , then the upper confidence limit of the aircraft structure’s reliable life consumption percentage with the confidence level of and reliability of can be calculated through Equation (25). When , the individual aircraft can still be in service, and the lower confidence limit of its remaining reliable life percentage is .
4.2. Mission-Based Individual Aircraft Life Monitoring
Mission-based life monitoring requires flight mission (or flight subject) recording rather than real-time fatigue load monitoring for each aircraft, which is suitable for situations where load monitoring technology is restricted by sensing equipment. In this monitoring scheme, the aircraft structure’s fatigue load history and reliable life consumption in each mission type should be estimated in advance, and then the aircraft structure’s reliable life consumption in outfield service can be evaluated through the recording of flight missions. This monitoring scheme is not high-precision because fatigue loads are not strictly the same even on the same flight mission. However, it is easy to implement, making it applicable and popular in engineering practice.
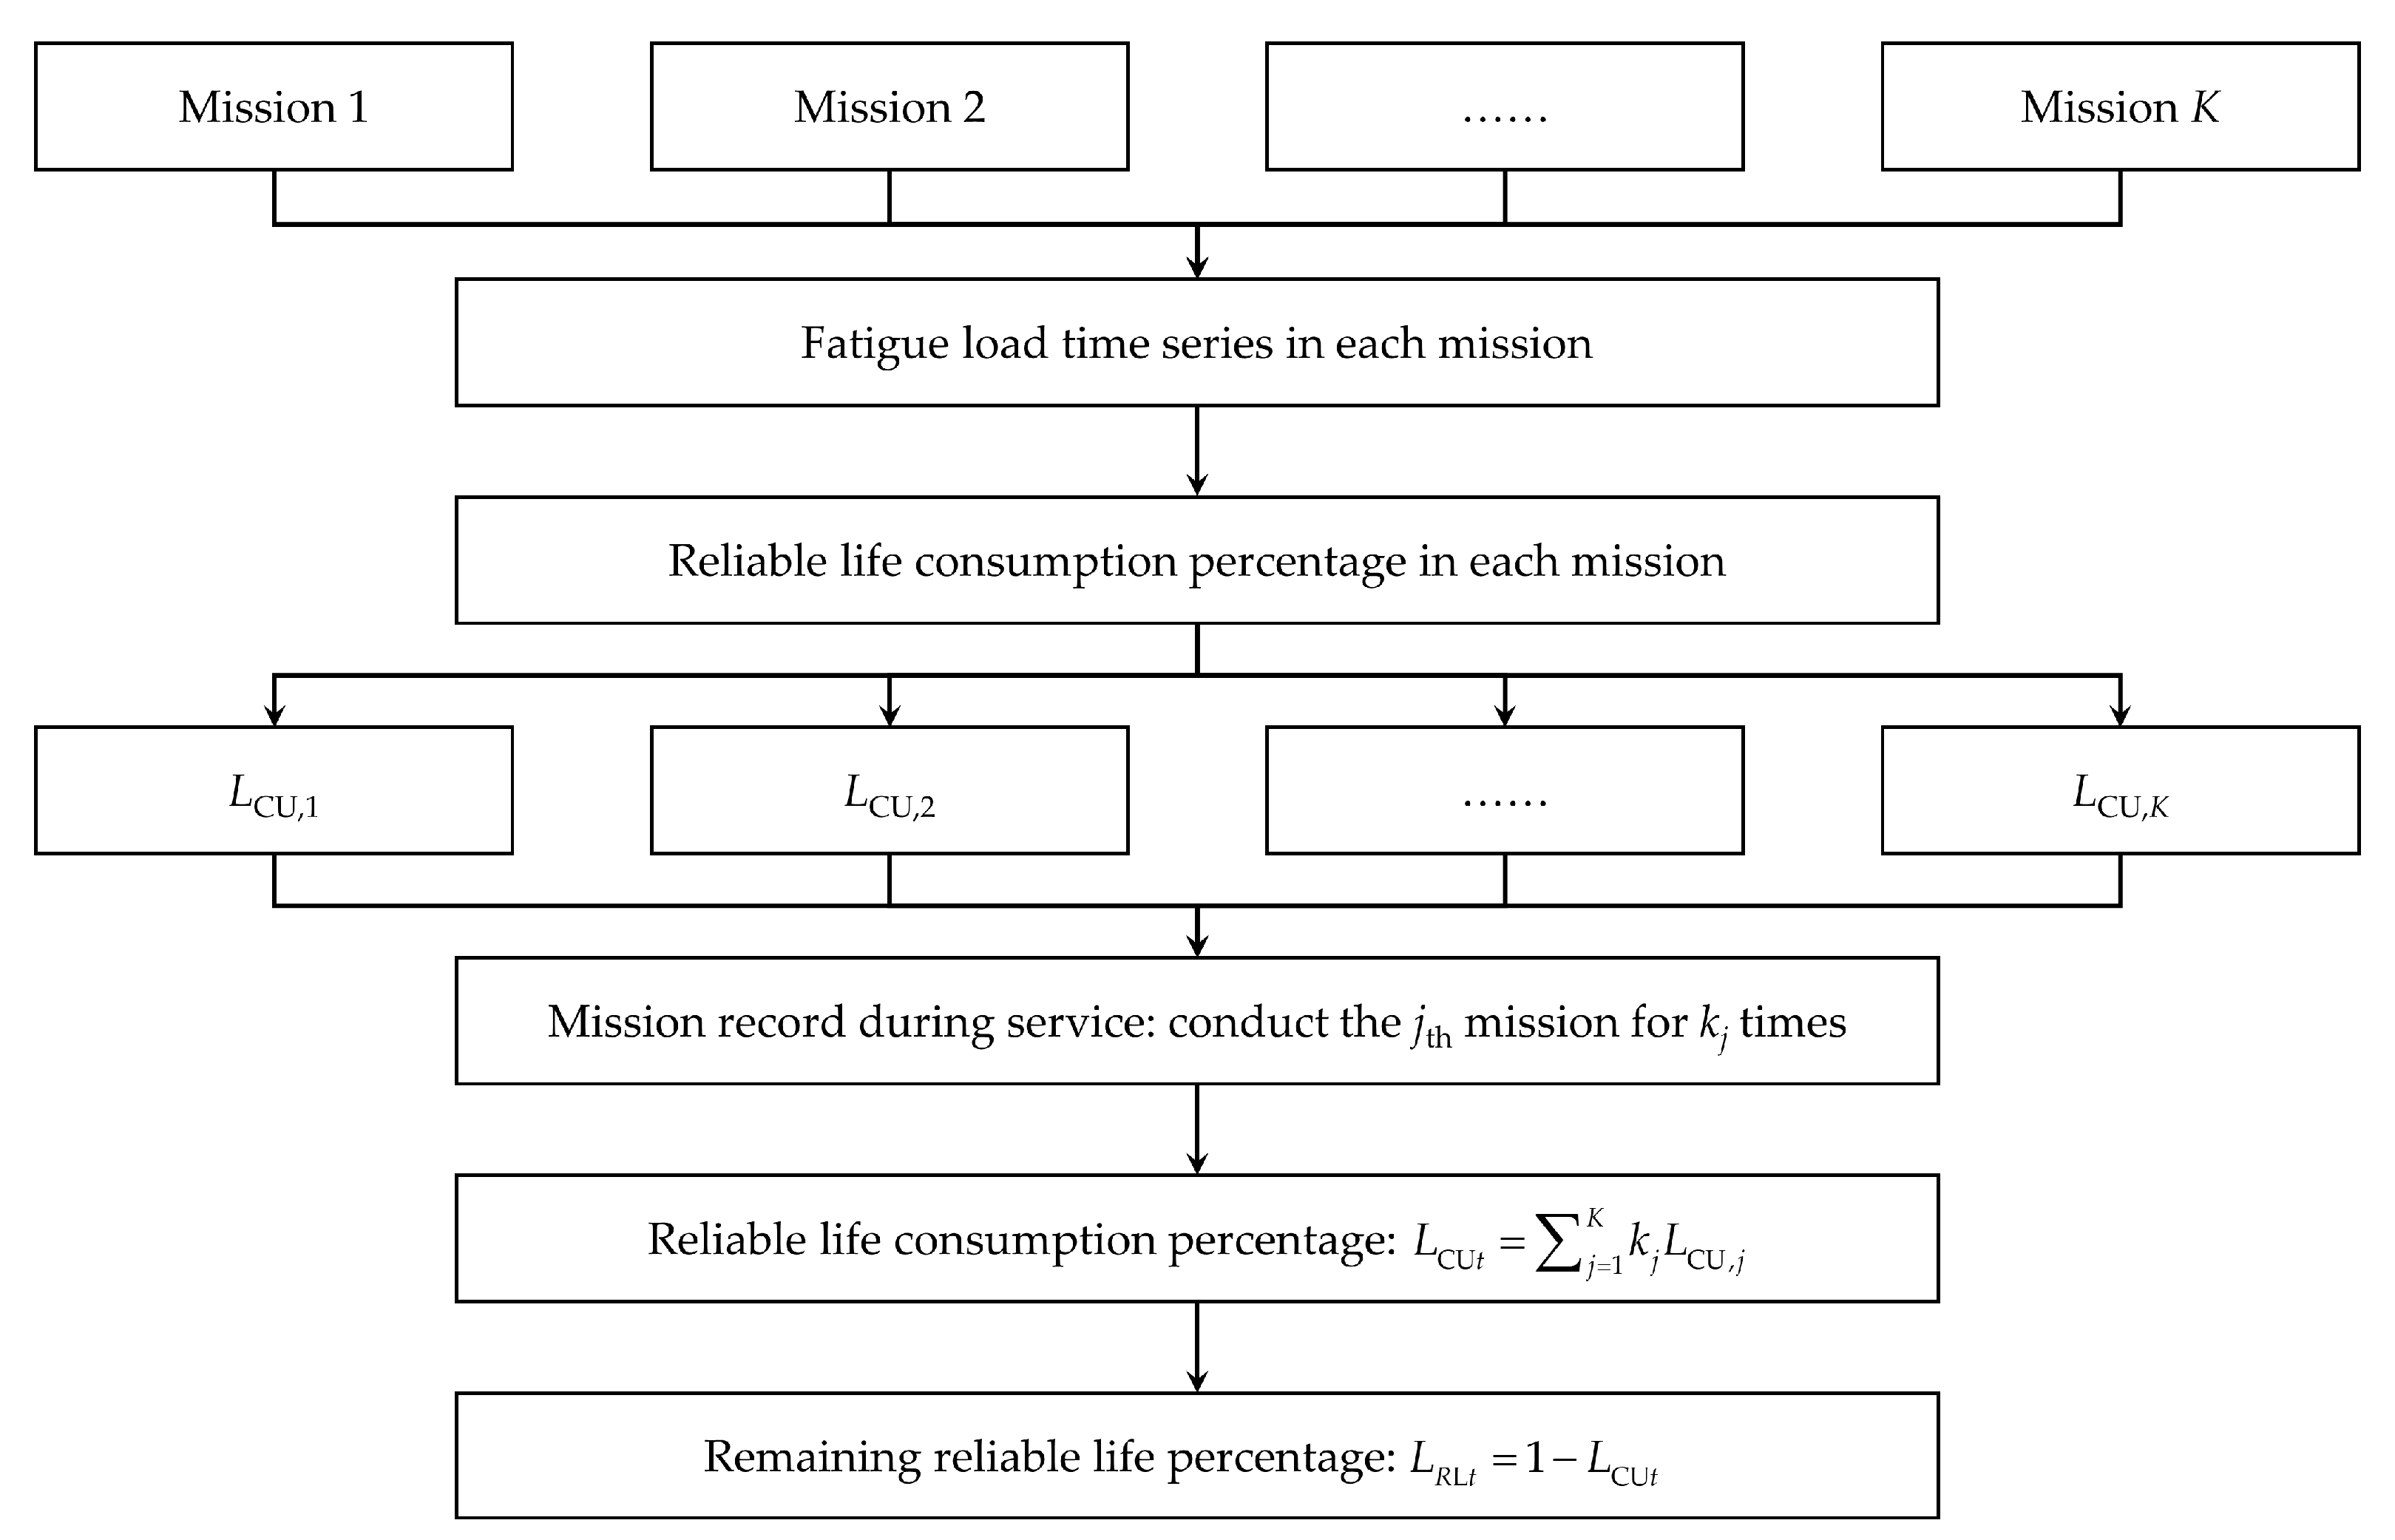
The procedure for mission-based individual aircraft life monitoring is illustrated in Figure 6. Assume that an individual aircraft structure has conducted the mission for times at time t, , then the upper confidence limit of the aircraft structure’s reliable life consumption percentage with the confidence level of and reliability of can be calculated as
And the lower confidence limit of the aircraft structure’s remaining reliable life percentage is . In the equation, is the upper confidence limit of the aircraft structure’s reliable life consumption percentage caused by each mission, which can be calculated by Equation (25) and the fatigue load history of the mission.
Figure 6.
The procedure of mission-based individual aircraft life monitoring.

4.3. Online Aircraft Life Management
For the individual aircraft with , it can meet the required confidence level and reliability. Thus, the aircraft can still be in service with the specified reliability requirements. In contrast, for the individual aircraft with , it cannot meet the specified reliability requirements and cannot be allowed in service before the aircraft’s life extension work. In this case, the aircraft should be scheduled for scrapping, life extension, and other management work.
For each aircraft in the fleet, the severity of flight missions and fatigue loads vary, causing the reliable life consumption to also be different. To fully exploit the service life potential of each aircraft and coordinate the aircraft fleet life to facilitate uniform management, online life management should be further conducted. For example, milder missions can be planned for aircraft with higher reliable life consumption, while severer missions can be planned for aircraft with lower reliable life consumption. Specifically, the individual aircraft with and can still perform the mission alone for times, where
Furthermore, the aircraft can also be planned for mission combinations based on actual demand on the premise of
where is the number of performing times for the mission in the mission combination scheme.
5. Example and Discussion
In this section, a military aircraft’s critical structure, the central wing joint panel, is used as an example to illustrate the proposed individual life monitoring method. In the example, the aircraft’s life test data is real, while the aircraft’s service loads are simulated.
5.1. Reliable Life Determination under Test Load Spectrum
Five samples are adopted for fatigue life tests under the load block spectrum listed in Table 2 [29]. The test result is
where one block means that the specimen experiences the test loads in Table 2 for one time. In the test design, the specimen is equivalent to working for one flight hour when it experiences one load block.
The lognormal Quantile-Quantile plot of the test result is illustrated in Figure 7. It can be found that the life of the central wing joint panel can be considered to follow a lognormal distribution. Since the dispersion parameter of the lognormal distribution is unknown, Equations (9)–(11) should be used for reliable life determination. Given the required reliability of and required confidence level of , the lower confidence limit of the reliable life under the test load spectrum is calculated as
In aircraft fleet management, all aircraft will be managed with the above estimation result, ignoring the usage load difference of each aircraft.
In addition, the point estimate of the structure’s median life is also given for comparison in the following text. Let , it can be calculated as
5.2. P-S-N Curve Assessment
The P-S-N curve is needed for the structure’s reliable life consumption and individual aircraft life monitoring. According to reference [29], the slope parameter of the structure’s P-S-N curve is
According to Equation (17), the P-S-N curve parameter can be calculated as
Then the P-S-N curve of the central wing joint panel with and can be calculated as
In addition, the median S-N curve is also estimated for comparison in the following text. Let ; it can be calculated as
5.3. Verification of Individual Aircraft Life Monitoring under Test Load Spectrum
Compared with aircraft fleet management, the progressiveness of individual aircraft monitoring is that it considers the actual service load of individual aircraft. However, the two methods should achieve the same result when the actual service load is same as the test load. This can be used for the verification of the proposed method.
Suppose that an individual central wing joint panel has worked under the test spectrum in Table 2 for 7252 blocks. Then, three methods are discussed below.
For the aircraft fleet management method, the reliable life determination result is blocks with reliability requirements of and . When the central wing joint panel works for 7252 blocks, it cannot work before life extension.
For the individual aircraft monitoring method in this paper, the reliable life consumption percentage and remaining reliable life percentage of the central wing joint panel are calculated as
It means that this central wing joint panel cannot still work under any fatigue loads with the requirements of and . The conclusion is the same as that of the aircraft fleet management method.
For the conventional life-consumption-based individual aircraft monitoring method, the life-consumption percentage of the central wing joint panel is calculated as
It means that this central wing joint panel can still work, which is inconsistent with the aircraft fleet management method and dangerous in engineering.
The above calculation conclusions are listed in Table 4. It indicates that the proposed method in this paper is entirely consistent with the aircraft’s reliable life determination with high confidence and reliability. This is because:
- (1)
- Individual aircraft life monitoring is conducted based on reliable life consumption with high reliability and high confidence, while the same reliability values are required in the aircraft’s reliable life determination.
- (2)
- The P-S-N curve used for reliable life consumption is obtained based on the aircraft structure’s full-scale life test, while the aircraft structure’s life determination is also conducted through the full-scale life test.
Conventional individual life monitoring methods based on life consumption lack adequate consideration of confidence and reliability. It can be seen from above that confidence and reliability must be simultaneously considered. Otherwise, individual aircraft life monitoring will be disconnected from high-confidence and high-reliability requirements in the aircraft’s reliable life determination and extension.

Table 4.
Comparison of aircraft fleet management and individual aircraft life monitoring under test load spectrum.
Table 4.
Comparison of aircraft fleet management and individual aircraft life monitoring under test load spectrum.
| Aircraft fleet management method | Proposed individual aircraft monitoring method | Conventional life-consumption-based individual aircraft monitoring method |
| Work is not allowed after 7252 blocks | Work is not allowed after 7252 blocks | Work is allowed after 7252 blocks |
5.4. Comparision of Individual Aircraft Life Monitoring and Aircraft Fleet Management under Service Load
Suppose that an individual aircraft has worked for 5122 flight hours during outfield service. The fatigue load of its central wing joint panel is monitored in real time. Table 5 lists its average fatigue load history during one flight hour. And the lower confidence limit of its reliable life under each fatigue load is calculated through Equation (41) and also listed in Table 5.
Based on Equation (25), the upper confidence limit of the reliable life consumption percentage with and can be evaluated as
Then the lower confidence limit of the remaining reliable life percentage with and can be evaluated as
Compared with this, all aircraft will be managed with in the aircraft fleet management, ignoring the usage load differences of each aircraft. The structure’s determined reliable life in aircraft fleet management is 7252 flight hours, and the work time of the individual aircraft is 5122 flight hours. It means that 5122/7252 = 70.6% of reliable life has been used, while only 29.4% (2130 flight hours) remains. The calculation results are listed in Table 6. In this case, the aircraft fleet management will underestimate the aircraft’s life potential by 70.6%/56.2% = 1.26 times, causing economic waste.
Furthermore, if the service load of another individual aircraft is too severe, aircraft fleet management might be dangerous. For example, suppose that another individual aircraft has also worked for 5122 flight hours during outfield service. The fatigue load history of its central wing joint panel during one flight hour is listed in Table 7. In this case, the upper confidence limit of the reliable life consumption percentage with and can be evaluated as
However, the aircraft fleet management method still believes that only 70.6% of reliable life has been used. The calculation results are listed in Table 8. It can be seen that the aircraft fleet management will overestimate the aircraft’s life potential by 92.5%/70.6% = 1.31 times, making the aircraft dangerous.
Table 7.
Average service load history of another individual central wing joint panel during one flight hour (stress ratio r = 0).
Table 7.
Average service load history of another individual central wing joint panel during one flight hour (stress ratio r = 0).
| i | /(MPa) | /(Cycles) | Lower Confidence Limit of Reliable Life /(Cycles) |
|---|---|---|---|
| 1 | 625 | 0.20 | 2.06 × 10⁴ |
| 2 | 588 | 1.08 | 3.11 × 10⁴ |
| 3 | 562 | 2.26 | 4.99 × 10⁴ |
| 4 | 393 | 3.53 | 8.41 × 10⁴ |
| 5 | 326 | 6.07 | 2.34 × 10⁵ |
| 6 | 299 | 5.96 | 5.31 × 10⁵ |
| 7 | 245 | 5.09 | 8.62 × 10⁵ |
| 8 | 208 | 18.03 | 1.53 × 10⁶ |
This section provides a simulation example for the comparison between the proposed individual aircraft life monitoring method and the aircraft fleet management method under two cases: mild service load (Table 5) and severe service load (Table 7). In engineering practice, the specific comparison effect will depend on the actual aircraft load difference.
5.5. Online Life Management of Individual Aircraft
The remaining reliable life management of individual aircraft can also be realized online. A simple simulation example for mission arrangement is given below.
Suppose that two mission types need to be conducted for the individual aircraft with and in Section 5.4. If the upper confidence limit of the structure’s reliable life consumption percentage caused by Mission 1 is known as , then the aircraft can continue to perform the mission for times with the required reliability of and . The upper confidence limit of the structure’s reliable life consumption percentage by Mission 2 is known as , then the aircraft can continue to perform the mission for times with the required reliability. According to the actual demand, as shown in Figure 8, mission combinations can also be reasonably arranged.
By doing so, the active control of the individual aircraft can be realized.
6. Conclusions
A novel individual aircraft life monitoring method based on reliable life consumption assessment is proposed. It can evaluate the upper confidence limit of the reliable life consumption percentage and the lower confidence limit of the remaining reliable life percentage in real time according to the aircraft structure’s fatigue load history or flight missions during service. When the reliable life consumption percentage reaches 1.0 or the remaining reliable life percentage reaches 0, the aircraft structure should be planned for scrapping or life extension.
Furthermore, different mission types correspond to different loads and damages. Therefore, according to the aircraft’s remaining reliable life and reliable life consumption caused by different mission types, online life management work such as mission arrangement can be reasonably conducted to ensure its safety and exploit its life potential simultaneously.
The conventional life-consumption-based individual aircraft monitoring method lacks reliability consideration, and this paper solves this problem. The case study and discussion indicate that reliability and confidence must be considered simultaneously, and the proposed method is consistent with the aircraft’s reliable life determination and extension work with high confidence and high reliability, widely accepted in engineering practice nowadays.
Author Contributions
Conceptualization, Y.F. and H.F.; methodology, Y.F. and H.F.; software, Y.F.; validation, Y.F. and H.F.; formal analysis, Y.F.; investigation, Y.F. and H.F.; data curation, Y.F.; writing—original draft preparation, Y.F.; writing—review and editing, Y.F. and H.F.; visualization, Y.F.; funding acquisition, H.F. All authors have read and agreed to the published version of the manuscript.
Funding
This research was funded by the National Natural Science Foundation of China, grant number U2037602.
Data Availability Statement
The data are contained within the article.
Conflicts of Interest
The authors declare no conflict of interest.
References
- Molent, L.; Aktepe, B. Review of Fatigue Monitoring of Agile Military Aircraft. Fatigue Fract. Eng. Mater. Struct. 2000, 23, 767–785. [Google Scholar] [CrossRef]
- Diamanti, K.; Soutis, C. Structural Health Monitoring Techniques for Aircraft Composite Structures. Prog. Aerosp. Sci. 2010, 46, 342–352. [Google Scholar] [CrossRef]
- Pfingstl, S.; Steinweg, D.; Zimmermann, M.; Hornung, M. On the Potential of Extending Aircraft Service Time Using Load Monitoring. J. Aircr. 2022, 59, 377–385. [Google Scholar] [CrossRef]
- Lee, H.; Cho, H.; Park, S. Review of the F-16 Individual Aircraft Tracking Program. J. Aircr. 2012, 49, 1398–1405. [Google Scholar] [CrossRef]
- Jiao, R.; He, X.F.; Li, Y.H. Individual Aircraft Life Monitoring: An Engineering Approach for Fatigue Damage Evaluation. Chin. J. Aeronaut. 2018, 31, 727–739. [Google Scholar] [CrossRef]
- Zhang, Y.J.; Wang, B.T.; Ning, Y.; Xue, H.F.; Lei, X.X. Study on Health Monitoring and Fatigue Life Prediction of Aircraft Structures. Materials 2022, 15, 8606. [Google Scholar] [CrossRef]
- Hoffman, P.C. Fleet Management Issues and Technology Needs. Int. J. Fatigue 2009, 31, 1631–1637. [Google Scholar] [CrossRef]
- Nicolas, M.J.; Sullivan, R.W.; Richards, W.L. Large Scale Applications Using FBG Sensors: Determination of In-Flight Loads and Shape of a Composite Aircraft Wing. Aerospace 2016, 3, 18. [Google Scholar] [CrossRef]
- Zhang, Y.J.; Cao, S.C.; Wang, B.T.; Yin, Z.P. A Flight Parameter-Based Aircraft Structural Load Monitoring Method Using a Genetic Algorithm Enhanced Extreme Learning Machine. Appl. Sci. 2023, 13, 4018. [Google Scholar] [CrossRef]
- Castellani, M.; Lemmens, Y.; Cooper, J.E. Parametric Reduced Order Model Approach for Rapid Dynamic Loads Prediction. Aerosp. Sci. Technol. 2016, 52, 29–40. [Google Scholar] [CrossRef]
- Candon, M.; Esposito, M.; Fayek, H.; Levinski, O.; Koschel, S.; Joseph, N.; Carrese, R.; Marzocca, P. Advanced Multi-Input System Identification for next Generation Aircraft Loads Monitoring Using Linear Regression, Neural Networks and Deep Learning. Mech. Syst. Signal Proc. 2022, 171, 108809. [Google Scholar] [CrossRef]
- Zhi, W.; Wang, Y.Y. A Study of the Method for Calculating Fatigue Damage of Aircraft by Using Recorded Load Factors. In Proceedings of the Congress of the International Council of the Aeronautical Sciences, Nice, France, 19 September 2010; pp. 1–7. [Google Scholar]
- Lee, H.; Park, S.; Kim, H. Estimation of Aircraft Structural Fatigue Life Using the Crack Severity Index Methodology. J. Aircr. 2010, 47, 1672–1678. [Google Scholar] [CrossRef]
- White, P.; Mongru, D.; Molent, L. A Crack Growth-Based Individual Aircraft Monitoring Method Utilising a Damage Metric. Struct. Health Monit. 2018, 17, 1178–1191. [Google Scholar] [CrossRef]
- Molent, L.; Barter, S.; Foster, W. Verification of an Individual Aircraft Fatigue Monitoring System. Int. J. Fatigue 2012, 43, 128–133. [Google Scholar] [CrossRef]
- Iyyer, N.; Sarkar, S.; Merrill, R.; Phan, N. Aircraft Life Management Using Crack Initiation and Crack Growth Models—P-3C Aircraft Experience. Int. J. Fatigue 2007, 29, 1584–1607. [Google Scholar] [CrossRef]
- Martins, T.; Infante, V.; Sousa, L.; Fonseca, A.; Antunes, P.J.; Moura, A.M.; Serrano, B. Numerical and Experimental Study of Aircraft Structural Health. Int. J. Fatigue 2020, 132, 105348. [Google Scholar] [CrossRef]
- Main, B.; Molent, L.; Singh, R.; Barter, S. Fatigue Crack Growth Lessons from Thirty-Five Years of the Royal Australian Air Force F/A-18 A/B Hornet Aircraft Structural Integrity Program. Int. J. Fatigue 2020, 133, 105426. [Google Scholar] [CrossRef]
- Templalexis, I.; Lionis, I.; Christou, N. Comparative Study of a Powerplant Life Consumption Rate When Installed in Two Different Aircraft Variants. Aerospace 2021, 8, 327. [Google Scholar] [CrossRef]
- Bazaras, Z.; Lukosevicius, V. Statistical Assessment of Low-Cycle Fatigue Durability. Symmetry 2022, 14, 1205. [Google Scholar] [CrossRef]
- Yan, C.L.; Liu, K.G. Theory of Economic Life Prediction and Reliability Assessment of Aircraft Structures. Chin. J. Aeronaut. 2011, 24, 164–170. [Google Scholar] [CrossRef]
- He, X.F.; Zhai, B.; Dong, Y.M.; Liu, W.T. Safe-Life Analysis Accounting for the Loading Spectra Variability. Eng. Fail. Anal. 2010, 17, 1213–1220. [Google Scholar] [CrossRef]
- Buderath, M.; McFeat, J.; Azzam, H. The Need for Guidance on Integrating Structural Health Monitoring within Military Aircraft Systems. Struct. Health Monit. 2014, 13, 581–590. [Google Scholar] [CrossRef]
- Murakami, Y.; Takagi, T.; Wada, K.; Matsunaga, H. Essential Structure of S-N Curve: Prediction of Fatigue Life and Fatigue Limit of Defective Materials and Nature of Scatter. Int. J. Fatigue 2021, 146, 106138. [Google Scholar] [CrossRef]
- Mohabeddine, A.; Correia, J.; Aires Montenegro, P.; De Jesus, A.; Miguel Castro, J.; Berto, F. Probabilistic S-N Curves for CFRP Retrofitted Steel Details. Int. J. Fatigue 2021, 148, 106205. [Google Scholar] [CrossRef]
- Tan, X.F.; Xie, L.Y. Fatigue Reliability Evaluation Method of a Gear Transmission System Under Variable Amplitude Loading. IEEE Trans. Reliab. 2019, 68, 599–608. [Google Scholar] [CrossRef]
- Fu, H.M.; Fu, Y.S.; Wen, X.L. Methods for reliable life consumption assessment and life management. Dev. Innov. Mach. Electr. Prod. 2020, 33, 4–7. (In Chinese). [Google Scholar] [CrossRef]
- Fu, Y.S.; Fu, H.M.; Wu, Q. A Reliable Life Consumption Assessment and Individual Life Monitoring Method for Rolling Bearings. Machines 2023, 11, 742. [Google Scholar] [CrossRef]
- Sui, F.C.; Liu, W.T. Study on the technique of developing constant amplitude load spectrum for aircraft fatigue test. J. Mech. Strength 2008, 30, 266–269. (In Chinese). [Google Scholar] [CrossRef]
Figure 1.
The main procedure for individual aircraft life monitoring.

Figure 2.
Technology roadmap of this paper.
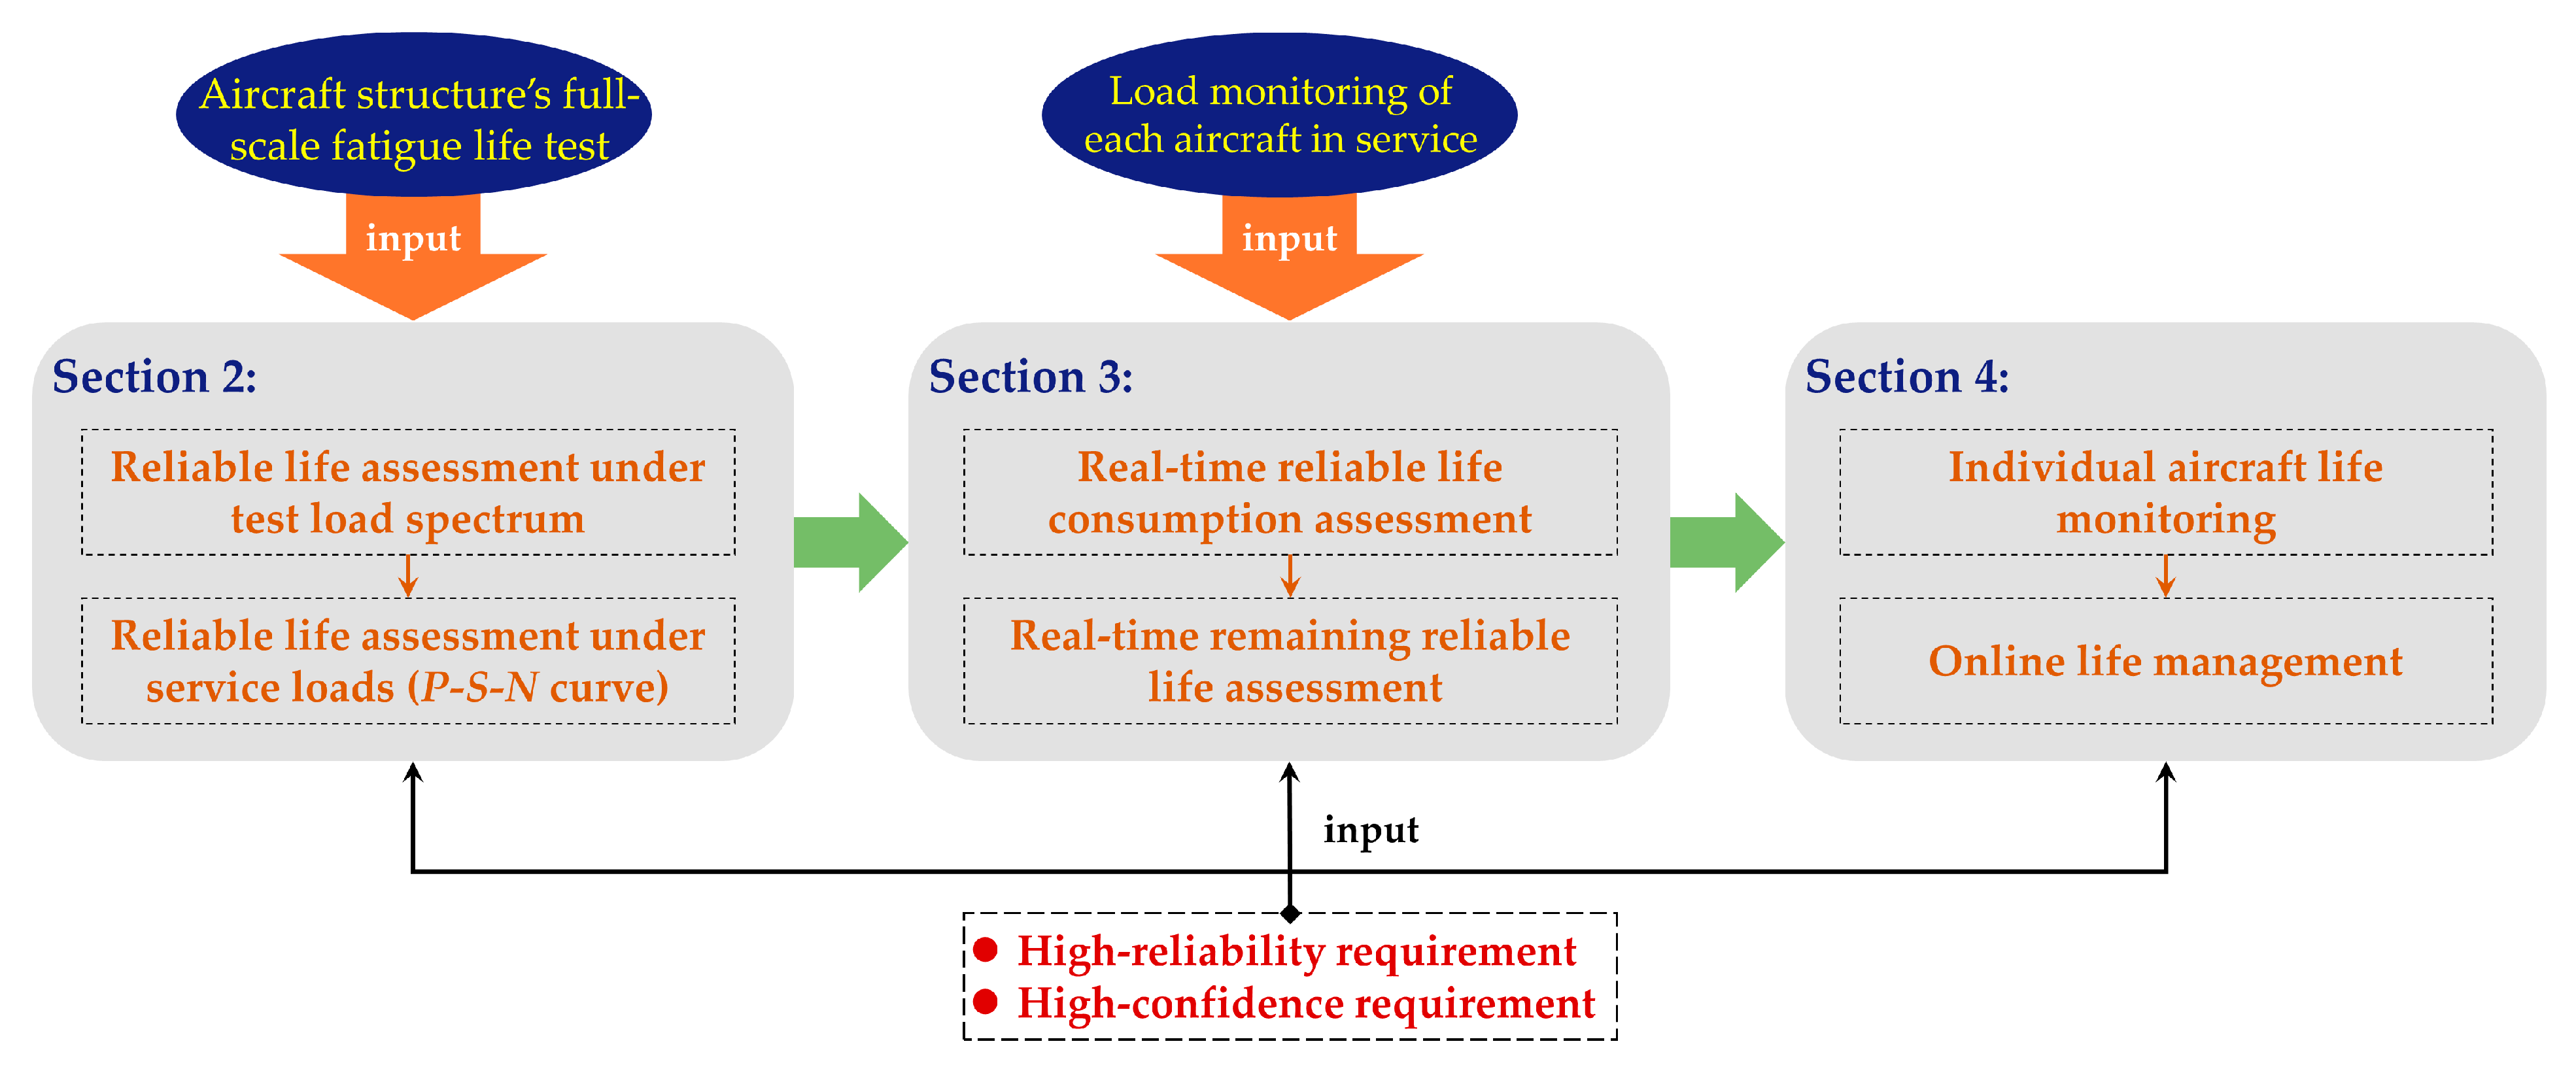
Figure 5.
The procedure of load-based individual aircraft life monitoring.
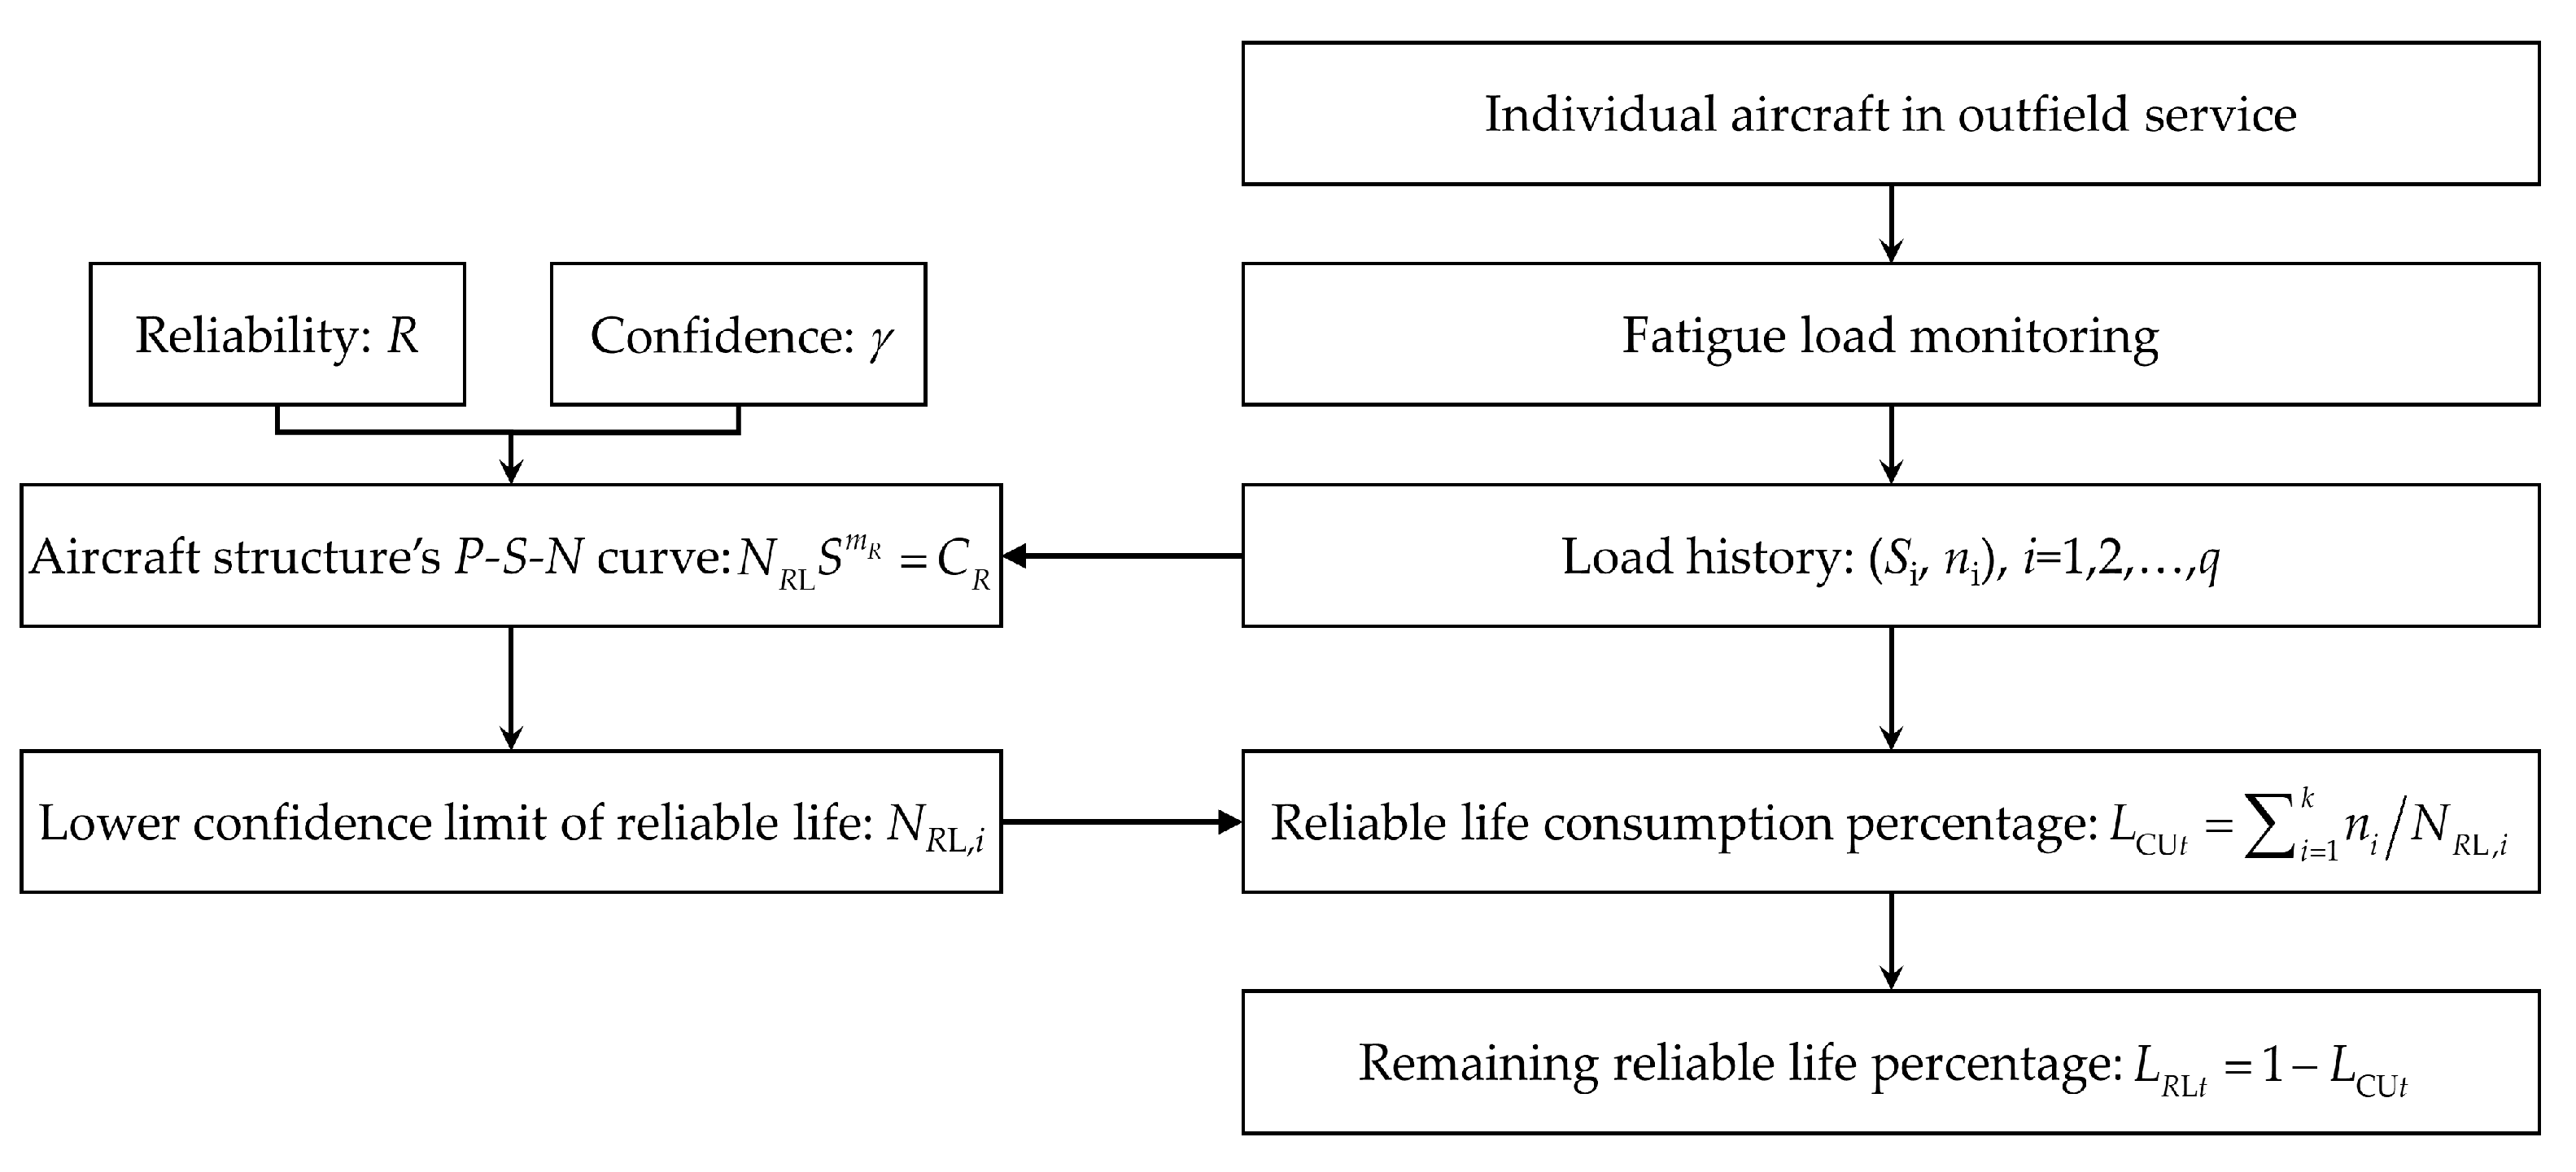
Figure 7.
The lognormal Quantile-Quantile plot of test life of the central wing joint panel.

Figure 8.
The reliable life consumption percentage and subsequent mission arrangements.
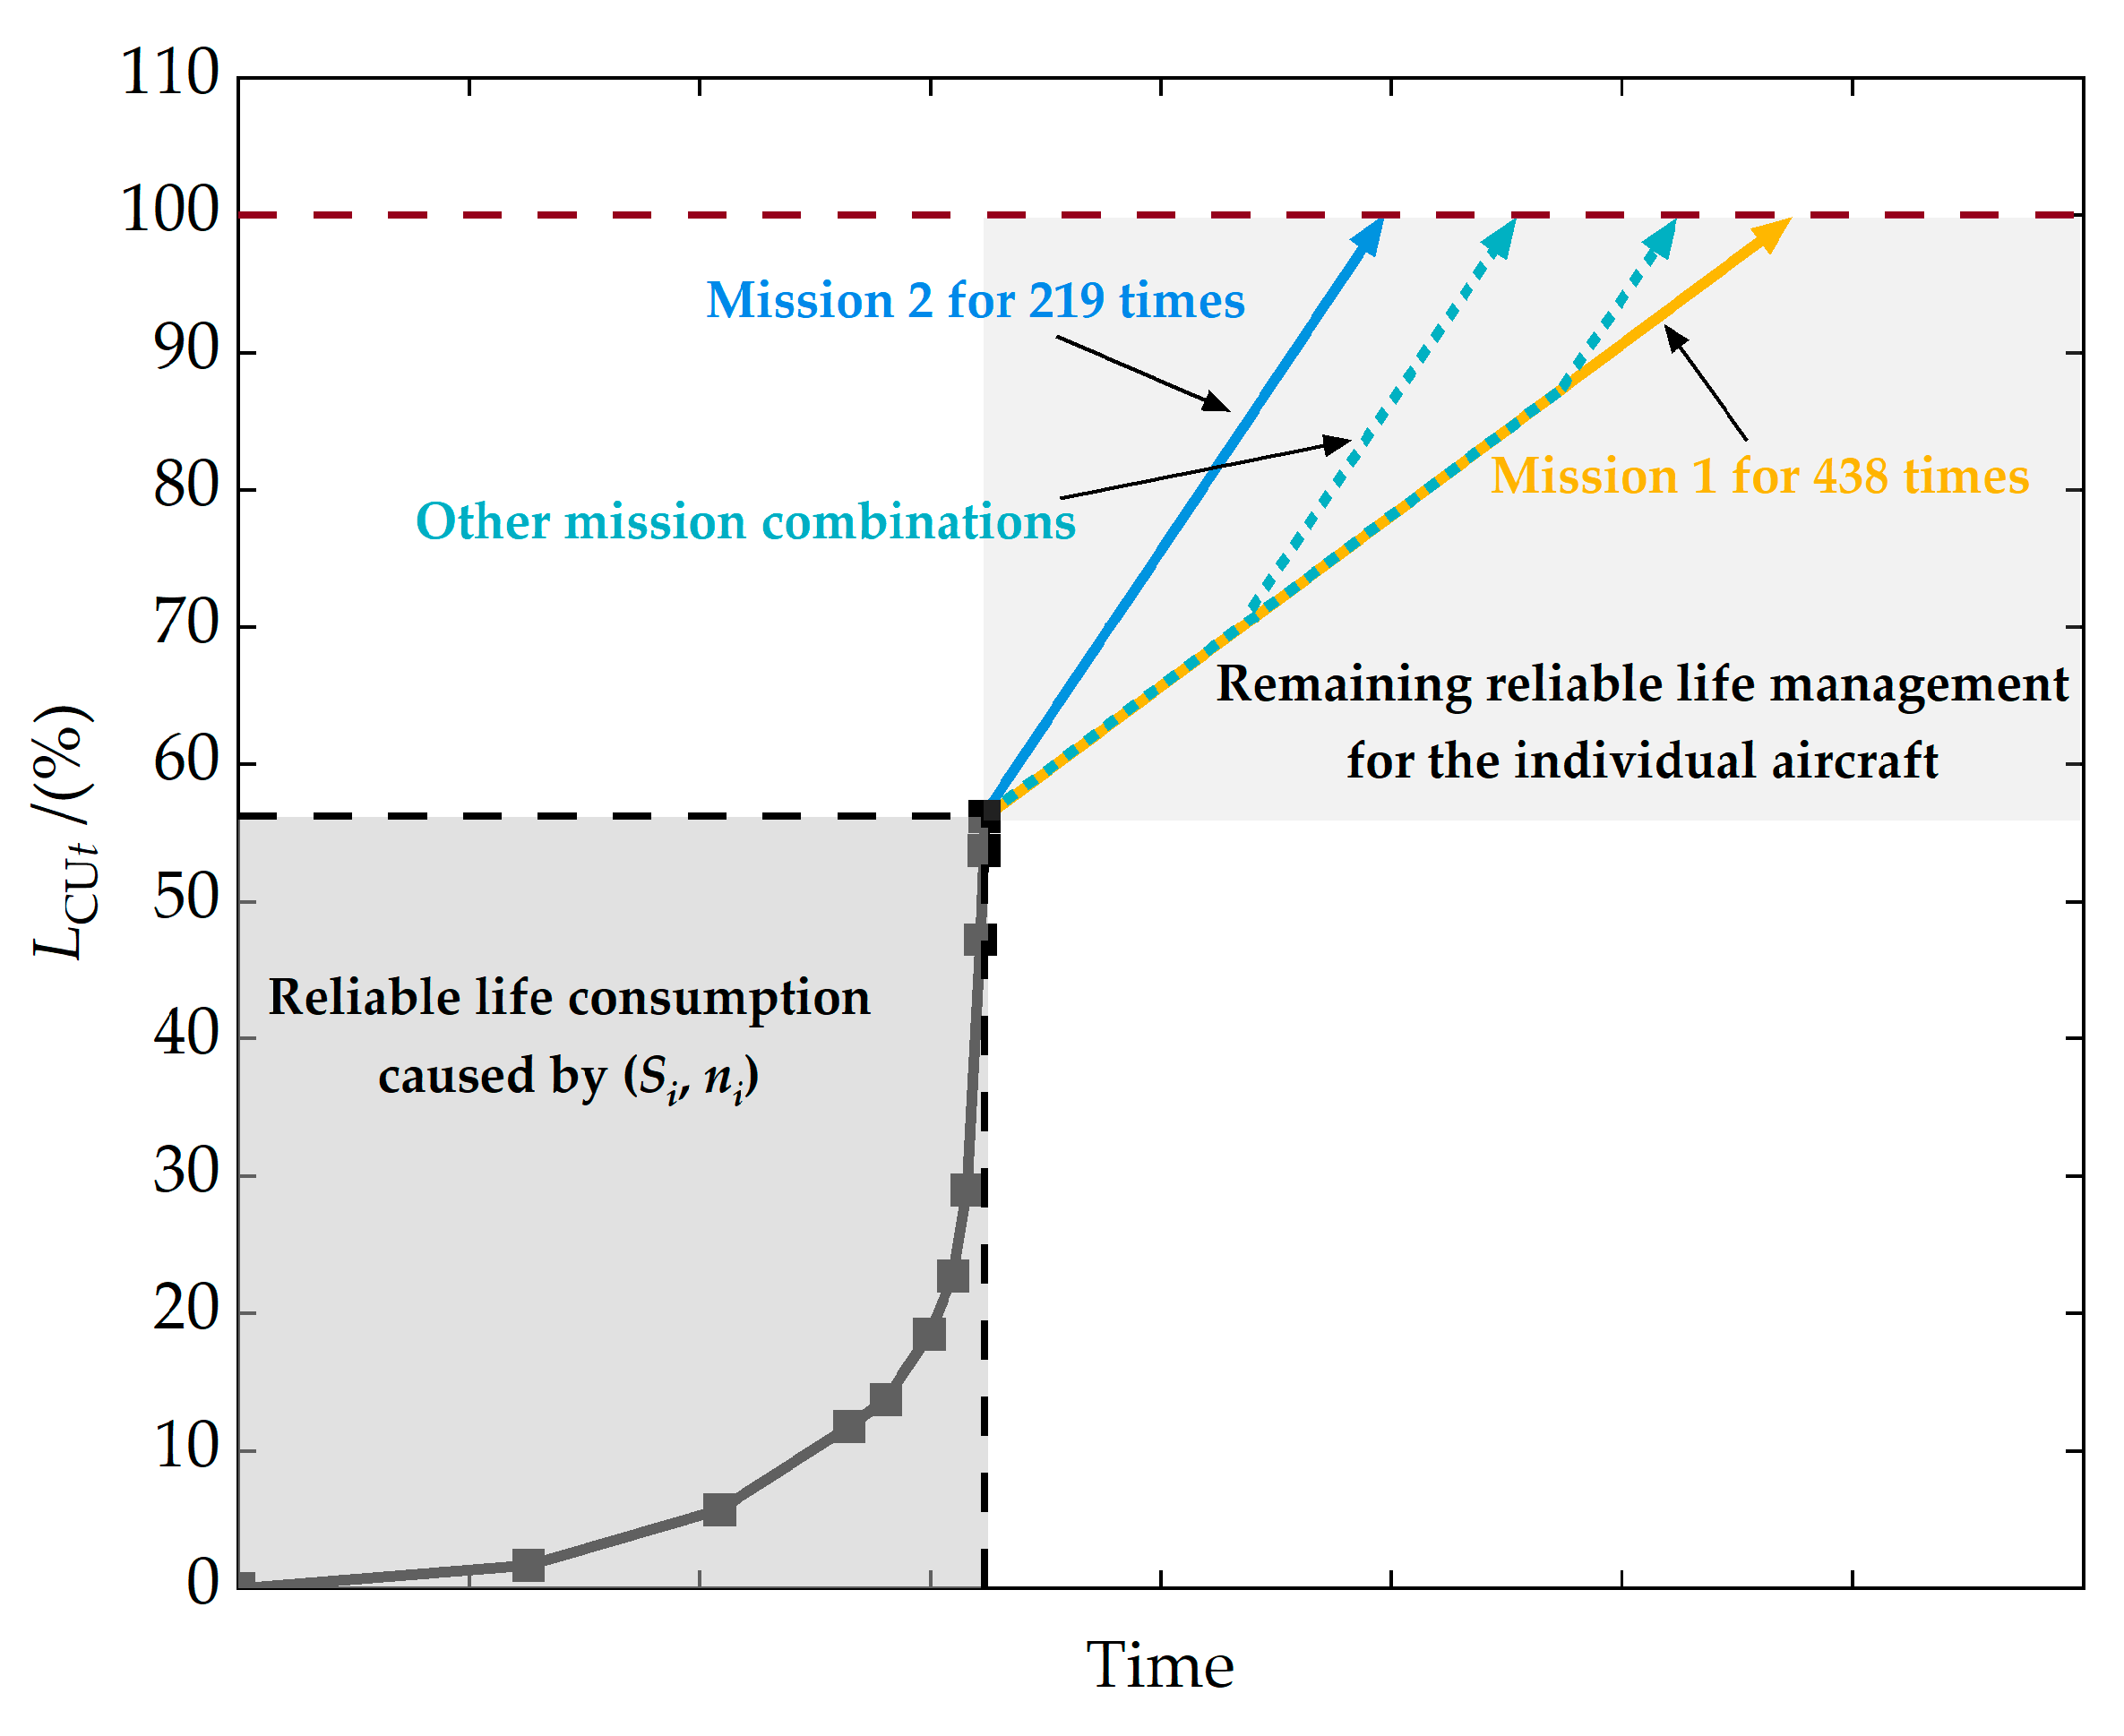
Table 1.
Comparison of individual aircraft monitoring and aircraft fleet management.
| Individual Aircraft Monitoring | Aircraft Fleet Management | |
|---|---|---|
| Load | Service load of individual aircraft | Typical load or load spectrum of the aircraft fleet |
| Reliability | Lack of consideration | High reliability (e.g., 0.999) and high confidence (e.g., 0.9) |
| Restrictions | Damage less than the threshold | Service time is less than the determined reliable life |
Table 2.
Test load block spectrum of the central wing joint panel (stress ratio r = 0).
| i | /(MPa) | /(Cycles) | i | /(MPa) | /(Cycles) |
|---|---|---|---|---|---|
| 1 | 650 | 0.16 | 6 | 282 | 5.55 |
| 2 | 585 | 0.62 | 7 | 249 | 4.22 |
| 3 | 518 | 1.57 | 8 | 215 | 14.72 |
| 4 | 453 | 2.37 | 9 | 175 | 30.67 |
| 5 | 348 | 3.02 | 10 | 132 | 37.10 |
Table 3.
The estimated reliable life under each fatigue load in the test spectrum.
| i | /(MPa) | Lower Confidence Limit of Reliable Life /(Cycles) | Point Estimate of Median Life /(Cycles) |
|---|---|---|---|
| 1 | 650 | 2.06 × 10⁴ | 5.35 × 10⁴ |
| 2 | 585 | 3.11 × 10⁴ | 8.07 × 10⁴ |
| 3 | 518 | 4.99 × 10⁴ | 1.29 × 10⁵ |
| 4 | 453 | 8.41 × 10⁴ | 2.18 × 10⁵ |
| 5 | 348 | 2.34 × 10⁵ | 6.04 × 10⁵ |
| 6 | 282 | 5.31 × 10⁵ | 1.38 × 10⁶ |
| 7 | 249 | 8.62 × 10⁵ | 2.22 × 10⁶ |
| 8 | 215 | 1.53 × 10⁶ | 3.93 × 10⁶ |
| 9 | 175 | 3.40 × 10⁶ | 8.83 × 10⁶ |
| 10 | 132 | 1.02 × 10⁷ | 2.65 × 10⁷ |
Table 5.
Average service load history of an individual central wing joint panel during one flight hour (stress ratio r = 0).
Table 5.
Average service load history of an individual central wing joint panel during one flight hour (stress ratio r = 0).
| i | /(MPa) | /(Cycles) | Lower Confidence Limit of Reliable Life /(Cycles) |
|---|---|---|---|
| 1 | 589 | 0.15 | 3.03 × 10⁴ |
| 2 | 531 | 0.58 | 4.53 × 10⁴ |
| 3 | 502 | 2.01 | 5.64 × 10⁴ |
| 4 | 376 | 2.13 | 1.74 × 10⁵ |
| 5 | 297 | 3.59 | 4.34 × 10⁵ |
| 6 | 261 | 6.65 | 7.18 × 10⁵ |
| 7 | 217 | 5.58 | 1.47 × 10⁶ |
| 8 | 210 | 19.82 | 1.67 × 10⁶ |
| 9 | 171 | 29.34 | 3.72 × 10⁶ |
| 10 | 123 | 44.29 | 1.34 × 10⁷ |
Table 6.
Comparison of aircraft fleet management and individual aircraft life monitoring under service load in Table 5.
Table 6.
Comparison of aircraft fleet management and individual aircraft life monitoring under service load in Table 5.
| Aircraft fleet management method | Proposed individual aircraft monitoring method |
| 70.6% of reliable life has been consumed | 56.2% of reliable life has been consumed |
Table 8.
Comparison of aircraft fleet management and individual aircraft life monitoring under service load in Table 7.
Table 8.
Comparison of aircraft fleet management and individual aircraft life monitoring under service load in Table 7.
| Aircraft fleet management method | Proposed individual aircraft monitoring method |
| 70.6% of reliable life has been consumed | 92.5% of reliable life has been consumed |
Disclaimer/Publisher’s Note: The statements, opinions and data contained in all publications are solely those of the individual author(s) and contributor(s) and not of MDPI and/or the editor(s). MDPI and/or the editor(s) disclaim responsibility for any injury to people or property resulting from any ideas, methods, instructions or products referred to in the content. |
© 2023 by the authors. Licensee MDPI, Basel, Switzerland. This article is an open access article distributed under the terms and conditions of the Creative Commons Attribution (CC BY) license (https://creativecommons.org/licenses/by/4.0/).
Share and Cite
MDPI and ACS Style
Fu, Y.; Fu, H. A Novel Individual Aircraft Life Monitoring Method Based on Reliable Life Consumption Assessment. Machines 2023, 11, 1016. https://doi.org/10.3390/machines11111016
AMA Style
Fu Y, Fu H. A Novel Individual Aircraft Life Monitoring Method Based on Reliable Life Consumption Assessment. Machines. 2023; 11(11):1016. https://doi.org/10.3390/machines11111016
Chicago/Turabian StyleFu, Yueshuai, and Huimin Fu. 2023. "A Novel Individual Aircraft Life Monitoring Method Based on Reliable Life Consumption Assessment" Machines 11, no. 11: 1016. https://doi.org/10.3390/machines11111016
Note that from the first issue of 2016, this journal uses article numbers instead of page numbers. See further details here.