
Combined Thermal and Wear Analysis of Linear Rolling Guide Subjected to Rigid–Flexible Coupling Motion Stage
1
State Key Laboratory of Precision Electronic Manufacturing Technology and Equipment, Guangdong University of Technology, Guangzhou 510006, China
2
School of Electromechanical Engineering, Guangdong University of Technology, Guangzhou 510006, China
3
Foshan HUADAO Ultra Precision Co., Ltd., Foshan 528225, China
*
Author to whom correspondence should be addressed.
†
These authors contributed equally to this work.
Machines 2023, 11(3), 358; https://doi.org/10.3390/machines11030358
Submission received: 10 January 2023
/
Revised: 2 March 2023
/
Accepted: 5 March 2023
/
Published: 6 March 2023
(This article belongs to the Section Friction and Tribology)
Abstract
:The local heat and wear generated due to friction in a precision motion stage in electronic packaging equipment have a significant impact on its positioning precision. In this paper, we studied the temperature changes over time and the wear of a linear rolling guide (LRG) in a rigid–flexible coupling motion stage (RFCMS), both analytically and experimentally, and we proposed an evaluation method for LRG wear in an RFCMS. According to Fourier’s law and the law of conservation of energy, the differential equation of heat conduction for the LRG and the thermal boundary conditions were established. Steady-state and transient thermal simulations were carried out using ANSYS Workbench to predict the temperature increase in the LRG due to friction. Finally, a test apparatus was built to demonstrate that an RFCMS reduced the operating temperature of the LRG, which also reduced the wear on the contact surface. Through response surface methodology, the levels of the influence of different flexure hinge thicknesses, strokes, velocities, and accelerations on the temperature change rate (TCR) of the LRG were obtained, as well as the approximate regression equation of four variables of the TCR. This provided a new research method for precision maintenance, life design, and operational parameter selection for high-precision motion stages.
1. Introduction
Precision motion systems are important components of electronic manufacturing equipment, and advances in high-precision positioning technology are being actively developed to increase velocity, acceleration, and accuracy [1,2]. As such, the linear rolling guide (LRG) plays a guiding and supportive role for positioning precision and maintenance [3,4,5]. Hu et al. [6] summarized the technical state-of-the-art and research findings on the motion errors of a linear guide pair and suggested that the linear motion errors in the motion stage were closely related to the straightness errors from the specific guide pair, and that the straightness and the parallelism of the LRG were measurement indicators of the motion precision achieved in the motion stage. Dong et al. [7] studied the nonlinear pre-motion friction of the LRG and suggested that friction was an important factor affecting precision and velocity in point-to-point positioning applications. The frequent start-and-stop of the motion positioning system increased the wear of the LRG and caused changes in translation and contact angles, thus affecting the guiding precision of the LRG and even the service life of the motion stage [8,9]. Furthermore, the rising temperatures of key components, such as the LRG in a motion positioning system, had a significant influence as well. Its thermal behavior significantly affects the contact stiffness and position accuracy, which worsens the performance of the system [10,11]. In an LRG, heat is generated due to the friction between the ball and the raceway, which could cause local temperature increases and contact load changes [12], and it has also led to mechanical failures due to wear and overheating.
The existing research regarding thermal analysis has mostly focused on sliding guideways, hydrostatic guideways, etc. The thermal analysis of commonly used LRGs in the precision motion stage has been mostly via simulations and relatively rare. In recent years, many scholars have conducted thermal analyses on guideways in terms of types, boundary conditions, heat sources, etc. Chen et al. [13] studied the influence of vibrations caused by thermal deformation on the positioning precision of a system with an aerostatic guideway as the object. Lee et al. [14] investigated the influence of thermal deformation caused by friction on the contact characteristics of the guideway. Ji et al. [15] studied the Z-axis feed system of a large CNC grinding machine to understand the influence of thermal deformation on the precision of the guideway. They calculated the thermal boundary conditions by considering the thermal contact resistance at the joints and carried out a heat-source and heat dissipation analysis and obtained simulation results of the thermal error using a finite element model (FEM).
In addition, friction will cause thermal deformation or wear, which affects the accuracy of the system. Some scholars have focused on the influence of friction on the precision of LRGs by establishing friction models [8,16,17,18,19]. Cheng analyzed the contact parameters of the contact surface through the micro–macro contact analysis method and established a friction model in combination with the local friction analysis. These provided a theoretical basis for reducing the wear of the LRG and improving its mechanical efficiency. Oh et al. studied a pre-loaded LRG and predicted the heating rate and thermal deformation of the LRG by establishing its displayed friction model as the boundary condition, and the accuracy of prediction was verified at over 90% through their experiments. Yun et al. studied the influence of thermal expansion on the position error of the feed drive system. They found that when the maximum temperature increase was of about 3.4 °C, the thermal deformation caused by friction heat resulted in the straightness errors with the range of 6–8 μm [20]. In summary, the operating temperature of LRGs plays a key role in overall performance. Reducing the temperature increase in LRGs in the high-velocity precision motion stage is necessary for maintaining the guidance and the positioning precision of the motion stage.
However, there remains a gap in the research concerning the thermal analysis of LRGs. In this paper, the thermal behavior and wear of LRGs in a high-precision rigid–flexible coupling motion stage (RFCMS) [21,22] were studied. The object of study was an LRG with four-way equal load. The heat conduction differential equations and thermal boundary conditions of the LRG were established, and steady-state and transient thermal simulations were carried out. An experiment concerning the LRG operating temperature was conducted for an RFCMS under different parameters. Finally, the significance of different parameters on the thermal response of the LRG was analyzed using the response surface methodology, which provided a new research direction for the precision maintenance, service-life design, and the selection of working parameters for high-precision motion stages.
The rest of this paper is organized as follows. Section 2 is the theoretical analysis. First, we introduce the structure and operational principles of an RFCMS. Next, the thermal boundary conditions were obtained by analyzing the frictional heat generation of an LRG. Finally, the wear prediction model of the LRG was established according to the Archard theory. Section 3 details the thermal simulation of an LRG and the wear of an LRG in an RFCMS. Section 4 describes the experiment. The prototype of an RFCMS was constructed to test the temperature increase in an LRG to determine the effectiveness of an RFCMS in reducing the wear of the LRG. Furthermore, we tested the operating temperature of an LRG under different flexure hinge thicknesses and motion parameters of an RFCMS. We used the response surface methodology to determine the optimal conditions for the minimum LRG wear. Finally, we summarize this paper in Section 5.
2. Theoretical Analysis
2.1. RFCMS Model
An RFCMS model diagram and its dynamic model were studied as shown in Figure 1. The structure of an RFCMS includes a rigid frame, a working stage, flexure hinges, and an LRG. The rigid frame was connected to the LRG, the working stage was an actual positioning component, and the flexure hinge was the equivalent of a spring and damping, so the RFCMS was equivalent to a double-mass-spring damping system. As shown in Figure 1b, the driving force is denoted by FD, which affected the working stage, and f denotes the friction force caused by the LRG. The variables m and m are the mass of the rigid frame and the working stage, respectively, and x and x are the displacements of the rigid frame and the working stage, respectively, while K and C are the stiffness and damping of the flexure hinge, respectively. The LRG is shown in Figure 2, including the balls, rail, and slide carriage.
The operation mode of an RFCMS was described as follows:
- When the driving force was less than the maximum static friction force (f), the rigid frame was static due to the friction dead-zone, and the flexure hinge utilized the elastic deformation of the material to introduce the displacement from the driving force. In the positioning phase, only the working stage was used for the micro/nano-displacement to achieve precision positioning.
- When the driving force was greater than the maximum static friction force (f), the driving working stage affected the flexure hinge, utilizing the elastic deformation of the material to initiate displacement, and the rigid frame overcame the friction dead-zone and achieved long stroke displacement. In the positioning phase, the rigid frame halted due to friction, the flexure hinge continued to deform, and the working stage completed the final positioning.
The stiffness K [23] of the flexure hinge was expressed, as follows:
where E is the Young’s modulus of the material, and w, y, and l are the width, thickness, and length of the flexure hinge, respectively.
According to Hooke’s law, the deflection of the flexure hinge under the f was calculated by the following:
where n is the number of flexure hinges, f = (F + mtg), is the static friction coefficient of the LRG, F is the initial pre-load of the LRG, and m is the total mass of the RFCMS. In this paper, n = 4, = 0.03, and m = 0.27 kg.
According to the analysis of the operational principle and the dynamic model of the RFCMS, the RFCMS could compensate for the friction dead-zone of the LRG by utilizing the elastic deformation of the flexure hinge to eliminate the influence of the friction dead-zone on the positioning precision of the motion stage. According to the above principles, the reliability of an LRG in an RFCMS was studied by thermal analysis and wear prediction of the LRG.
2.2. Frictional Heat Generation Model
Due to the fact that the LRG research rig established in this paper was less affected by the heat generated by a motor in a real-world scenario, the heat was not considered. The heat generated inside the LRG was mainly caused by the friction between the ball and the raceway, and frictional heat is one of the main heat sources in an LRG system. The geometric dimensions of an LRG change due to the temperature increase caused by the friction, which then affects the precision [10,24,25]. In this paper, a mathematical model of the heat conduction of an LRG was established to solve the heat transfer and the temperature distribution of the frictional heat in an LRG.
2.2.1. Basic Modes and Laws of Heat Transfer
The transfer mode was divided into heat conduction, convection heat transfer, and heat radiation. Due to the fact that heat radiation has little effect on the temperature of an LRG, the first two modes of heat transfer were considered.
The heat conduction law of an LRG was described according to Fourier’s law of heat conduction, which was expressed as follows:
where is the thermal conductivity.
The heat flow in an LRG was transferred to the air by convection heat transfer. The heat flow density of convection heat transfer could be calculated according to Newton’s cooling formula:
where h is the convection heat transfer coefficient, t is the surface temperature of the LRG, and t is the ambient temperature.
Due to the fact that q = q, the differential equation of convection heat transfer was obtained as follows:
2.2.2. Heat Conduction Differential Equation of Temperature Field
In order to describe the internal temperature field of the LRG, the differential equation of heat conduction of the LRG in a rectangular coordinate system was obtained according to Fourier’s law and the energy conservation equation, as follows:
This was then abbreviated as follows:
where is the density of the material, c is the specific heat capacity of the material, and is the internal heat source intensity of the LRG.
2.2.3. Thermal Boundary Conditions of LRG
In order to study the heat characteristics of the LRG, it was necessary to calculate the heat generated by the friction of the LRG, which was calculated as follows:
where is the dynamic friction coefficient, F is the load applied on the slide carriage, v is the velocity of the slide carriage, and J is the thermal equivalent. In this paper, = 0.02, F = F + mtg, v = 0.5 m/s, and J = 4.184 J/cal.
Then, we applied the heat generated inside to the volume of the friction heating element (ball) to obtain the internal heat source intensity by the following:
where V is the total volume of the balls.
In addition, the horizontal and side surfaces of the LRG were in contact with the air for the heat flow exchange, which was the main form of heat dissipation of the LRG. The differential equation of convection heat transfer in Equation (5) was changed into dimensionless. The equation for the convection heat transfer coefficient was obtained according to Nusselt criterion, as follows:
where Nu is the Nusselt number and L is the feature size. In this paper, L = 0.015 m.
For the slide carriage in motion, the convection between its horizontal and side surfaces, and the surrounding air was regarded as a Blasius laminar flow of a flowing medium passing through a flat plate in parallel, and its Nusselt number was obtained as follows:
where Re is the Reynolds number, Re = L/, Pr is the Prandtl number, Pr = c/, is the air velocity, and and are the air kinematic viscosity and dynamic viscosity, respectively. In this paper, = 0.3 m/s, = 15.5 × 10 m/s, and = 18.4 × 10 N·s/m.
2.3. Wear Prediction Model of LRG
Predominantly, the wear of the LRG was caused by the ball sliding over the raceway contact surface, which also reduced the precision of the LRG. The Archard wear theory [27] has been widely used for the wear prediction of a rolling contact and could obtain a highly precise solution. The theoretical model of the Archard adhesion wear is shown in Figure 3. The first contact between two rough surfaces during the sliding process was located between high peaks. If the two rough surfaces were subjected to largely constant stress, the contact peaks would produce plastic deformations [28]. According to the Archard wear theory, the wear prediction model of the LRG was established, which guided the process for reducing the wear of the LRG.
Regarding the precision maintenance of the LRG, the wear was analyzed under normal contact force. According to the general formula of Archard’s adhesive wear theory, the wear volume of two contact surfaces was expressed as follows:
where K is the adhesive wear coefficient, which was related to the contact material and working conditions. According to the table of metal–metal wear coefficients published by Rabinowicz in 1980 [29], K is 4 × 10, F is the normal contact force of the ball [30], L is the sliding distance, and H is the Brinell hardness of the softer material in the contact body, which is 523 HBS.
For RFCMS, the driving force was applied to the working stage. Since the flexure hinge had an elastic deformation, the sliding distance of its slide carriage was expressed as follows:
The velocity of the working stage was expressed as follows:
The acceleration of the working stage was expressed as
According to Equations (2), (13), and (14), the wear prediction model of the LRG in an RFCMS was calculated as follows:
Due to the fact that the flexure hinge isolated the influence of the friction dead-zone of the LRG on the working stage, the actual sliding distance of the slide carriage was less than the displacement of the working stage. As the thickness of the flexure hinge decreased, the deformation increased, and the sliding distance of the slide carriage decreased. Consequently, according to Equation (17), the RFCMS could reduce the wear of the LRG. According to Equations (14)–(16), the velocity and acceleration also influenced the wear of the LRG; however, the effects of different strokes, velocities, and accelerations required further study.
3. Simulations
The adopted LRG was the SHS 15V from the THK Company. The parameters of this guideway are shown in Table 1, according to the product information. Table 2 shows the material parameters of the LRG and the motion stage.
3.1. Steady-State and Transient Thermal Analysis
In order to obtain the temperature field of the LRG, a thermal analysis was carried out in ANSYS Workbench. The heat source intensity and convection heat transfer coefficient, calculated according to Equations (8)–(12), were used as thermal boundary conditions. The heat source intensity was calculated as 5.6 × 10 W/m by Equations (8) and (9). The convection heat transfer coefficient of each structural surface of the slide carriage was obtained by Equations (10)–(12), wherein the convection heat transfer coefficient of the horizontal and side surfaces of the slide carriage was calculated as 8.82 W/(m·K), and the convection coefficient of the front surface was 22.45 W/(m·K).
The FEM of the thermal analysis was established at an ambient temperature of 25 °C. In the simulation, an accurate model of the LRG, including the balls, was established, and the geometric modeling and analysis of the LRG with four-way equal load were performed. Firstly, the geometric model was simplified to ensure the calculation accuracy. Only the slide carriage, the rail, and the balls were included in the simulation, and the holes and the fillets were removed. The material parameters of the LRG are shown in Table 2. The contact state of the balls and the raceway was set as frictional, and the friction coefficient was 0.2. Then, a hexahedron mesh was used to divide the model. A total of 130,968 nodes and 64,276 elements were generated. The obtained boundary conditions were substituted into the FEM. The steady-state and transient thermal analysis contour are shown in Figure 4. The steady-state temperature was 29.038 °C, and the maximum temperature increase was 4.038 °C. The temperature change curve over time is shown in Figure 5. As shown in Figure 4 and Figure 5, the LRG reached a thermal equilibrium state within 5 h, and the temperature increased rapidly within the first 1.5 h. Therefore, to avoid the thermal errors caused by temperature increases, it was necessary to pre-heat the LRG before work.
3.2. Verification of Wear Prediction Model
In addition, to examine the wear of the LRG in a high-precision RFCMS, the traditional rigid motion stage (RMS) was used for wear comparison simulation in this study. The working stage in the RMS was directly fixed with the slide carriage of the LRG. The stroke of the working stage in the RMS was consistent with the sliding distance of the slide carriage, and the mass of the RMS was equal to that of the RFCMS.
Figure 6 shows the 3D models and the FEM of the two types of stages. The material parameters of the stages are shown in Table 2. The contact state of the LRG was the same as that in the thermal simulation. The models were divided into hexahedral meshes. The RMS model generated a total of 190,071 nodes and 77,716 elements. The flexure hinge of the RFCMS model used the sweep method to generate the solid-shell elements, and the rest of the objects were hexahedral solid meshes, generating a total of 199,068 nodes and 83,764 elements. In the simulation, the rail bottom was fixed, and the slide carriage moved in translation relative to the rail. The wear of the LRG was simulated at the maximum static friction as well as the running velocity and stroke of the working stage, which were 0.5 m/s and 0.075 m, respectively. As ANSYS Workbench could not directly simulate the motion process, it was necessary to simulate the displacement of the two types of stages under the maximum static friction. For the RMS, the working stage was directly related to the slide carriage, so the stroke of the slide carriage applied in the RMS was 0.075 m. However, for the RFCMS, the working stage was indirectly related to the slide carriage through the flexure hinge, and the deflection of the flexure hinge under the maximum static friction was , according to Equation (2). Therefore, the stroke of the slide carriage applied to the RFCMS was (0.075−) m. In the results of the wear simulation, shown in Figure 7, the wear volume of the RFCMS was small per unit of time at only 58.93% of the RMS.
4. Experiment
4.1. Description of Apparatus
To investigate the thermal behavior of the LRG in an RFCMS, a comparison test rig had to be designed and constructed. As shown in Figure 8, the test rig included an LRG, a drive unit, a link span, a timing unit, a type-K thermocouple sensor (Hti: HT9815, accuracy: ±0.1 °C), an RMS, and an RFCMS. In order to avoid the manufacturing errors from different rails, the two types of stages were assembled on the same rail. The thermocouple sensor had four temperature-sensing interfaces, T, T, T, and T. Sensors T and T were mounted on the side of the slide carriage of the LRG in the RMS, and T and T were mounted on the side of the slide carriage of the LRG in the RFCMS, and both were used to monitor the operating temperature of the LRGs in real time. The stroke and velocity of the drive unit were adjusted by the driver (Akribis: ASD240-0309S1J1), and the two types of motion stages were driven simultaneously by the link span.
4.2. Comparative Experiment
In order to detect the wear of the LRG, wear tests were necessary, but the existing technology was unable to detect the wear surface in real time. At present, the detection of LRG wear has been based on changes in micro-morphology to determine wear [31], which requires expensive instruments and equipment. However, wear is accompanied by a temperature increase. Higher temperatures of a friction surface indicated that there were more contact points on the surface, the wear rate was higher, and the wear of the material was more severe [32]. The operating temperature of the LRG system played a key role in its overall performance. Therefore, the wear was qualitatively determined by measuring the temperature of the LRG in motion in this study. The test rig operated at a velocity of 0.5 m/s and an acceleration of 10 m/s for three different sets of strokes (0.075 m, 0.06 m, and 0.04 m). The thermocouple sensor was used to report the temperature during operation. Since the LRG temperature increased rapidly within the first 1.5 h, the testing duration of each group was approximately 50 min to ensure that the temperature measurements and testing duration were sufficient, and the temperatures were recorded every 1 min by the thermocouple sensor. The temperature change curves of the LRG under different strokes at the same velocity and acceleration are shown in Figure 9. To compare the differences in the temperature curves between the RMS and the RFCMS, the value of the curve was determined by subtracting the initial temperature from the current temperature. To eliminate any measurement errors from the thermocouple sensor temperature-sensing interface, an average of the two interfaces was used as the temperature increase for the current stage.
Furthermore, the temperature change rate (TCR) was introduced to represent the temperature change of the LRG. The operating TCR of the LRG was calculated as follows:
where the unit of is °C/min, t is the initial temperature, t is the end temperature at the end of the test, u is the initial time, and u is the end time of the test.
As shown in Figure 9, the TCR of the RMS was higher than that of the RFCMS. Experiments proved that under the same conditions, the contact points on the contact surface of the LRG in the RFCMS were fewer than in the RMS, and the elastic deformation of the flexure hinge could be used to compensate for the friction dead-zone. Therefore, the RFCMS could effectively reduce the operating temperature of the LRG, and the wear of the LRG was also lesser, as compared to the results in the RMS.
4.3. Response Surface Methodology
To further explore the influence of the thickness of the flexure hinge, the running stroke, and the velocity and acceleration of the motion stage on the operating TCR of the LRG in the RFCMS, a response surface methodology test was conducted with four variables and three levels in order to minimize the TCR of the LRG [23].
For applications with high velocity and high acceleration, the parameters of the short-stroke precision motion stages are typically the following: a stroke of 0.05 m, a velocity of 0.5 m/s, and an acceleration of 30 m/s. According to the experimental design principle of Box–Behnken, the operating TCR of the LRG was used as the response value for the optimized key parameters selected for the precision motion stage. The design of the response surface analysis is shown in Table 3. A total of 27 sets of tests were conducted, and the results are shown in Table 4. The optimal parameters are obtained through Design-Expert 12.0.
The approximate regression equation (ARE) between the TCR and the influencing factors was obtained through the secondary response regression analysis of the results in Table 4, which was expressed as follows:
where the thickness variable is denoted as A, the stroke variable is denoted as B, the velocity variable is denoted as C, and the acceleration variable is denoted as D.
According to Equation (19), its multi-correlation coefficient (R = 0.97) was close to 1, indicating that the ARE was sufficiently accurate.
The analysis of variance (ANOVA) in Table 5 shows that the model’s results were rather significant, indicating that the ARE was well fitted. The p-values showed that the primary terms A, C, as well as D and the secondary term C all had a significant effect on . The primary term B and the interaction term AC had a less significant effect on . The secondary terms A, B, and D as well as the interaction terms AB, AD, BC, BD, and CD all had an insignificant effect on . From the F-values, the order of influence of the variables on was, from strongest to weakest: velocity (C) > acceleration (D) > thickness (A) > stroke (B). Moreover, the lack of fit was 0.088, which had no significant effect on , indicating that the proportion of the abnormal errors in the actual fitting was small and that the regression model was accurate for determining the optimal working parameters for the precision motion stage.
As shown in Figure 10, the interaction effects of the flexure hinge thickness, the stroke, the velocity, and the acceleration on the TCR of the LRG were obtained using Design-Expert.
According to the response surface results in Figure 10a, the response surface curve of variable A was steeper than that of variable B, indicating that variable A had a more significant effect on than variable B. The other variables were analyzed in this method and the order of significance of each variable was: velocity > acceleration > thickness > stroke, which was consistent with the results of the ANOVA in Table 5.
In order to minimize the TCR of the LRG, the TCR was optimized by Design-Expert, where
Objective function: Min
Design variables: A, B, C, D
Constraint conditions: 0.0001 m ≤ A ≤ 0.0005 m, 0.04 m ≤ B ≤ 0.06 m, 0.4 m/s ≤ C ≤ 0.6 m/s, 20 m/s ≤ D ≤ 40 m/s.
The key parameters for the motion stage were selected after optimization, which were a flexible hinge thickness of 0.0001 m, a stroke of 0.04 m, a velocity of 0.4 m/s, and an acceleration of 20 m/s. According to ARE, the TCR is 0.023 °C/min.
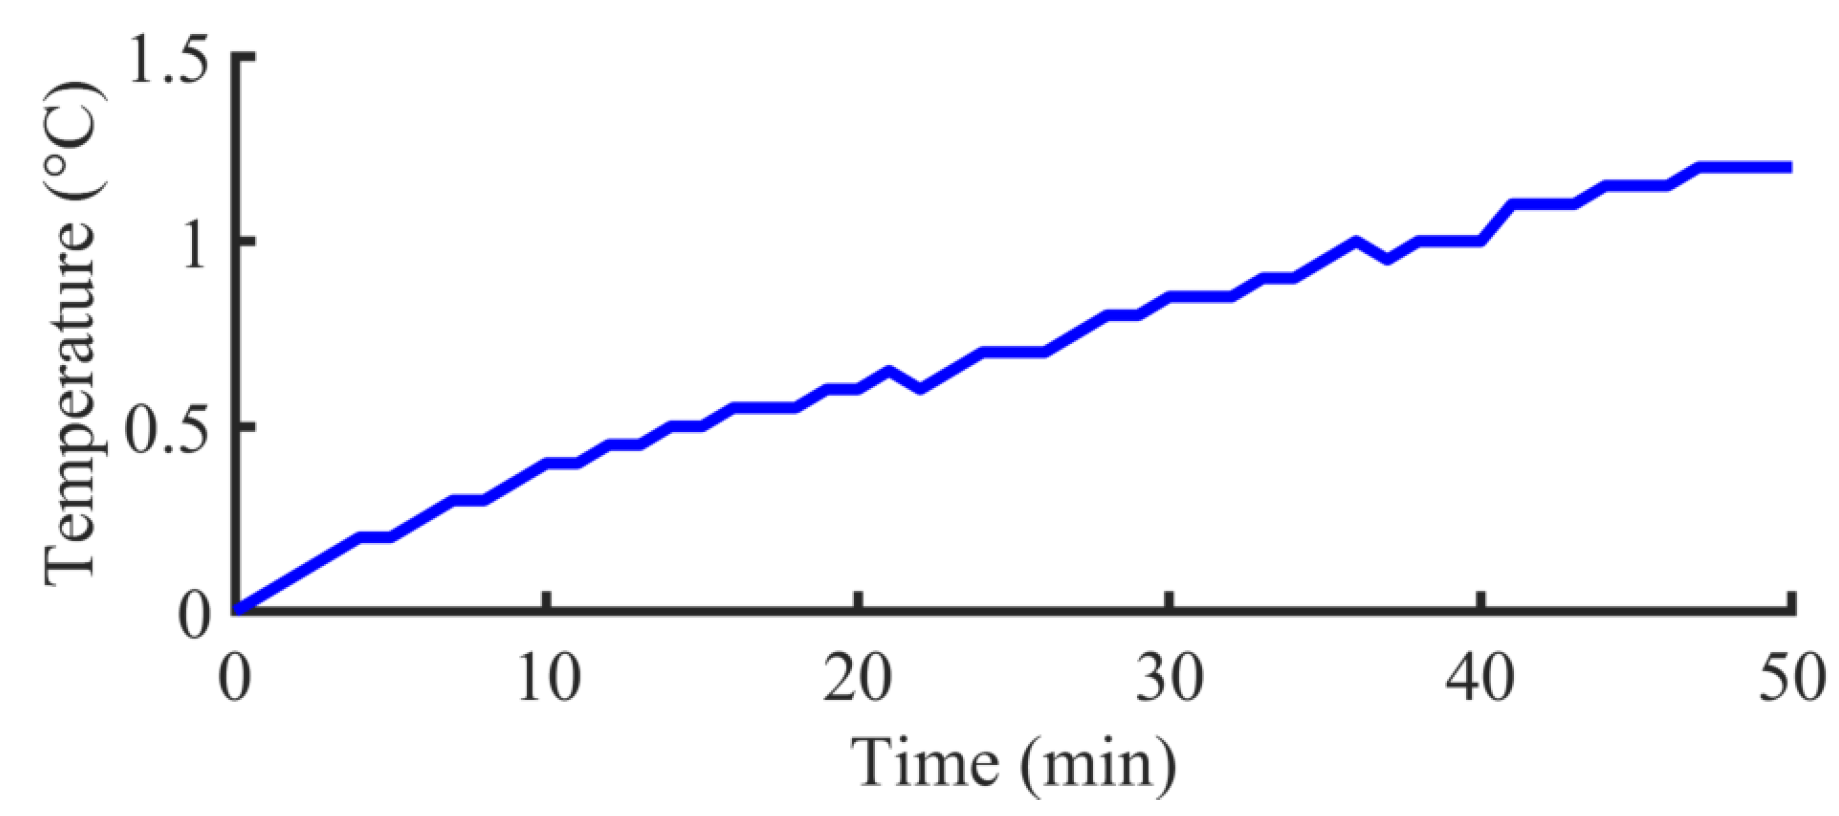
An experiment was performed using the optimized results, and the temperature increase curve is shown in Figure 11. The temperature increased by 1.2 °C with a test duration of 50 min, and the calculated TCR was 0.024 °C/min. As compared to the optimization result (0.023 °C/min), the relative error was 4.35%, which was within an acceptable range. In part, the error had been caused by the slight difference in the temperature of the experimental environment. Therefore, the optimization method was accurate.
5. Conclusions
As an important part of the motion positioning system, an LRG plays a guiding and supportive role. Reducing the temperature increase in an LRG in the high-speed and precision motion stage is critical to maintain the guidance precision of the LRG and the positioning precision of the motion stage. In this work, the thermal behavior and wear of the LRG in an RFCMS were studied. Some valuable conclusions can be summarized as follows:
- (1)
- The differential equation of heat conduction and the thermal boundary conditions of the LRG were developed, and the temperature increase in the LRG due to friction was predicted through steady-state and transient thermal simulations. The LRG reaches a thermal equilibrium state within 5 h, during which the temperature increased rapidly within in the first 1.5 h. Therefore, to avoid the thermal errors caused by increasing temperatures, it was necessary to pre-heat the LRG before its operation.
- (2)
- The wear between the RFCMS and RMS simulation was compared. The wear volume of the RFCMS was small per unit of time at only 58.93% of that found in the RMS. This provided a simulated basis for the reduction in the LRG wear via an RFCMS.
- (3)
- An evaluation method for LRG wear in an RFCMS was proposed. By comparing the temperature increases in friction heat between an RFCMS and an RMS, while under the same motion condition, it was concluded that the TCR of the RMS was higher than in an RFCMS, which verified that the elastic deformation of the flexible hinge of the RFCMS reduced the wear of the LRG. Therefore, an RFCMS could reduce the operating temperature of the LRG and, therefore, reduce the wear on the contact surfaces.
- (4)
- Based on the response surface methodology, the influences of different flexure hinge thicknesses, strokes, velocities, and accelerations on the TCR of the LRG were obtained, and the ARE of the TCR was reported, which could predict the TCR of the LRG under different operating parameters. Through this experiment, the error between the optimized value and the experimental value was only 4.35%. This proved the accuracy of the optimization method.
This study provided a practical basis for the thermal analysis and wear research of LRGs as well as a new research method for the precision maintenance, the life design, and the selection of the working parameters for high-precision motion stages. As future work, we plan to expand our presented work to determine the relationship between the wear of an LRG and its operating temperature, so that the wear volume can be obtained by detecting the operating temperature of an LRG.
Author Contributions
Z.Y. provided thoughts; L.S. wrote and edited the manuscript; L.S. and C.Z. finished experiment, sampling, and data analysis. All authors have read and agreed to the published version of the manuscript.
Funding
The work is supported in part by a grant from National key R & D Program of China No.2022YFB4701001; in part by the National Natural Science Foundation of China (Grant No.51875108, No.51905107, No.U20A6004).
Institutional Review Board Statement
Not applicable.
Informed Consent Statement
Not applicable.
Data Availability Statement
Not applicable.
Conflicts of Interest
The authors declare no conflict of interest.
Abbreviations
The following abbreviations are used in this manuscript:
| LRG Linear rolling guide | |||
| RFCMS Rigid–flexible coupling motion stage | |||
| TCR Temperature change rate | |||
| FEM Finite element model | |||
| RMS Rigid motion stage | |||
| ARE Approximate regression equation | |||
| ANOVA Analysis of variance | |||
| Nomenclature | |||
| m | mass/kg | Dimensionless numbers | |
| x | displacement/m | Nu | Nusselt number |
| K | stiffness/N·m | Re | Reynolds number |
| C | damping/N·s·m | Pr | Prandtl number |
| E | Young’s modulus/GPa | Greek letters | |
| w | width/m | friction coefficient | |
| y | thickness/m | thermal conductivity/W·m·K | |
| l | length/m | density/kg·m | |
| deflection/m | internal heat source intensity/W·m | ||
| f | friction/N | air velocity/ m·s | |
| n | number of flexure hinges | air kinematic viscosity/m·s | |
| q | heat flux/W·m | air dynamic viscosity/N·s·m | |
| t | temperature/°C | contact angle/° | |
| h | heat transfer coefficient/W·m·K | temperature change rate/°C·min | |
| T | temperature field/°C | Subscripts | |
| c | specific heat capacity/J·kg·K | rf | rigid frame |
| Q | frictional heat generation/J·s | ws | work stage |
| F | load/N | t | total |
| v | velocity/m·s | e | surface |
| a | acceleration/m·s | ∞ | ambient |
| J | thermal equivalent/J·cal | s | static |
| V | volume/m | k | dynamic |
| L | feature size/m | wear | wear |
| K | adhesive wear coefficient | b | ball |
| L | sliding distance/m | r | raceway |
| H | Brinell hardness | 0 | initial |
| R | ball radius/m | 1 | end |
| O | form factor | i | normal |
| N | total number of balls | z | on slide carriage |
| u | time/min | D | motor |
| / | maximum/static friction | ||
References
- Lin, R.; Li, Y.; Zhang, Y.; Wang, T.; Wang, Z.; Song, Z.; Dou, Z.; Qian, J. Design of A flexure-based mixed-kinematic XY high-precision positioning platform with large range. Mech. Mach. Theory 2019, 142, 103609. [Google Scholar] [CrossRef]
- Zhang, L.; Gao, J.; Chen, X. A Rapid Dynamic Positioning Method for Settling Time Reduction Through a Macro–Micro Composite Stage With High Positioning Accuracy. IEEE Trans. Ind. Electron. 2018, 65, 4849–4860. [Google Scholar] [CrossRef]
- He, G.; Sun, G.; Zhang, H.; Huang, C.; Zhang, D. Hierarchical Error Model to Estimate Motion Error of Linear Motion Bearing Table. Int. J. Adv. Manuf. Technol. 2017, 93, 5–8. [Google Scholar] [CrossRef]
- Chen, C.; Wang, J.; Huang, G.; Hsu, M.; Chen, T. High-Precision Rapid Prototyping Technology for Manufacturing Linear Guides. Int. J. Adv. Manuf. Technol. 2017, 92, 9–12. [Google Scholar] [CrossRef]
- Li, X.; Li, Z.; Jin, S.; Zhang, J.; Ding, S.; Niu, Z. A Novel Error Equivalence Model on the Kinematic Error of the Linear Axis of High-End Machine Tool. Int. J. Adv. Manuf. Technol. 2022, 118, 7–8. [Google Scholar] [CrossRef]
- Hu, P.; Lei, Y.; Ou, Y. Analysis of Motion Errors of Linear Guide Pair Based on Parallel Mechanism. Machines 2021, 9, 33. [Google Scholar] [CrossRef]
- Dong, X.; Okwudire, C.E. An Experimental Investigation of the Effects of the Compliant Joint Method on Feedback Compensation of Pre-Sliding/Pre-Rolling Friction. Precis. Eng. 2018, 54, 81–90. [Google Scholar] [CrossRef]
- Wang, X.; Feng, H.; Zhou, H.; Zhou, C.; Chen, Z. Modeling of Friction Forces for Linear Motion Ball Guides Considering Variation of the Friction Parameter with Operating Condition. Tribol. Trans. 2022, 65, 592–609. [Google Scholar] [CrossRef]
- Tao, W.; Zhong, Y.; Feng, H.; Wang, Y. Model for Wear Prediction of Roller Linear Guides. Wear 2013, 305, 260–266. [Google Scholar] [CrossRef]
- Weng, L.; Gao, W.; Zhang, D.; Huang, T.; Liu, T.; Li, W.; Zheng, Y.; Shi, K.; Chang, W. Analytical Modelling Method for Thermal Balancing Design of Machine Tool Structural Components. Int. J. Mach. Tools Manuf. 2021, 164, 103715. [Google Scholar] [CrossRef]
- Wang, X.; Feng, H.; Zhou, C.; Ye, K. A Thermal Model for Real-Time Temperature Forecast of Rolling Linear Guide Considering Loading Working Conditions. Int. J. Adv. Manuf. Technol. 2020, 109, 2249–2271. [Google Scholar] [CrossRef]
- Zou, H.; Wang, B. Investigation of the Contact Stiffness Variation of Linear Rolling Guides Due to the Effects of Friction and Wear during Operation. Tribol. Int. 2015, 92, 472–484. [Google Scholar] [CrossRef]
- Chen, M.; Huang, W.; Chen, Y. Design of the aerostatic linear guideway with a passive disk-spring compensator for PCB drilling machine. Tribol. Int. 2010, 43, 395–403. [Google Scholar] [CrossRef]
- Lee, S.; Yoo, J.; Yang, M. Effect of Thermal Deformation on Machine Tool Slide Guide Motion. Tribol. Int. 2003, 36, 41–47. [Google Scholar] [CrossRef]
- Ji, J.; Hong, R.; Sun, F.; Huang, X. Thermal characteristic analysis of Z-axis guideway based on thermal contact resistance. Adv. Mech. Eng. 2018, 10, 168781401880532. [Google Scholar] [CrossRef] [Green Version]
- Tong, V.; Khim, G.; Hong, S. Effects of Carriage Flexibility on Friction Force in Linear Ball Guides. J. Tribol. 2021, 143, 121202. [Google Scholar] [CrossRef]
- Xu, S.; Cheng, D.; Zhang, S. Analysis of friction fluctuations mechanism of a preloaded roller linear motion guide based on a new 5-DOF dynamic stiffness model. Measurement 2022, 190, 110768. [Google Scholar] [CrossRef]
- Cheng, D.; Xu, F.; Xu, S.; Kim, S. Investigation of the Frictional Behavior in a Roller Linear Motion Guide under Mixed EHL. Tribol. Trans. 2020, 63, 528–542. [Google Scholar] [CrossRef]
- Oh, K.; Khim, G.; Park, C.; Chung, S. Explicit Modeling and Investigation of Friction Forces in Linear Motion Ball Guides. Tribol. Int. 2019, 129, 16–28. [Google Scholar] [CrossRef]
- Yun, W.S.; Kim, S.K.; Cho, D.W. Thermal error analysis for a CNC lathe feed drive system. Int. J. Mach. Tools Manuf. 1999, 39, 1087–1101. [Google Scholar] [CrossRef]
- Su, L.Y.; Huang, R.R.; Peng, H.; Yang, Z.J. Optimal Design for Parameters of Structure and Controller for Rigid-Flexible Coupling Motion Stage. In Proceedings of the 2020 IEEE 9th Data Driven Control and Learning Systems Conference (DDCLS), Liuzhou, China, 20–22 November 2020; pp. 1188–1192. [Google Scholar]
- Peng, H.; Yang, Z.; Xue, W.; Huang, R.; Huang, Y. The Design and Control of a Rigid-Flexible Coupling Positioning Stage for Enhanced Settling Performance. J. Dyn. Syst. Meas. Control 2021, 143, 111003. [Google Scholar] [CrossRef]
- Yang, Z.; Bai, Y.; Chen, X.; Wang, M.; Gao, J.; Yang, H. A New Design Method of Dynamic Characteristics Adjustable Micro Motion Stage Based on Tension Stiffening. J. Mech. Eng. 2015, 51, 153. (In Chinese) [Google Scholar] [CrossRef] [Green Version]
- Jang, S.; Khim, G.; Park, C. Estimation of friction heat in a linear motion bearing using Box–Behnken design. Int. J. Adv. Manuf. Technol. 2017, 89, 2021–2029. [Google Scholar] [CrossRef]
- Cheng, D.; Park, J.; Suh, J.; Kim, S.; Park, C. Effect of Frictional Heat Generation on the Temperature Distribution in Roller Linear Motion Rail Surface. J. Mech. Sci. Technol. 2017, 31, 1477–1487. [Google Scholar] [CrossRef]
- Chow, J.; Zhong, Z.; Lin, W.; Khoo, L. A Study of Thermal Deformation in the Carriage of a Permanent Magnet Direct Drive Linear Motor Stage. Appl. Therm. Eng. 2012, 48, 89–96. [Google Scholar] [CrossRef]
- Archard, J. Contact and Rubbing of Flat Surfaces. J. Appl. Phys. 1953, 24, 981–988. [Google Scholar] [CrossRef]
- Kragelski, N.B. Calculation Principle of Friction and Wear; China Machine Press: Beijing, China, 1982. [Google Scholar]
- Rabinowicz, E. Wear Coefficients Metals; Wear Control Handbook; The American Society of Mechanical Engineering: New York, NY, USA, 1980. [Google Scholar]
- Wang, J.; Zhang, G.; Fan, H.; Fan, Z.; Huang, Y. Effect of Off-Sized Balls on Contact Stiffness and Stress and Analysis of the Wear Prediction Model of Linear Rolling Guideways. Adv. Mech. Eng. 2021, 13, 168781402110344. [Google Scholar] [CrossRef]
- Zhang, J.; Peng, Y.; Liu, H.; Liu, Y. Analysis of Wear Mechanism and Influence Factors of Drum Segment of Hot Rolling Coiler. Chin. J. Mech. Eng. 2013, 26, 351–355. [Google Scholar] [CrossRef]
- Takabi, J.; Khonsari, M. Experimental Testing and Thermal Analysis of Ball Bearings. Tribol. Int. 2013, 60, 93–103. [Google Scholar] [CrossRef]
Figure 1.
RFCMS: (a) Model diagram and (b) dynamic model.

Figure 2.
Model diagram of LRG.

Figure 3.
Archard adhesion wear theoretical model.

Figure 4.
Thermal analysis of the LRG: (a) Steady-state and (b) transient thermal analysis.
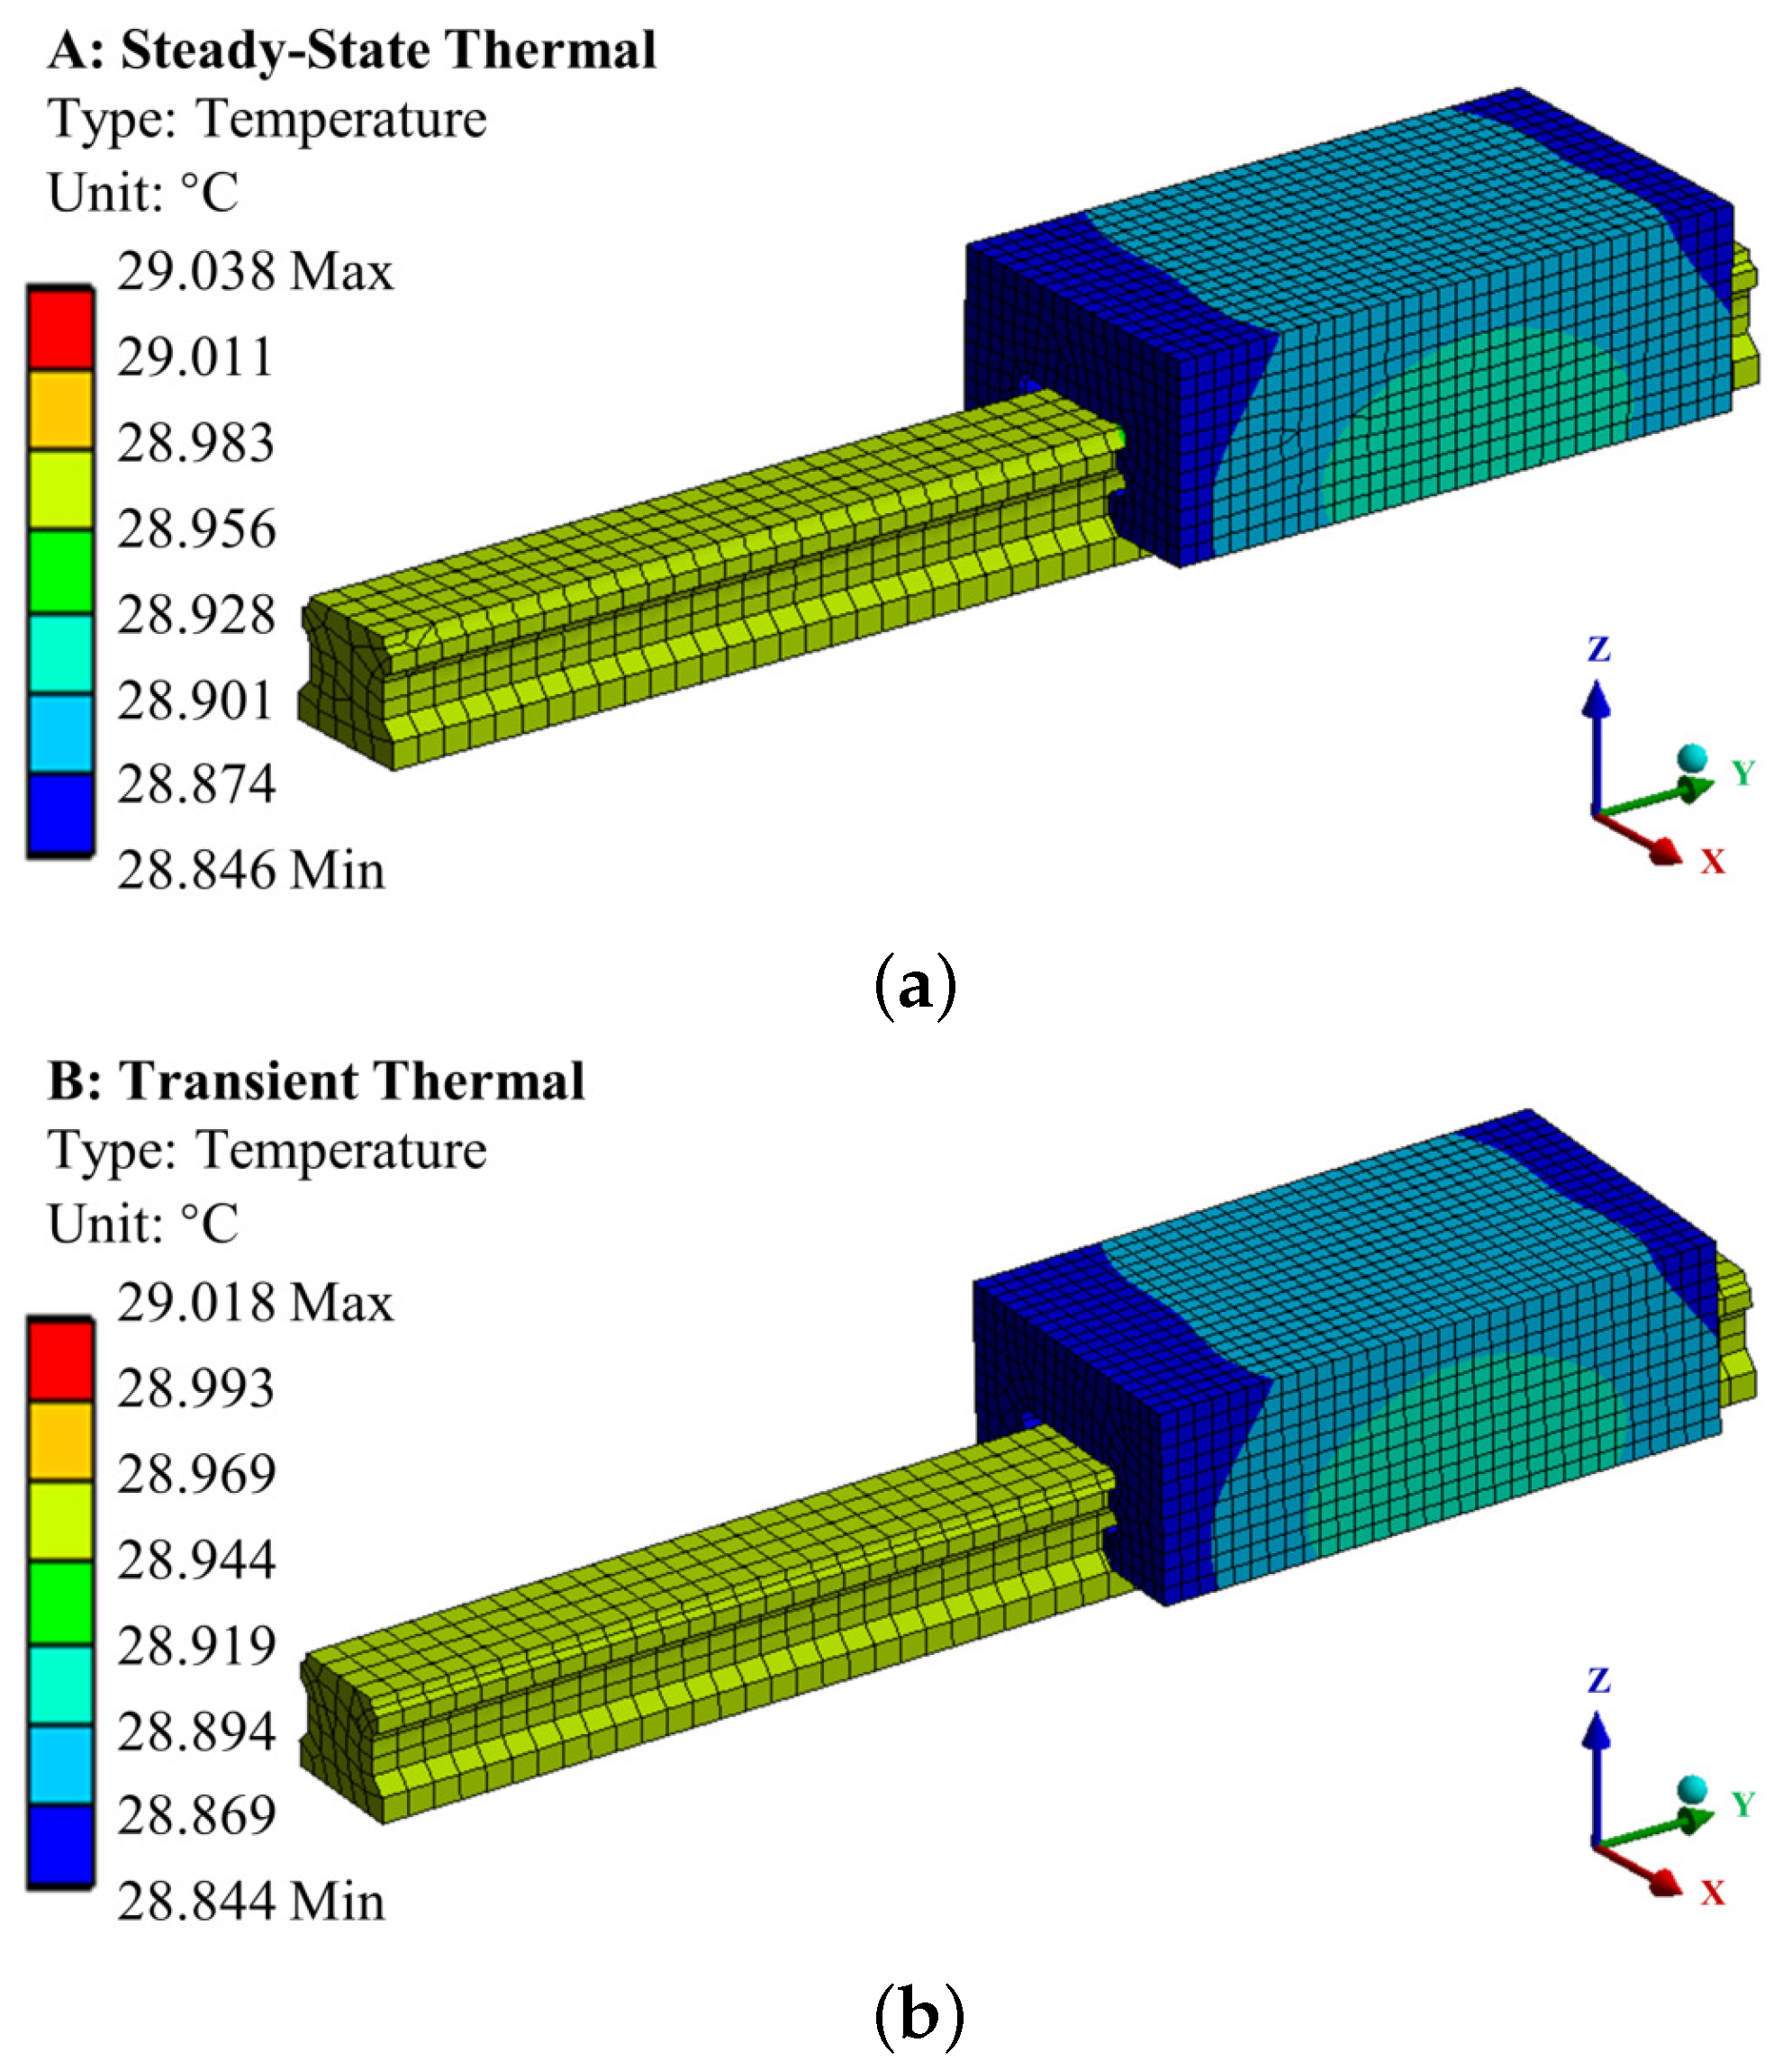
Figure 5.
Temperature increase curve.

Figure 6.
FEM of two types of motion stages: RMS (left) and RFCMS (right).
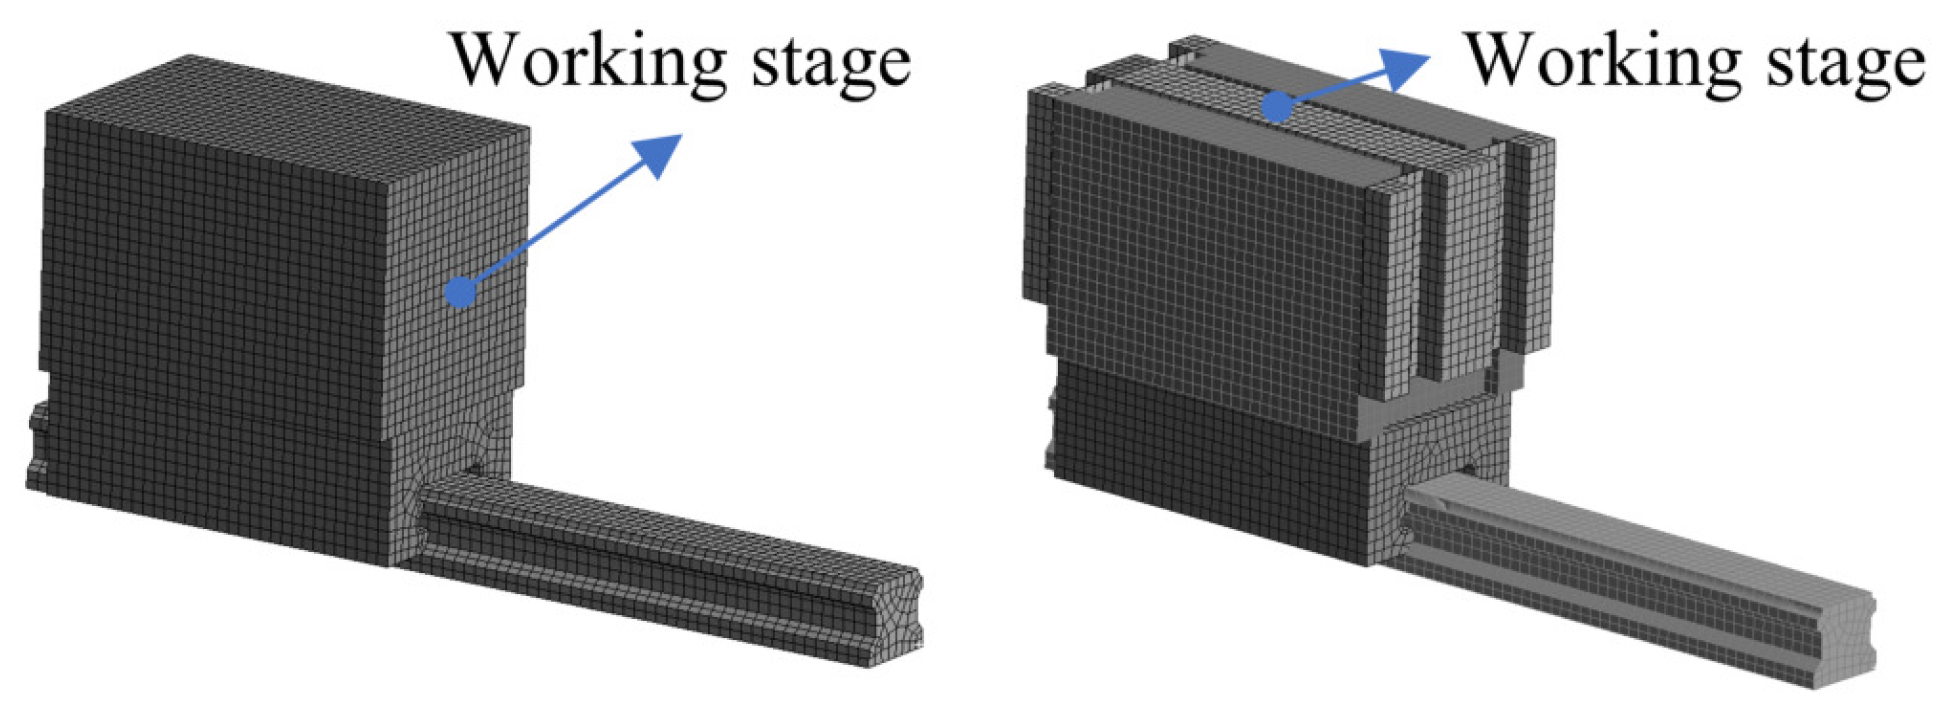
Figure 7.
Curve of wear volume over time.
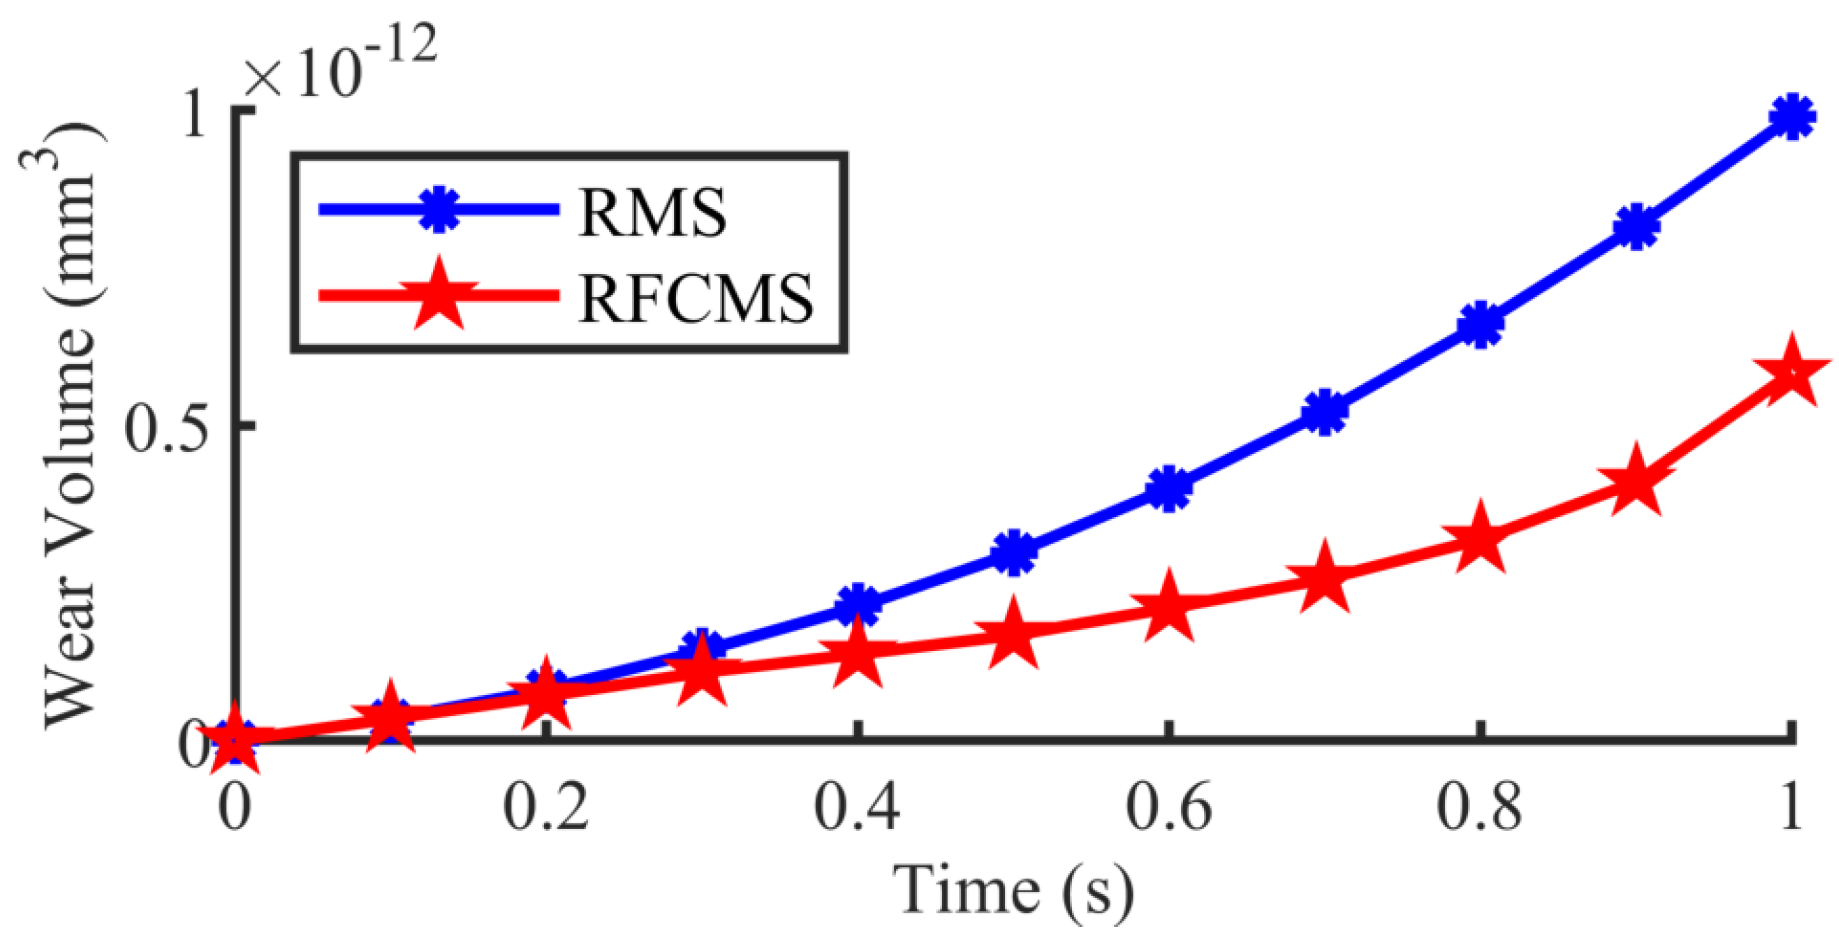
Figure 8.
A schematic of the test rig.
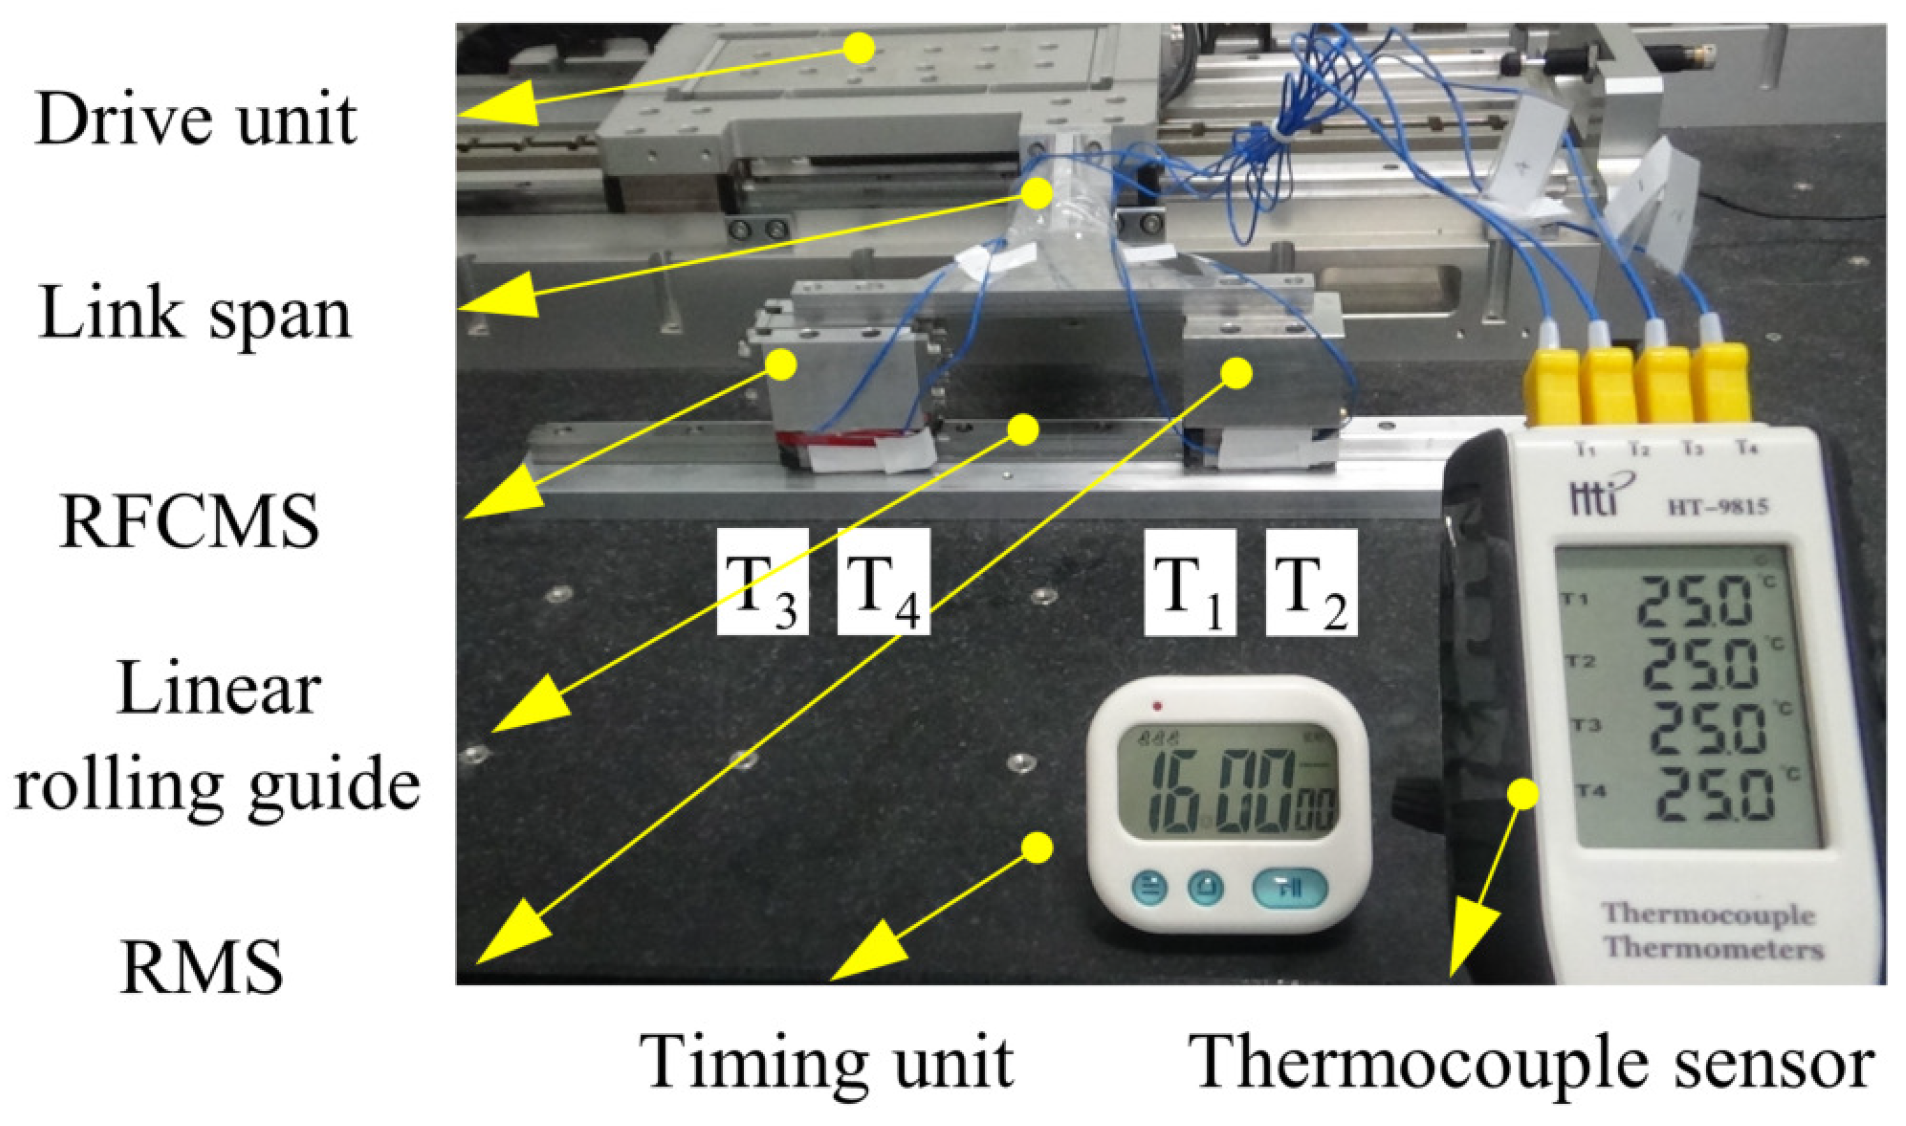
Figure 9.
Temperature change curve of LRG for different strokes.

Figure 10.
(a) Response surface plot for under different thicknesses and strokes; (b) Response surface plot for under different thicknesses and velocities; (c) Response surface plot for under different thicknesses and accelerations; (d) Response surface plot for under different strokes and velocities; (e) Response surface plot for under different strokes and accelerations; (f) Response surface plot for under different velocities and accelerations.
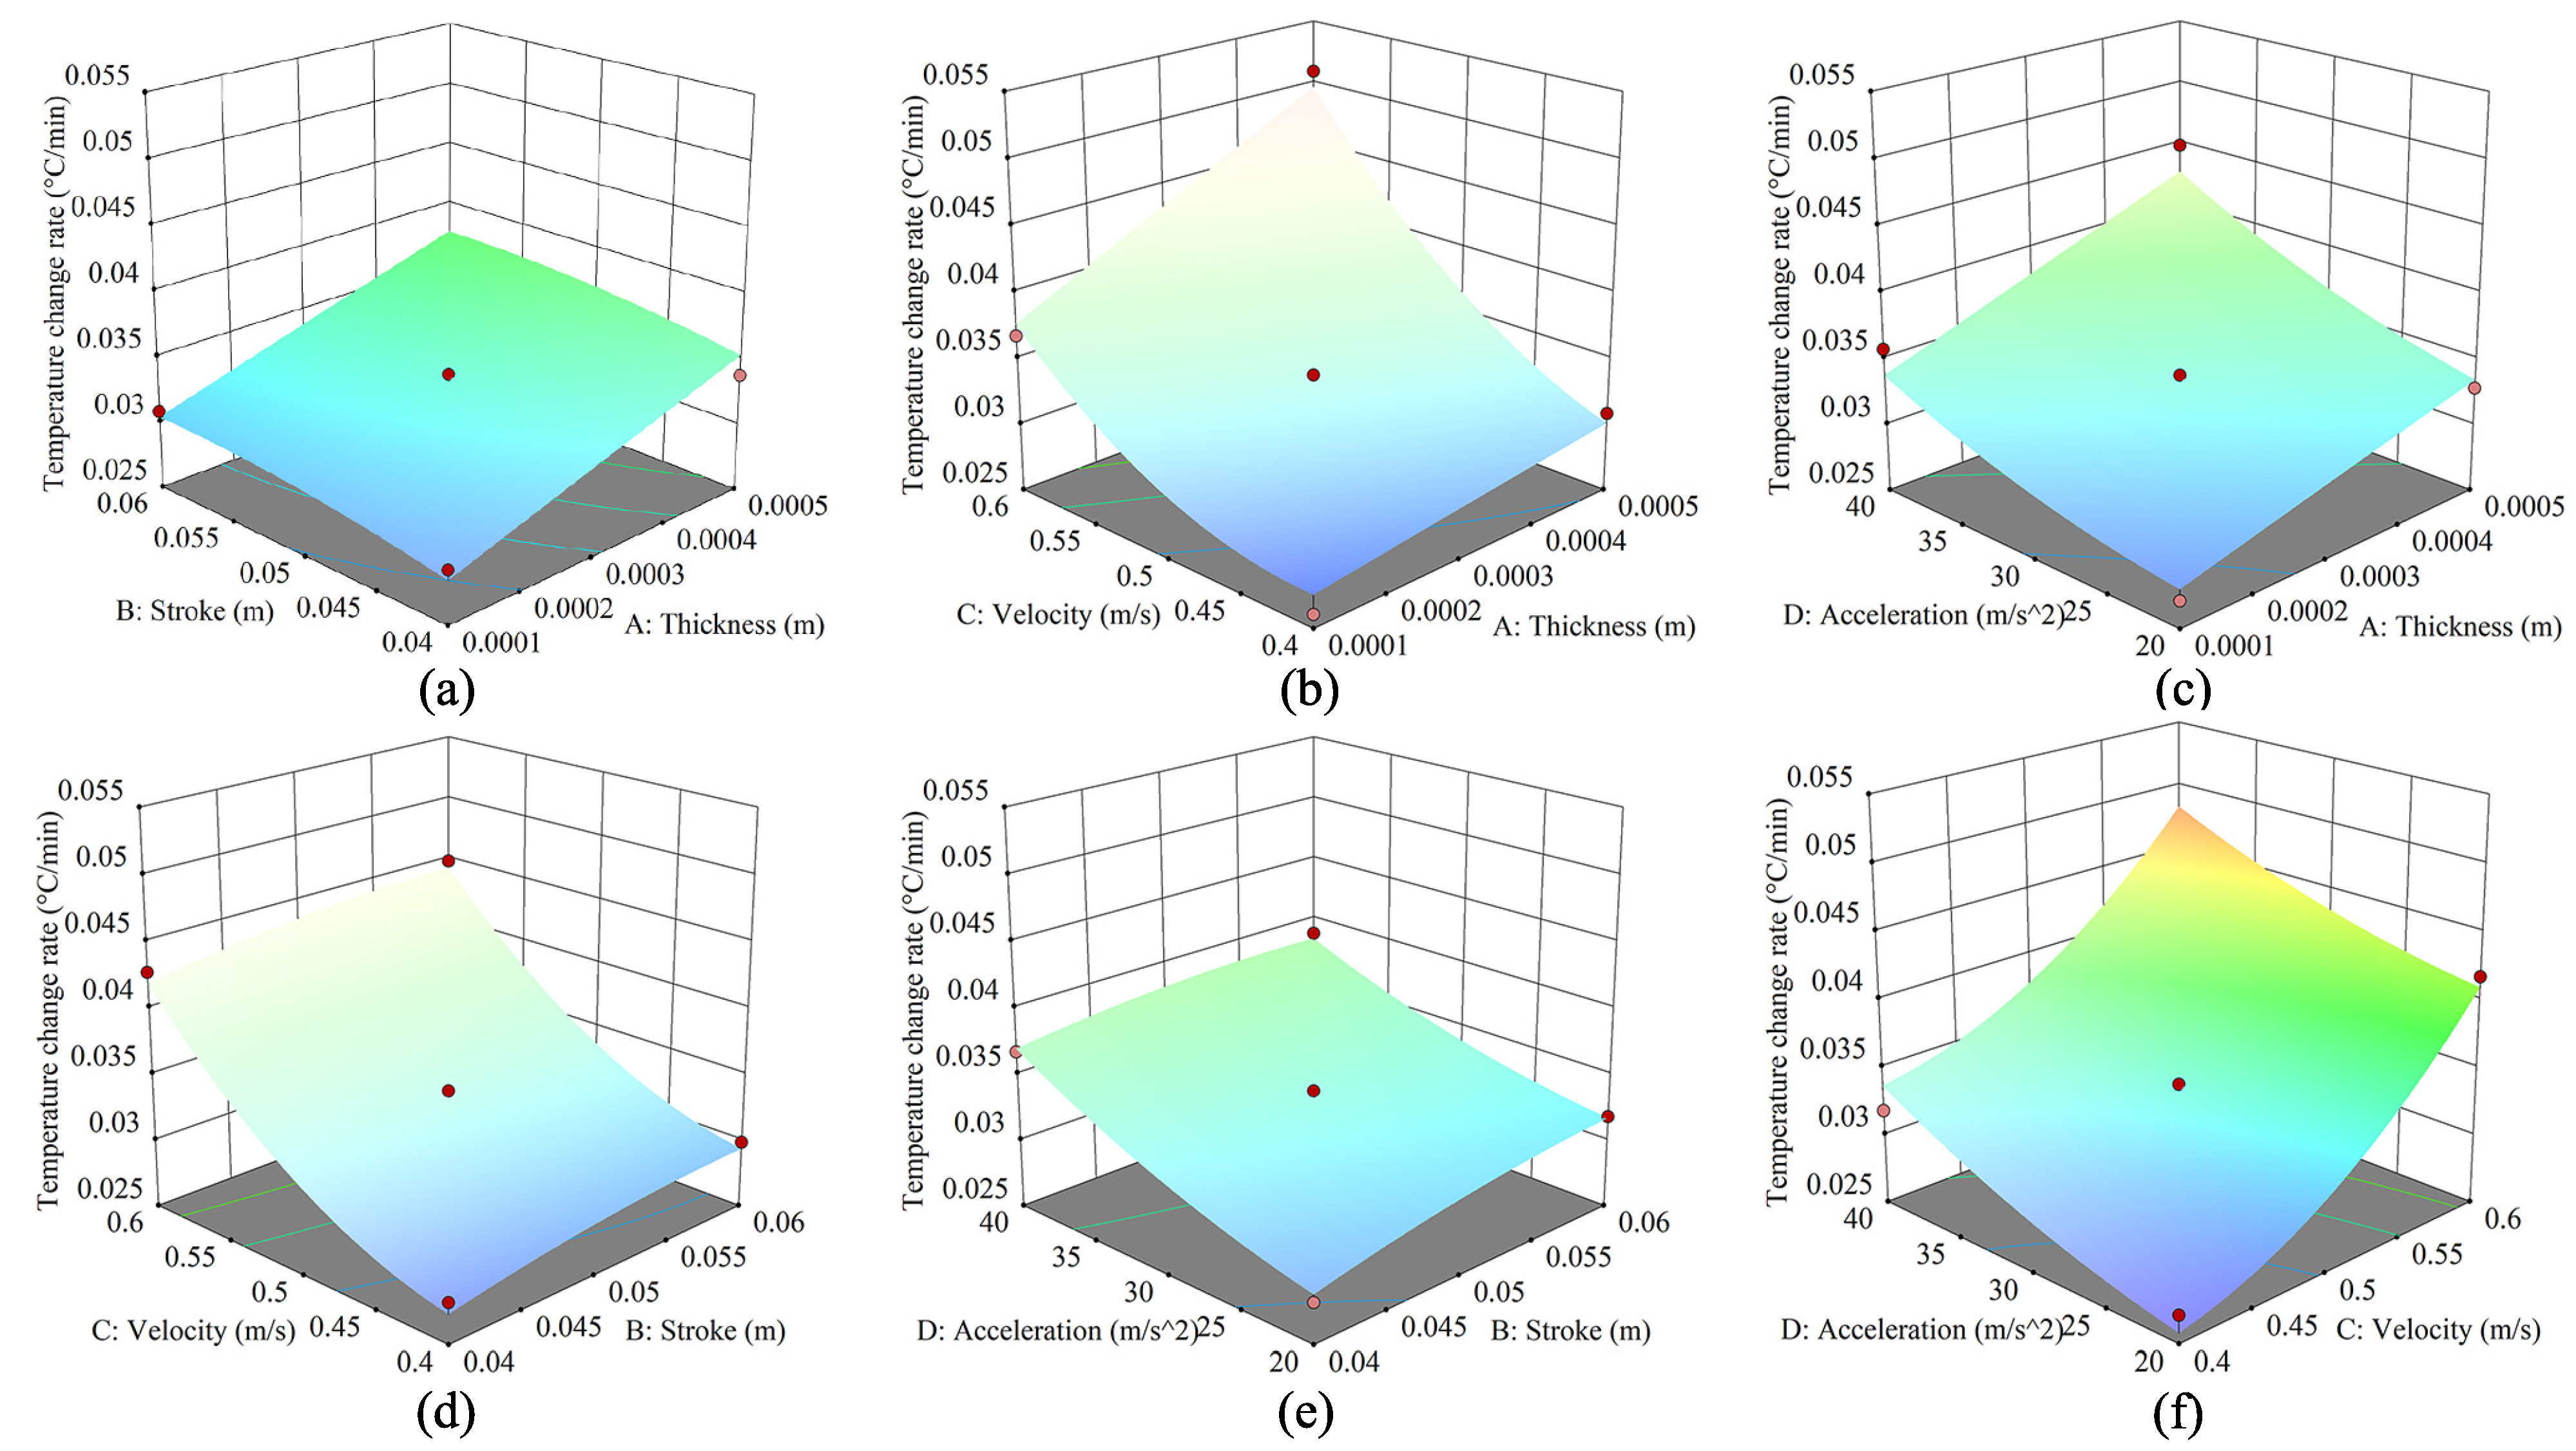
Figure 11.
Temperature increase verification curve.

Table 1.
Main parameters of LRG.
| Type | Parameter |
|---|---|
| Initial pre-load, F/(N) | 171 (low pre-load) |
| Ball radius, R/(mm) | 1.3497 |
| Raceway radius, R/(mm) | 1.4307 |
| Form factor, O | 0.52 |
| Total number of balls, N | 18 |
| Contact angle, /(°) | 45 |
Table 2.
Main parameters of materials.
| Type | Material | Density (kg/m) | Young’s Modulus (GPa) | Poisson’s Ratio | Thermal Conductivity W/(m·K) | Specific Heat Capacity J/(kg·K) |
|---|---|---|---|---|---|---|
| Rail/slide carriage | GCr15 | 7830 | 219 | 0.3 | 44 | 460 |
| Ball | 40Cr | 7870 | 211 | 0.277 | 44 | 460 |
| Stage | 6061-T6 Al | 2700 | 69 | 0.33 | 166.9 | 896 |
| Flexure Hinge | 65Mn | 7820 | 211 | 0.288 | 48 | 450 |
Table 3.
The design of response surface analysis.
| Levels | |||
|---|---|---|---|
| Variables | −1 | 0 | 1 |
| Thickness (m) | 0.0001 | 0.0003 | 0.0005 |
| Stroke (m) | 0.04 | 0.05 | 0.06 |
| Velocity (m/s) | 0.4 | 0.5 | 0.6 |
| Acceleration (m/s) | 20 | 30 | 40 |
Table 4.
Variables and levels in Box–Behnken and response values for TCR.
| Order | A (m) | B (m) | C (m/s) | D (m/s) | (°C/min) |
|---|---|---|---|---|---|
| 1 | 0.0003 | 0.04 | 0.4 | 30 | 0.028 |
| 2 | 0.0005 | 0.04 | 0.5 | 30 | 0.034 |
| 3 | 0.0003 | 0.05 | 0.6 | 40 | 0.046 |
| 4 | 0.0003 | 0.06 | 0.4 | 30 | 0.030 |
| 5 | 0.0003 | 0.05 | 0.4 | 40 | 0.032 |
| 6 | 0.0003 | 0.05 | 0.5 | 30 | 0.034 |
| 7 | 0.0005 | 0.05 | 0.6 | 30 | 0.051 |
| 8 | 0.0003 | 0.04 | 0.5 | 40 | 0.037 |
| 9 | 0.0003 | 0.04 | 0.6 | 30 | 0.043 |
| 10 | 0.0001 | 0.05 | 0.5 | 20 | 0.027 |
| 11 | 0.0001 | 0.05 | 0.4 | 30 | 0.026 |
| 12 | 0.0005 | 0.05 | 0.5 | 40 | 0.045 |
| 13 | 0.0001 | 0.04 | 0.5 | 30 | 0.029 |
| 14 | 0.0005 | 0.06 | 0.5 | 30 | 0.036 |
| 15 | 0.0003 | 0.06 | 0.5 | 40 | 0.039 |
| 16 | 0.0003 | 0.05 | 0.6 | 20 | 0.042 |
| 17 | 0.0003 | 0.05 | 0.5 | 30 | 0.033 |
| 18 | 0.0001 | 0.05 | 0.6 | 30 | 0.037 |
| 19 | 0.0005 | 0.05 | 0.4 | 30 | 0.031 |
| 20 | 0.0003 | 0.06 | 0.6 | 30 | 0.045 |
| 21 | 0.0003 | 0.05 | 0.5 | 30 | 0.034 |
| 22 | 0.0003 | 0.04 | 0.5 | 20 | 0.028 |
| 23 | 0.0005 | 0.05 | 0.5 | 20 | 0.033 |
| 24 | 0.0001 | 0.06 | 0.5 | 30 | 0.031 |
| 25 | 0.0003 | 0.06 | 0.5 | 20 | 0.032 |
| 26 | 0.0001 | 0.05 | 0.5 | 40 | 0.036 |
| 27 | 0.0003 | 0.05 | 0.4 | 20 | 0.027 |
Table 5.
Analysis of variance of ARE.
| Source | Sum of Squares | df | Mean Square | F-Value | p-Value |
|---|---|---|---|---|---|
| Model | 1.11 × 10 | 14 | 7.92 × 10 | 26.03 | <0.0001 |
| A | 1.61 × 10 | 1 | 1.61 × 10 | 53.04 | <0.0001 |
| B | 1.63 × 10 | 1 | 1.63 × 10 | 5.37 | 0.0390 |
| C | 6.75 × 10 | 1 | 6.75 × 10 | 221.92 | <0.0001 |
| D | 1.76 × 10 | 1 | 1.76 × 10 | 57.97 | <0.0001 |
| AB | 0.00 | 1 | 0.00 | 0.00 | 1.0000 |
| AC | 2.03 × 10 | 1 | 2.03 × 10 | 6.66 | 0.0241 |
| AD | 2.25 × 10 | 1 | 2.25 × 10 | 0.74 | 0.4066 |
| BC | 0.00 | 1 | 0.00 | 0.00 | 1.0000 |
| BD | 1.00 × 10 | 1 | 1.00 × 10 | 0.33 | 0.5770 |
| CD | 2.50 × 10 | 1 | 2.50 × 10 | 0.082 | 0.7792 |
| A | 9.26 × 10 | 1 | 9.26 × 10 | 3.04 × 10 | 0.9569 |
| B | 1.57 × 10 | 1 | 1.57 × 10 | 0.51 | 0.4869 |
| C | 3.91 × 10 | 1 | 3.91 × 10 | 12.86 | 0.0037 |
| D | 4.90 × 10 | 1 | 4.90 × 10 | 1.61 | 0.2285 |
| Residual | 3.65 × 10 | 12 | 3.04 × 10 | ||
| Lack of Fit | 3.58 × 10 | 10 | 3.58 × 10 | 10.75 | 0.0880 |
| Pure Error | 6.67 × 10 | 2 | 3.33 × 10 | ||
| Cor Total | 1.15 × 10 | 26 |
Note: p < 0.0100 means that this item had a significant effect on κ; 0.0100 ≤ p < 0.0500 means that this item had a less significant effect on κ; 0.0500 ≤ p < 0.1000 means that this item had no significant effect on κ; and p ≥ 0.1000 means that this item had an insignificant effect on κ.
Disclaimer/Publisher’s Note: The statements, opinions and data contained in all publications are solely those of the individual author(s) and contributor(s) and not of MDPI and/or the editor(s). MDPI and/or the editor(s) disclaim responsibility for any injury to people or property resulting from any ideas, methods, instructions or products referred to in the content. |
© 2023 by the authors. Licensee MDPI, Basel, Switzerland. This article is an open access article distributed under the terms and conditions of the Creative Commons Attribution (CC BY) license (https://creativecommons.org/licenses/by/4.0/).
Share and Cite
MDPI and ACS Style
Su, L.; Zhang, C.; Yang, Z. Combined Thermal and Wear Analysis of Linear Rolling Guide Subjected to Rigid–Flexible Coupling Motion Stage. Machines 2023, 11, 358. https://doi.org/10.3390/machines11030358
AMA Style
Su L, Zhang C, Yang Z. Combined Thermal and Wear Analysis of Linear Rolling Guide Subjected to Rigid–Flexible Coupling Motion Stage. Machines. 2023; 11(3):358. https://doi.org/10.3390/machines11030358
Chicago/Turabian StyleSu, Liyun, Chunheng Zhang, and Zhijun Yang. 2023. "Combined Thermal and Wear Analysis of Linear Rolling Guide Subjected to Rigid–Flexible Coupling Motion Stage" Machines 11, no. 3: 358. https://doi.org/10.3390/machines11030358
Note that from the first issue of 2016, this journal uses article numbers instead of page numbers. See further details here.